
Sex Is the Main Determinant of Levodopa Clinical Pharmacokinetics: Evidence from a Large Series of Levodopa Therapeutic Monitoring
Abstract
Background:
Different studies, mostly with limited cohorts, have suggested the effects of patients’ characteristics on levodopa (LD) pharmacokinetics.
Objective:
We primarily aimed at investigating in a large population the relationship between patients’ features and LD kinetic variables, to assess the main demographic and clinical predictors of LD clinical pharmacokinetics.
Methods:
The study was retrospective, based on data collected from subjects with parkinsonism on chronic LD undergoing LD therapeutic monitoring (TM). LD TM includes serial quantitative motor tests and blood samples to measure plasma drug concentrations after each subject’s chronically taken first-morning LD dose intake.
Results:
Five hundred patients, 308 males (61.6%), mean (SD) age of 65 (10.1) years were included. Parkinsonian symptoms and LD therapy lasted 5.5 (4.5) and 3.4 (3.9) years, respectively. MDS-UPDRS part III “off” score was 28.8 (15.2). LD dose was 348.2 (187.1) mg/day. From multiple linear regression analysis, test dose, sex, type of LD decarboxylase inhibitor, weight and MDS-UPDRS part III score were linear predictors of both LD peak plasma concentration (Cmax) (R2 = 0.52) and area under the 3-h plasma concentration-time curve (AUC) (R2 = 0.71), while age was a further predictor only for AUC. Besides test dose, sex was the strongest independent contributing variable to LD AUC, which resulted 27% higher in females compared to males.
Conclusion:
This is the largest collection of data on the relationship between demographic and clinical-therapeutic variables and LD kinetics in patients with parkinsonian symptoms. As a main clinically practical finding, women might require a 25% reduced weight-normalized LD dose compared with men to achieve the same LD bioavailability.
INTRODUCTION
Since its introduction in 1960, levodopa (LD) remains the most effective symptomatic treatment available for Parkinson’s disease (PD). The drug has complex pharmacokinetics, resulting in wide fluctuations in plasma concentrations after each dose intake which are matched, as the disease progresses, to swings in the therapeutic response (“wearing-off” phenomena). In the more advanced stages of PD, it is possible to observe the emergence of complications at low LD plasma concentrations and the appearance of dyskinesias related to both high LD “peak” and low, “subtherapeutic” plasma levels. Recognition of these complicated response patterns can be difficult on a clinical basis alone and simultaneous monitoring of LD concentration-effect relationship may prove useful to disclose the underlying pattern [1].
For many years we have developed and implemented protocols for kinetic-dynamic therapeutic monitoring (TM) of LD, based on each subject’s chronically taken first-morning LD dose standardized intake and the performance of serial fixed-time quantitative motor tests coupled with blood samples to measure plasma drug concentrations [2,3]. This subacute LD challenge test is not for diagnostic purposes and is never applied to LD naïve subjects. Through the assessment of both kinetic (LD time to peak and peak plasma concentration) and dynamic variables (latency to onset, duration, and extent of motor response), LD TM aims to individualize drug treatment from the early disease stages in PD patients [2] and modify it according to disease progression, searching for the minimum necessary drug dosing with time [4].
An integral part of LD TM is the contextual standardized collection of a series of demographic, clinical, and therapeutic variables and lifestyles (Supplementary Table 1). According to different studies, mostly based on limited patients’ cohorts, some of these variables can affect LD pharmacokinetics [5–11] and the related response [11–14].
The main aim of this work was to investigate the relationship between LD pharmacokinetic variables and patients’ demographic, clinical-therapeutic features drawing from a large sample of subjects with parkinsonism undergoing LD TM. The secondary aim was to assess in the same patients the potential relationship between LD pharmacokinetic variables and motor/dyskinetic response. The final goal was to predict the main demographic and clinical determinants of LD clinical pharmacokinetics, which may assist clinicians to optimize drug dosing in individual patients.
MATERIALS AND METHODS
Patients
The study design was retrospective, analyzing data prospectively collected as part of LD TM. The protocol was approved by the Ethics Committee of the Bologna Local Health Trust, CE number 137-2021-OSS-AUSLBO. Subjects’ informed consent was not required for this type of study. The analysis involved both outpatients and inpatients with parkinsonian symptoms, not limited to PD but possibly including also neurodegenerative atypical parkinsonisms (APs) or vascular parkinsonism, receiving chronic LD therapy who underwent LD TM between January 14, 2015 to December 30, 2020.
Inclusion criteria were: LD chronic therapy for at least 3 months, using standard-release formulations in combination with dopa decarboxylase inhibitors (DCIs) benserazide (BZ) or carbidopa (CD), at the same 4 : 1 ratio; no change in dosage of LD and concomitant antiparkinsonian drugs over the preceding week.
Exclusion criteria were: LD naïve subjects; treatment with LD/CD formulations at 10 : 1 ratio; treatment with LD extended-release formulations; concomitant use of catechol-O-methyltransferase (COMT) inhibitors (entacapone, opicapone, tolcapone); enterally administered levodopa/carbidopa gel therapy; evidence of measurable plasma LD concentrations as early as T0, before LD test dose intake.
Levodopa kinetic-dynamic therapeutic monitoring protocol
The protocol of LD TM is depicted in Supplementary Table 2. After an overnight fast and a 12-h washout of LD and any concomitant antiparkinsonian drugs, patients receive their chronically taken first morning dose of LD/BZ or LD/CD together with 100 mL tap water. Blood venous samples (4 mL) for LD plasma concentration analysis are drawn immediately before the LD dose, at 15-min intervals for the first 90 min, then half-hourly up to 3 h after dosing. Blood specimens are transferred into heparinized tubes (16 IU heparin/mL blood) and centrifuged at 1700 x g for 10 min at 4°C. Plasma is separated and stored at –80°C until analysis of LD (routinely within two weeks) by high-performance liquid chromatography with coulometric detection [15].
At the same time patients’ motor response to the LD test dose is assessed by the alternate index finger tapping test using a computerized touch screen system (mHealth Technologies srl, Bologna, Italy) [3] and the Timed Up and Go test (TUG) [16]. Possible LD induced dyskinesias (LIDs) are rated simultaneously by the Clinical Dyskinesia Rating Scale (CDRS) [17].
All patients are clinically assessed before (“off state”) and after 60–90 min (“on state”) LD test dose through Hoehn & Yahr [18] and Movement Disorder Society Unified Parkinson’s Disease Rating Scale (MDS-UPDRS part III) [19]. At the same time systolic and diastolic blood pressure and heart rate are evaluated in clinostatic position and at minute 3 of standing. The same standard low protein breakfast (tea or barley coffee with biscuits) is eaten by all patients 75–90 min after LD dosing.
A comprehensive list of demographic, clinical, therapeutic, and lifestyle information is collected as an integral part of LD TM, reported in Supplementary Table 1. LD equivalent daily dose was calculated according to Schade et al. [20]. Clinical diagnosis can be still undefined at the moment of LD TM and a “suspected diagnosis” is generally registered. Most patients included in the present study were also followed up according to clinical practice with routine evaluations every 6–12 months at our Institute. Diagnoses for each patient were revaluated for the present analysis based on the information available at last visit according to the international diagnostic criteria for PD [21] or for APs: multiple system atrophy (MSA) [22], dementia with Lewy bodies (DLB) [23], progressive supranuclear palsy (PSP) [24], corticobasal degeneration (CBD) [25], or for type 2 insidious onset vascular parkinsonism [26]. All diagnoses were independently confirmed by three neurologists expert in movement disorders.
LD kinetic variable determination
LD peak plasma concentration (Cmax) and time to peak (tmax) are the observed values. The area under the 3-h plasma concentration-time curve (AUC) is calculated according to the linear trapezoidal rule by SigmaPlot 12.5 software (Systat Software, San Jose, CA, USA).
Based on previous reported data, fasting LD absorption is expected rapid, with tmax ranging from 15 to 60 min in the majority of subjects [27, 28]. Taking into account our further experience [2], we set up the cut-off for a “rapid” LD fasting oral absorption at tmax values≤45 min.
LD dynamic variable determination
Latency to onset of motor response is calculated as the time taken for tapping frequency to increase and/or TUG total time to decrease≥15% of baseline values [29]; duration of motor response is calculated as the time from onset of response to the return within 15% of baseline values. A clinically significant motor response pattern is defined as a sustained (≥30 min) increase in tapping frequency and/or decrease in TUG total duration≥15% over baseline values; a clinically non-significant motor response is defined by a variation in tapping frequency and/or TUG total duration <15% of baseline values [30]. The cut-off for a timely onset of motor effect is set at≤45 min [2]. The subacute LD motor response is defined “fluctuating” when return to <15% of baseline values is observed within 180 min, i.e., the maximum length of LD TM monitoring, and “stable” when no return is observed within 180 min.
Statistical analysis
Patients’ characteristics were summarized by mean and standard deviation (SD) or median and interquartile range (IQR) for the continuous variables, and with absolute (n) and relative (%) frequency for categorical variables. Normality of continuous variables distribution was checked using the Skewness-Kurtosis test. Continuous variables were compared by Mann-Whitney U test or Student’s t test, while categorical variables by Chi-square test.
Distribution of milligrams of LD per kg, Cmax and AUC range for administrated test dose were graphically represented by box plot. Linear association between milligrams of LD per kg and pharmacokinetic parameters was expressed by Spearman correlation coefficients.
Univariate linear regression models were performed to quantify the relationship between each pharmacokinetic parameter (dependent variable) and matched patients’ characteristics (independent factors); subsequently, factors found to be clinically relevant and significant in the univariate analysis were entered into a multiple linear regression model. Value assumed by each dependent variable was predicted through the best linear combination of independent variables. All Ordinary Least Square regression assumptions were checked.
Analyses were performed by means of STATA SE version 16 software (Stata Corporation LLC, College Station, TX, USA).
RESULTS
Patients’ characteristics
LD TM reports of five hundred patients, 308 males (61.6%) and 192 females, mean (SD) age of 65 (10.1) years were eligible for the analysis according to inclusion and exclusion criteria. Complete clinical and demographic data of the patients are summarized in Table 1. Mean (SD) parkinsonian symptom and LD therapy duration were 5.5 (4.5) years and 3.4 (3.9) years, respectively. Severity of symptoms in the “off” state was 2.2 (0.8) on the H&Y scale and 28.8 (15.2) on the MDS-UPDRS part III. Mean (SD) LD dose was 348.2 (187.1) mg/day, combined with BZ in 75.8% of patients. From patients’ clinical diagnosis revaluation, 373 subjects (75%) were classified as PD and 121 (25%) as APs. No vascular parkinsonism was detected. Six subjects had missing diagnoses. The two groups did not differ for the majority of collected demographic and clinical variables, with the exception of age and severity of symptoms which resulted significantly higher in AP patients (Supplementary Table 3).
Table 1
Demographic, clinical, therapeutic variables, and lifestyles of enrolled patients
| Variables | All patients (n = 500) | N° valid (%) |
| Age (y) | 66 (58 –73) | 500 (100) |
| Sex | 500 (100) | |
| Male –n° (%) | 308 (61.6) | |
| Female –n° (%) | 192 (38.4) | |
| Weight (kg) | 73 (63 –82) | 500 (100) |
| Height (cm) | 170 (162 –175) | 498 (99.6) |
| BMI (kg/cm2) | 25 (23 –28) | 498 (99.6) |
| Duration of parkinsonism (y) | 4 (3 –7) | 496 (99.2) |
| Duration of LD treatment (y) | 2 (1 –5) | 464 (92.8) |
| Clinical diagnosis | 494 (98.8) | |
| Parkinson’s Disease –n° (%) | 373 (75.5) | |
| Atypical Parkinsonism –n° (%) | 121 (24.5) | |
| LEDD (mg/kg/day) | 369 (200 –560) | 497 (99.4) |
| H&Y scale (“off”) | 2 (2 –2.5) | 424 (84.8) |
| MDS-UPDRS part III (“off”) | 27 (17 –38) | 492 (98.4) |
| MDS-UPDRS part III (“on”) | 19 (11 –30) | 494 (98.8) |
| Decarboxylase inhibitor | 500 (100) | |
| Carbidopa –n° (%) | 121 (24.2) | |
| Benserazide –n° (%) | 379 (75.8) | |
| Antiparkinsonian cotherapies | 500 (100) | |
| Dopamine agonists –n° (%) | 216 (43.2) | |
| MAO-B inhibitors –n° (%) | 75 (15.0) | |
| Amantadine –n° (%) | 27 (5.4) | |
| Other cotherapies | 500 (100%) | |
| Antihypertensive –n° (%) | 217 (43.4) | |
| Heart disease –n° (%) | 100 (20.0) | |
| Cholesterol lowering –n° (%) | 83 (16.6) | |
| Gastrointestinal disorders –n° (%) | 61 (12.2) | |
| Antidiabetic –n° (%) | 30 (6.0) | |
| Hypothyroidism –n° (%) | 29 (5.8) | |
| Antidepressant –n° (%) | 155 (31.0) | |
| Antipsychotic –n° (%) | 15 (3.0) | |
| Prostatic hypertrophy –n° (%) | 69 (13.8) | |
| Coffee consumption –n° (%) | 340 (69.1) | 492 (98.4) |
| Alcohol consumption –n° (%) | 204 (41.7) | 489 (97.8) |
| Cigarette smoke consumption –n° (%) | 60 (12.2) | 493 (98.6) |
Values are expressed as median (interquartiles). BMI, body mass index; LD, levodopa; LEDD, levodopa equivalent daily dose; H&Y, Hoehn & Yahr; MDS UPDRS, Moveme-nt Disorder Society Unified Parkinson’s Disease Rating Scale; MAO-B, monoamino oxidase-B.
LD kinetic variables
With regard to the LD test dose, 50 mg were administered to 11 patients (2.2%), 100 mg to 413 (82.6%), 150 mg to 33 (6.6%), and 200 mg to 43 (8.6%). The relationship between each administered test dose, expressed in mg, and matched mg/kg dose, Cmax, AUC and tmax values is depicted in Fig. 1; reference median values (IQR) for each variable by different LD doses are reported in Supplementary Table 4.
Fig. 1
Box plots of levodopa: A) peak plasma concentration; B) area under the 3-hour plasma concentration-time curve; C) time to peak plasma concentration; D) test dose, in milligram per kilogram, by different test doses, in milligram. Box plots depict the range between the 25th and 75th percentiles of the data. The horizontal line marks the median value; capped bars indicate 10th–90th percentiles. Black circles represent outlying values. The number of patients for each test dose is reported in brackets.
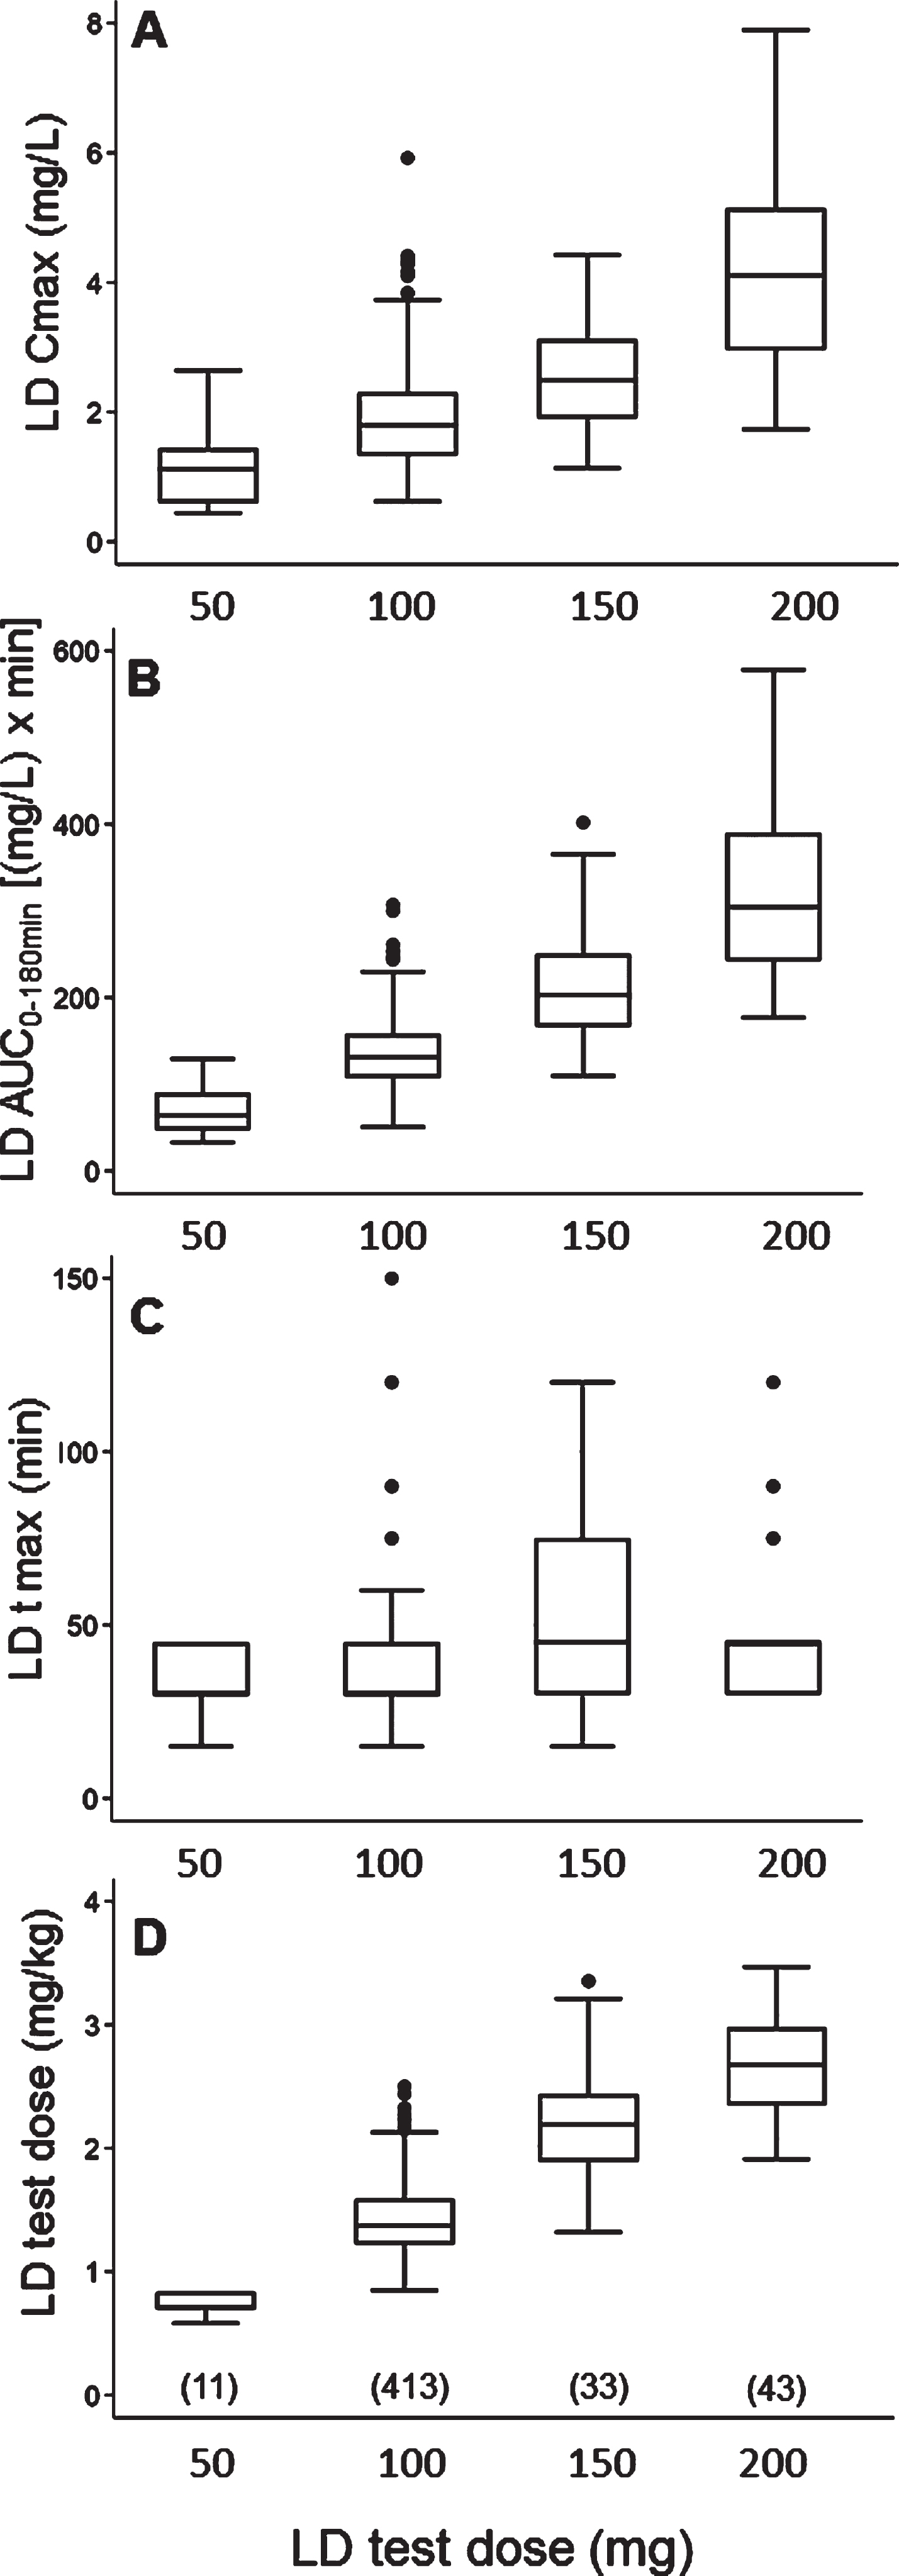
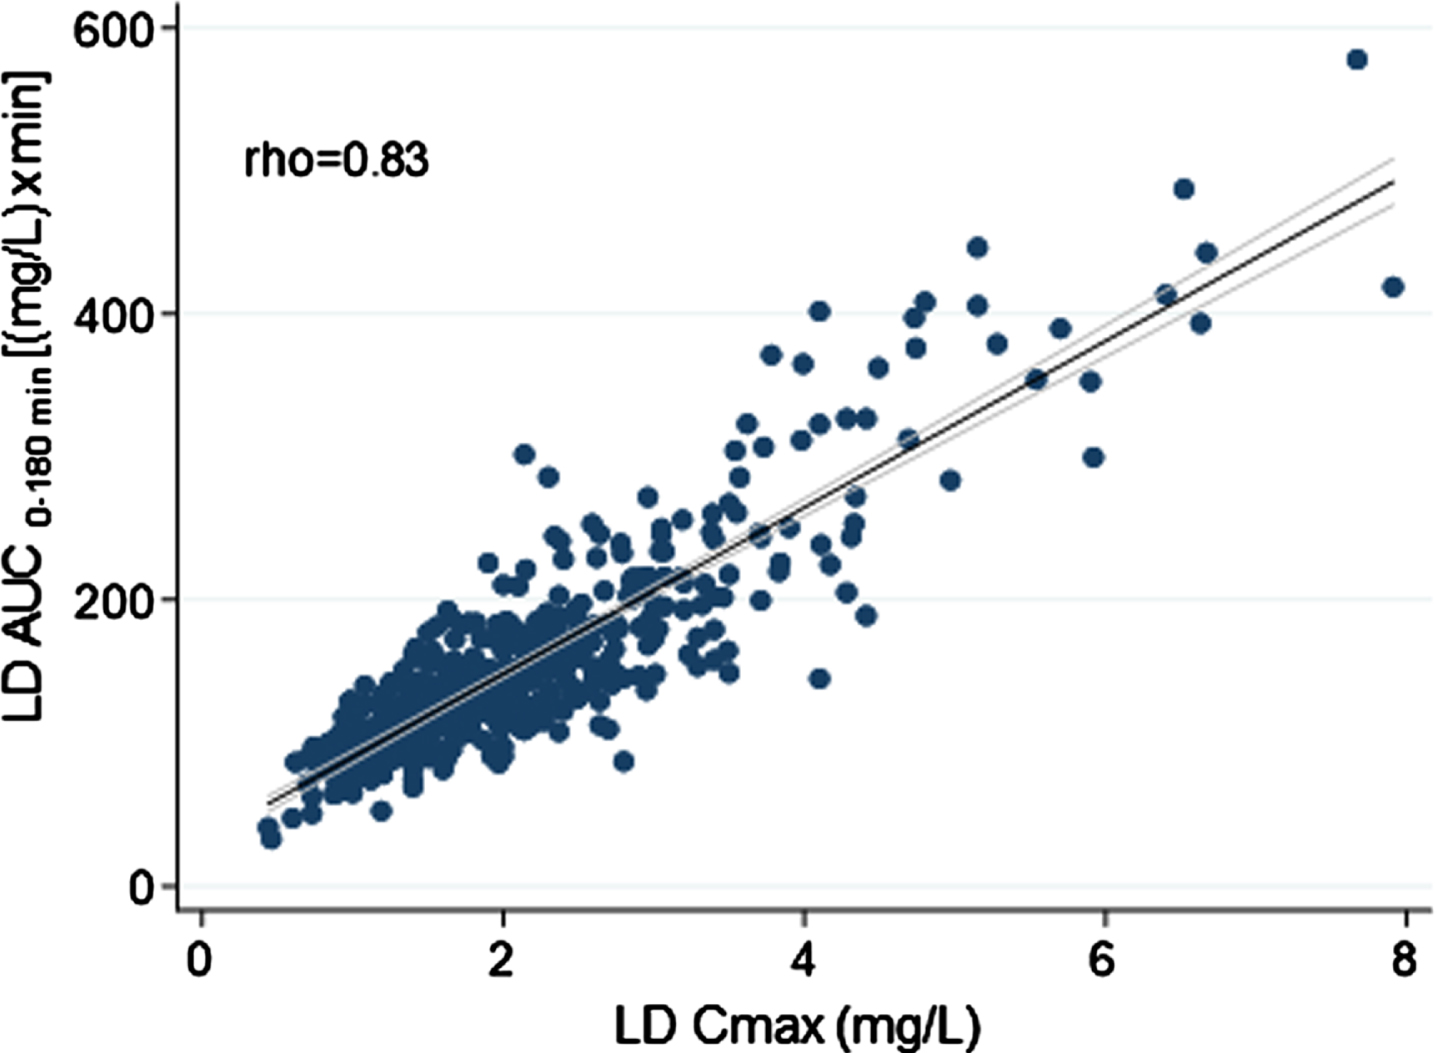
Overall, weight-normalized LD test dose positively correlated with both AUC (rho = 0.71) and Cmax (rho = 0.52) (Fig. 2). No significant correlation emerged between LD test dose (mg/kg) and tmax (rho < 0.30). An optimal positive correlation between Cmax and AUC was also found (rho = 0.83) (Fig. 3). A negative, weak correlation was apparent between LD Cmax and tmax (rho = –0.35). No correlation was found between AUC and tmax (rho < 0.30).
Fig. 2
Scatter plots of the relationship between levodopa test dose in milligram per kilogram and: A) levodopa area under the 3-h plasma concentration-time curve; B) levodopa peak plasma concentration. The bold black line indicates linear prediction; gray lines indicate 95% confidence intervals.
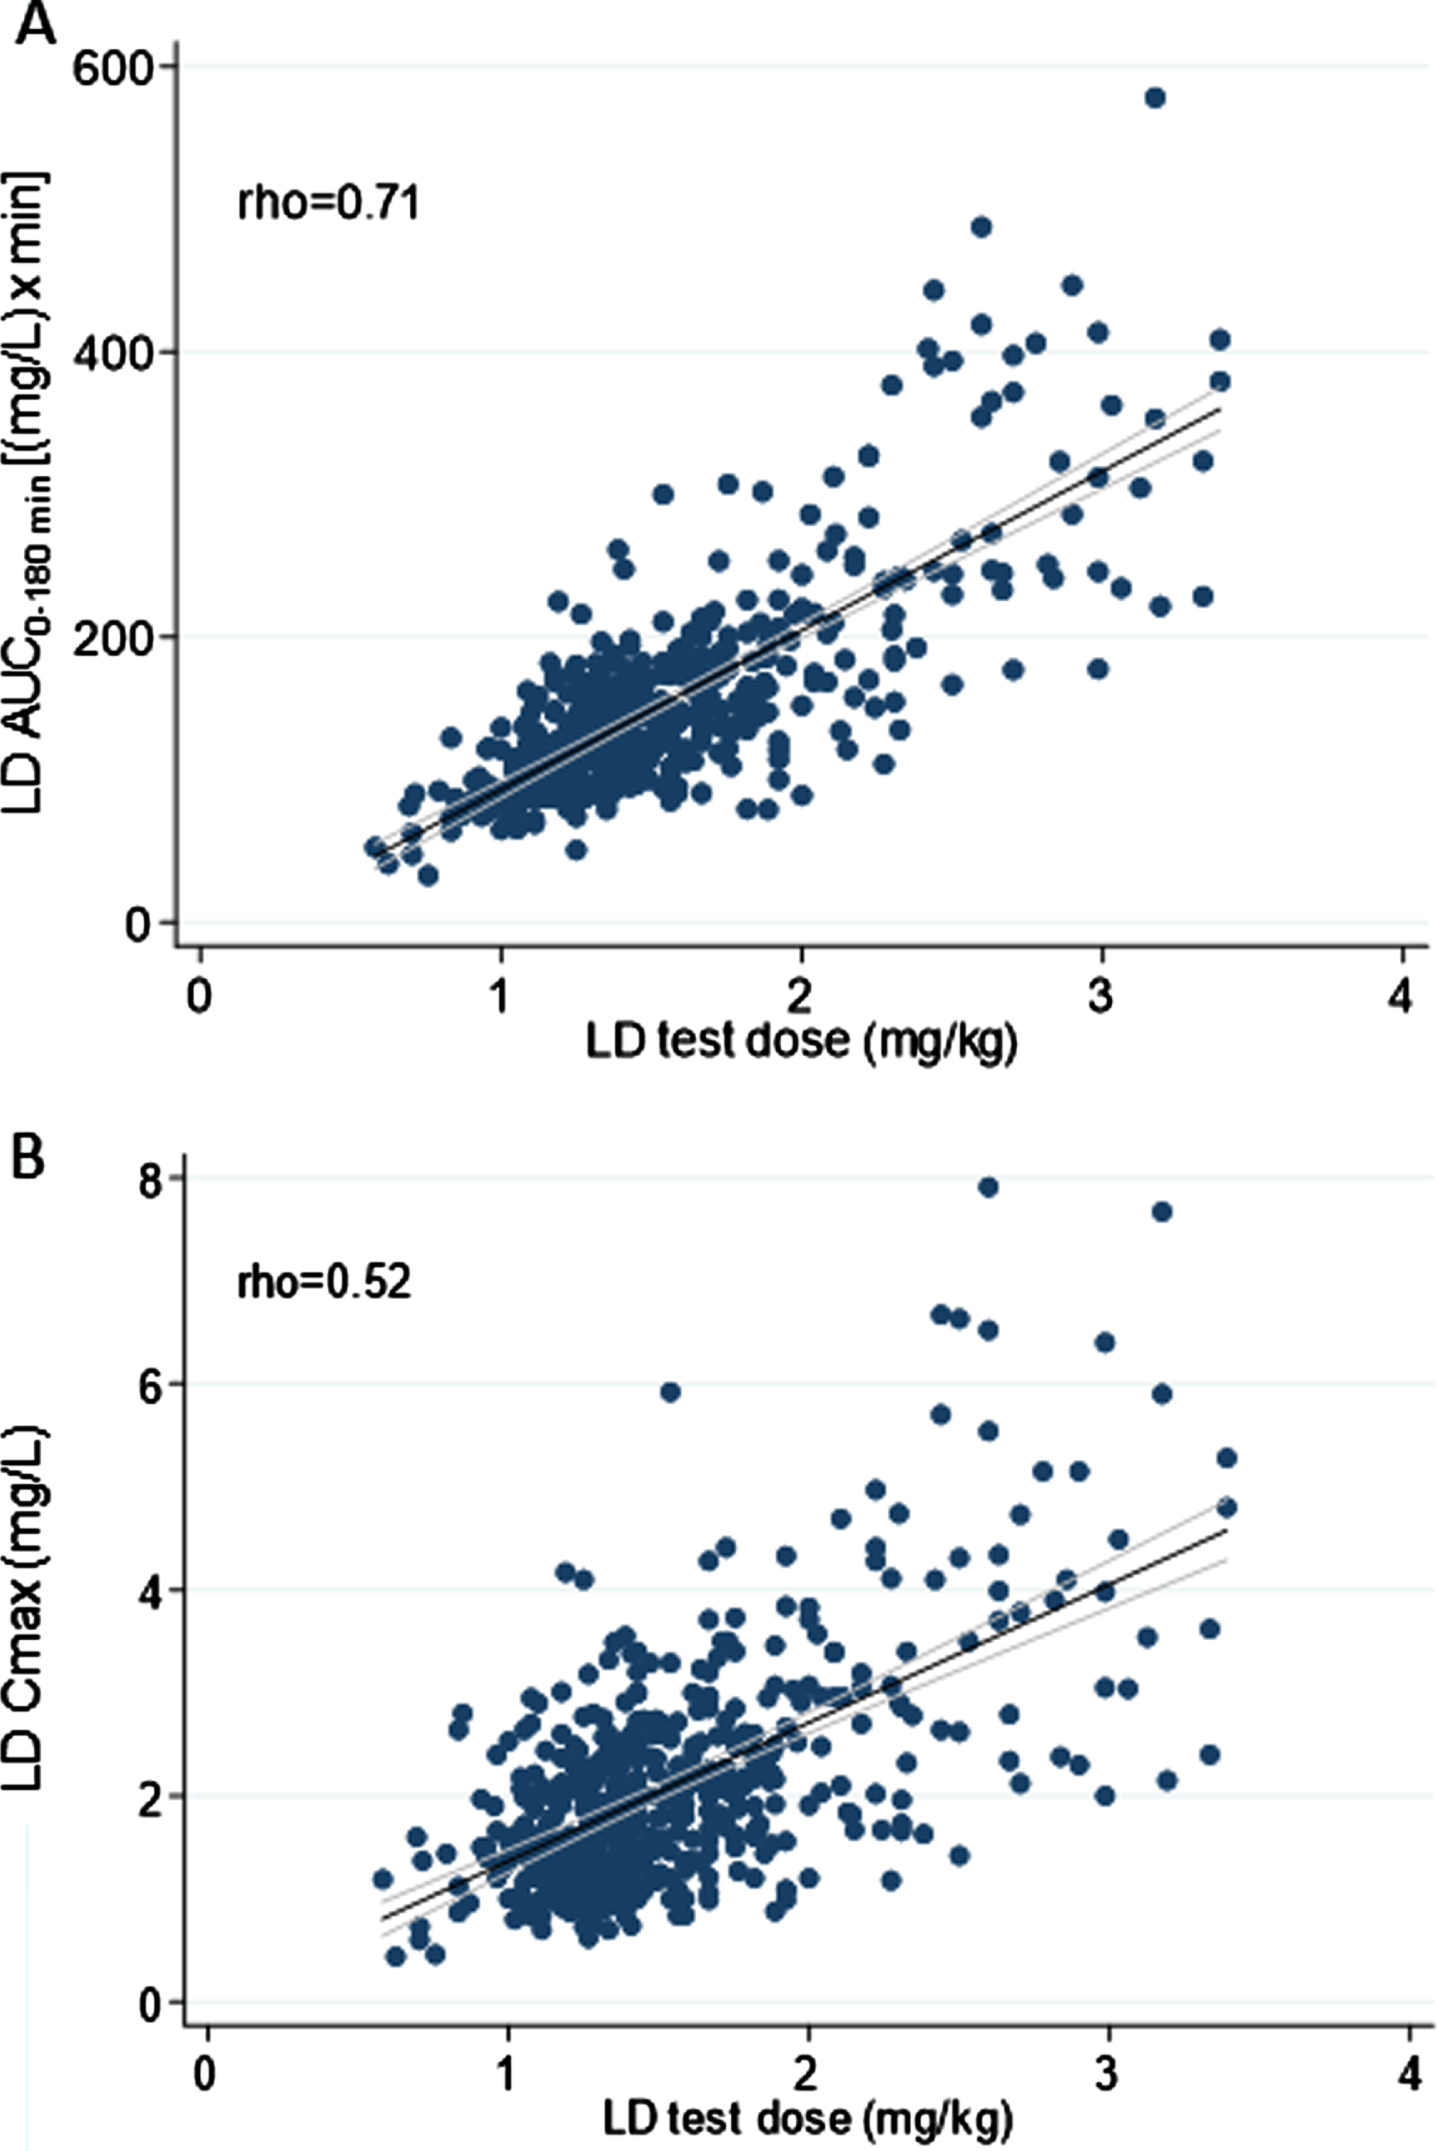
Fig. 3
Scatter plots of the relationship between levodopa peak plasma concentration and matched area under the 3-hour plasma concentration-time curve. The bold black line indicates linear prediction; gray lines indicate 95% confidence intervals.
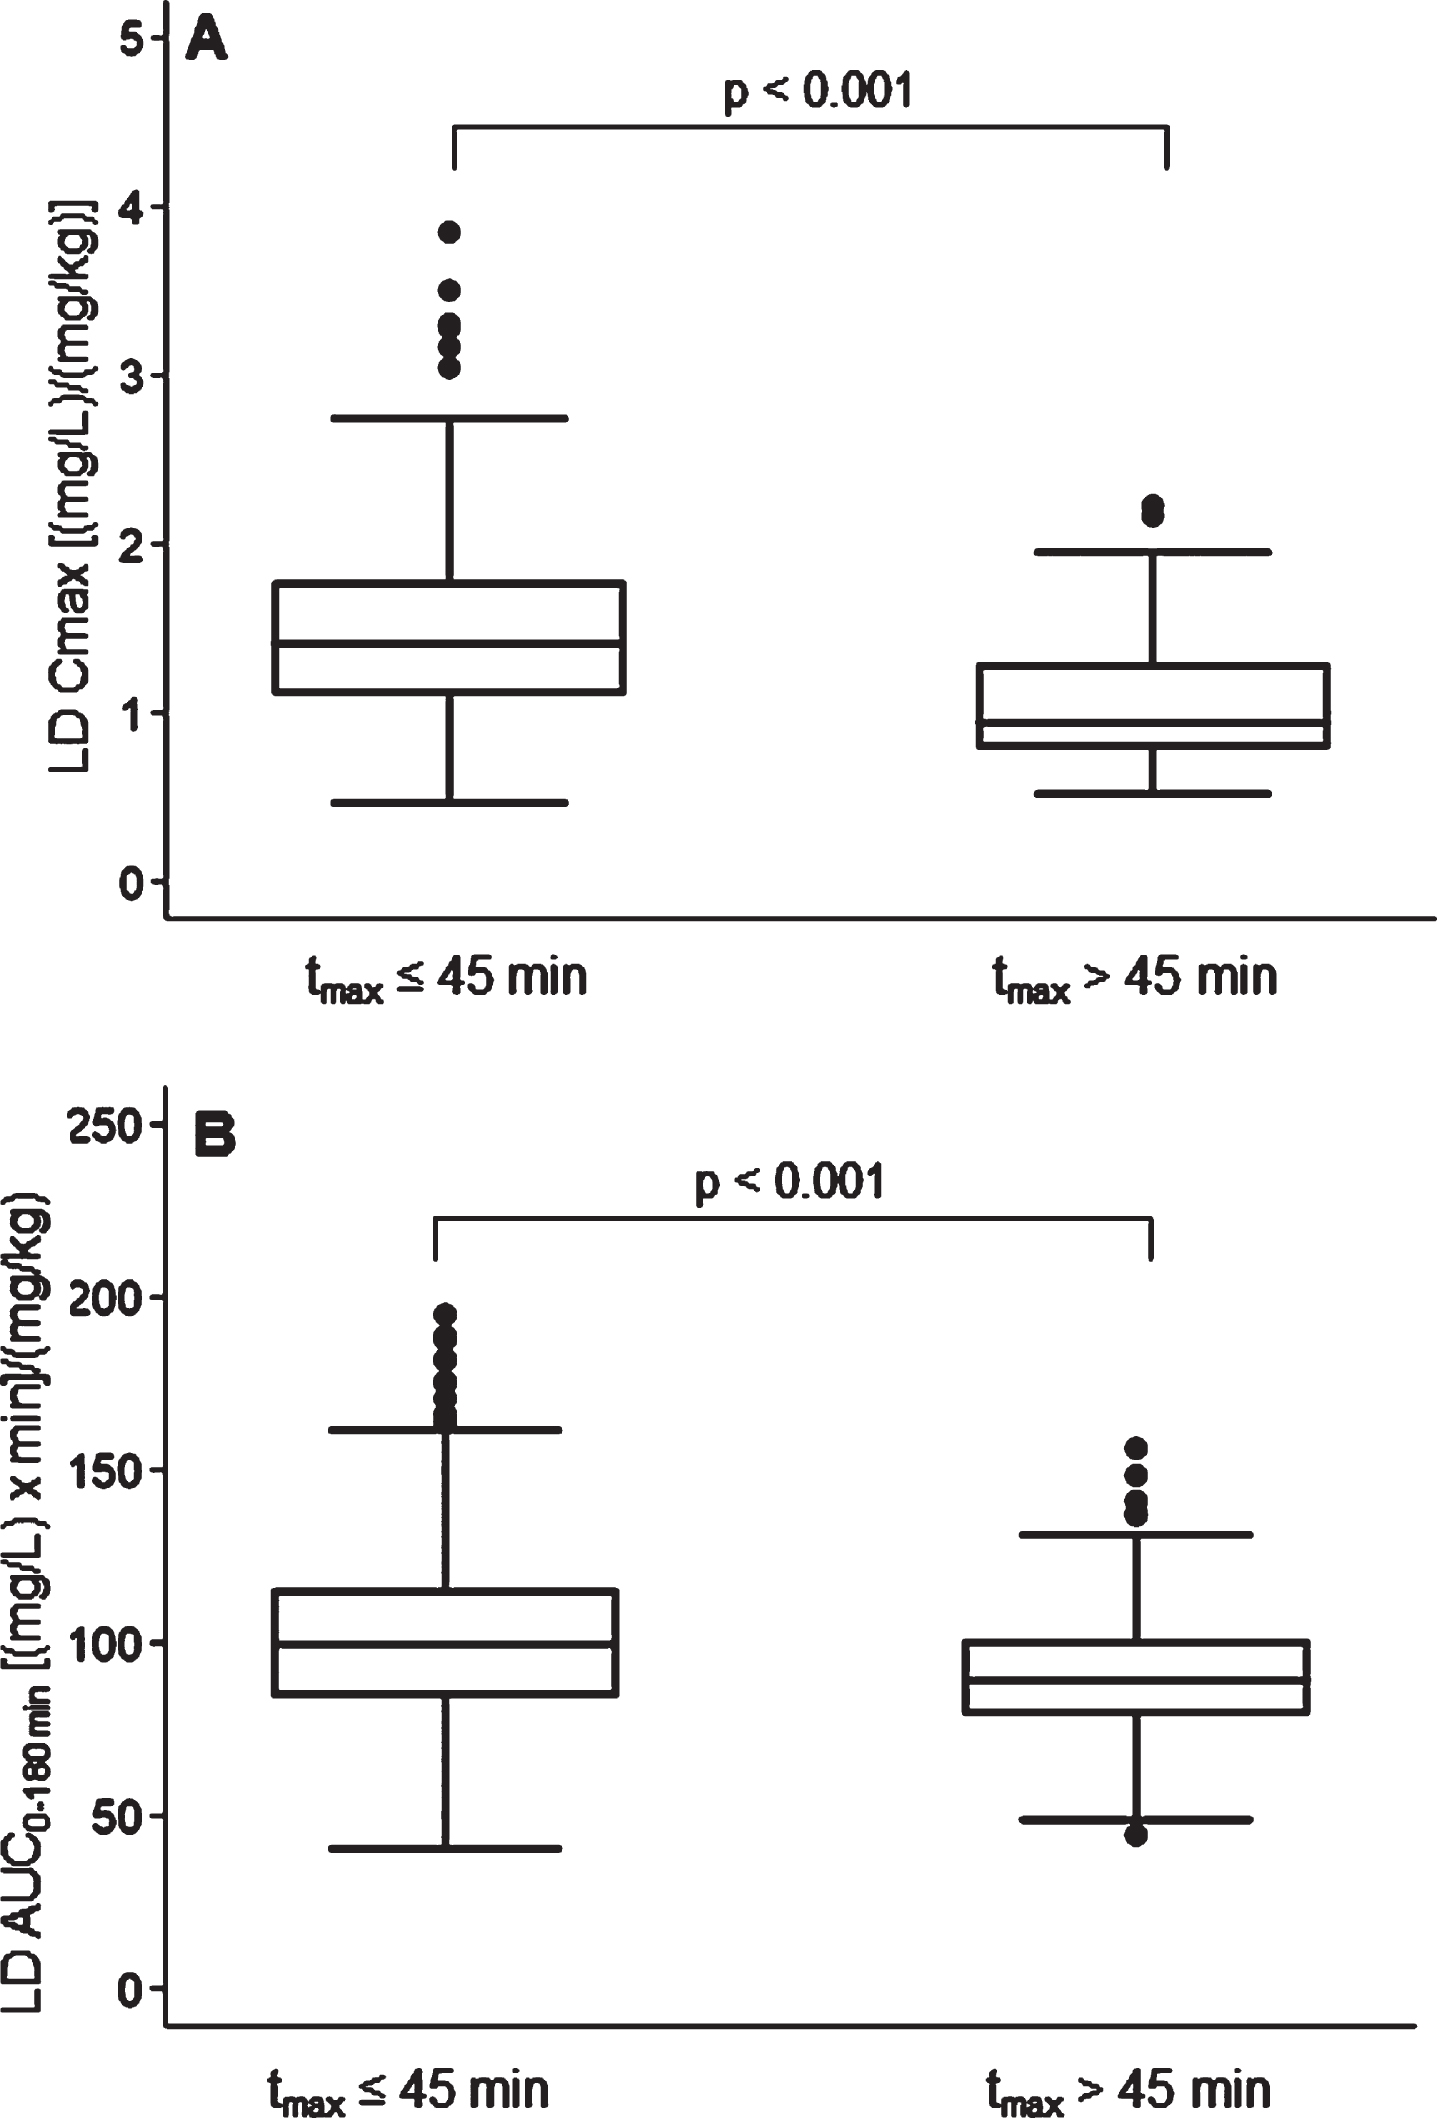
A rapid LD absorption was recorded in 74.4% of subjects: LD tmax≤45 min was matched to higher Cmax (p < 0.001) and AUC (p < 0.001), normalized for weight-adjusted test dose compared to tmax >45 min (Fig. 4). No significant differences emerged in patients’ clinical and therapeutics characteristics, including the percentage use of gastrointestinal agents, between patients with rapid vs. delayed LD absorption. A LD absorption pattern characterized by double/multiple plasma peaks was detected in 8.4% of patients.
Fig. 4
Box plots of levodopa: A) peak plasma concentration; B) area under the 3-h plasma concentration-time curve, both normalized for weight-adjusted test dose by time to peak plasma concentration. Box plots depict the range between the 25th and 75th percentiles of the data. The horizontal line marks the median value; capped bars indicate 10th–90th percentiles. Black circles represent outlying values. p, significance of comparison by Mann-Whitney U test.
Relationship between LD kinetic variables and patients’ characteristics
From multiple linear regression analysis, test dose, sex, type of DCI, weight, and MDS-UPDRS “off” scores were found to be significant linear predictors of both Cmax and AUC, while age was a further predictor only for AUC (Table 2). All these parameters jointly explain 51% and 73% of the variability of Cmax and AUC, respectively. The same model did not prove suitable in predicting the tmax variability (R2 = 0.09). Based on this model, besides test dose, sex was the strongest contributing variable to LD AUC: compared to a “median” male patient (aged 66 years, weighted 73 kg, treated with LD/BZ, receiving a LD test dose of 100 mg, with a MDS-UPDRS part III “off” score of 27), a “median” female patient with the same clinical and therapeutic features was characterized by a 27% higher LD AUC. Main differences in demographic and clinical-therapeutic variables between males and females are reported in Table 3.
Table 2
Multiple linear regression
| A) Dependent variable: Cmax (R2 = 0.51) | ||||
| Coefficients | Estimate | Std. Error | t value | p |
| (intercept) | 0.98 | 0.42 | 2.34 | 0.020 |
| Age (y) | 0.003 | 0.004 | 0.76 | 0.450 |
| Weight (kg) | –0.01 | 0.003 | –3.65 | <0.001 |
| Sex | ||||
| Male | (base) | |||
| Female | 0.54 | 0.08 | 6.50 | <0.001 |
| MDS-UPDRS part III “off” | 0.01 | 0.003 | 2.91 | 0.004 |
| Test dose (mg) | ||||
| 50 | (base) | |||
| 100 | 0.87 | 0.24 | 3.66 | <0.001 |
| 150 | 1.39 | 0.28 | 5.03 | <0.001 |
| 200 | 3.20 | 0.27 | 11.69 | <0.001 |
| Dopa decarboxylase inhibitor | ||||
| Carbidopa | (base) | |||
| Benserazide | 0.28 | 0.09 | 3.28 | 0.001 |
| B) Dependent variable: AUC (R2 = 0.73) | ||||
| Coefficients | Estimate | Std. Error | t value | p |
| (intercept) | 72.36 | 20.59 | 3.51 | <0.001 |
| Age (y) | 0.48 | 0.18 | 2.68 | 0.008 |
| Weight (kg) | –1.08 | 0.14 | –7.65 | <0.001 |
| Sex | ||||
| Male | (base) | |||
| Female | 34.00 | 4.05 | 8.39 | <0.001 |
| MDS-UPDRS part III “off” | 0.49 | 0.13 | 3.80 | <0.001 |
| Test dose (mg) | ||||
| 50 | (base) | |||
| 100 | 77.22 | 11.76 | 6.56 | <0.001 |
| 150 | 145.85 | 13.60 | 10.72 | <0.001 |
| 200 | 261.88 | 13.46 | 19.46 | <0.001 |
| Dopa decarboxylase inhibitor | ||||
| Carbidopa | (base) | |||
| Benserazide | 10.13 | 4.19 | 2.42 | 0.016 |
Cmax, peak plasma concentration; MDS-UPDRS, Movement Disorder Society Unified Parkinson’s Disease Rating Scale; AUC, area under the plasma concentration-time curve.
Table 3
Differences in demographic and clinical-therapeutic variables between females and males
| Variables | Females (n = 192) | Males (n = 308) | p |
| Age (y) | 64 (57 –72) | 67 (59 –74) | 0.025 |
| Weight (kg) | 63 (57 –72) | 78 (70 –87) | <0.001 |
| Height (cm) | 160 (158 –165) | 173 (170 –179) | <0.001 |
| BMI (kg/cm2) | 24.4 (22.1 –28.0) | 25.9 (23.8 –28.5) | 0.001 |
| Duration of LD therapy (y) | 2 (1 –5) | 2 (0.5 –4) | 0.029 |
| LD test dose (mg/kg) | 1.6 (1.4 –1.9) | 1.3 (1.2 –1.6) | <0.001 |
| Amantadine –n° (%) | 17 (8.9) | 10 (3.6) | 0.007 |
| Other cotherapies | |||
| Antihypertensive –n° (%) | 67 (34.9) | 150 (48.7) | 0.002 |
| Ipothyroidism –n° (%) | 19 (9.9) | 10 (3.3) | 0.002 |
| Antidepressant –n° (%) | 74 (38.5) | 81 (26.3) | 0.004 |
| Coffee consumption –n° (%) | 119 (63.3) | 221 (72.7) | 0.028 |
| Alcohol consumption –n° (%) | 46 (24.6) | 158 (52.3) | <0.001 |
Values are expressed as median (interquartiles). BMI, body mass index; LD, levodopa.
Furthermore, LD/BZ formulation resulted in 8% higher AUC compared with LD/CD. Weight, MDS-UPDRS part III and age were weaker contributing factors to LD AUC: as an example, a 10 kg weight loss was associated with a 9% increase in AUC; a 10-point worsening on the MDS-UPDRS or a 10-year increase in age were both associated with a 4% increase in AUC.
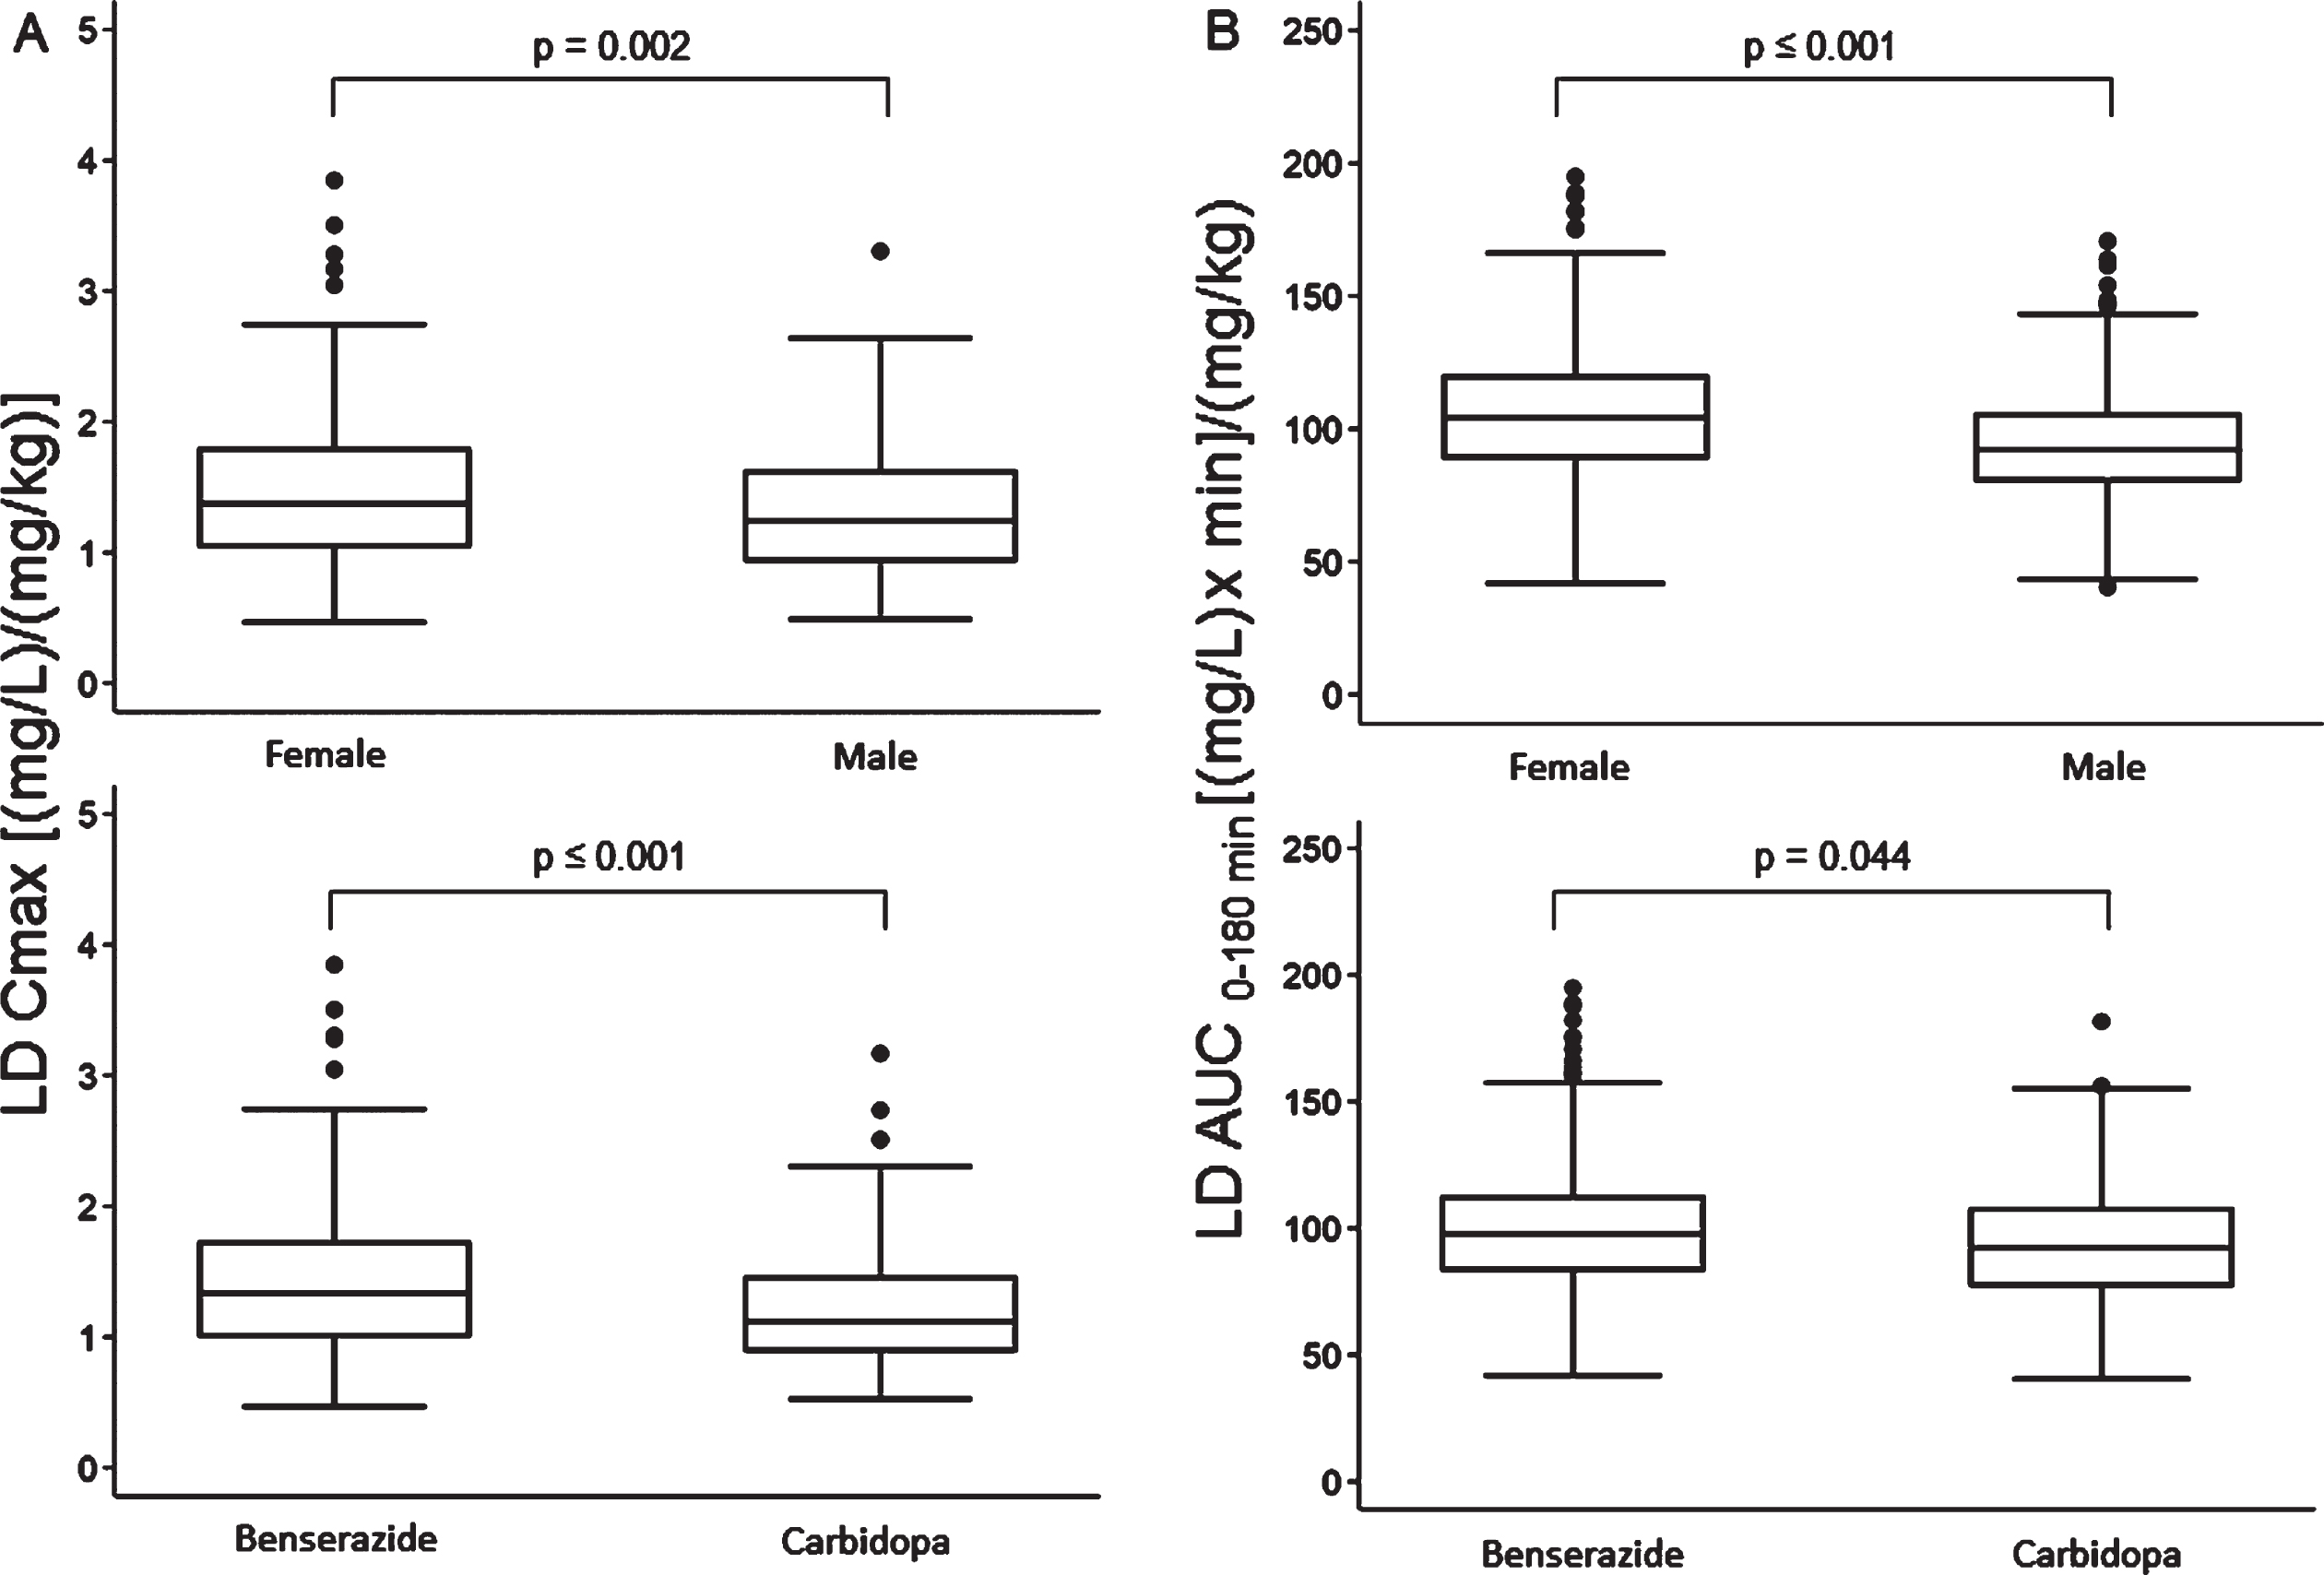
Median values of LD Cmax and AUC corrected for drug test dose (mg/kg) were significantly higher in females compared with males and subjects treated with LD/BZ compared with LD/CD (Fig. 5). Median tmax values of 30 (30–45) min were similar between females vs. males and LD/BZ vs. LD/CD, although their distribution proved statistically different in both comparisons. In particular, the percentage of subjects with tmax values lower than median was significantly higher in females vs. males (66% vs. 52%, p = 0.001) and in subjects treated with LD/CD compared with LD/BZ (71% vs. 53%, p < 0.001).
Fig. 5
Box plots of levodopa: A) peak plasma concentration; B) area under the 3-h plasma concentration-time curve, both normalized for weight-adjusted test dose by sex (upper section) and dopa decarboxylase inhibitor (lower section). Box plots depict the range between the 25th and 75th percentiles of the data. The horizontal line marks the median value; capped bars indicate 10th–90th percentiles. Black circles represent outlying values. p, significance of comparison by Mann-Whitney U test.
No difference was found in median LD Cmax between patients with PD and APs, with respective values of 1.30 (0.98 –1.68) vs. 1.27 (0.91 –1.76) [(mg/L)/(mg/kg)], (p = 0.730). Median tmax was 30 (30–45) min in both groups (p = 0.920). Median LD AUC was marginally higher in AP patients, possibly related to the older age of this group: 98.58 (85.4–119.88) vs. 94.47 (80.7–110.3) [(mg/L) x min]/(mg/kg), (p = 0.042).
Relationship between LD kinetic variables and motor/dyskinetic response
As far as LD therapeutic effect is concerned, a clinically significant subacute motor response pattern was recorded in 409 (82%) of patients. Patients with rapid absorption were 33% more likely to have a timely onset (≤45 min-latency) of motor response: RR = 1.33 (1.10–1.60), p < 0.001.
No difference emerged in LD Cmax and AUC, both normalized for weight-adjusted test dose, and tmax between “responder” and “non-responder” subgroups. Similarly, among responders LD kinetic variables were similar between patients with a stable response pattern (n = 229, 56%) compared with those with a fluctuating one. The main differences in patients’ clinical and therapeutic features between responders and non-responders are reported in Supplementary Table 5. In particular, responder patients were characterized by a longer duration of parkinsonism (p < 0.001) and LD treatment (p = 0.006), higher LD daily dose (p = 0.043), and LEDD (p = 0.002). The percentage of responders was greater in females (88%) than in males (78%), p = 0.002. No significant difference emerged between PD (81%) and APs (77%) (p = 0.264).
Dyskinesias were registered in 139 patients (28%). Patients with dyskinesias showed significantly higher median values of LD test dose (mg/kg) normalized –AUC (99.99 vs. 94.45, p = 0.033) and Cmax (1.38 vs. 1.27, p = 0.041) compared with non-dyskinetic ones. Median tmax values of 30 (30–45) min were similar between the two groups, but their distribution showed a significantly higher percentage of lower than median values in the dyskinetic patients (67% vs. 54%, p = 0.007).
Main differences in clinical-therapeutic features between the two groups are reported in Supplementary Table 6.
Among the others, dyskinesias were more frequent in females (p < 0.001) and associated with longer duration of disease (p < 0.001) and LD therapy (p < 0.001), higher severity of symptoms (p < 0.001), LD daily dose (p < 0.001) and LEDD (p < 0.001). Furthermore, in patients with dyskinesias 85% were PD vs. 15% APs (p = 0.003).
DISCUSSION
This is to our knowledge the largest collection of matched LD kinetic and dynamic data obtained by means of a subacute LD test dose in a population of subjects on chronic LD treatment, including not only PD but also APs. Overall, this cohort is representative of patients at a moderate disease stage, with relatively short duration of parkinsonism, treated with low-medium LD daily dosages. The following considerations are of note:
–First morning LD dose intake standardized with respect to time and kind of breakfast proved to assure a rapid drug absorption in the large majority of subjects. A timely and predictable LD Cmax after each dose intake is very important clinically, especially in the more advanced PD stages, when the pattern of response closely reflects the rapid rise and fall in plasma LD concentrations [1] and progressively higher “therapeutic threshold” of cerebral drug levels emerge [2,31]. From our data a rapid (i.e., ≤45 min-LD tmax) pattern of LD dose absorption was associated with median 33% higher values of weight-normalized LD Cmax and 10% higher AUC compared with a delayed, >45 min-LD tmax pattern. Overall, LD Cmax and AUC were linearly related to matched mg/kg LD test dose, an important drug characteristic in clinical practice, as it may facilitate physicians in patients’ dose adjustments. However, at a given dosage, a large intersubject variation, especially in Cmax, was apparent.
–Results of multiple linear regression analysis between LD pharmacokinetic parameters and patients’ characteristics partly confirmed and extended in a larger cohort previous observations by Nishikawa et al. [11]. In particular, sex proved to be the strongest independent contributing factor to LD bioavailability [11], as indicated by 27% higher drug AUC in females vs. males. In the past a pivotal role of body weight was suggested in explaining sex-related differences in LD bioavailability [7, 12]. From our results, LD AUC and Cmax were higher in females than in males also after adjusting for body weight. These findings are in keeping with data reported in PD patients on chronic LD therapy [9, 11] and more recently at their first-ever intake of LD [32]. Mechanisms underlying sex difference in LD bioavailability are still unclarified [9, 11, 13, 14]. Among the others, possible differences in metabolic LD elimination pathway mediated by COMT enzymes have been suggested [11, 13, 14].
Furthermore, LD/BZ formulation at the 4 : 1 ratio was associated with higher LD AUC, compared with LD/CD at the same 4 : 1 ratio. This increase (8%) was of similar order of magnitude of that reported by Nishikawa et al. (11%) [11], which, however, was potentially conditioned by the different LD/DCI ratio (4 : 1 for LD/BZ vs. 10 : 1 for LD/CD) of the two compared formulations [10]. Median weight-normalized LD Cmax were 20% higher in patients treated with LD/BZ vs. LD/CD, a notion which should be kept in mind in the individualization of optimal LD therapy, especially in patients experiencing fluctuations in motor response and “peak” LIDs. The difference in median weight-normalized LD AUC between the two formulations, although significant, was of lesser extent, around 6%. These findings are in line with data reported by Iwaki et al. [10] and might reflect the different kinetic profiles and matched inhibitory patterns of the two DCIs, characterized by a rapid increase and decrease of plasma concentrations for BZ and a slower increase and decrease for CD [10].
Among the other patients’ characteristics, aging confirmed to be associated with higher LD AUC, while no association was found for Cmax. Age-mediated differences in LD bioavailability have been already reported [5, 8, 11], mainly ascribable to a reduction in the systemic clearance of drugs [5, 8]. In line with our previous observations [5] the effect of age was modest and likely of minor importance for the dosing schedule.
Unexpected was the result of higher LD Cmax and AUC with the increase of MDS-UPDRS part III “off” score. This finding had not emerged from our previous studies, both cross-sectional [3, 33] and intrasubject [34]. To our knowledge only one study has reported so far evidence of higher LD bioavailability at more advanced disease stages [35]. This evidence is difficult to explain. It has been suggested that it might result from reduced peripheral activity of LD metabolizing enzymes and/or a better LD duodenal absorption due to impaired enteric motility with parkinsonism progression [35]. As for aging, the contribution of the severity of symptoms to LD bioavailability proved modest and probably clinically negligible.
–As far as the relationship between LD pharmacokinetic variables and LD motor response is concerned, we did not find any significant difference in median weight-normalized LD Cmax and AUC between “responder” and “non-responder” patients’ subgroups and between subjects with “stable” vs. “fluctuating” response pattern. These findings are in keeping with previous reports [29, 33, 34, 36, 37] further supporting the notion that the motor response to LD is the result of a complex interplay between cerebral LD kinetic mechanisms and the type and degree of degeneration of the nigrostriatal dopaminergic system [3].
Furthermore, in line with our previous findings [3, 38] LD pharmacokinetics were similar in patients with PD and APs. The two groups also did not differ in the percentage of “responders”, supporting the notion that an initial and temporary response to LD therapy may be present in AP patients, especially at disease onset [3, 38].
Of note, non-responder patients were clinically characterized by a shorter duration of symptoms and LD therapy. A mild and short duration of parkinsonism may account for the lack of a detectable subacute motor response, when a LD-compensated stable situation during the day is common [30].
–The presence of dyskinesias was associated with higher Cmax and AUC, normalized for LD test dose. This finding could partly reflect the significantly higher percentage of female subjects in the dyskinetic subgroup. In literature, data on the relationship between LD kinetics and dyskinesias after subacute LD challenge are conflicting. In one of our previous studies based on a smaller cohort of PD patients, LD kinetics proved similar in patients with and without dyskinesias [14]. Similarly, LD Cmax and AUC did not relate to dyskinesias according to Nishikawa et al. [11], while they proved significantly higher in dyskinetic subjects according to Shiraishi et al. [39]. Differences in patients’ inclusion criteria and dyskinesias assessment might partly account for these discrepancies.
Besides female sex predominance, patients with dyskinesias were characterized by clinical and therapeutic variables which accompany disease progression, such as longer parkinsonism duration, higher LD daily dose, LEDD and a clinical diagnosis of PD. The higher proportion of amantadine co-prescription among dyskinetic patients is explained by its recognized properties in countering LIDs [40]. With the exception of female sex, we previously found all these variables to be related to LIDs [14]. Younger age, BZ use and higher LEDD have been reported as risk factors for LIDs by Shiraishi et al. [39].
Conclusion
Our results give a picture of the relationship between demographic, clinical, and therapeutic variables and LD kinetic pattern in the largest cohort of patients with parkinsonism available so far. One strength of the paper is that our findings were all obtained from a single site with uniform and highly standardized methodology, allowing a systematic, homogeneous assessment of the real patient sample. Among the limitations, our cohort included a heterogeneous parkinsonian population not limited to clinically diagnosed PD, with potential bias.
Sex proved the strongest determinant of LD AUC. As the most relevant clinically practical finding, women might require a 25% reduced weight-normalized LD dose compared with men to achieve the same LD bioavailability, possibly contributing to minimize the development of LIDs in the long term. Controlled studies with proper follow-up are needed to confirm this evidence and possibly include it in precision medicine guidelines.
Furthermore, the notion of 20% higher LD Cmax in patients treated with LD/BZ vs. LD/CD at the same 4 : 1 ratio should be kept in mind in the individualization of optimal LD therapy, especially in patients experiencing fluctuations in motor response and “peak” LIDs.
ACKNOWLEDGMENTS
The skillful nursing assistance of Monica Balboni is gratefully acknowledged. Cecilia Baroncini edited the English text.
This work was supported by the Italian Ministry of Health, within the ordinary funding for the research of the Institute.
CONFLICT OF INTEREST
Giovanna Calandra-Buonaura has received honoraria for speaking from Abbvie Italia, Bial Italia, and Zambon Italia.
The remaining authors have no conflict of interest to report.
SUPPLEMENTARY MATERIAL
[1] The supplementary material is available in the electronic version of this article: http://dx.doi.org/10.3233/JPD-223374.
DATA AVAILABILITY
The data presented in this study are openly available in Zenodo at https://zenodo.org/record/7277763#.Y2PhukXMKUk.
REFERENCES
[1] | Contin M , Martinelli P ((2010) ) Pharmacokinetics of levodopa, J Neurol 257: , (Suppl 2): S253–261. |
[2] | Contin M , Riva R , Martinelli P , Albani F , Avoni P , Baruzzi A ((2001) ) Levodopa therapy monitoring in patients with Parkinson disease: A kinetic-dynamic approach. Ther Drug Monit 23: , 621–629. |
[3] | Contin M , Lopane G , Cortelli P , Sambati L , Mohamed S , Calandra-Buonaura G ((2021) ) Quantitative assessment of motor response to a low subacute levodopa dose in the differential diagnosis of parkinsonisms at disease onset: Data from the BoProPark cohort. J Parkinsons Dis 11: , 811–819. |
[4] | Olanow CW , Stocchi F ((2018) ) Levodopa: A new look at an old friend. Mov Disord 33: , 859–866. |
[5] | Contin M , Riva R , Martinelli P , Baruzzi A ((1991) ) Effect of age on the pharmacokinetics of oral levodopa in patients with Parkinson’s disease. Eur J Clin Pharmacol 41: , 463–466. |
[6] | Müller T , Woitalla D , Saft C , Kuhn W ((2000) ) Levodopa in plasma correlates with body weight of parkinsonian patients. Parkinsonism Relat Disord 6: , 171–173. |
[7] | Zappia M , Crescibene L , Arabia G , Nicoletti G , Bagalà A , Bastone L , Caracciolo M , Bonavita S , Di Costanzo A , Scornaienchi M , Gambardella A , Quattrone A ((2002) ) Body weight influences pharmacokinetics of levodopa in Parkinson’s disease. Clin Neuropharmacol 25: , 79–82. |
[8] | Nagayama H , Ueda M , Kumagai T , Tsukamoto K , Nishiyama Y , Nishimura S , Hamamoto M , Katayama Y ((2011) ) Influence of ageing on the pharmacokinetics of levodopa in elderly patients with Parkinson’s disease. Parkinsonism Relat Disord 17: , 150–152. |
[9] | Kumagai T , Nagayama H , Ota T , Nishiyama Y , Mishina M , Ueda M ((2014) ) Sex differences in the pharmacokinetics of levodopa in elderly patients with Parkinson disease. Clin Neuropharmacol 37: , 173–176. |
[10] | Iwaki H , Nishikawa N , Nagai M , Tsujii T , Yabe H , Kubo M , Ieiri I , Nomoto M ((2015) ) Pharmacokinetics of levodopa/benserazide versus levodopa/carbidopa in healthy subjects and patients with Parkinson’s disease. Neurol Clin Neurosci 3: , 68–73. |
[11] | Nishikawa N , Iwaki H , Shiraishi T , Mukai Y , Takahashi Y , Murata M ((2020) ) Female, aging, difference formulations of DCI, or lower body weight increases AUC4hr of levodopa in patients with Parkinson’s disease. Parkinsonsm Relat Disord 76: , 16–20. |
[12] | Arabia G , Zappia M , Bosco D , Crescibene L , Bagalà A , Bastone L , Caracciolo M , Scornaienghi M , Quattrone A ((2002) ) Body weight, levodopa pharmacokinetics and dyskinesia in Parkinson’s disease, Neurol Sci 23: , Suppl 2 S53–54. |
[13] | Kompoliti K , Adler CH , Raman R , Pincus JH , Leibowitz MT , Ferry JJ , Blasucci L , Caviness JN , Leurgans S , Chase WM , Yones LC , Tan E , Carvey P , Goetz CG ((2002) ) Gender and pramipexole effects on levodopa pharmacokinetics and pharmacodynamics. Neurology 58: , 1418–1422. |
[14] | Martinelli P , Contin M , Scaglione C , Riva R , Albani F , Baruzzi A ((2003) ) Levodopa pharmacokinetics and dyskinesias: are there sex-related differences? , Neurol Sci 24: , 192–193. |
[15] | Baruzzi A , Contin M , Albani F , Riva R ((1986) ) Simple and rapid micromethod for the determination of levodopa and 3-O-methyldopa in human plasma by high-performance liquid chromatography with coulometric detection. J Chromatogr 375: , 165–169. |
[16] | Podsiadlo D , Richardson S ((1991) ) The timed “Up & Go”: A test of functional mobility for frail basic elderly persons. J Am Geriatr Soc 39: , 142–148. |
[17] | Hagell P , Widner H ((1999) ) Clinical rating of dyskinesias in Parkinson’s disease: Use and reliability of a new rating scale. Mov Disord 14: , 448–455. |
[18] | Hoehn MM , Yahr MD ((1967) ) Parkinsonism: onset, progression and mortality. Neurology 17: , 427–442. |
[19] | Goetz CG , Tilley BC , Shaftman SR , Stebbins GT , Fahn S , Martinez-Martin P , Poewe W , Sampaio C , Stern MB , Dodel R , Dubois B , Holloway R , Jankovic J , Kulisevsky J , Lang AE , Lees A , Leurgans S , LeWitt PA , Nyenhuis D , Olanow CW , Rascol O , Schrag A , Teresi JA , van Hilten JJ , LaPelle N ; Movement Disorder Society UPDRS Revision Task Force ((2008) ) Movement Disorder Society-sponsored revision of the Unified Parkinson’s Disease Rating Scale (MDS-UPDRS): scale presentation and clinimetric testing results. Mov Disord 23: , 2129–2170. |
[20] | Schade S , Mollenhauer B , Trenkwalder C ((2020) ) Levodopa equivalent dose conversion factors: An updated proposal including opicapone and safinamide. Mov Disord Clin Pract 7: , 343–345. |
[21] | Postuma RB , Berg D , Stern M , Poewe W , Olanow CW , Oertel W , Obeso J , Marek K , Litvan I , Lang AE , Halliday G , Goetz CG , Gasser T , Dubois B , Chan P , Bloem BR , Adler CH , Deuschl G ((2015) ) MDS clinical diagnostic criteria for Parkinson’s disease. Mov Disord 30: , 1591–1601. |
[22] | Gilman S , Wenning GK , Low PA , Mathias CJ , Trojanowski JQ , Wood NW , Colosimo C , Dürr A , Fowler CJ , Kaufmann H , Klockgether T , Lees A , Poewe W , Quinn N , Revesz T , Robertson D , Sandroni P , Seppi K , Vidailhet M ((2008) ) Second consensus statement on the diagnosis of multiple system atrophy. Neurology 71: , 670–676. |
[23] | McKeith IG , Boeve BF , Dickson DW , Halliday G , Taylor JP , Weintraub D , Aarsland D , Galvin J , Attems J , Ballard CG , Bayston A , Beach TG , Blanc F , Bohnen N , Bonanni L , Bras J , Brundin P , Burn D , Chen-Plotkin A , Duda JE , El-Agnaf O , Feldman H , Ferman TJ , Ffytche D , Fujishiro H , Galasko D , Goldman JG , Gomperts SN , Graff-Radford NR , Honig LS , Iranzo A , Kantarci K , Kaufer D , Kukull W , Lee VMY , Leverenz JB , Lewis S , Lippa C , Lunde A , Masellis M , Masliah E , McLean P , Mollenhauer B , Montine TJ , Moreno E , Mori E , Murray M , O’Brien JT , Orimo S , Postuma RB , Ramaswamy S , Ross OA , Salmon DP , Singleton A , Taylor A , Thomas A , Tiraboschi P , Toledo JB , Trojanowski JQ , Tsuang D , Walker Z , Yamada M , Kosaka K ((2017) ) Diagnosis and management of dementia with Lewy bodies: Fourth consensus report of the DLB Consortium. Neurology 89: , 88–100. |
[24] | Höglinger GU , Respondek G , Stamelou M , Kurz C , Josephs KA , Lang AE , Mollenhauer B , Müller U , Nilsson C , Whitwell JL , Arzberger T , Englund E , Gelpi E , Giese A , Irwin DJ , Meissner WG , Pantelyat A , Rajput A , van Swieten JC , Troakes C , Antonini A , Bhatia KP , Bordelon Y , Compta Y , Corvol JC , Colosimo C , Dickson DW , Dodel R , Ferguson L , Grossman M , Kassubek J , Krismer F , Levin J , Lorenzl S , Morris HR , Nestor P , Oertel WH , Poewe W , Rabinovici G , Rowe JB , Schellenberg GD , Seppi K , van Eimeren T , Wenning GK , Boxer AL , Golbe LI , Litvan I ; Movement Disorder Society-endorsed PSP Study Group ((2017) ) Clinical diagnosis of progressive supranuclear palsy: the movement disorder society criteria. Mov Disord 32: , 853–864. |
[25] | Armstrong MJ , Litvan I , Lang AE , Bak TH , Bhatia KP , Borroni B , Boxer AL , Dickson DW , Grossman M , Hallett M , Josephs KA , Kertesz A , Lee SE , Miller BL , Reich SG , Riley DE , Tolosa E , Tröster AI , Vidailhet M , Weiner WJ ((2013) ) Criteria for the diagnosis of corticobasal degeneration. Neurology 80: , 496–503. |
[26] | Rektor I , Bohnen NI , Korczyn AD , Gryb V , Kumar H , Kramberger MG , de Leeuw FE , Pirtosek Z , Rektorová I , Schlesinger I , Slawek J , Valkovic P , Veselý B ((2018) ) An updated diagnostic approach to subtype definition of vascular parkinsonism - Recommendations from an expert working group. Parkinsonism Relat Disord 49: , 9–16. |
[27] | Nutt JG , Woodward WR , Hammerstad JP , Carter JH , Anderson JL ((1984) ) The on-off phenomenon in Parkinson’s disease. Relation to levodopa absorption and transport. N Engl J Med 310: , 483–488. |
[28] | Baruzzi A , Contin M , Riva R , Procaccianti G , Albani F , Tonello C , Zoni E , Martinelli P ((1987) ) Influence of meal ingestion time on pharmacokinetics of orally administered levodopa in Parkinsonian patients. Clin Neuropharmacol 10: , 527–537. |
[29] | Nutt JG , Woodward WR , Carter JH , Gancher ST ((1992) ) Effect of long-term therapy on the pharmacodynamics of levodopa: Relation to on-off phenomenon. Arch Neurol 49: , 1123–1130. |
[30] | Lopane G , Mellone S , Corzani M , Chiari L , Cortelli P , Calandra-Buonaura G , Contin M ((2018) ) Supervised versus unsupervised technology-based levodopa monitoring in Parkinson’s disease: an intrasubject comparison. J Neurol 265: , 1343–1352. |
[31] | Nutt JG , Woodward WR ((1986) ) Levodopa pharmacokinetics and pharmacodynamics in fluctuating parkinsonian patients. Neurology 36: , 739–744. |
[32] | Conti V , Izzo V , Russillo MC , Picillo M , Amboni M , Scaglione CLM , Nicoletti A , Cani I , Cicero CE , De Bellis E , Charlier B , Giudice V , Somma G , Corbi G , Barone P , Filippelli A , Pellecchia MT ((2022) ) Gender differences in levodopa pharmacokinetics in levodopa-naïve patients with Parkinson’s Disease. Front Med (Lausanne) 9: , 909936. |
[33] | Contin M , Riva R , Martinelli P , Cortelli P , Albani F , Baruzzi A ((1993) ) Pharmacodynamic modeling of oral levodopa: clinical application in Parkinson’s disease. Neurology 43: , 367–371. |
[34] | Contin M , Riva R , Martinelli P , Cortelli P , Albani F , Baruzzi A ((1994) ) Longitudinal monitoring of the levodopa concentration-effect relationship in Parkinson’s disease. Neurology 44: , 1287–1292. |
[35] | Woitalla D , Goetze O , Kim JI , Nikodem AB , Schmidt WE , Przuntek H , Müller T ((2006) ) Levodopa availability improves with progression of Parkinson’s disease. J Neurol 253: , 1221–1226. |
[36] | Gancher ST , Nutt JG , Woodward WR ((1987) ) Peripheral pharmacokinetics of levodopa in untreated, stable and fluctuating parkinsonian patients. Neurology 37: , 940–944. |
[37] | Fabbrini G , Juncos J , Mouradian MM , Serrati C , Chase TN ((1987) ) Levodopa pharmacokinetic mechanisms and motor fluctuations in Parkinson’s disease. Ann Neurol 21: , 370–376. |
[38] | Calandra-Buonaura G , Doria A , Lopane G , Guaraldi P , Capellari S , Martinelli P , Cortelli P , Contin M ((2016) ) Pharmacodynamics of a low subacute levodopa dose helps distinguish between multiple system atrophy with predominant Parkinsonism and Parkinson’s disease. J Neurol 263: , 250–256. |
[39] | Shiraishi T , Nishikawa N , Mukai Y , Takahashi Y ((2020) ) High levodopa plasma concentration after oral administration predicts levodopa-induced dyskinesia in Parkinson’s disease. Parkinsonism Relat Disord 75: , 80–84. |
[40] | Rascol O , Fabbri M , Poewe W ((2021) ) Amantadine in the treatment of Parkinson’s disease and other movement disorders. Lancet Neurol 20: , 1048–1056. |


