
Alterations in Self-Aggregating Neuropeptides in Cerebrospinal Fluid of Patients with Parkinsonian Disorders
Abstract
Background:
Parkinson’s disease (PD), progressive supranuclear palsy (PSP), and multiple system atrophy (MSA) present with similar movement disorder symptoms but distinct protein aggregates upon pathological examination.
Objective:
Discovery and validation of candidate biomarkers in parkinsonian disorders for differential diagnosis of subgroup molecular etiologies.
Methods:
Untargeted liquid chromatography (LC)-mass spectrometry (MS) proteomics was used for discovery profiling in cerebral spinal fluid (CSF) followed by LC-MS/MS based multiple reaction monitoring for validation of candidates. We compared clinical variation within the parkinsonian cohort including PD subgroups exhibiting tremor dominance (TD) or postural instability gait disturbance and those with detectable leukocytes in CSF.
Results:
We have identified candidate peptide biomarkers and validated related proteins with targeted quantitative multiplexed assays. Dopamine-drug naïve patients at first diagnosis exhibit reduced levels of signaling neuropeptides, chaperones, and processing proteases for packaging of self-aggregating peptides into dense core vesicles. Distinct patterns of biomarkers were detected in the parkinsonian disorders but were not robust enough to offer a differential diagnosis. Different biomarker changes were detected in male and female patients with PD. Subgroup specific candidate biomarkers were identified for TD PD and PD patients with leukocytes detected in CSF.
Conclusion:
PD, MSA, and PSP exhibit overlapping as well as distinct protein biomarkers that suggest specific molecular etiologies. This indicates common sensitivity of certain populations of selectively vulnerable neurons in the brain, and distinct therapeutic targets for PD subgroups. Our report validates a decrease in CSF levels of self-aggregating neuropeptides in parkinsonian disorders and supports the role of native amyloidogenic proteins in etiologies of neurodegenerative diseases.
INTRODUCTION
Neurodegenerative diseases are aging associated conditions for which there presently are no medications that can slow progression. A diagnosis of Parkinson’s disease (PD) is initially made based upon movement disorder symptoms that are largely resolved with dopaminergic medications. The diagnosis is validated by dopamine transporter-imaging and postmortem detection of alpha-synuclein (aSYN) immunostaining of Lewy body aggregates in dop-aminergic (DA) neurons of the substantia nigra (sn). However, there is a wide range of additional non-motor symptoms in PD, both in earlier and later phases, with aSYN spreading to regions and cell types beyond DA sn neurons. Furthermore, other protein aggregates are often detected in the brain in postmortem analysis in PD. While end stage protein aggregation has been well characterized and exhaustively targeted by antibody-based therapies, there is still a dearth of knowledge concerning underlying molecular changes leading to protein misfolding. An increased understanding of the molecular deficits and changes prior to and associated with protein aggregation can help identify clinically useful biomarkers and novel drug targets for disease remediation prior to irreversible neuron loss. Proteomics analysis of cerebrospinal fluid (CSF) offers insight into the condition of neurons and glia in the brain that captures both the influence of genes as well as metabolic and environmental stresses. Additionally, protein biomarkers may immediately suggest mechanisms and candidate drug targets that might be addressed with either small molecules or therapeutic antibodies.
The parkinsonian disorders, progressive supranuclear palsy (PSP), multiple system atrophy (MSA), and PD, all result in clinically similar movement deficits including tremor and difficulty initiating motion, i.e., bradykinesia. While it is often difficult to differentiate these diseases at initial diagnosis, they exhibit distinct molecular signatures upon pathological examination: PSP patients have microtubule associated protein tau (MAPT) aggregates in neurons of the sn [1]; MSA patients exhibit aSYN aggregates and Lewy bodies in glial cells of sn; and PD patients have characteristic aSYN aggregation in Lewy bodies in the dopamine producing neurons of sn [2]. A molecular diagnostic that could distinguish between these clinically similar diseases would better predict prognosis, response to dopaminergic medications and selection of patients for clinical trials.
Mass spectrometry based multiple reaction monitoring (MRM) assays allow for robust quantification of endogenous proteins based on the measurement of more than 50 stable isotope-labeled standard (SIS) peptides in a single assay. This allows the int-errogation of multiple disease mechanisms simultaneously with the aim of distinguishing between similar diseases or sub-groups within a single diagnosis. For the current study we have attempted to validate some previously identified candidates and also conducted untargeted discovery profiling in CSF depleted of high abundant proteins to identify novel candidates. The validation of these candidates using MRM reveals a decrease in CSF levels of several related neurosecretory granule proteins and peptides that suggest important roles in neuronal cell function and disease. Data from this and several previous studies suggest that additional self-aggregating proteins of dense-core vesicles are altered in parkinsonian disorders, and that global problems in liquid-liquid phase change regulation may be widespread in neurodegenerative disorders.
MATERIALS AND METHODS
Study population and sample information
This work is focused on baseline evaluation of patients at initial diagnosis identified in a population-based incidence study in Northern Sweden–New Parkinsonism in Umeå (NYPUM) [3]. Patients were excluded in the original cohort for secondary parkinsonism or dementia within one year of PD diagnosis (DLB). All patients were assessed in clinical evaluation including Hoehn and Yahr (HY), Unified Parkinson’s Disease Rating Scale (UPDRS), and autonomic and oculomotor deficits. Diagnosis with PD, MSA, or PSP required agreement of at least two movement disorder specialist neurologists according to UK Parkinson’s disease brain bank criteria [4] or consensus criteria for MSA [5] or PSP [6]. Control participants were selected from healthy volunteers that exhibited normal 123I-FP-CIT SPECT brain imaging, as compared to parkinsonian patients which were confirmed based on abnormal dopamine transporter scan.
This study included two batches of CSF, of which one contained 90 samples for untargeted proteomic profiling and the other 118 samples for targeted MRM validation. There were 76 samples in common between batches. They were selected from the Neurobiobank at Clinical Neuroscience, Umeå University Hospital, Umeå, Sweden. CSF samples were taken at initial visit (year 0) and are almost all dopaminergic drugs (L-DOPA et al.) naïve. Number of females (f) and males (m) and ages (mean, standard error of the mean (SEM)) of participants are summarized as Table 1.
Table 1
CSF Sample Information. Two substantially overlapping sample sets were selected for untargeted proteomic profiling and validation of candidates by multiple reaction monitoring (MRM). The discovery study focused on samples from patients with PD exhibiting greater increase in UPDRS III scores at follow up visits (year 3-year 1)(fast).
| Group | Profiling(n = 90) | MRM (n = 118) | |||
| Count(f/m) | Age (mean±SEM, f/m) | Count(f/m) | Age (mean±SEM, f/m) | ||
| Control | 30(14/16) | 70.9±3.2/67.1±6.8 | 30(14/16) | 70.9±3.2 /67.1±6.8 | |
| PD | fast | 32(9/23) | 73.8±9.2/70.0±9.8 | 31(12/19) | 69.4±7.3 /67.7±10.1 |
| slow | 32(11/21) | 66.7±8.6/69.4±7.7 | |||
| MSA | 12 (5/7) | 70.6±6.5/72.7±2.9 | 12(5/7) | 70.6±6.5/69.6±6.6 | |
| PSP | 16(8/8) | 73.2±7.8/70.3±5.5 | 14(6/7) | 73.1±8.4/69.7±5.6 | |
All patients approved the use of clinical material with informed consent, and research was conducted under the guidelines of the Declaration of Helsinki. These studies were approved by the Regional Medical Ethics Board in Umeå, Sweden, committee reference numbers: DNR2011-334-31M (2011-12-06); DNR2014-163-31M (2014-08-29) DNR 2012-326-31M; 2012-10-26.
The clinical evaluation conducted at baseline prior to treatment with dopamine medications was used for determining tremor dominant (TD), based on UPDRS III items 20 and 21, or postural instability gait disturbance (PIGD) items 13, 14, 15, 29 and 30. The distinction between TD and PIGD subgroups are most clear at initial diagnosis as dopamine medications clear many tremor symptoms and the diagnosis is more difficult as the disease progresses [7, 8].
Candidates and peptides
Candidates for validation with MRM were chosen based on discovery in the CSF profiling study or from previously published candidate protein biomarkers. Names of peptides are made using “gene + the first three N-terminal amino acids”. Heavy isotope labeled peptides were used from two sources. 32 synthetic peptides for 29 proteins were purchased from Cambridge Research Biochemicals with purity > 95% (via reversed-phase liquid chromatography RPLC, and mass determined by matrix-assisted laser desorption/ionization time-of-flight mass spectrometry, MALDI-TOF-MS) with net peptide content determined by Elemental Analysis (C, H, N). And 14 peptides were derived from 11 QPrEST standards (AtlasAntibodies AB, Bromma, Sweden). QPrEST purified protein standards are designed to yield heavy isotope labeled peptide fragments upon trypsin digestion; this allows for monitoring of trypsin efficiency during sample preparation in a context similar to native protein digestion. All heavy peptides were used to validate MS retention time of native peptides in CSF and for identification of optimal transitions for quantification by MRM.
Sample preparation
CSF profiling
This study contained 90 samples including 30 Controls, 32 PD, 12 MSA, and 16 PSP. QC samples were made from a pool of randomly selected CSF. Five aliquots of QC were used to evaluate variations in HAP depletion across samples. Albumin and IgG was first depleted using Pierce™ Top 2 Abundant Protein Depletion Spin Columns (Catalog number: 85162) according to manufacturer’s protocol. Briefly, slurry from each spin column was pooled. Aliquots of 170μl were made and added to new spin columns with filters, which was sufficient to remove high abundant proteins from 170μg CSF protein according to the protocol. 150μl CSF (containing ∼75μg protein) from each sample was used for depletion. Flow through from each spin column was combined with three subsequent washes using 50μl PBS each. Eluents of above from each sample were desalted by 3K filter followed by two washes using 50 mM ABC (ammonium bicarbonate), and then dried by speed vac at room temperature. 20μl Lysis buffer containing 2% SDC (Sodium deoxycholate), 10 mM TCEP (Tris (2-carboxyethyl) phosphine hydrochloride), 40 mM CAA (2-Chloroacetamide), 100 mM Tris pH 8.5 was added to each sample and incubated at 95°C for 10 min. The resultant solution was diluted by 180μl 50 mM ABC containing 0.5μg trypsin, which was used for overnight digestion at 37°C. Reaction was stopped by adding Formic acid (final concentration 0.5% v/v). 10 isotope labelled peptides were spiked in as internal standards (5 fmol/ μl final). SDC pellets were removed by 14000 rcf for 10 min. All peptide mixtures were desalted on the 5 mg Oasis HLB 96-well plate (part no. 186000309; Waters; Milford, MA, USA). The eluate was then dried in a speed vac for 3-4 h.
CSF MRM
This study contained 118 samples including 30 Controls, 63 PD, 12 MSA, and 14 PSP. 50μl CSF was first heated at 95°C for 10 min. After cooling on ice, 8 M urea was added (1.0 M final). Disulfide bonds were reduced by 5 mM TCEP at 37°C and alkylated with final 10 mM IAA (iodoacetamide) through 30 min incubations in dark at room temp-erature. 1μg trypsin was added and incubated at 37°C for 2 h. 0.5μg additional trypsin was added to each sample and incubated at 37°C overnight. Reaction was stopped by adding Formic acid (final concentration 0.5% v/v). Isotope labelled internal standards for each peptide were spiked-in at concentrations close to endogenous levels as empirically determined during method optimization for each peptide. All peptide mixtures were desalted on the Oasis HLB Extraction Cartridges (1 cc/5 mg, part no.: 186000309, Waters, Milford, MA, USA). The eluate was then dried in a speed vac for ∼5-6 h.
Instrument and analysis
CSF profiling: Liquid chromatography–ion mobility separation–mass spectrometry (LC-IMS-MS)
NanoACQUITY™ ultra-performance liquid chromatography system (Waters Corp) was used to deliver mobile phases. 500 ng peptides from each sample were loaded and trapped on a PepMap100, nanoViper Acclaim® C18 trap column (100μm i.d.×2 cm, 5μm particles, 100 Å pores; Thermo Scientific) and were then eluted and separated on an HSS T3 (High Strength Silica T3) C18 analytical column (75μm i.d.×250 mm, 1.8μm particles; Waters, Milford, MA). 135 min gradient of solvent B (3 : 1 ACN/2-propanol, 0.1% formic acid) at a flow rate of 280 nl/min was used: 5–20% for 64 min; 20–35% for 35 min; 35–50% for 5 min; 50–95% for 3 min; 95% for 9 min; 95% -1% for 3 min and balanced for 15 min using 1% solvent B. The eluate entered Waters SynaptG2-S2 HDMS through a nanoflow ESI interface operating in positive ionization mode. Ultradefinition (UD) MSE was used; and ion mobility dependent transfer energy was used for peptide fragmenting [9]. Scan time was set to be 0.8 s.
Data processing
ProteinLynx Global SERVER version 3.0.2 (PLGS, Waters Corp) was used for peptide identification for the pilot experiment and Progenesis QI for Proteomics (QI.P) was used for raw data processing, alignment, ion picking, peptide and protein identification and quantification. All data were first lock mass-corrected using [Glu1]-fibrinopeptide B (m/z 785.8426; [M + 2H]2+). For peak detection, the following thresholds were used: (i) low energy ion: 250 counts, (ii) elevated energy ion: 50 counts, (iii) minimal total ion intensity: 750 counts. For peptide identification, database was Human UniProtKB/Swiss-Prot (20,204 reviewed entries, downloaded on 2015/09/28). Digest reagent: trypsin, maximum missed cleavages: 2; maximum protein mass: 250 kDa; fixed modifications: carbamidome-thyl; variable modifications: Oxidation M, peptide tolerance: 10 ppm; fragment tolerance: 25 ppm; FDR < 1%; for ion matching requirements, thresholds were: 2 for fragments/peptide, 3 for fragments/protein and 1 for peptides/protein. For further iden-tification refinement, peptides with score < 4 and hits < 2 were excluded. All data was first corrected for mass spectrometry intensity using the median of nine SIS peptides. SIS normalized data of peptides were exported from QI.P.
MRM transition selection and parameter optimization
All possible transitions were tested by the triple quadrupoles. Optimized collision energy (CE) voltages were estimated by Skyline daily (MacCoss lab, University of Washington) and optimized through increasing voltages by steps of 1V from -5V to +5V around the estimated CEs. Since SIS peptides have the same behaviors as native (NAT) with regards to separation, ionization, and fragmentation, the same MRM acquisition parameters and retention times can be used for both peptide forms. The only differences are the actual precursor and product ion m/z values. The 5 most intense ions were chosen for each SIS peptide in buffer. SIS were also spiked in CSF to monitor both SIS and NAT behaviors. Only transitions that show no interference in CSF, the most response and least variation (≤20% coefficient of variation (CV)) were selected and three transitions were chosen for each peptide for monitoring in the final assays.
LC-MRM
1290 Infinity system (Agilent Technologies) was used as UHPLC and connected to a 6490 Triple Quad for MRM analysis. Peptide mixture corresponding to 25μl CSF digests was loaded on to a guard column (ACQUITY UPLC BEH C18 VanGuard Pre-column, 130Å, 1.7μm, 2.1 mm×5 mm, part no:186003975), and then separation of peptides was achieved with subsequent analytical column (ACQUITY UPLC Peptide BEH C18 Column, 130Å, 1.7μm, 2.1 mm×150 mm, part no:186003556). Mobile phase A contains 0.1% FA in water, and B contains 90% ACN and 0.1% FA. 26 min gradient of increasing gradient of mobile phase B was used: 2% –10% B for 0.1 min, 10% –11% for 2.9 min, 11–20% B for 10 min, 20–25% B for 3 min, 25–28% B for 3 min, 28–34 for 2 min, 34–42% for 2 min, 42 to 90% for 1 min and hold 90% for 2 min. The MRM acquisition parameters were set as follows: 4,000 V capillary voltage, 300 V nozzle voltage, 11 L/min sheath gas flow (UHP nitrogen) at a temperature of 350°C, 16 L/min drying gas flow at a temperature of 150°C, 35 psi nebulizer gas flow, and unit resolution (0.7 Da full width at half maximum (FWHM)) in the first quadrupole (Q1) and the third quadrupole (Q3). Dynamic MRM option was used for transitions monitoring. The default fragmentor voltage was 380 V and 6 V was used for cell accelerator potential. Delta retention time was 2 min and the cycle time was 800 ms.
Raw data was imported into Skyline daily for analysis and the integrations were manually checked. The endogenous peptides were considered to be detectable only when one or more transitions from it and two or more from its SIS counterpart were co-eluting with dot-product ratios > 0.94. Linear regression was used to fit logarithmic peak area ratio (H/L, heavy/light) to logarithmic concentration of H in each level. Precision was calculated for each level of the standard curves using CV (s.d. divided by the mean, expressed as a percentage). Lower limits of quantification (LLOQs) was calculated using the lowest level with CV less than 20%. Protein concentration (μg/ μl) in each sample was calculated by standard curves and final concentration (μg/ ml) was calculated by following formula: Protein concentration (ng/ml) = MW (molecular weight of the target protein)* concentration of spiked SIS (fmol/μl) /1000.
Statistical analysis
R (version3.6.1) was used for most univariate analysis and plotting. Mann-Whitney test was used for comparing groups. We utilized a two-step proteomic profiling, in which an exploratory discovery study was followed by a targeted validation study to identify biomarker candidates. Statistical significance of candidates was evaluated with and without correction for multiple comparisons using the false discovery rate (FDR) method and reported in Table 2. Elastic Net Regression (through R package “glmnet”) was used for selecting the panel of most important peptides that could produce the best separation of PD and control groups. 70% of randomly chosen samples were used for training, and the remaining 30% was used for validation. For the elastic net model, the optimized alpha = 0, lambda = 0.125. Multivariate data analysis was performed by SIMCA software (version 16, Umetrics, Umea, Sweden). For orthogonal partial least squares discriminant analysis (OPLS-DA) models, data were column centered and scaled to unit variance (UV). Seven-fold cross-validation and CV-ANOVA testing were used to assess statistical significance of all OPLS models. The significance of a peptide for the group separation in the OPLS-DA models was determined by calculating the 95% confidence interval. The 20 peptides were then used for OPLS-DA modeling, which was further optimized by removing peptides with high variation in cross validation weights.
Table 2
Univariate Analysis of Candidate Protein Biomarkers in Profiling and MRM
| Tier | Candidate | PD/CON | PSP/CON | MSA/CON | |||||||||
| profiling | MRM | profiling | MRM | profiling | MRM | ||||||||
| ratio | p | ratio | p | ratio | p | ratio | p | ratio | p | ratio | p | ||
| Tier1 | VGF | 0.78 | 0.01* | 0.78 | 0.07 | 0.64 | 0.004* | 0.48 | 0.0008*Δ | 0.77 | 0.05* | 0.56 | 0.01* |
| CHGB | 0.91 | 0.2 | 0.92 | 0.38 | 0.68 | 0.003* | 0.62 | 0.004*Δ | 0.82 | 0.07 | 0.72 | 0.02* | |
| CHGA | 0.79 | 0.09 | 0.85 | 0.28 | 0.64 | 0.01* | 0.58 | 0.01* | 0.78 | 0.25 | 0.6 | 0.03* | |
| APOE | 1 | 0.81 | 1.02 | 0.92 | 0.7 | 0.01* | 0.7 | 0.03* | 0.92 | 0.66 | 0.86 | 0.35 | |
| SCG2 | 0.8 | 0.08 | 0.89 | 0.09 | 0.64 | 0.01* | 0.59 | 0.003*Δ | 0.79 | 0.14 | 0.63 | 0.01* | |
| NELL2 | 0.85 | 0.11 | 0.87 | 0.29 | 0.7 | 0.04* | 0.63 | 0.01*Δ | 0.76 | 0.09 | 0.72 | 0.08 | |
| LRG1 | 1.27 | 0.03* | 1.18 | 0.04* | 1.37 | 0.59 | 1.31 | 0.12 | 1.45 | 0.02* | 1.45 | 0.02* | |
| Tier2 | SST | 0.63 | 0.08 | 0.75 | 0.01* | 0.58 | 0.07 | 0.52 | 0.002*Δ | 0.58 | 0.1 | 0.62 | 0.02* |
| CFHR2 | 1.18 | 0.17 | 1.2 | 0.02* | 1.31 | 0.64 | 1.3 | 0.04* | 1.32 | 0.33 | 1.37 | 0.06 | |
| SERPINA1 | 1.2 | 0.12 | 1.24 | 0.05* | 1.3 | 0.78 | 1.26 | 0.23 | 1.41 | 0.06 | 1.51 | 0.02* | |
| C9 | 1.18 | 0.09 | 1.26 | 0.03* | 1.31 | 0.45 | 1.44 | 0.04* | 1.32 | 0.15 | 1.72 | 0.003* | |
| NPTXR | 0.83 | 0.24 | 0.83 | 0.24 | 0.74 | 0.12 | 0.49 | 0.005*Δ | 0.87 | 0.43 | 0.6 | 0.02* | |
| NPTX1 | 1.09 | 0.4 | 0.85 | 0.32 | 1.1 | 0.96 | 0.53 | 0.0018*Δ | 1.31 | 0.086 | 0.7 | 0.11 | |
| APP | 0.99 | 0.89 | 0.9 | 0.13 | 0.74 | 0.13 | 0.58 | 0.002*Δ | 0.92 | 0.69 | 0.72 | 0.04* | |
| APLP2 | 0.84 | 0.16 | 0.99 | 0.81 | 0.71 | 0.079 | 0.64 | 0.018* | 0.79 | 0.16 | 0.79 | 0.19 | |
| Tier3 | POTEE | 2.46 | 0.01* | 0.92 | 0.08 | 1.56 | 0.43 | ||||||
| PSAP | 0.75 | 0.01* | 0.73 | 0.07 | 0.74 | 0.05* | |||||||
| FGFR2 | 1.21 | 0.02* | 1.92 | 0.47 | 1.14 | 0.37 | |||||||
| RREB1 | 0.82 | 0.04* | 0.57 | 1.9e-5* | 0.72 | 0.004* | |||||||
| THY1 | 0.82 | 0.05* | 0.65 | 0.01* | 0.81 | 0.11 | |||||||
| FN1 | 0.66 | 0.06 | 0.43 | 0.01* | 0.43 | 0.01* | |||||||
| ANXA1 | 1.16 | 0.1 | 1.26 | 0.39 | 1.45 | 0.03* | |||||||
| ACTA2 | 0.76 | 0.17 | 0.62 | 0.05* | 0.64 | 0.03* | |||||||
Table 2. Comparison of profiling and targeted validation of candidate protein biomarkers. Candidate protein biomarkers are listed with gene name and separated into 3 tiers depending upon level of confidence and validation. Tier 1: significant both in profiling and MRM data for disease group vs control group. Tier 2: significant only in MRM data but not profiling data. Tier 3: candidates significant in profiling but not tested by MRM. * Mann U test, significant if p value is below 0.05. Δ significant after multiple testing correction.
For CSF profiling, the following lists of proteins were excluded from further analysis: Immunoglobulin classes, keratins, hemoglobin. Principal components analysis (PCA) was used for overviews of sample distributions and detection of severe outliers. OPLS-DA was then applied to detect protein patterns that best discriminate between the pre-defined groups. Q2 value of OPLS-DA model was the indication of robustness of classification and p-values were calculated for each model using ANOVA. Samples were randomized both for sample preparation and mass spectrometry runs. A constrained randomization was done in two steps. Samples were matched for gender and age, then matched groups were created including one sample for each disease plus control. Then each group was internally randomized. [10].
RESULTS
Experimental design
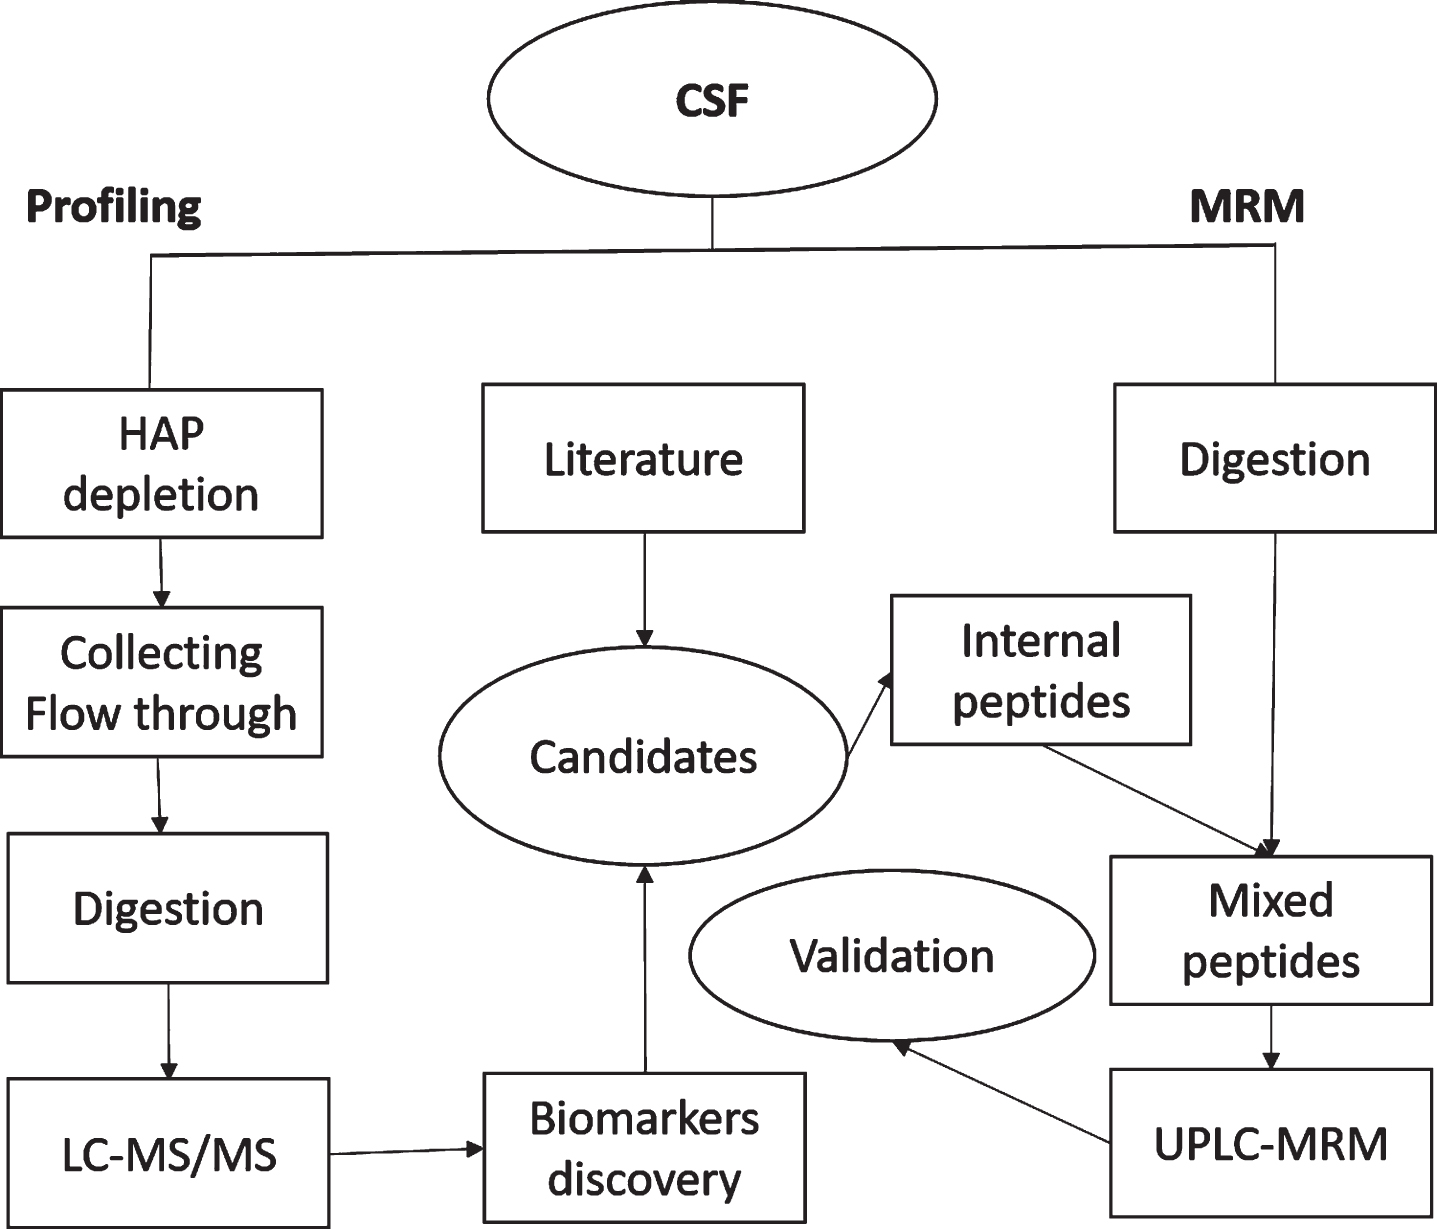
Figure 1 depicts the experimental procedures and design of the current study. Untargeted proteomics profiling was first conducted on high abundant protein depleted CSF in order to survey more proteins than is possible in raw CSF. Thirty PD samples for the discovery profiling were selected from the baseline samples (initial diagnosis) of the NYPUM cohort (120 total samples) based on the rate of disease progression: the 30 fastest progressing patients based on increase in UPDRS III between year 1 and year 3 post-diagnosis. Depleted CSF samples were digested with trypsin and peptides were identified and quantified by tandem mass spectrometry (LC-MS/MS). Candidate proteins for validation were selected from this discovery study, as well as other in-house experiments and review of literature. MRM was used for validation of these candidates in a larger set of un-depleted CSF samples which included the discovery stage samples plus the 30 slowest progressing patients from NYPUM. Additionally, MSA and PSP cases from NYPUM, as well as CSF from healthy volunteers (no neurological diseases) were included in both discovery and validation stages.
Fig. 1
Flowchart of the experiment. HAP, High abundant proteins, in this study refers to albumin and IgG.
Untargeted proteomic profiling of CSF
Detection of proteins in blood and CSF can be improved by removal of high abundant proteins, including albumin and IgG–the two most abundant proteins in CSF. Resin coated with anti-albumin and anti-IgG antibodies from Pierce Top 2 Abundant Protein Depletion Spin Columns was used for HAP depletion in individual samples. Untargeted LC-MS proteomic profiling resolved 6980 peptides from 313 proteins for quantification in 90 CSF samples. Median CV for these 313 proteins in QC samples was 15.2%. PCA was used to exclude outliers because of blood contamination or technical problems. Samples were excluded due to high hemoglobin (> 20x median Hemoglobin B) or residual high levels of albumin or IgG. In total, 14 outliers had to be excluded from further analysis; 76 samples (26 Controls, 28 PD, 10 MSA, and 12 PSP) were left for final analysis.
Univariate analysis with Mann-Whitney tests was performed, and fold changes and p values for all detected proteins are shown in Supplementary Table 1. Proteins are denoted by the HGNC gene symbol and statistics are calculated for the sum of all unique peptides for a single protein. Proteins significantly altered in any of the diseases are listed in Table 2 (profiling). Multivariate analysis of the profiling data was done by OPLS-DA for each disease vs. the control group using SIMCA software (Umetrics, Umeå). Each model was optimized by retaining the proteins contributing to the separation of disease from control and removing proteins with high variation in weights within the cross validated model. The final optimized multivariate models are depicted in Fig. 2, including model statistics in the legend. These indicate that protein based multivariate models could be derived that significantly distinguish between each parkinsonian disease and healthy controls (Fig. 2A-C). All three disease models indicate that Ras-responsive element binding protein 1 (RREB1) is significantly reduced in all diseases (ratio PD/control = 0.82, p value 0.04; PSP/ control 0.57 p value 2E-5; MSA/control 0.72, p value 0.004). RREB1 is a transcription factor that has been shown to bind to the protein/nucleic acid deglycase DJ1 (PARK7 gene) [11], and is the most important protein driving the PSP and MSA multivariate models (Fig. 2B, C; right panels).
Fig. 2
Multivariate modeling of CSF protein profiling comparing parkinsonian disorders vs. healthy control (CON). Left panels are OPLS-DA scores scatter plots: x-axis (t[1]) are scores of first predictive component separating individual samples in case vs control classes; y-axis (t0[1]) represents scores of the orthogonal component of within class differences. Right panels are weights of individual proteins contributing to the optimized models.The positive weights indicate an increase in disease compared to control.A) PD (n = 28) vs. Control (n = 26), R2X = 0.811, R2Y = 0.552 Q2 = 0.465 p = 3.1e-5; B) PSP (n = 12) vs. Control (n = 26), R2X = 0.877, R2Y = 0.626, Q2 = 0.382, p = 0.015; C) MSA (n = 10) vs. Control (n = 26), R2X = 0.851, R2Y = 0.613, Q2 = 0.373, p = 0.025.
![Multivariate modeling of CSF protein profiling comparing parkinsonian disorders vs. healthy control (CON). Left panels are OPLS-DA scores scatter plots: x-axis (t[1]) are scores of first predictive component separating individual samples in case vs control classes; y-axis (t0[1]) represents scores of the orthogonal component of within class differences. Right panels are weights of individual proteins contributing to the optimized models.The positive weights indicate an increase in disease compared to control.A) PD (n = 28) vs. Control (n = 26), R2X = 0.811, R2Y = 0.552 Q2 = 0.465 p = 3.1e-5; B) PSP (n = 12) vs. Control (n = 26), R2X = 0.877, R2Y = 0.626, Q2 = 0.382, p = 0.015; C) MSA (n = 10) vs. Control (n = 26), R2X = 0.851, R2Y = 0.613, Q2 = 0.373, p = 0.025.](https://content.iospress.com:443/media/jpd/2022/12-4/jpd-12-4-jpd213031/jpd-12-jpd213031-g002.jpg)
Additional significantly altered proteins in both the PD and MSA disease models include increased leucine-rich alpha-2-glycoprotein (LRG1), complement component 9 (C9), alpha-1-acid glycoprotein 1 (ORM1), and alpha-1-antitrypsin (SERPINA1) and decreased pyruvate kinase (PKM) (Fig. 2A, C; right panels). All univariate statistics are shown in Table 2 and Supplementary Table 1. Increased annexin A1 (ANXA1, ratio MSA/ control = 1.45, p value 0.01) is unique for the MSA model (Fig. 3C), and for MSA vs. healthy controls by univariate statistics. Proteins unique to PD profiling include by univariate analysis, POTE ankyrin domain family member E (POTEE; ratio PD/control 2.46, p value 0.01) and in the multivariate modeling, prosaposin (PSAP, ratio PD/control = 0.75, p value 0.01), a protein involved in lysosomal trafficking of the PD disease gene GBA (lysosomal acid glucosylceramidase) [12].
Fig. 3
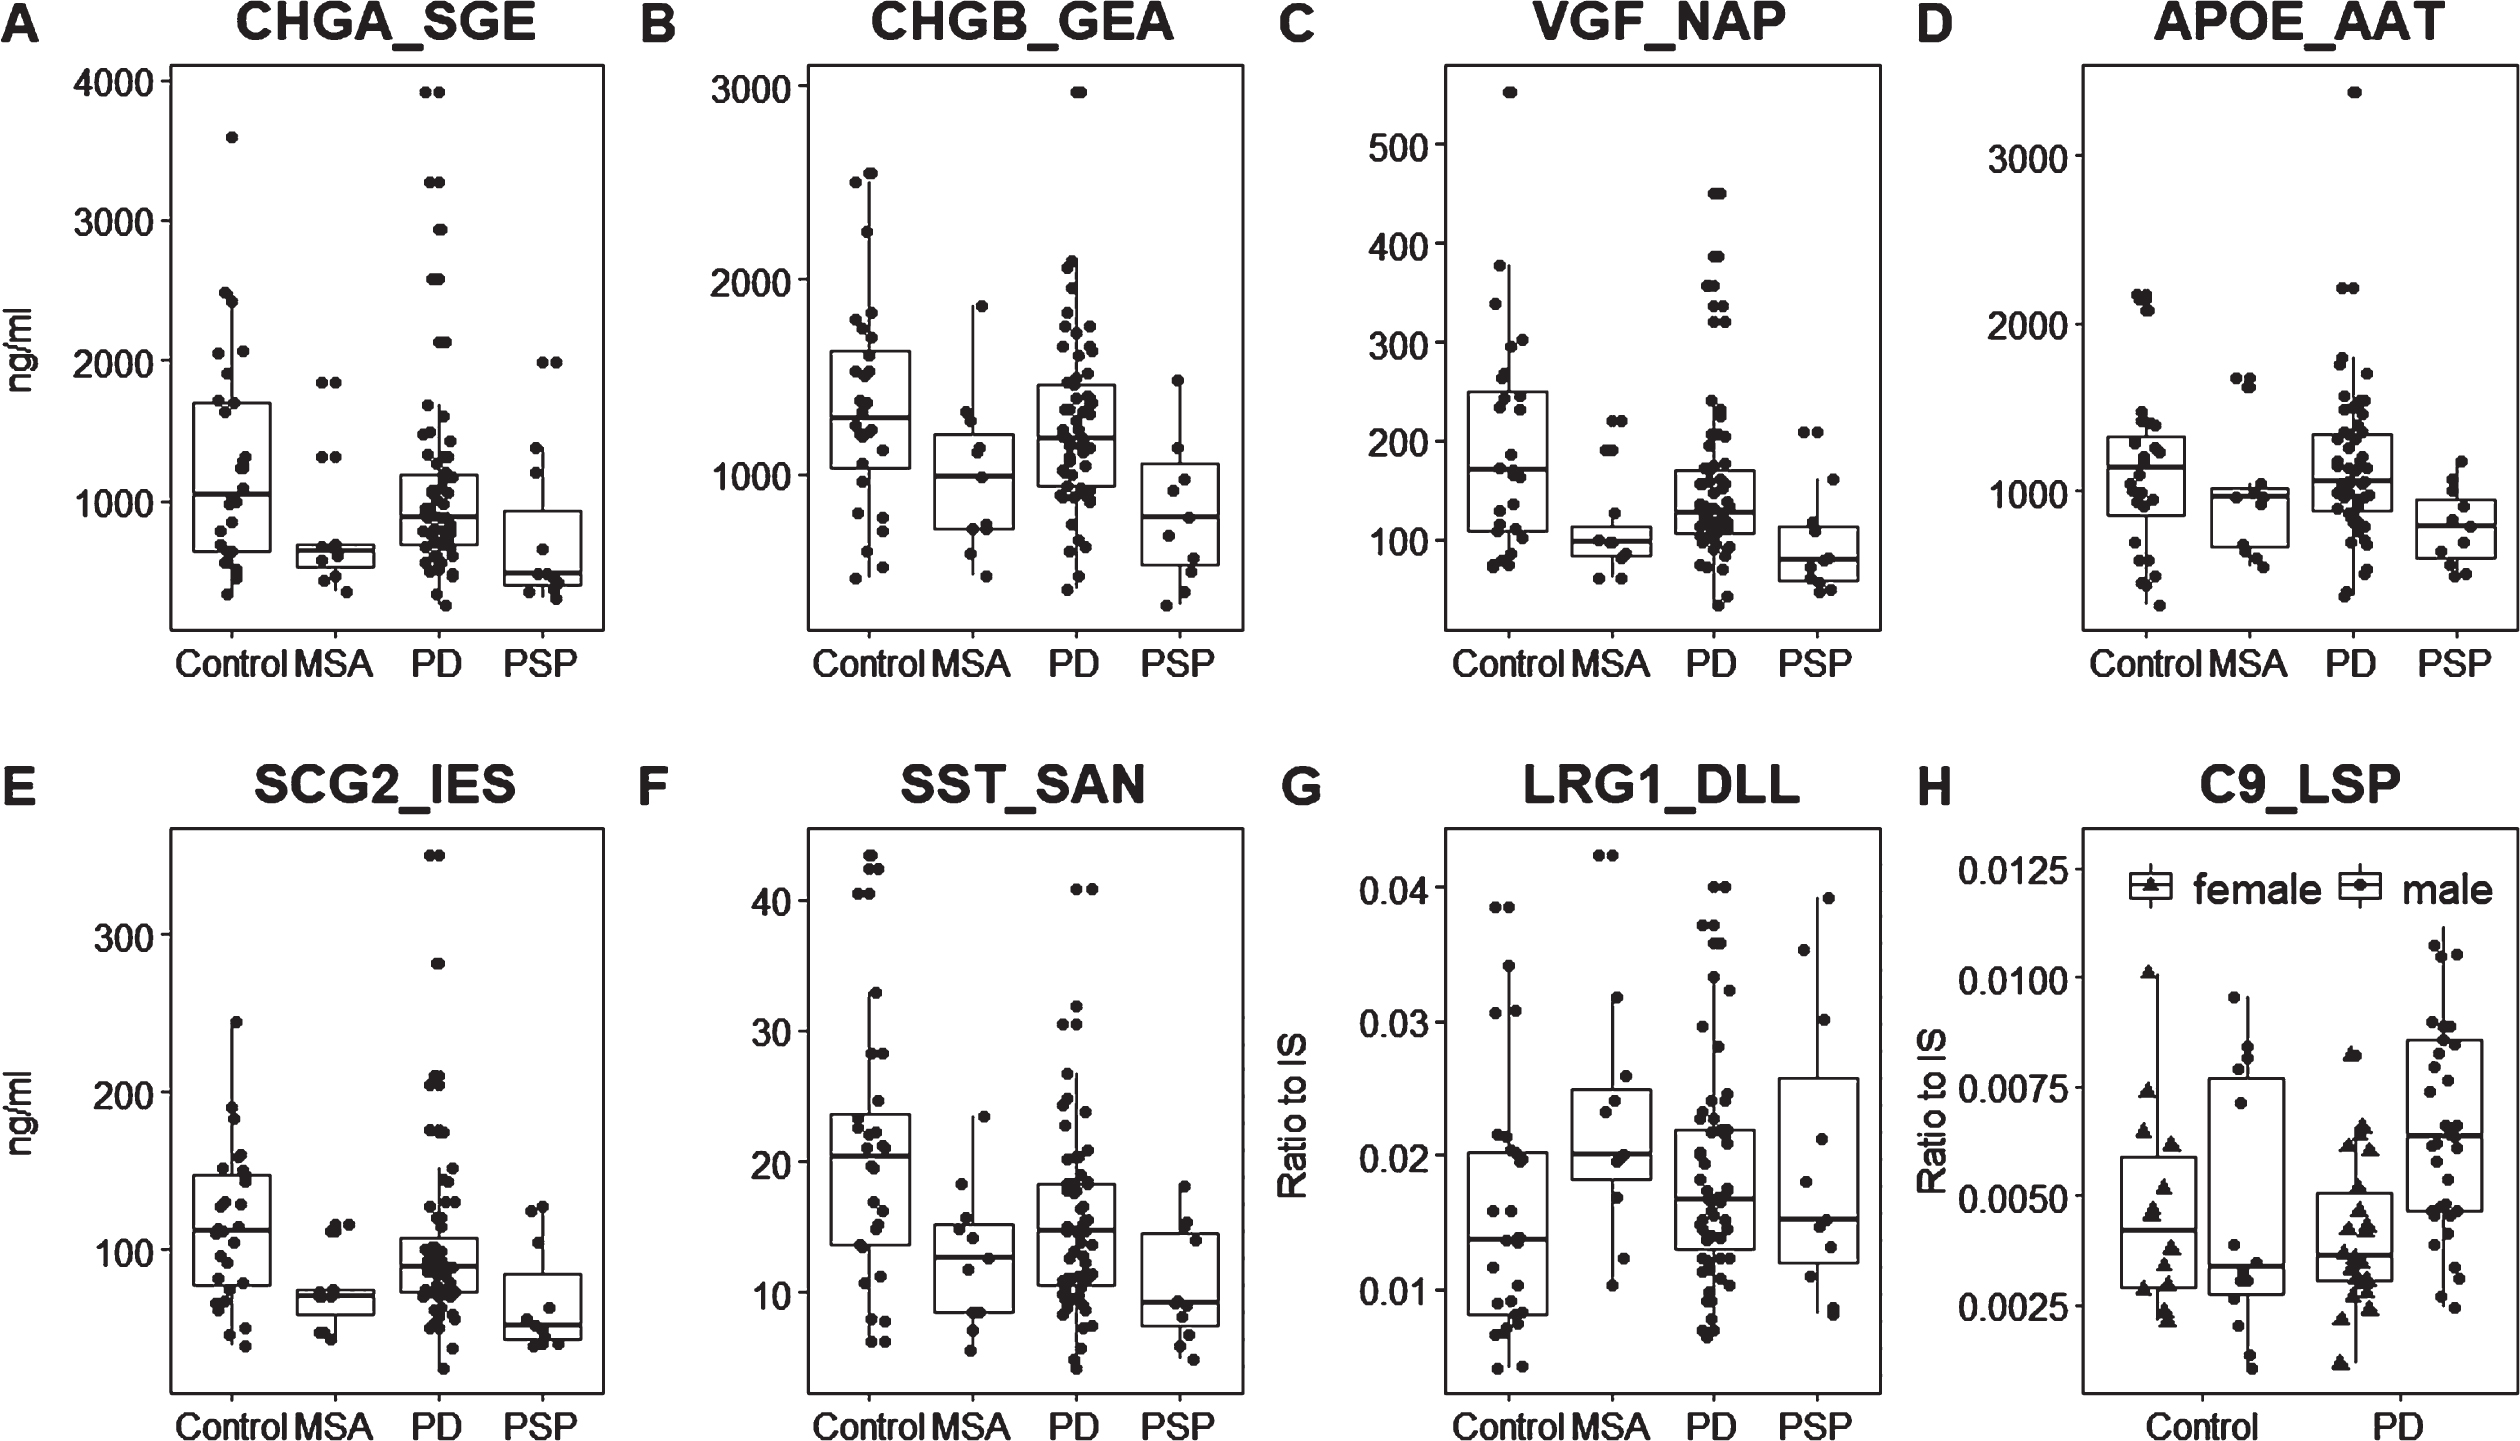
Scatterplots of significant candidates in the MRM validation. A broad range of measurements was detected in CSF from healthy control samples. A-G) Total patient populations compared to controls. While the atypical parkinsonian disorders are generally more similar within their disease group, the PD group generally exhibits a larger range of values, suggesting multiple subgroups within the PD diagnosis.H)Female and male PD patients compared to same sex controls. LRG1_DLL and C9_LSP were quantified label free (no SIS peptide), so the y-axis for these peptidesis a ratio to the optimized internal standard (IS). Other peptides were quantified by a spiked-in standard so the y-axis is the concentration of protein in ng/ml.
There is considerable similarity between the PD and PSP multivariate models amongst neuropeptides, including decreased levels of neurosecretory protein VGF (VGF) and secretogranin-2 (SCG2) which are important in both models; somatostatin (SST) and chromogranin A (CHGA) important in the PD vs. control model (Fig. 2A), and chromogranin B (CHGB) and neuropeptide Y (NPY) in the PSP model (Fig. 2B).
Some protein biomarkers are unique for the optimized PSP model, this includes the Alzheimer’s disease (AD) genes APOE and amyloid precursor protein (APP), and amyloid beta precursor-like protein 2 (APLP2). Several proteins were significantly reduced by univariate analysis only in PSP, including: glutaminyl-peptide cyclotransferase (QPCT; ratio PSP/CON = 0.56, p value 0.014); protein kinase C-binding protein NELL2 (NELL2; 0.70, 0.037), CD44 antigen (CD44; ratio 1.89, p value 0.040); and neuroendocrine protein 7B2 (SCG5; ratio 0.51, p value 0.02). In the multivariate analysis, the secretory granule regulatory proteins carboxypeptidase E (CPE; ratio 0.74, p value 0.014) and secretogranin 3 (SCG3; ratio 0.65, p value 0.017) are both reduced in CSF from PSP patients (Fig. 2B right panel). CPE is a sorting receptor for the prohormone and neuropeptide chaperone secretogranin 3, and further processes peptides following proteolytic cleavage [13]; and SCG5 is a secreted peptide with an intrinsically disorder region (IDR) that functions as chaperone for neuropeptides and has been detected in Lewy bodies [14]. Identification of these three regulatory proteins in our discovery proteomics study supports a role of altered neuropeptide processing in parkinsonian disorders.
MRM assay development for selected candidates
Twenty significantly altered proteins from the CSF profiling study were selected for a validation study: APLP2, APOE, APP, CP, CFHR2, CHGA, CHGB, CPE, GAPDH, LRG1, NELL2, NCAM1, NRCAM, ORM1, SCG2, SERPINA1, SERPINA3, SST, and VGF. One peptide for each candidate detected in CSF profiling was selected based on a unique amino acid sequence and an observable spectrum of fragments with higher ranks of abundance. An additional 20 candidates from a parallel plasma proteomics discovery study (Zhu et al., manuscript in preparation) or from previously published PD proteomics studies were selected for validation (protein list in Supplementary Table 2). Peptides were selected based on in-house profiling data and in comparison to an online database (http://gpmdb.thegpm.org/mrm/index.html) in order to find the best peptides for MRM assay development. For peptides with isotope labeled standards, the best collision energies (CEs) were empirically determined for the instrument. For label free peptides, theoretical CEs were calculated based on Skyline embedded algorithm for Agilent 6400 series.
Finally, an assay detecting 224 transitions of 55 peptides from 42 protein candidates was developed, as described in Supplementary Table 3. Three of these peptides were from equine Cytochrome C, which were used to monitor sample preparation. Another three isotope labeled peptides were for routine checking of performance of the instruments. 28 peptides were quantified using standard curves built by spiking serially diluted internal standards. Linearity, robustness, LOD and LOQ of these 28 peptides are as in Supplementary Table 4. Four peptides (GAPDH_GAL, APLP2_GSG, SERPINA5_TLY, and PGK1_GCI) were quantified by ratio of L/H* MW (molecular weight of the target protein)* concentration of spiked SIS (fmol/μl)/1000 because of native abundance close to limit of detection (SERPINA5_TLY and PGK1_GCI) or background interference (GAPDH_GAL, APLP2_GSG). The remaining 20 peptides were quantified by label free methods. Ten isotope labeled peptides with the smallest variation among 8 QC samples were tested for unlabeled peptide normalization individually. Each peptide was normalized by dividing by the SIS peptide with smallest RSD.
Candidate validation by MRM
Quality of sample and data was controlled by addition of equine cytochrome C (CytC) into each sample before sample preparation. Six samples were defined as outliers because they deviated more than 2*SD from the mean value of CytC. High abundant plasma proteins in CSF can be indicators of blood contamination [15], so PCA analysis of all samples was conducted by using seven high abundant plasma proteins SERPINA1, A2M, APOA1, AMBP, ORM1, SERPINA3, and AHSG. Three outliers were removed because of very high levels (> 3*SD) of one or more of these high abundant proteins. Finally, 109 samples were left for statistical analysis.
Mann-Whitney test was used to find whether candidates show significant changes between each disease and healthy controls. Table 2 compares univariate analysis results for proteomic profiling and MRM for most significant peptides; the results are divided into 3 tiers of level of confidence in candidates. Tier1 are 7 candidates that were significant both for MRM and depleted CSF proteomic profiling in at least one disease. Tier2 are 10 candidates significant in MRM but not in profiling (several were borderline significant in the untargeted study). There remain several candidates significant in profiling that we have not yet attempted to validate with MRM, these Tier3 candidates are represented by eight of the most significant candidates for PD vs. controls or MSA vs. controls. The complete list of MRM peptides and results are reported in Supplementary Table 5. Only biomarkers for PSP were still significant (p value < 0.05) after correction for multiple testing as highlighted in Table 2.
In the MRM study, as shown in Table 2, CSF alterations in markers of immune activation and dense core vesicle neuropeptide regulation were measured. In all 3 diseases we detect increases in complement factor H-related protein 2 (CFHR2) and C9, and decreases in somatostatin (SST), VGF, and SCG2. Granin peptides CHGA and CHGB were also significantly decreased in both PSP and MSA (Table 2, Tier1) as was neuronal pentraxin receptor (NPTXR). PSP CSF also showed a significant decrease in the NPTXR ligand neuronal pentraxin-1 (NPTX1).
The MRM study also validated the PSP CSF protein decrease in AD-associated genes APOE and APP as well as APLP2. While there are different subsets of biomarkers that exhibit significant changes for each disease, all candidates trend in the same direction in all diseases, as can be seen in the scatterplots shown in Fig. 3. Similarly, increases in PD and MSA were significant for LRG1 and SERPINA1, but increased in PSP as well (Table 2).
Differences between male and female MRM peptide measurements
Analysis of the MRM data separated by sex in control and disease groups revealed striking differences between the male and female PD patients. There are proteins known to be regulated by sex hormones with lower levels in control females, such as zinc-alpha-2-glycoprotein 1 (AZGP1) and alpha-1-acid-glycoprotein (ORM1) which exhibited significantly lower levels in PD males than PD females (Supplementary Table 6). We detect several with no apparent sex differences in control samples that show significantly higher levels in PD males that PD females, including immune modulators C9, LRG1, C1QB, and SerpinA1 (Supplementary Table 6). The converse is observed for neurosecretory proteins including CHGB, SCG2, CHGA, SST, and VGF–control females exhibit higher levels than males for all these proteins, and the decreases that are detected upon onset of PD are predominantly driven by the females in this cohort in all 3 diseases (Supplementary Table 6). Together this indicates sex distinct changes in CSF proteins levels with onset of PD.
Correlation between assays and biomarkers
In general, the correlation was quite good between the proteomic profiling and the targeted validation assays measured across all samples (Pearson correlation coefficient > 0.4 for all candidates; as shown in the correlation matrix Supplementary Figure 1). An interesting pattern appears in this correlation analysis whereby the neuropeptides and related dense core vesicle regulatory proteins (VGF, CHGB, CHGA, SCG2, and SST) are generally highly correlated across patient samples, but uncorrelated to the inflammatory markers (LRG1, SERPINA3, AZGP1, CFHR2, SERPINA1, C9, ORM1)–which are highly correlated to each other (Supplementary Figure 1).
Multivariate modeling of MRM validation
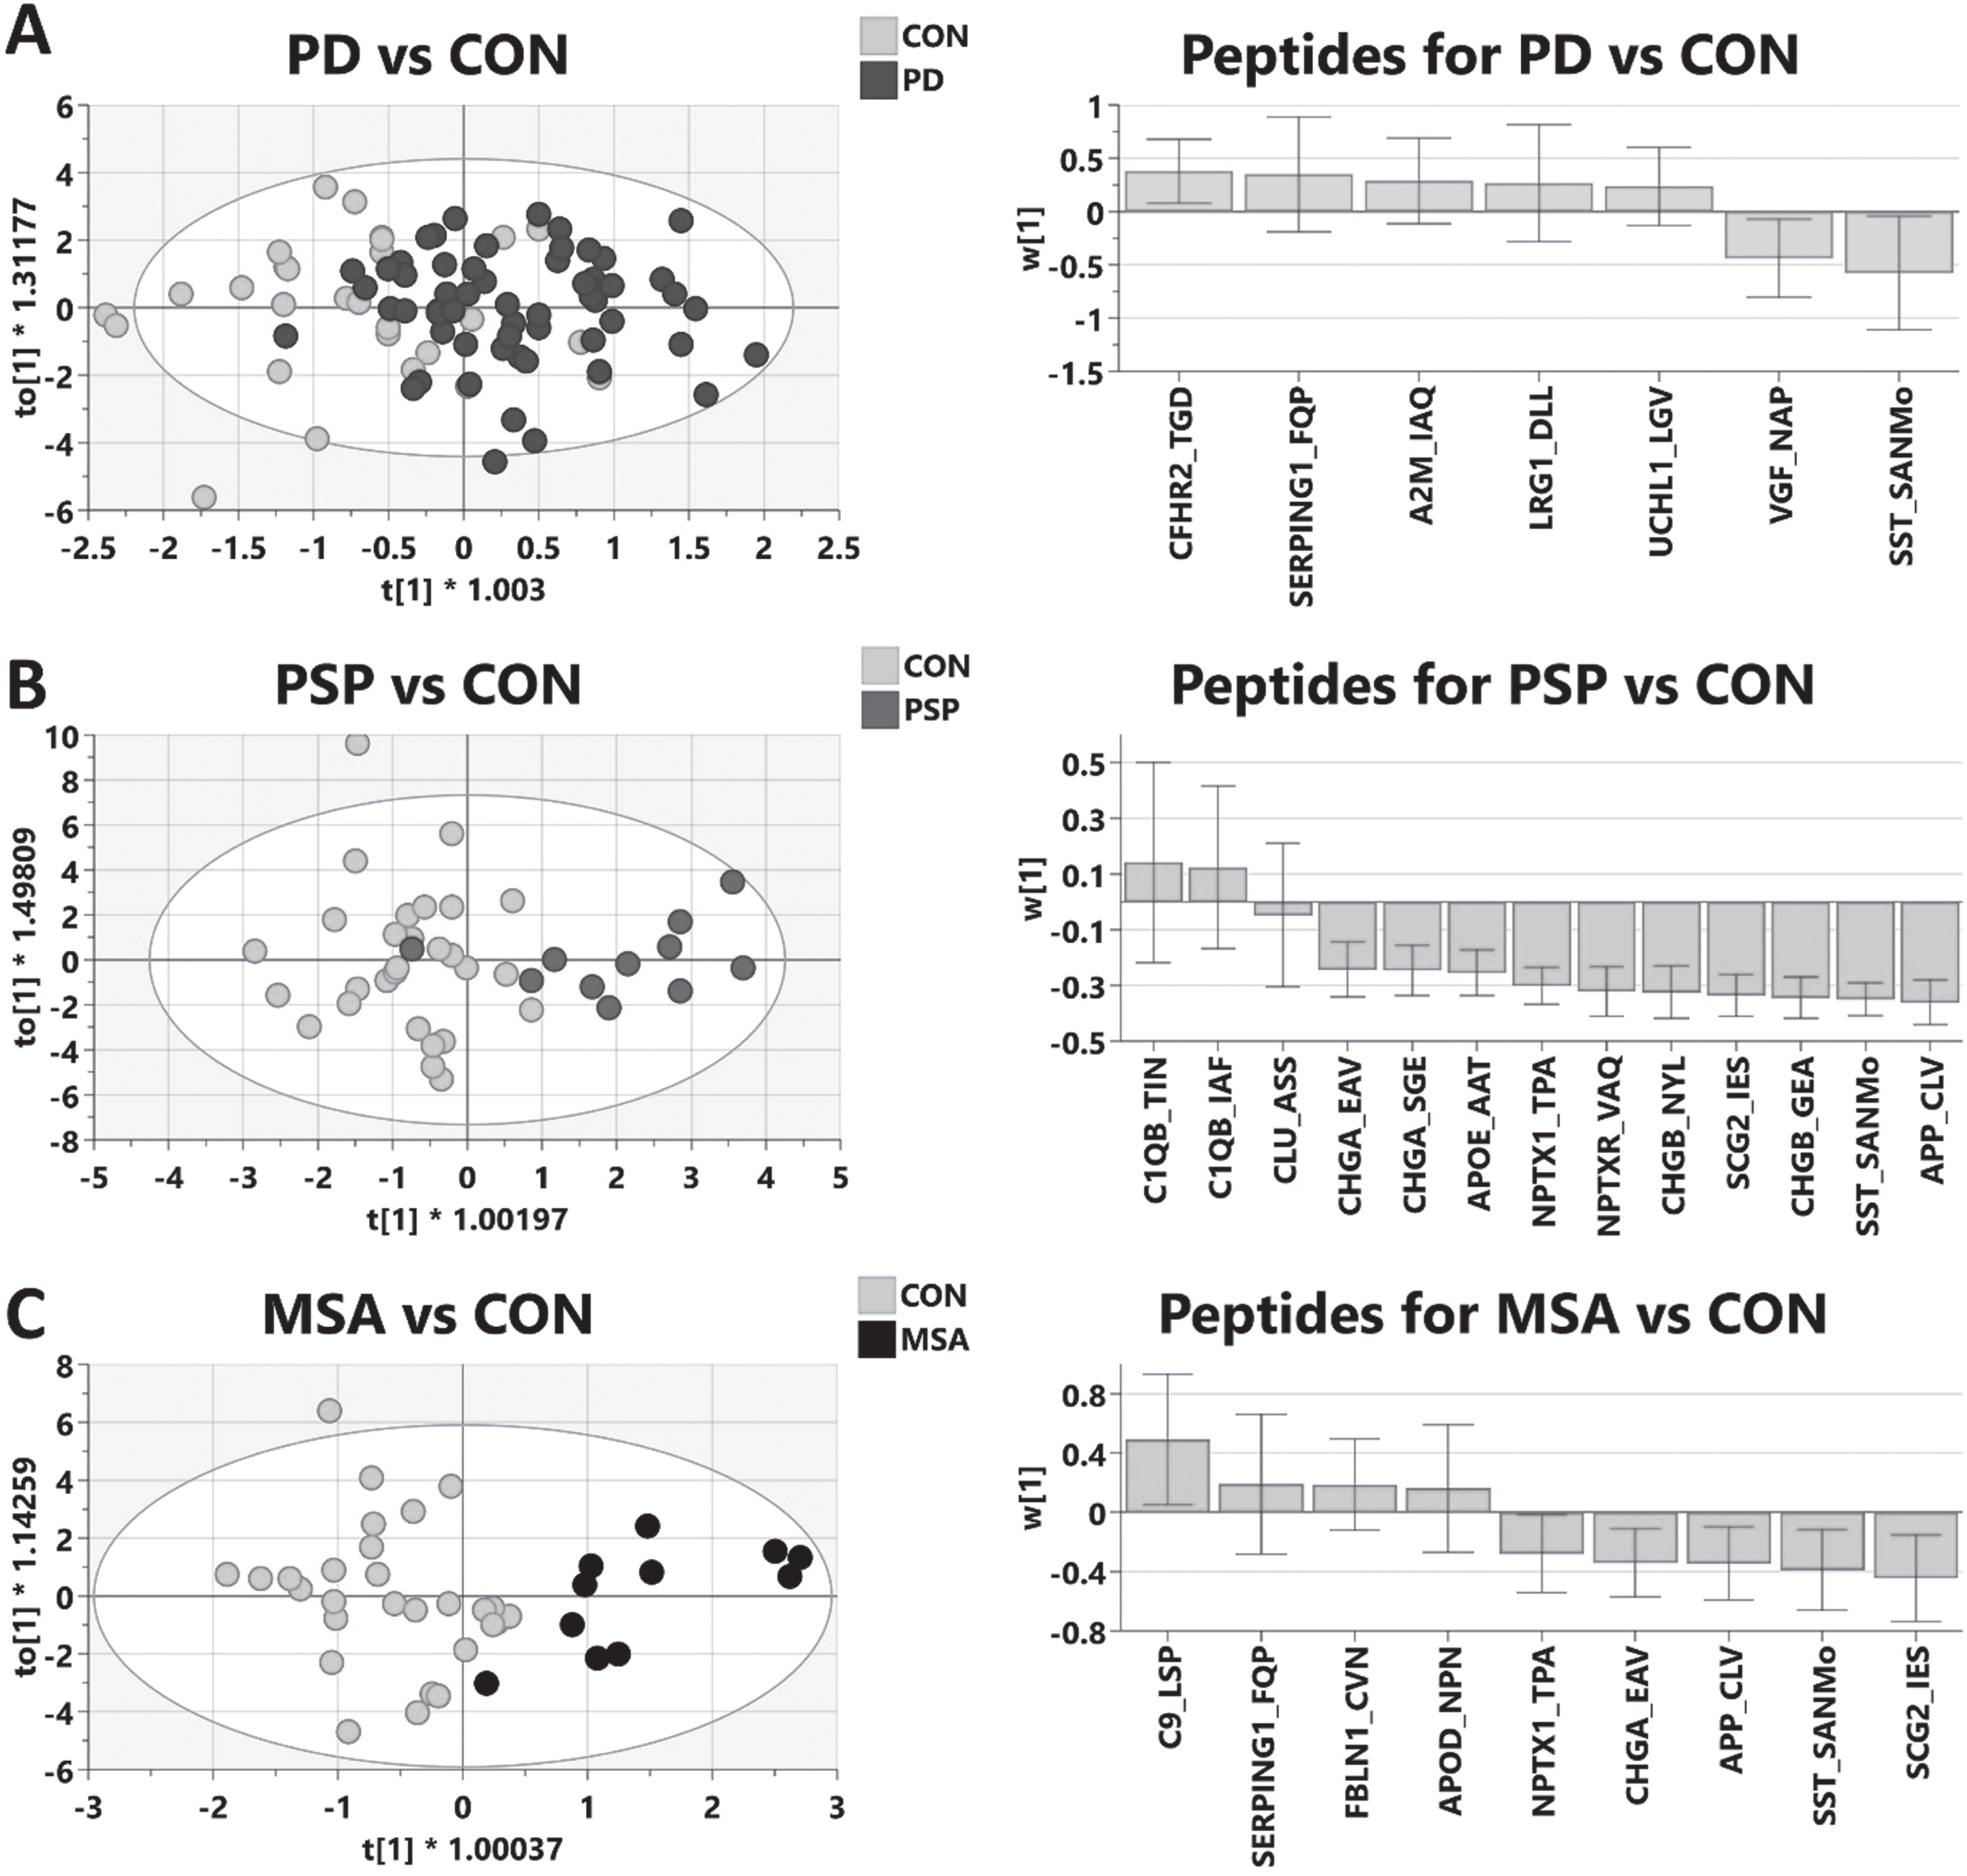
Linear Regression analysis using Elastic Net Regression (through R package “glmnet”) was used to identify the top 20 peptides by MRM for distinguishing between each disease and healthy controls (not shown). The 20 peptides were then used for OPLS-DA modeling, which was further optimized by removing peptides with high variation in cross validation weights. Figure 4 shows the optimized models for each disease vs. control. Clear separation of each disease vs. control was observed for the atypical parkinsonian disorders, MSA and PSP, but less significant and clinically useful for PD. In general, decreases in neuropeptides and increased inflammatory markers in CSF are consistent across all 3 diseases; and no significant models could be identified that distinguish between the parkinsonian disorders using these peptides. While somatostatin is important in all three models, VGF is only used in the optimized model for PD (Fig. 4A). Decreases in SCG2, CHGA, and CHGB were important in models for MSA and PSP, but not PD; and increases in two peptides for complement protein C1 (C1QB) were important in driving the PSP vs. control multivariate model (Fig. 4B). In the optimized model for the tauopathy PSP, APOE, and especially APP, were highly significant.
Fig. 4
Multivariate modeling of MRM validation comparing parkinsonian diseases to healthy control (CON). Linear regression analysis was employed to identify top candidates from MRM validation to build models for each disease. Further refinement results in optimized models shown. Left panels are OPLS-DA scores plots; right panels are weights of individual peptides contributing to optimized model.The positive weights indicate an increase in disease compared to control. Model statistics: A)PD (n = 59) vs. Control (n = 28): R2X = 0.933, R2Y = 0.339, Q2 = 0.24, p = 0.015; B) PSP (n = 11) vs. Control (n = 28): R2X = 0.921, R2Y = 0.631, Q2 = 0.563, p = 9.4e-5; C) MSA (n = 11) vs. Control (n = 28), R2X = 0.937, R2Y = 0.668, Q2 = 0.533, p = 0.0016.
PD clinical subgroup analysis
To investigate subgroup differences in candidate biomarkers, the PD patients were separated based upon clinical evaluations into those exhibiting distinct motor deficits, TD (n = 32) or PIGD (n = 16), and some classified as intermediate motor phenotype (other PD, n = 11). As shown in Table 3, the reduction in neuropeptides SST, VGF, and SCG2 compared to control samples is more pronounced in PIGD patients but is not significantly different between PIGD and TD. Conversely, the increases in inflammatory markers C9 and SERPINA1 were significant in TD compared to control, but not in PIGD. The most significant differences in MRM candidates between TD and PIGD patients were detected in clusterin (CLU/ApoJ) and fibulin-1 (FBLN1) (Table 3, right column). These proteins were not significantly different in the total PD cohort versus control but were significantly increased only in TD patients. Validation of these candidates in larger cohorts of tremor dominant PD patients may be informative of distinct molecular subtypes within the PD diagnosis.
Table 3
Univariate analysis of candidates among PD subgroups
| Peptide | PD (n = 59) vs. | PD with LK (n = 8) or | PD with tremor dominant | |||||||||
| Control (n = 28) | PDr (no LK, n = 51) | (n = 32) or PIGD (n = 16) | ||||||||||
| PD/Con | LK/Con | LK/PDr1 | PIGD/Control | Tremor/Control | PIGD/Tremor | |||||||
| ratio | p | ratio | p | ratio | p | ratio | p | ratio | p | ratio | p | |
| APP_CLV | 0.90 | 0.13 | 0.71 | 0.04* | 0.76 | 0.06 | 0.83 | 0.14 | 0.94 | 0.29 | 0.88 | 0.49 |
| C9_LSP | 1.25 | 0.05* | 1.24 | 0.18 | 0.99 | 0.89 | 1.27 | 0.13 | 1.31 | 0.03* | 0.97 | 0.91 |
| CFHR2_TGD | 1.17 | 0.04* | 1.10 | 0.51 | 0.93 | 0.54 | 1.15 | 0.13 | 1.18 | 0.11 | 0.98 | 0.72 |
| CLU_ASS | 1.08 | 0.10 | 0.90 | 0.59 | 0.81 | 0.14 | 0.94 | 1.00 | 1.14 | 0.03* | 0.82 | 0.05* |
| CPE_SNA | 0.99 | 0.63 | 0.84 | 0.24 | 0.83 | 0.03* | 0.93 | 1.00 | 1.02 | 0.47 | 0.91 | 0.55 |
| FBLN1_TGY | 1.09 | 0.07 | 0.96 | 0.72 | 0.87 | 0.18 | 1.00 | 0.51 | 1.15 | 0.03* | 0.88 | 0.02* |
| NPTX1_TPA | 0.85 | 0.32 | 0.61 | 0.03* | 0.68 | 0.02* | 0.76 | 0.19 | 0.89 | 0.52 | 0.85 | 0.38 |
| NPTXR_VAQ | 0.83 | 0.24 | 0.56 | 0.06 | 0.65 | 0.06 | 0.69 | 0.11 | 0.88 | 0.45 | 0.78 | 0.23 |
| NRCAM_IDG | 0.92 | 0.38 | 0.68 | 0.07 | 0.71 | 0.05* | 0.85 | 0.25 | 0.93 | 0.51 | 0.91 | 0.39 |
| OMG_SDT | 0.95 | 0.85 | 0.63 | 0.12 | 0.63 | 0.01* | 0.84 | 0.62 | 0.96 | 0.74 | 0.87 | 0.36 |
| SCG2_IES | 0.89 | 0.09 | 0.63 | 0.03* | 0.68 | 0.10 | 0.74 | 0.02* | 0.91 | 0.20 | 0.82 | 0.06 |
| SERPINA1_LSI | 1.24 | 0.05* | 1.16 | 0.54 | 0.93 | 0.52 | 1.19 | 0.20 | 1.28 | 0.05* | 0.93 | 0.66 |
| SST_SAN | 0.75 | 0.01* | 0.56 | 0.01* | 0.72 | 0.10 | 0.62 | 0.00* | 0.78 | 0.06 | 0.79 | 0.06 |
| UCHL1_LGV | 1.11 | 0.06 | 0.93 | 0.93 | 0.82 | 0.17 | 0.99 | 0.64 | 1.17 | 0.03* | 0.85 | 0.14 |
| VGF_NAP | 0.78 | 0.07 | 0.57 | 0.04* | 0.70 | 0.22 | 0.70 | 0.07 | 0.79 | 0.12 | 0.89 | 0.19 |
1PDr, PD without leukocytosis.* Mann Whitney U test, significant if below 0.05.
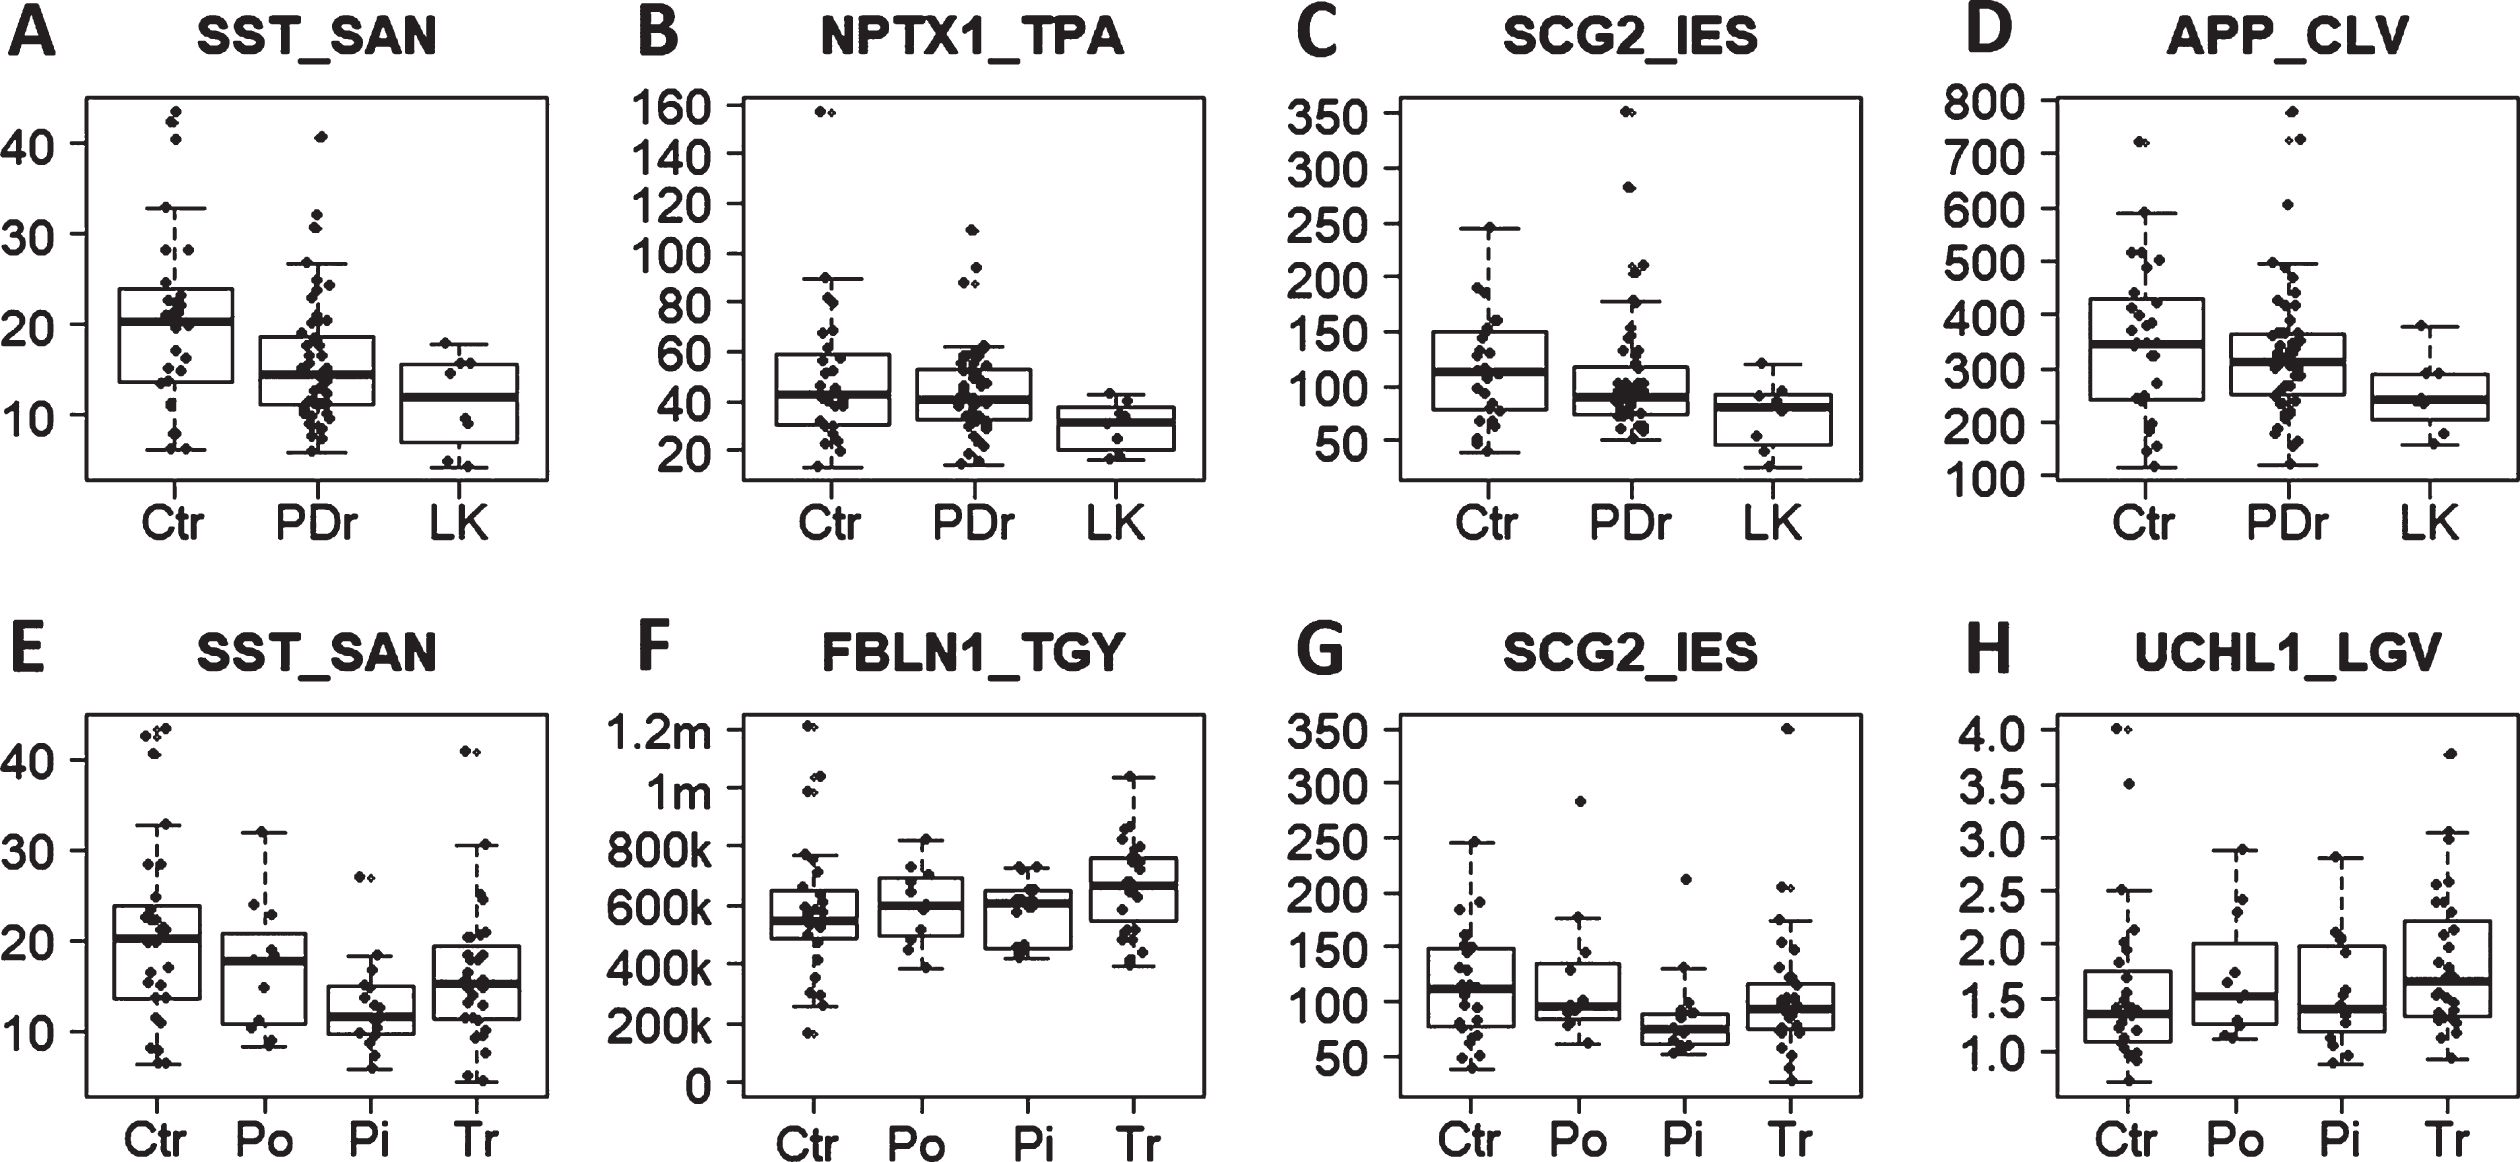
We also separated PD patients based on detection of any white blood cells in CSF (here termed leukocytosis, LK), which was detectable in 8 of 59 patients evaluated with the MRM assays. In general, reductions in neuropeptides were more severe in LK compared to the entire PD cohort, while increases in inflammatory markers were less pronounced in LK/control (Table 3), suggesting that increased inflammatory biomarkers in PD CSF are not caused by peripheral immune cell invasion. Several candidate biomarkers that were not significant by MRM for the entire PD cohort compared to control samples showed statistically significant decreases in the PD patients with detectable leukocytes in CSF. Carboxypeptidase E (CPE), NPTX1, neuronal cell adhesion molecule (NRCAM), and oligodendrocyte myelin glycoprotein (OMG) were all significantly reduced in LK PD compared to PD patients with no detectable leukocytes in CSF (Table 3). Scatterplots depict the spread of select biomarker measurements across PD subtypes in Figure 5. In general, there is considerable spread in control samples and overlap with all subtypes of PD, which limits diagnostic clinical utility; but subgroup differences do suggest some distinctions in molecular etiologies of different clinical subtypes of PD that warrant further investigation.
Fig. 5
Scatterplots of candidate biomarkers among PD subgroups and control. A-D)Candidate biomarker levels in control and PD with or without leukocytosis. Ctr, control; LK, PD with leukocytosis;PDr, remaining PD. E, F)Candidate levels in control (Ctr) and PD subgroups: Pi, postural instability and gait disturbance (PIGD); Tr, tremor dominant; Po,intermediate motor phenotype.FBLN1_TGY was quantified label free (no SIS peptide), so the y-axis for this peptide is the intensity. Other peptides were quantified by a spiked-in standard so the y-axis is the concentration of protein in ng/ml.
DISCUSSION
Validation of clinical utility of diagnostic biomarkers is important for optimized clinical trials and treatment but has been elusive for neurodegenerative diseases. To some extent, this is likely due to the fact that several distinct molecular etiologies have converged onto similar disease phenotypes by the time of clinical presentation. This pattern is observed in this study of early-stage parkinsonian patients; whereby we can detect significant differences in multiple candidate biomarkers between diseases and healthy controls, but insufficient to define a clinically useful diagnostic tool. Nonetheless, defining subgroups of clinical diagnoses early can help determine which patients are likely to be helped by mechanism specific medications. In this study, we observe distinct subsets of correlated biomarker proteins from dense-core vesicles or immune activation that show different patterns in small subgroups of TD or PIGD PD patients. We also identify two candidate biomarkers of TD patients that may define unique therapeutic targets or companion diagnostics for this subgroup of PD patients.
Several molecular mechanisms have been proposed as causative of PD including metabolic and mitochondrial deficits, oxidative stress, immune activation, and disruption of lysosomal, autophagy, and proteasomal mechanisms of proteostasis leading to an aSYN aggregation cascade. The multiplexed assays developed in this study and others are an effort to determine which mechanisms are paramount in each parkinsonian disorder or PD subgroup. The proteomic assays employed here are a compromise of sensitivity and robust quantitation. Our instrumentation and method limited the number of proteins we could detect in the depleted and raw CSF, but there is currently no more accurate method for measuring this number of proteins than mass spectrometry MRM. However, we are measuring high and middle abundant proteins that are normally present in CSF and exhibit considerable variation even within healthy control samples. So, while we detect statistically significant changes in many candidate biomarkers, some control patients show changes that overlap the variation detected in patients for all candidate biomarkers–a consistent problem for studies of CSF [15]. This is most apparent for markers of immune activation which increase sub-clinically with age and many different disease conditions. Also, total protein concentrations in CSF vary across individuals, time of day, and state of nutrition and general health. All these factors confound the validation and clinical utility of CSF protein biomarkers. Considering these issues, the number of samples would ideally be larger, especially for the MSA and PSP groups and the PD subgroups. Nonetheless, we can detect trends in biomarker patterns that may be indicative of distinct molecular mechanisms that should be evaluated in additional studies with larger cohorts, reference standards or protein ratios and additional statistical methods.
Additional studies on larger cohorts would be valuable for validation of the sex specific differences detected here, or in earlier studies [16]. Bigger increases in males with PD in immune activation markers including complement proteins and proteolysis regulators are an interesting finding. C9 (Fig. 3H) and SerpinA1 are significantly increased in men but not women with PD, which suggests sex specific disease etiologies. Since the alterations in several proteins detected in the entire cohort are driven by one sex, it represents a problem with interpretation of some of the data. More men are diagnosed with PD, and this has been the case with recruitment to the NYPUM cohort; but the controls samples are more balanced by sex. So while AZGP1 and ORM1 were detected as significant in the total PD cohort, this is caused by the higher levels in males, which are overrepresented in the patients compared to controls; these proteins are not significantly different in either sex analyzed individually (Supplementary Table 6). This was not the case for any other proteins measured, but it is a deficit of the study; recruitment of a more representative control population would be an improvement. Nonetheless, the finding that healthy women exhibit higher CSF levels of biomarkers for neurosecretory function and a larger deficit following progression to PD can have importance for sex specific therapeutic development.
One interesting pattern is reduced levels detected for the AD-related proteins, APP and ApoE and APLP2 in the tauopathy PSP, but not in the synucleinopathies PD and MSA. AD and PSP share the pathological feature of fibrillar deposits of the MAPT, which are generally detected less frequently in MSA and PD. APOE4 is the most important genetic risk factor for AD and aggregates of APP fragments (Aβ) are the defining pathological feature of AD. The APP peptide that was used for MRM in this study was detected at reduced levels in proteomic profiling of plasma of PSP patients (Zhu et al., unpublished). APP and the close homolog APLP2 share somewhat redundant functions in synaptic vesicle release and long-term potentiation and hippocampal function [17, 18]. Significant reductions in CSF APLP2 have been detected by other groups and may improve differential diagnosis of PSP [19]. Our untargeted profiling study also detected a significant decrease in CSF glutaminyl-peptide cyclotransferase (QPCT) in PSP. QPCT (glutaminyl cyclase (GC)) catalyzes pyroglutamination of fragments of APP to form pE-Aβ–a peptide that more effectively seeds aggregation of amyloid plaques [20]. Overall, there were significant changes in AD related proteins in the tauopathy PSP that were not detected in the synucleinopathies MSA and PD.
Comparison of MRM data for significant candidates with previously published data for Aβ, tau, and aSYN as measured by ELISA assays [21, 22] is shown in Supplementary Table 7. In control samples, the highest correlations for Aβ38 and Aβ40 were to the peptides involved in regulation and packaging into neurosecretory vesicles CHGA, SCG2, VGF, and SST. This is not surprising since Aβ peptides and processing enzymes are known to be localized in dense-core secretory vesicles [23]. In PD samples, much higher correlations were observed between Aβ38 and Aβ40 and these neurosecretory markers but also to synapse regulating proteins including NCAM1, NRCAM, and NPTXR1 (Supplementary Table 7 highlighted in pink). These fin-dings support the role of the neurosecretory pathway in Aβ processing [24], and suggest potential therapeutic targets for protein aggregation in multiple neurodegenerative diseases. Correlations were detected between phospho-tau and CHGA, VGF, NCAM1, and NRCAM in control samples, but these correlations were much higher in PD samples (Supplementary Table 7). Similarly, aSYN measurements were correlated to CHGA and VGF in control samples, but higher correlations were detected in PD samples as well as to NCAM1, NRCAM, and NPTRX (Supplementary Table 7).
In this study we have detected reduced CSF levels of the neuronal pentraxins NPTX1 and NPTXR in PSP and to a lesser extent MSA, but not the entire PD cohort. NPTX1 and NPTXR as well as NRCAM were decreased in PD patients with detectable leukocytes in CSF compared to PD without detectable leukocytes (Table 3). NPTX1 and NPTX2 are secreted from presynaptic membranes, form oligomeric complexes with NPTXR, and bind extracellular matrix proteins and regulate clustering of neurotransmitter receptors [25]. NPTX1 has been shown to decrease in AD CSF by targeted MS/MS [26] and NPTXR during AD progression [27, 28]. NPTX1 and NPTXR have been shown to decrease in CSF from patients with atypical parkinsonian disorders [19]. NPTX2 has been validated as reduced in CSF of patients with DLB by targeted MS and ELISA [29]. So, while nptx2 transcript has been shown to be dramatically upregulated in PD substantia nigra [30], the decrease in soluble forms in CSF is likely due to increased deposition of NPTX2 protein as detected in Lewy bodies in PD [30].
Two peptides significant in only the PD-LK patients compared to controls were NRCAM and OMG. NrCam has critical functions in remodeling of inhibitory synapses [31] and mediates contact between oligodendrocytes and axons [32]; and OMG is involved in cell adhesion for myelination in the CNS [33]. PD patients with leukocytes in CSF compared to those without leukocytes also showed more significant changes in neuropeptides and dense-core vesicle regulatory proteins including CPE (Table 3). CPE is a sorting and processing receptor for proteins into the regulatory secretory pathway including neuropeptides and neurotrophic factors [13]. These CPE functions and secretion of peptidergic transmission are suppressed by exogenous Aβ1–42 [34]. CPE has neurotrophic activities independent from processing of BDNF and other classic signals [35]; but considering that several dense core vesicle proteins are also altered in parkinsonian CSF, the CPE functions of importance in this regard may be related to neuropeptide processing. Clearly, deficits in regulation and secretion of dense-core vesicle signals including neuropeptides and neurotrophic factors can be detected in CSF from patients with parkinsonian disorders.
A protein significantly increased in all 3 diseases in the MRM assay is CFHR2–a regulator of complement proteins that binds lipids and regulates lipid metabolism [36]. Complement cascade proteins and extracellular proteases have critical functions in normal synaptic remodeling, modifying structural proteins and extracellular matrix proteins. CFHR2 was the only biomarker that was significantly different between fast and slow progressors in the MRM study (PD fast/PD slow = 0.85, p-value 0.028). PSP and MSA are faster progressing diseases and often show larger changes in fluid biomarkers that PD. So, it is not surprising that larger changes seen in the fast-progressing PD subgroup are similar to the atypical parkinsonian disorders. It was rather surprising that we did not detect more significant differences between the two PD subgroups defined by rate of disease progression.
A number of candidates in this study exhibit neuronal differentiation and survival or axon growth and guidance functions. We detect reduced CSF levels, significant in PSP, of NELL2–a secreted trimeric ligand for Robo3 that inhibits axon growth [37]. NELL2 is abundant in NPY and POMC expressing cells of the hypothalamus and functions in regulation of feeding in rats [38].
In the discovery profiling study, we detected 4 peptides from the transcription factor RREB1 in CSF (not shown). It may seem unusual for a predomina-ntly nuclear protein to be a candidate soluble bio-marker, but images from both the Human Protein Atlas (http://www.proteinatlas.org) and the Allen Brain Atlas indicate that in human brain sections, RREB1 protein is detected in cytoplasm, neurites, and neuropil [39]. RREB1 has been shown to form heteromeric complexes with DJ1 for gene regulation of the neuropeptide CCK1; and DJ1 is known to have additional roles in PD etiology outside of the nucleus. The structurally conserved RREB1 ortholog in Drosophila (hindsight/pebbled) has been shown to have critical functions in axonal morphology and degeneration [40], which were assumed to be based on gene regulation, but may be mediated by an RREB1 cytoplasmic or extracellular function. Since we do not detect fragment ions in all samples and no other groups have reported RREB1 in CSF, this candidate biomarker will need to be validated in additional studies. But it can be interesting to determine if RREB1 translocates from the nucleus, is secreted and functions in parkinsonian disorders. Within the nucleus RREB1 is aggregated in nuclear bodies or clastosomes, can function as a transcriptional repressor or activator, and interacts with NeuroD. RREB1 DNA binding sites have been found enriched in enhancers altered in epigenetics studies of PD postmortem brain tissue [41] and the RREB1 associated SNPs may have some correlation with PD [42, 43].
The correlation matrix of most significant proteins shown in Supplementary Figure 1 suggests there are patterns of neuropeptide related deficits distinct from immune activation markers. This is apparent in Table 4, which shows decreases in neuropeptide related proteins more significant in PSP, with increases in immune activation markers more pronounced in MSA and PD. An analogous pattern is also detected in the PIGD and TD subgroups of PD patients, suggesting that medications targeting protein aggregation may be more useful for PIGD and inflammation suppression preferential for TD patients. Another distinction in this MRM study was an increase in CLU and FBLN1 only in TD but not PIGD. CLU is a secreted chaperone able to inhibit aggregation of extracellular proteins including Aβ [44] and aSYN [45] and is detected in cortical Lewy bodies in DLB and glial cytoplasmic inclusions but with distinct patterns from aSYN [46]. A genetic variant of CLU is associated with increased risk of cognitive decline in PD [47]. FBLN1 is an extracellular matrix protein that has been identified as a candidate biomarker in PD CSF [48]. Validation of CLU and FBLN1 as distinct molecular markers of TD PD will require evaluation in larger cohorts.
Table 4
CSF proteins significantly altered in MRM assays in parkinsonian disorders and PD subgroups
| GENE | PROTEIN NAME | PSP vs.Con | MSA vs. Con | PD vs. Con | PD –PIGD | PD –TD | PD-LK vs. PD-noLK | FUNCTION/DISEASE CONNECTION |
| APOE | Apolipoprotein E | ↓ | AD gene | |||||
| APP | Amyloid precursor protein | ↓↓ | ↓ | ↓ | AD gene, Abeta precursor, synaptic vesicle release | |||
| APLP2 | Amyloid beta precursor-like protein 2 | ↓ | APP homolog, synaptic vesicle release | |||||
| VGF | Neurosecretory protein VGF | ↓↓ | ↓ | ↓ | ↓ | Neuropeptide precursor cleaved into 5 peptides | ||
| CHGB | Secretogranin-1 | ↓↓ | ↓ | Secretory granule protein cleaved into 3 peptides | ||||
| CHGA | Chromogranin A | ↓ | ↓ | Neuroendocrine regulator cleaved into 18 peptides | ||||
| SCG2 | Secretogranin-2 | ↓↓ | ↓ | ↓ | ↓ | Granule regulatory protein cleaved into 2 peptides | ||
| SST | Somatostatin | ↓↓ | ↓ | ↓ | ↓↓ | ↓ | Neuroendocrine peptide precursor | |
| CPE | Carboxypeptidase E | ↓ | ↓ | Secretory peptide processing, neuroprotective signal | ||||
| SCG5 | Neuroendocrine protein 7B2 | ↓ | Secretory granule chaperone detected in Lewy bodies | |||||
| LRG1 | Leucine-rich alpha-2-glycoprotein | ↑ | ↑ | ↑ | ↑ | Perivascular astrocyte expression, inflammatory marker | ||
| CFHR2 | Complement factor H-related protein 2 | ↑ | ↑ | ↑ | Lipid binding complement regulator | |||
| SERPINA1 | Alpha-1-antitrypsin | ↑ | ↑ | ↑ | Inhibitor of serine proteases, CSF increase in PDD | |||
| C9 | Complement component 9 | ↑ | ↑ | ↑ | ↑ | Key component of innate immune response | ||
| NELL2 | Protein kinase C-binding protein NELL2 | ↓ | ↓ | Secreted ligand for Robo3, neurotrophic function | ||||
| NPTX1 | Neuronal pentraxin-1 | ↓ | ↓ | Presynaptic ligand for NPTXR receptor clustering | ||||
| NPTXR | Neuronal pentraxin receptor | ↓↓ | ↓ | ↓ | Synaptic receptor for NPTX1/2 binding extracellular matrix | |||
| NRCAM | Neuronal cell adhesion molecule | ↓ | Synapse remodeling, axon oligodendrocyte connections | |||||
| OMG | Oligodendrocyte myelin glycoprotein | ↓ | Cell adhesion for myelination in CNS | |||||
| FBLN1 | Fibulin-1 | ↑ | Extracellular matrix protein binds APP | |||||
| CLU | Clusterin/ApoJ | ↑ | Chaperone, binds ubiquitin, targets ligands for degradation |
Recent findings using high resolution microscopy and lipidomics suggest that lipids and residual vesicle membranes are at the core of most Lewy bodies in postmortem brain sections from patients with PD [49]. There is also a growing realization that native amyloids when improperly regulated can play a significant role in seeding aggregation of other proteins, including aSYN [50]. Neuropeptides and granin proteins are such self-aggregating precursors that are targeted to the regulatory secretory pathway and dense-core vesicles. Secretory neuropeptides are synthesized as large precursor proproteins that form tight clusters with chaperone proteins and proteolytic enzymes via liquid-liquid phase separation (LLPS) and vesicularisation. Dopamine and melanin containing dense-core secretory vesicles are abundant in sn neurons and there is growing interest in disruption of LLPS in PD and other neurodegenerative diseases [51, 52]. Several recent studies have validated CSF neuropeptides and associated regulatory proteins as candidate biomarkers in neurodegenerative diseases [48] and our results suggest that monitoring of self-aggregating peptides during disease development may reveal molecular etiologies and improve diagnosis of parkinsonian disorders.
Significant findings from this study validate several previous reports of decreases in neuropeptide precursors in PD and other neurodegenerative disorders including VGF, CHGB, CHGA, SCG2, and SST [48, 53–55]. Decreases in all these proteins were most pronounced in CSF from atypical parkinsonian patients (Table 4).
In our untargeted discovery there was considerable difference in which peptides from the precursor proteins showed highest significance compared to control samples. In general, the most N-terminal peptides within a neuropeptide fragment showed biggest statistical differences (not shown); which may be due to degradation of native peptides from the C-terminal end. We have detected non-signaling/non-secreted fragments of some proteins that were significantly different (not shown). Additional work is needed to identify which native peptide fragments may be optimized biomarkers to identify early molecular etiologies of disease.
CHGB (SCG1)(secretogranin-1/neuroendocrine secretory granule peptide precursor) encodes a 677 amino acid (aa) precursor that interacts with LRKK2. The c-terminal region is cleaved into GAWK peptide, PE-11 and CCB peptide. The most significant peptides in our study derived from between aa 102–131 (not shown). CHGA (457 aa precursor) can be cleaved into 18 peptide chains, including catestatin which inhibits catecholamine release and serpinin which controls granin protein degradation. The most significant CHGA peptide for all 3 diseases in the profiling study is derived from the N-terminus of vasostatin-2. SCG2 (CHGC) is a 617 aa precursor from which are cleaved two known peptides, secretoneurin and manserin, neither of which was significant in our discovery study. Instead, peptides from region aa 217–256 were the best candidates, and were used for validation by MRM. Little is known about the function of peptides from this region, but this distinction may be a technical artifact of better performance of these peptides in MS assays. Nonetheless, SCG2 peptides have function on dopamine neurons [56] and can induce neuronal differentiation and maturations [57].
VGF encodes a 615 aa precursor protein for which we identified several candidate peptides in all three diseases. Additional smaller fragments are derived from proteolytic cleavage of VGF yielding at least 4 peptides, nerp-1, nerp-2, TLQP-21, and TLQP-62. Interestingly, while we detected peptides from the regions of VGF encompassing all these cleavage fragments in our discovery study, none of them were significantly different in any of the parkinsonian disorders. Instead, many tryptic digest peptides from the length of VGF not including the above cleavage fragments were seen to be significantly reduced in PD, PSP, and MSA in our profiling study. For validation we chose the N-terminal tryptic fragment (aa 485-95) from the NAPP-19 peptide [58]. Reduced levels of VGF in CSF has been demonstrated by targeted MS and ELISA in patients with DLB [29] and by targeted MS in patients with FTD [59]. Multiscale causal modeling of AD omics datasets suggests that VGF is a key regulator of AD [60] and a promising therapeutic candidate [61], possibly for multiple neurodegenerative disorders.
SST is a 116 amino acid precursor cleaved into three active peptides, SST-14, SST-28, and neurostatin. The only peptide that we detected in our profiling study was derived from SST-28 and was used for validation. Earlier studies have shown that SST-28 but not -14 was reduced in AD CSF [62]. SST was isolated in a de novo screen for proteins from human brain extracts that bind to oligomeric Aβ peptides [63]; the authors go on to show co-aggregation and to postulate that the native amyloid peptides present in dense core granules can be early seeds in other protein aggregation disorders [64].
Meta-analysis of over 100 proteomics studies demonstrated reductions in AD CSF levels of VGF, SCG2, SCG3, CHGA, NPTX1, and NPTXR [65]; so clearly these molecular deficits are not disease specific but are conserved across several protein-aggregation disorders. The fact that neuropeptide changes in CSF are apparent across several protein aggregation diseases suggest a similar mechanism of disruption in protein homeostasis with cell-type specificity resulting in distinct clinical presentations. This suggests it may be unlikely that targeting a single aggregating protein will stop disease progression, as has been borne out in repeated clinical trial failures [66]. Instead, this suggests a systemic protein misfolding that may be related to the liquid-liquid phase change (LLPC) described for stress granules, synaptic vesicles and aSYN [67]. Neuropeptide precursors are tightly packed into dense core vesicles in a phase change analogous to LLPC for other native protein aggregates. Liquid-liquid phase separation of scaffold proteins is required for assembly of synaptic active zones [68] and is a feature of neurodegeneration related proteins including aSYN and FUS [69]. Proteins and mechanisms regulating and orchestrating LLPC may be promising drug targets for neurodegenerative diseases which may be monitored with CSF levels of the peptides described here.
Disruption of this system can lead to neuropeptide precursor misfolding, retention of aggregate peptides in cells and reduced secretion of neuropeptides and neurotrophic factors. It is instructive to note that aSYN has been localized to these dense core vesicles [70], and a primary function of alpha-synuclein is regulation of dense-core vesicle secretion by interaction with vesicle membranes [71]. Together, these multiple lines of evidence in several studies suggests that alterations in CSF levels of dense-core vesicle components may anticipate early protein misfolding pathology in neurodegenerative disorders.
In conclusion, our untargeted CSF discovery and MRM validation indicates that several candidate biomarkers involved in synaptic function and neurosecretory regulation are similarly altered in the parkinsonian disorders PD, MSA, and PSP. The tauopathy PSP shows more significant changes in proteins related to AD, but we detect a correlation between neurosecretory function and Aβ42 peptide across all samples. In general, there is considerable conservation of molecular deficits in all parkinsonian disorders that has been apparent in many publications covering proteomics of neurodegeneration. This suggests that monitoring of self-aggregating proteins using multiplexed assays such as the MRM described here may offer a co-diagnostic platform for development of disease altering medications for neurodegeneration. Importantly, we have identified some novel candidate biomarkers that suggest therapeutic targets for parkinsonian disorders as well as subgroups of PD patients.
ACKNOWLEDGMENTS
The authors wish to thank: the patients and their families for contributing to research; the staff and management of the Swedish Metabolomics Centre and the Umeå Proteomics Core Facility for support and rental of instruments; the medical staff at the Department of Neurology, Norrland University Hospital, Umeå; and Atlas Antibodies for generous donation of QPrEST peptide standard samples.
Funding for this study was provided by the Er-ling Persson Family Foundation, Kempe Founda-tion, Parkinson Foundation of Sweden, Umeå Biotech Incubator, the Swedish Brain Foundation (Hjärnfonden), the Swedish Parkinson Research Foundation and the Swedish Research Council.
CONFLICT OF INTEREST
The authors declare that they have no competing financial interests.
SUPPLEMENTARY MATERIAL
[1] The supplementary material is available in the electronic version of this article: https://dx.doi.org/10.3233/JPD-213031.
REFERENCES
[1] | Williams DR , Lees AJ ((2009) ) Progressive supranuclear palsy: Clinicopathological concepts and diagnostic challenges. Lancet Neurol 8: , 270–279. |
[2] | Dickson DW ((2012) ) Parkinson’s disease and parkinsonism: Neuropathology. Cold Spring Harb Perspect Med 2: , a009258. |
[3] | Backstrom D , Granasen G , Domellof ME , Linder J , Jakobson Mo S , Riklund K , Zetterberg H , Blennow K , Forsgren L ((2018) ) Early predictors of mortality in parkinsonism and Parkinson disease: A population-based study. Neurology 91: , e2045–e2056. |
[4] | Gibb WR , Lees AJ ((1989) ) The significance of the Lewy body in the diagnosis of idiopathic Parkinson’s disease. Neuropathol Appl Neurobiol 15: , 27–44. |
[5] | Litvan I , Agid Y , Calne D , Campbell G , Dubois B , Duvoisin RC , Goetz CG , Golbe LI , Grafman J , Growdon JH , Hallett M , Jankovic J , Quinn NP , Tolosa E , Zee DS ((1996) ) Clinical research criteria for the diagnosis of progressive supranuclear palsy (Steele-Richardson-Olszewski syndrome): Report of the NINDS-SPSP international workshop. Neurology 47: , 1–9. |
[6] | Gilman S , Low PA , Quinn N , Albanese A , Ben-Shlomo Y , Fowler CJ , Kaufmann H , Klockgether T , Lang AE , Lantos PL , Litvan I , Mathias CJ , Oliver E , Robertson D , Schatz I , Wenning GK ((1999) ) Consensus statement on the diagnosis of multiple system atrophy. J Neurol Sci 163: , 94–98. |
[7] | Simuni T , Caspell-Garcia C , Coffey C , Lasch S , Tanner C , Marek K , Investigators P ((2016) ) How stable are Parkinson’s disease subtypes in de novo patients: Analysis of the PPMI cohort? Parkinsonism Relat Disord 28: , 62–67. |
[8] | Luo L , Andrews H , Alcalay RN , Poyraz FC , Boehme AK , Goldman JG , Xie T , Tuite P , Henchcliffe C , Hogarth P , Amara AW , Frank S , Sutherland M , Kopil C , Naito A , Kang UJ ((2019) ) Motor phenotype classification in moderate to advanced PD in BioFIND study. Parkinsonism Relat Disord 65: , 178–183. |
[9] | Distler U , Kuharev J , Navarro P , Levin Y , Schild H , Tenzer S ((2014) ) Drift time-specific collision energies enable deep-coverage data-independent acquisition proteomics. Nat Methods 11: , 167–170. |
[10] | Jonsson P , Wuolikainen A , Thysell E , Chorell E , Stattin P , Wikstrom P , Antti H ((2015) ) Constrained randomization and multivariate effect projections improve information extraction and biomarker pattern discovery in metabolomics studies involving dependent samples. Metabolomics 11: , 1667–1678. |
[11] | Yamane T , Suzui S , Kitaura H , Takahashi-Niki K , Iguchi-Ariga SM , Ariga H ((2013) ) Transcriptional activation of the cholecystokinin gene by DJ-1 through interaction of DJ-1 with RREB1 and the effect of DJ-1 on the cholecystokinin level in mice. PLoS One 8: , e78374. |
[12] | Tamargo RJ , Velayati A , Goldin E , Sidransky E ((2012) ) The role of saposin C in Gaucher disease. Mol Genet Metab 106: , 257–263. |
[13] | Xiao L , Chang SY , Xiong ZG , Selveraj P , Peng Loh Y ((2017) ) Absence of carboxypeptidase E/neurotrophic factor-alpha1 in knock-out mice leads to dysfunction of BDNF-TRKB signaling in hippocampus. J Mol Neurosci 62: , 79–87. |
[14] | Chaplot K , Jarvela TS , Lindberg I ((2020) ) Secreted chaperones in neurodegeneration. Front Aging Neurosci 12: , 268. |
[15] | Schilde LM , Kosters S , Steinbach S , Schork K , Eisenacher M , Galozzi S , Turewicz M , Barkovits K , Mollenhauer B , Marcus K , May C ((2018) ) Protein variability in cerebrospinal fluid and its possible implications for neurological protein biomarker research. PLoS One 13: , e0206478. |
[16] | Cerri S , Mus L , Blandini F ((2019) ) Parkinson’s disease in women and men: What’s the difference? J Parkinsons Dis 9: , 501–515. |
[17] | Fanutza T , Del Prete D , Ford MJ , Castillo PE , D’Adamio L ((2015) ) APP and APLP2 interact with the synaptic release machinery and facilitate transmitter release at hippocampal synapses. Elife 4: , e09743. |
[18] | Mehr A , Hick M , Ludewig S , Muller M , Herrmann U , von Engelhardt J , Wolfer DP , Korte M , Muller UC ((2020) ) Lack of APP and APLP2 in GABAergic forebrain neurons impairs synaptic plasticity and cognition. Cereb Cortex 30: , 4044–4063. |
[19] | Magdalinou NK , Noyce AJ , Pinto R , Lindstrom E , Holmen-Larsson J , Holtta M , Blennow K , Morris HR , Skillback T , Warner TT , Lees AJ , Pike I , Ward M , Zetterberg H , Gobom J ((2017) ) Identification of candidate cerebrospinal fluid biomarkers in parkinsonism using quantitative proteomics. Parkinsonism Relat Disord 37: , 65–71. |
[20] | Bridel C , Hoffmann T , Meyer A , Durieux S , Koel-Simmelink MA , Orth M , Scheltens P , Lues I , Teunissen CE ((2017) ) Glutaminyl cyclase activity correlates with levels of Abeta peptides and mediators of angiogenesis in cerebrospinal fluid of Alzheimer’s disease patients. Alzheimers Res Ther 9: , 38. |
[21] | Backstrom DC , Eriksson Domellof M , Linder J , Olsson B , Ohrfelt A , Trupp M , Zetterberg H , Blennow K , Forsgren L ((2015) ) Cerebrospinal fluid patterns and the risk of future dementia in early, incident Parkinson disease. JAMA Neurol 72: , 1175–1182. |
[22] | Trupp M , Jonsson P , Ohrfelt A , Zetterberg H , Obudulu O , Malm L , Wuolikainen A , Linder J , Moritz T , Blennow K , Antti H , Forsgren L ((2014) ) Metabolite and peptide levels in plasma and CSF differentiating healthy controls from patients with newly diagnosed Parkinson’s disease. J Parkinsons Dis 4: , 549–560. |
[23] | Cynis H , Funkelstein L , Toneff T , Mosier C , Ziegler M , Koch B , Demuth HU , Hook V ((2014) ) Pyroglutamate-amyloid-beta and glutaminyl cyclase are colocalized with amyloid-beta in secretory vesicles and undergo activity-dependent, regulated secretion. Neurodegener Dis 14: , 85–97. |
[24] | Mattsson N , Johansson P , Hansson O , Wallin A , Johansson JO , Andreasson U , Andersen O , Haghighi S , Olsson M , Stridsberg M , Svensson J , Blennow K , Zetterberg H ((2010) ) Converging pathways of chromogranin and amyloid metabolism in the brain. J Alzheimers Dis 20: , 1039–1049. |
[25] | Ferrer-Ferrer M , Dityatev A ((2018) ) Shaping synapses by the neural extracellular matrix. Front Neuroanat 12: , 40. |
[26] | Hendrickson RC , Lee AY , Song Q , Liaw A , Wiener M , Paweletz CP , Seeburger JL , Li J , Meng F , Deyanova EG , Mazur MT , Settlage RE , Zhao X , Southwick K , Du Y , Holder D , Sachs JR , Laterza OF , Dallob A , Chappell DL , Snyder K , Modur V , King E , Joachim C , Bondarenko AY , Shearman M , Soper KA , Smith AD , Potter WZ , Koblan KS , Sachs AB , Yates NA ((2015) ) High resolution discovery proteomics reveals candidate disease progression markers of Alzheimer’s disease in human cerebrospinal fluid. PLoS One 10: , e0135365. |
[27] | Begcevic I , Tsolaki M , Brinc D , Brown M , Martinez-Morillo E , Lazarou I , Kozori M , Tagaraki F , Nenopoulou S , Gkioka M , Lazarou E , Lim B , Batruch I , Diamandis EP ((2018) ) Neuronal pentraxin receptor-1 is a new cerebrospinal fluid biomarker of Alzheimer’s disease progression. F1000Res 7: , 1012. |
[28] | Lim B , Tsolaki M , Soosaipillai A , Brown M , Zilakaki M , Tagaraki F , Fotiou D , Koutsouraki E , Grosi E , Prassas I , Diamandis EP ((2019) ) Liquid biopsy of cerebrospinal fluid identifies neuronal pentraxin receptor (NPTXR) as a biomarker of progression of Alzheimer’s disease. Clin Chem Lab Med 57: , 1875–1881. |
[29] | van Steenoven I , Koel-Simmelink MJA , Vergouw LJM , Tijms BM , Piersma SR , Pham TV , Bridel C , Ferri GL , Cocco C , Noli B , Worley PF , Xiao MF , Xu D , Oeckl P , Otto M , van der Flier WM , de Jong FJ , Jimenez CR , Lemstra AW , Teunissen CE ((2020) ) Identification of novel cerebrospinal fluid biomarker candidates for dementia with Lewy bodies: A proteomic approach. Mol Neurodegener 15: , 36. |
[30] | Moran LB , Hickey L , Michael GJ , Derkacs M , Christian LM , Kalaitzakis ME , Pearce RK , Graeber MB ((2008) ) Neuronal pentraxin II is highly upregulated in Parkinson’s disease and a novel component of Lewy bodies. Acta Neuropathol 115: , 471–478. |
[31] | Takano T , Wallace JT , Baldwin KT , Purkey AM , Uezu A , Courtland JL , Soderblom EJ , Shimogori T , Maness PF , Eroglu C , Soderling SH ((2020) ) Chemico-genetic discovery of astrocytic control of inhibition in vivo. Nature 588: , 296–302. |
[32] | Sakurai T ((2012) ) The role of NrCAM in neural development and disorders–beyond a simple glue in the brain. Mol Cell Neurosci 49: , 351–363. |
[33] | Vourc’h P , Andres C ((2004) ) Oligodendrocyte myelin glycoprotein (OMgp): Evolution, structure and function. Brain Res Brain Res Rev 45: , 115–124. |
[34] | Pla V , Barranco N , Pozas E , Aguado F ((2017) ) Amyloid-beta impairs vesicular secretion in neuronal and astrocyte peptidergic transmission. Front Mol Neurosci 10: , 202. |
[35] | Xiao L , Sharma VK , Toulabi L , Yang X , Lee C , Abebe D , Peltekian A , Arnaoutova I , Lou H , Loh YP ((2021) ) Neurotrophic factor-alpha1, a novel tropin is critical for the prevention of stress-induced hippocampal CA3 cell death and cognitive dysfunction in mice: Comparison to BDNF. Transl Psychiatry 11: , 24. |
[36] | Eberhardt HU , Buhlmann D , Hortschansky P , Chen Q , Bohm S , Kemper MJ , Wallich R , Hartmann A , Hallstrom T , Zipfel PF , Skerka C ((2013) ) Human factor H-related protein 2 (CFHR2) regulates complement activation. PLoS One 8: , e78617. |
[37] | Pak JS , DeLoughery ZJ , Wang J , Acharya N , Park Y , Jaworski A , Ozkan E ((2020) ) NELL2-Robo3 complex structure reveals mechanisms of receptor activation for axon guidance. Nat Commun 11: , 1489. |
[38] | Jeong JK , Kim JG , Kim HR , Lee TH , Park JW , Lee BJ ((2017) ) A role of central NELL2 in the regulation of feeding behavior in rats. Mol Cells 40: , 186–194. |
[39] | Uhlen M , Fagerberg L , Hallstrom BM , Lindskog C , Oksvold P , Mardinoglu A , Sivertsson A , Kampf C , Sjostedt E , Asplund A , Olsson I , Edlund K , Lundberg E , Navani S , Szigyarto CA , Odeberg J , Djureinovic D , Takanen JO , Hober S , Alm T , Edqvist PH , Berling H , Tegel H , Mulder J , Rockberg J , Nilsson P , Schwenk JM , Hamsten M , von Feilitzen K , Forsberg M , Persson L , Johansson F , Zwahlen M , von Heijne G , Nielsen J , Ponten F ((2015) ) Proteomics. Tissue-based map of the human proteome. Science 347: , 1260419. |
[40] | Farley JE , Burdett TC , Barria R , Neukomm LJ , Kenna KP , Landers JE , Freeman MR ((2018) ) Transcription factor Pebbled/RREB1 regulates injury-induced axon degeneration. Proc Natl Acad Sci U S A 115: , 1358–1363. |
[41] | Marshall LL , Killinger BA , Ensink E , Li P , Li KX , Cui W , Lubben N , Weiland M , Wang X , Gordevicius J , Coetzee GA , Ma J , Jovinge S , Labrie V ((2020) ) Epigenomic analysis of Parkinson’s disease neurons identifies Tet2 loss as neuroprotective. Nat Neurosci 23: , 1203–1214. |
[42] | Rouillard AD , Gundersen GW , Fernandez NF , Wang Z , Monteiro CD , McDermott MG , Ma’ayan A ((2016) ) The harmonizome: A collection of processed datasets gathered to serve and mine knowledge about genes and proteins. Database (Oxford) 2016: , baw100. |
[43] | Fung HC , Scholz S , Matarin M , Simon-Sanchez J , Hernandez D , Britton A , Gibbs JR , Langefeld C , Stiegert ML , Schymick J , Okun MS , Mandel RJ , Fernandez HH , Foote KD , Rodriguez RL , Peckham E , De Vrieze FW , Gwinn-Hardy K , Hardy JA , Singleton A ((2006) ) Genome-wide genotyping in Parkinson’s disease and neurologically normal controls: First stage analysis and public release of data. Lancet Neurol 5: , 911–916. |
[44] | Matsubara E , Soto C , Governale S , Frangione B , Ghiso J ((1996) ) Apolipoprotein J and Alzheimer’s amyloid beta solubility. Biochem J 316 (Pt 2): , 671–679. |
[45] | Yerbury JJ , Poon S , Meehan S , Thompson B , Kumita JR , Dobson CM , Wilson MR ((2007) ) The extracellular chaperone clusterin influences amyloid formation and toxicity by interacting with prefibrillar structures. FASEB J 21: , 2312–2322. |
[46] | Sasaki K , Doh-ura K , Wakisaka Y , Iwaki T ((2002) ) Clusterin/apolipoprotein J is associated with cortical Lewy bodies: Immunohistochemical study in cases with alpha-synucleinopathies. Acta Neuropathol 104: , 225–230. |
[47] | Sampedro F , Marin-Lahoz J , Martinez-Horta S , Perez-Gonzalez R , Pagonabarraga J , Kulisevsky J ((2020) ) CLU rs11136000 promotes early cognitive decline in Parkinson’s disease. Mov Disord 35: , 508–513. |
[48] | Rotunno MS , Lane M , Zhang W , Wolf P , Oliva P , Viel C , Wills AM , Alcalay RN , Scherzer CR , Shihabuddin LS , Zhang K , Sardi SP ((2020) ) Cerebrospinal fluid proteomics implicates the granin family in Parkinson’s disease. Sci Rep 10: , 2479. |
[49] | Shahmoradian SH , Lewis AJ , Genoud C , Hench J , Moors TE , Navarro PP , Castano-Diez D , Schweighauser G , Graff-Meyer A , Goldie KN , Sutterlin R , Huisman E , Ingrassia A , Gier Y , Rozemuller AJM , Wang J , Paepe A , Erny J , Staempfli A , Hoernschemeyer J , Grosseruschkamp F , Niedieker D , El-Mashtoly SF , Quadri M , Van IWFJ , Bonifati V , Gerwert K , Bohrmann B , Frank S , Britschgi M , Stahlberg H , Van de Berg WDJ , Lauer ME ((2019) ) Lewy pathology in Parkinson’s disease consists of crowded organelles and lipid membranes. Nat Neurosci 22: , 1099–1109. |
[50] | Siegert A , Rankovic M , Favretto F , Ukmar-Godec T , Strohaker T , Becker S , Zweckstetter M ((2021) ) Interplay between tau and alpha-synuclein liquid-liquid phase separation. Protein Sci 30: , 1326–1336. |
[51] | Ray S , Singh N , Kumar R , Patel K , Pandey S , Datta D , Mahato J , Panigrahi R , Navalkar A , Mehra S , Gadhe L , Chatterjee D , Sawner AS , Maiti S , Bhatia S , Gerez JA , Chowdhury A , Kumar A , Padinhateeri R , Riek R , Krishnamoorthy G , Maji SK ((2020) ) alpha-Synuclein aggregation nucleates through liquid-liquid phase separation. Nat Chem 12: , 705–716. |
[52] | Zbinden A , Perez-Berlanga M , De Rossi P , Polymenidou M ((2020) ) Phase separation and neurodegenerative diseases: A disturbance in the force. Dev Cell 55: , 45–68. |
[53] | Gmitterova K , Varges D , Schmitz M , Zafar S , Maass F , Lingor P , Zerr I ((2020) ) Chromogranin A analysis in the differential diagnosis across Lewy body disorders. J Alzheimers Dis 73: , 1355–1361. |
[54] | Xu DJ , Wei LY , Li HF , Zhang WQ ((2019) ) Serum levels of chromogranins and secretogranins correlate with the progress and severity of Parkinson’s disease. Kaohsiung J Med Sci 35: , 146–150. |
[55] | van Steenoven I , Noli B , Cocco C , Ferri GL , Oeckl P , Otto M , Koel-Simmelink MJA , Bridel C , van der Flier WM , Lemstra AW , Teunissen CE ((2019) ) VGF peptides in cerebrospinal fluid of patients with dementia with Lewy bodies. Int J Mol Sci 20: . |
[56] | Wiedermann CJ ((2000) ) Secretoneurin: A functional neuropeptide in health and disease. Peptides 21: , 1289–1298. |
[57] | Kim HJ , Denli AM , Wright R , Baul TD , Clemenson GD , Morcos AS , Zhao C , Schafer ST , Gage FH , Kagalwala MN ((2015) ) REST regulates non-cell-autonomous neuronal differentiation and maturation of neural progenitor cells via secretogranin II. J Neurosci 35: , 14872–14884. |
[58] | Brancia C , Noli B , Boido M , Boi A , Puddu R , Borghero G , Marrosu F , Bongioanni P , Orru S , Manconi B , D’Amato F , Messana I , Vincenzoni F , Vercelli A , Ferri GL , Cocco C ((2016) ) VGF protein and its C-terminal derived peptides in amyotrophic lateral sclerosis: Human and animal model studies. PLoS One 11: , e0164689. |
[59] | van der Ende EL , Meeter LH , Stingl C , van Rooij JGJ , Stoop MP , Nijholt DAT , Sanchez-Valle R , Graff C , Oijerstedt L , Grossman M , McMillan C , Pijnenburg YAL , Laforce R Jr., Binetti G , Benussi L , Ghidoni R , Luider TM , Seelaar H , van Swieten JC ((2019) ) Novel CSF biomarkers in genetic frontotemporal dementia identified by proteomics. Ann Clin Transl Neurol 6: , 698–707. |
[60] | Beckmann ND , Lin WJ , Wang M , Cohain AT , Charney AW , Wang P , Ma W , Wang YC , Jiang C , Audrain M , Comella PH , Fakira AK , Hariharan SP , Belbin GM , Girdhar K , Levey AI , Seyfried NT , Dammer EB , Duong D , Lah JJ , Haure-Mirande JV , Shackleton B , Fanutza T , Blitzer R , Kenny E , Zhu J , Haroutunian V , Katsel P , Gandy S , Tu Z , Ehrlich ME , Zhang B , Salton SR , Schadt EE ((2020) ) Multiscale causal networks identify VGF as a key regulator of Alzheimer’s disease. Nat Commun 11: , 3942. |
[61] | El Gaamouch F , Audrain M , Lin WJ , Beckmann N , Jiang C , Hariharan S , Heeger PS , Schadt EE , Gandy S , Ehrlich ME , Salton SR ((2020) ) VGF-derived peptide TLQP-21 modulates microglial function through C3aR1 signaling pathways and reduces neuropathology in 5xFAD mice. Mol Neurodegener 15: , 4. |
[62] | Yasuda M , Maeda K , Kakigi T , Minamitani N , Kawaguchi T , Tanaka C ((1995) ) Low cerebrospinal fluid concentrations of peptide histidine valine and somatostatin-28 in Alzheimer’s disease: Altered processing of prepro-vasoactive intestinal peptide and prepro-somatostatin. Neuropeptides 29: , 325–330. |
[63] | Wang H , Muiznieks LD , Ghosh P , Williams D , Solarski M , Fang A , Ruiz-Riquelme A , Pomes R , Watts JC , Chakrabartty A , Wille H , Sharpe S , Schmitt-Ulms G ((2017) ) Somatostatin binds to the human amyloid beta peptide and favors the formation of distinct oligomers. Elife 6: , e28401. |
[64] | Lau A , Bourkas M , Lu YQQ , Ostrowski LA , Weber-Adrian D , Figueiredo C , Arshad H , Shoaei SZS , Morrone CD , Matan-Lithwick S , Abraham KJ , Wang H , Schmitt-Ulms G ((2017) ) Functional amyloids and their possible influence on Alzheimer disease. Discoveries (Craiova) 5: , e79. |
[65] | Pedrero-Prieto CM , Garcia-Carpintero S , Frontinan-Rubio J , Llanos-Gonzalez E , Aguilera Garcia C , Alcain FJ , Lindberg I , Duran-Prado M , Peinado JR , Rabanal-Ruiz Y ((2020) ) A comprehensive systematic review of CSF proteins and peptides that define Alzheimer’s disease. Clin Proteomics 17: , 21. |
[66] | Alexander GC , Emerson S , Kesselheim AS ((2021) ) Evaluation of Aducanumab for Alzheimer disease: Scientific evidence and regulatory review involving efficacy, safety, and futility. JAMA 325: , 1717–1718. |
[67] | Darling AL , Shorter J ((2021) ) Combating deleterious phase transitions in neurodegenerative disease. Biochim Biophys Acta Mol Cell Res 1868: , 118984. |
[68] | McDonald NA , Fetter RD , Shen K ((2020) ) Assembly of synaptic active zones requires phase separation of scaffold molecules. Nature 588: , 454–458. |
[69] | Patel A , Lee HO , Jawerth L , Maharana S , Jahnel M , Hein MY , Stoynov S , Mahamid J , Saha S , Franzmann TM , Pozniakovski A , Poser I , Maghelli N , Royer LA , Weigert M , Myers EW , Grill S , Drechsel D , Hyman AA , Alberti S ((2015) ) A liquid-to-solid phase transition of the ALS protein FUS accelerated by disease mutation. Cell 162: , 1066–1077. |
[70] | Logan T , Bendor J , Toupin C , Thorn K , Edwards RH ((2017) ) alpha-Synuclein promotes dilation of the exocytotic fusion pore. Nat Neurosci 20: , 681–689. |
[71] | Sulzer D , Edwards RH ((2019) ) The physiological role of alpha-synuclein and its relationship to Parkinson’s disease. J Neurochem 150: , 475–486. |


