
Non-Genetic Risk Factors for Parkinson’s Disease: An Overview of 46 Systematic Reviews
Abstract
Background:
Numerous systematic reviews (SRs) and meta-analyses on non-genetic risk factors for Parkinson’s disease (PD) development have been published with inconsistent conclusions.
Objective:
This overview of SRs aimed to summarize evidence on non-genetic factors for the development of PD from the published SRs, and explore the reasons behind the conflicting results.
Methods:
Three international databases were searched for SRs with meta-analyses summarized evidence on non-genetic factors for PD development. The Assessing the Methodological Quality of Systematic Reviews 2 tool was used to appraise the methodological quality of included SRs. Pooled effect estimations were extracted from each meta-analysis.
Results:
Forty-six SRs covered six categories, and more than 80 factors were included in this overview. Thirty-nine SRs (84.7%) were judged to be of critically low methodological quality. Evidence from prospective studies showed that physical activity, smoking, coffee, caffeine, tea, fat intake, ibuprofen use, calcium channel blocker use, statin use, thiazolidinediones, and high serum urate levels significantly reduced the risk of PD, while dairy intake, diabetes, hormone replacement therapy, depression, mood disorder, bipolar disorder, and aspirin use significantly increased the risk of PD. Differences in study designs (e.g., cohort studies, case-control studies) accounted for the conflicting results among included SRs.
Conclusion:
Modifiable lifestyle factors such as physical activity and tea and coffee drinking may reduce the risk of PD, which may offer PD prevention strategies and hypotheses for future research. However, the designs of primary studies on PD risk factors and related SRs need to be improved and harmonized.
INTRODUCTION
Parkinson’s disease (PD) is a complex neurodegenerative disorder with classical motor features, in-cluding bradykinesia, muscular rigidity, rest tremor, and postural and gait impairment [1]. The loss of dopaminergic neurons within the substantia nigra pars compacta (SNpc) and widespread intracellular protein (α-synuclein) accumulation are the crucial pathological features of PD [2]. PD is the second most common neurodegenerative disease [3]. Based on the latest report from the Global Burden of Disease, the number of PD patients worldwide increased from 2.5 million in 1990 to 6.1 million in 2016 [4]. The age-standardized prevalence of PD by region varied from 30 to 40 per 100,000 individuals in sub-Saharan Africa to 170 to 180 per 100,000 in high-income North America [4]. Globally, PD caused 211,296 deaths and 3.2 million disability-adjusted life-years in 2016, which was 2.5 times and 2.6 times higher than in 1990, respectively [4]. Furthermore, all motor and non-motor symptoms (e.g., olfactory dysfunction, cognitive impairment, psychiatric symptoms, sleep disorders, autonomic dysfunction, pain, and fatigue [1]) significantly affect the quality of life of patients with PD [5, 6].
Although the exact cause of PD remains unknown, it is well recognized that both genetic and non-genetic factors contribute to its development [7, 8]. As the majority of PD cases are sporadic and genetic factors can only explain to a small degree the risk of sporadic PD [9, 10], research on non-genetic factors involved in PD development is vital. Furthermore, the clinical diagnosis of PD is preceded by a prodromal phase of PD that can span several years or even decades [10]. Non-genetic factors may trigger PD pathogenesis and alter its progression during this phase [11]. Accordingly, identifying potentially modifiable non-genetic factors and establishing accurate predictive values of risk factors will contribute to PD prevention and improve PD prediction approaches [12].
Numerous systematic reviews (SRs) and meta-analyses on non-genetic risk factors for PD development have been published [13–20], with several inconsistent results. For example, one SR found that diabetes decreased the risk of PD [21], while another did not confirm this association [22]. The reasons underlying this inconsistency may be due to the heterogeneity in samples (e.g., population-based, clinical cohorts), methods (e.g., design of the original study), or the methodological quality of the SRs. An overview of the SRs may elucidate the reasons behind the inconsistent findings.
In the present study, we conducted an overview of SRs to: 1) summarize the evidence on non-genetic factors contributing to the development of PD, 2) assess the methodological quality of the published SRs, and 3) explore the reasons behind the conflicting results reported.
METHODS
Search strategy and eligibility criteria
This overview of SRs has been registered on PROSPERO (CRD42020189790). An SR on non-genetic risk factors for PD was included if it met all of the following criteria: 1) at least one risk factor for PD development had been investigated; 2) the study design of included primary studies was clearly stated; 3) at least one meta-analysis had been conducted to quantitatively synthesize the association between the risk factor and PD development.
An SR was excluded if it 1) focused on genetic factors involved in PD development; 2) included animal studies; or 3) was a commentary, editorial, letter, reply, protocol, or withdrawn article. When more than one SR with meta-analysis focused on the same factor, we compared the results to determine the consistency of qualitative conclusions. If the results were consistent, for example, if all indicated it was a protective factor for PD development, we retained the SR that included the largest number of original studies. Otherwise, all versions were kept to allow us to explore the reasons behind the inconsistency.
A comprehensive literature search was conducted using Medline, Embase, and PsycINFO through the Ovid platform from January 2011 to June 2020 without language restrictions. Specialized search filters were used to identify SRs [23–25], and we manually checked the reference lists of the included SRs for any others that may have been missed. The detailed search strategies are described in the Supplementary Material.
Literature selection, data extraction, and methodological quality assessment
Two review authors independently screened all of the citations for potentially eligible articles and extracted information from each included SR. Any conflicts were resolved through discussion, by referring to the original publication, or by consulting a third senior author.
The following information was extracted from each included SR: characteristics of the SR, including the first author’s name, year of publication, and the number of included studies and participants; characteristics of the original studies included in SRs, such as study design, the studied risk factor, methods used for exposure assessment, diagnostic criteria for PD, follow-up duration of cohort studies, and risk of bias; details on participants’ characteristics, including age, sex, and region; pooled effect estimation for each risk factor with the corresponding 95%confidence interval (CI), and results from subgroup meta-analyses.
The methodological quality of the included SRs was appraised using the Assessing the Methodological Quality of Systematic Reviews 2 (AMSTAR-2) tool [26], which is a validated tool for critical appraisal of SRs. AMSTAR-2 contains 16 items, seven of which are critical [26]. The overall quality (high, moderate, low, or critically low) of each SR was generated based on the ratings from critical and non-critical items. Two trained review authors completed the methodological quality assessment independently, with disagreements resolved by consensus or arbitration by a third senior investigator. Details of the AMSTAR-2 are presented in the Supplementary Material.
Data synthesis
Associations between risk factors and PD development were synthesized and reviewed based on each risk factor. To measure the association between a factor and PD development across primary studies, we used the pooled relative risk (RR), odds ratio (OR), or hazard ratio (HR) for dichotomous outcomes and the weighted mean difference (WMD) or standard mean difference (SMD) for continuous outcomes, accompanied by their respective 95%CIs. The pooled effect estimations were extracted from each meta-analysis, as well as the results from each subgroup meta-analysis. I2 values were extracted to measure heterogeneity. I2 values of < 25%, 25%–50%, and > 50%indicated of the presence of low, moderate, and high heterogeneity, respectively [27].
Ethics approval and consent to participate
Neither specific patient consent nor ethics committee approval was required because we used published articles that were obtained from open-access databases.
RESULTS
Study selection
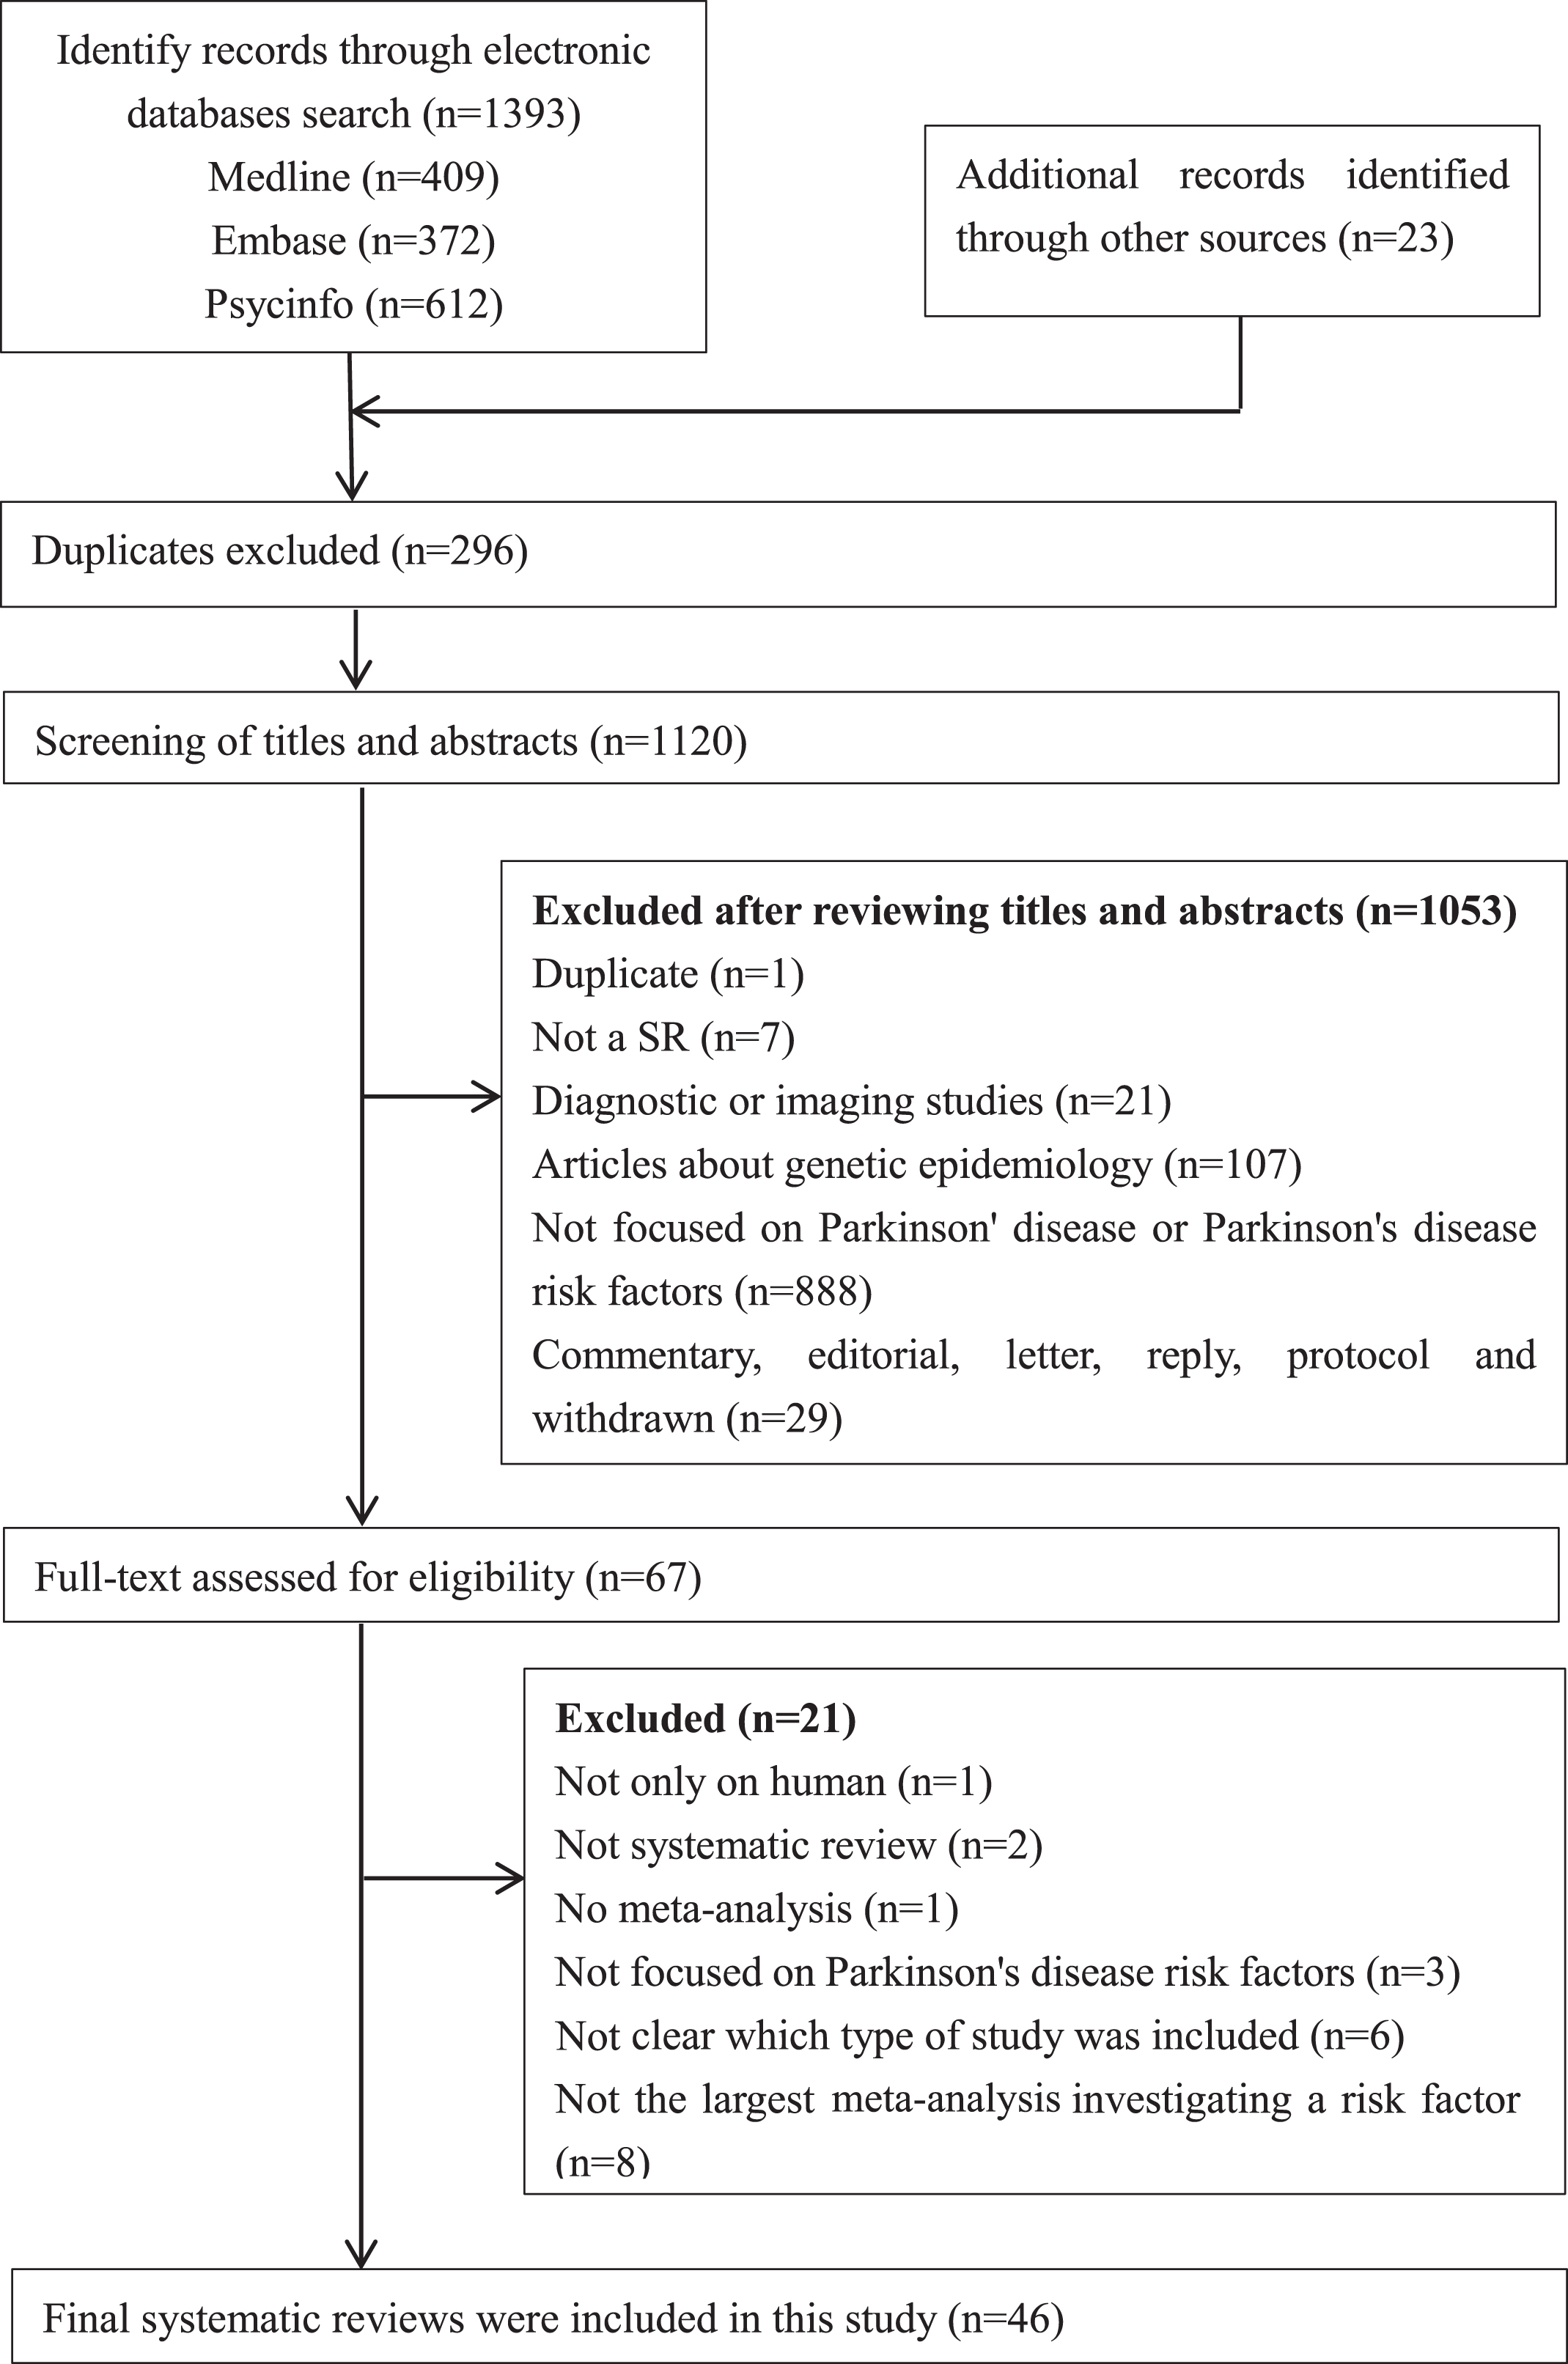
Our literature search identified 1,416 records, of which 46 SRs [13–22, 28–63] were eligible and included in this overview. Details of the literature search and selection are presented in Fig. 1.
Fig. 1
PRISMA flowchart: the screening and selection process. Note: PRISMA, Preferred Reporting Items for Systematic Reviews and Meta-Analyses.
Characteristics of included systematic reviews
The 46 SRs were published between 2011 and 2020, and all were published in English. The characteristics of these SRs are shown in Table 1.
Table 1
Main characteristics of included systematic reviews with meta-analysis on risk factors for the development of Parkinson’s disease
| Author, Year | Studies, n (participants, n) | Study design of included studies | Median follow up duration (years)a | Region of the participants | Age range (years) | No. of male (%) | No. of PD patients | Diagnostic criteria for PDb | Risk factors studiedc | No. (%) of studies with low risk of bias |
| Gao et al. 2011 [28] | 6 (NR) | Co, NCC | NR | Europe, America | NR | NR | 2779 | 3, 5 | Drugs | No assessment |
| Mortimer et al. 2012 [29] | 13 (NR) | CC, Co | NR | Europe | NR | NR | 3660 | 3, 4 | Environmental agents | No assessment |
| Noyce et al. 2012 [22] | 202 (5266250) | CC, Co | 12.5 | Europe, America, Asia, Oceania | Mean: 51.5–78.1 | 9 (28.1)–47351 (100.0) | 109062 | 1, 3 | Habits, medical history and comorbid diseases, drugs, environmental agents | No assessment |
| Gudala et al. 2013 [30] | 8 (246112) | CC, Co | 18.1 | Europe, America, Asia | 25.0–93.0 | NR | 5488 | 3 | Biomarkers | 3 (37.5) |
| Jafari et al. 2013 [31] | 22 (97372) | CC, Co, NCC | NR | NR | NR | NR | 18344 | 1, 3, 5, 6, 7 | Medical history | 13 (59.1) |
| Pezzoli et al. 2013 [32] | 104 (NR) | CC, Co | NR | NR | NR | NR | NR | 3, 5 | Environmental agents | NR |
| Shen et al. 2013 [33] | 6 (33185) | Co, NCC | 15.5 | Europe, America | 30.0–78.0 | NR | 578 | 3, 4, 5 | Biomarkers, comorbid diseases | NR |
| Shen et al. 2013 [34] | 6 (2493) | CC | NA | Europe, America, Asia | NR | 1379 (55.3)d | 1217 | 1 | Biomarkers | No assessment |
| Chen et al. 2014 [35] | 7 (5686796) | CC, Co | NR | Europe, America | NR | NR | 2857 | NR | Biomarkers | No assessment |
| Jiang et al. 2014 [36] | 5 (304193) | Co | 12.0 | Europe, America | NR | NR | 1083 | NR | Dietary factors | No assessment |
| Lu et al. 2014 [21] | 14 (105974) | CC | NA | Europe, America, Asia | Mean: 58.1–73.0 | NR | 21395 | 1, 3, 4, 7 | Comorbid diseases | 6 (42.9) |
| Qi et al. 2014 [37] | 28 (1739383) | CC, Co, NCC | NR | Europe, America, Asia | NR | NR | 5143 | NR | Habits | No assessment |
| Takeda et al. 2014 [38] | 13 (130274) | CC, Co, CS | NR | NR | NR | NR | NR | NR | Dietary factors | NR |
| Wang et al. 2014 [39] | 14 (513343) | CC, Co | NR | Europe, America | NR | NR | 2944 | NR | Drugs | 10 (71.4) |
| Zhang et al. 2014 [40] | 32 (677550) | CC, Co | NR | Europe, America, Asia | NR | NR | 10409 | 3 | Habits | 11 (34.4) |
| Adams et al. 2015 [49] | 9 (741593) | CC, Co | 15.0 | NR | Mean: 54.9–75.0 | 0 (0.0)–33901 (100.0) | 11242 | 1 | Comorbid diseases | 8 (88.9) |
| Cheng et al. 2015 [41] | 5 (126507) | CC, Co | 16 | America, Asia | Mean: 67.0–71.0 | NR (37.3–63.0) | 1467 | 3 | Dietary factors | 5 (100.0) |
| Huss et al. 2015 [42] | 11 (NR) | CC, Co | NR | Europe, America | NR | NR | 63096 | 3, 4 | Environmental agents | No assessment |
| Lang et al. 2015 [43] | 5 (456441) | CC, Co | 8.0 | Europe, America | 30.0–89.0 | NR | 6709 | 3, 5 | Drugs | 2 (40.0) |
| Palin et al. 2015 [44] | 14 (11662) | CC | NR | Europe, America, Asia | NR | NR | 4483 | 1, 3, 5 | Environmental agents | No assessment |
| Shen et al. 2015 [45] | 7 (26941) | CC, Co, CS | NR | America, Asia | Mean: 64.0–71.2 | NR | 5690 | NR | Habits, Biomarkers | No assessment |
| Ungprasert et al. 2015 [46] | 5 (9325833) | CC, Co | 8.0 | Europe, America, Asia | Mean: 68.7–75.0 | NR (51.7–60.1) | 235299 | 1, 2, 3 | Comorbid diseases | 2 (40.0) |
| Wang et al. 2015 [47] | 14 (839890) | CC, Co | NR | NR | 20.0–87.0 | NR | 9254 | NR | Dietary factors | No assessment |
| Wang et al. 2015 [48] | 10 (430854) | Co, NCC | 16.4 | Europe, America, Asia | 20.0–86.0 | NR | 2706 | NR | Biomarkers | No assessment |
| Gao et al. 2016 [51] | 7 (175261) | Co, NCC | NR | NR | NR | NR | 388 | 3, 5, 7 | Biomarkers | No assessment |
| Sheng et al. 2016 [52] | 11 (2787249) | CC, Co | 8.5 | Europe, America, Asia | NR | NR | 18316 | NR | Drugs, biomarkers | 9 (81.8) |
| Bai et al. 2016 [50] | 11 (3513209) | CC, Co | 9.5 | Europe, America, Asia | NR | NR | 21011 | 3, 4, 5, 6 | Drugs | 7 (63.6) |
| Bykov et al. 2017 [53] | 10 (NR) | CC, Co | 8.5 | Europe, America, Asia | NR | NR | NR | 3, 4, 5 | Drugs | No assessment |
| Hughes et al. 2017 [54] | 7 (477422) | Co | NR | Europe, America, Asia | NR | 4733 (34.8)–51529 (100.0) | 2207 | 3, 5 | Dietary factors | No assessment |
| Lv et al. 2017 [55] | 11 (354238) | CC, Co | NR | Europe, America, Asia | NR | NR | 2457 | NR | Medical history, drugs | 5 (45.5) |
| Milani et al. 2017 [56] | 53 (NR) | CC | NA | Europe, America, Asia | Mean: 77.4–87.8 | NR (20.0–61.3) | NR | 3 | Comorbid diseases | No assessment |
| Mostile et al. 2017 [57] | 23 (3491) | CC | NA | Europe, America, Asia | Mean: 53.7–71.1 | 30 (40.5)–30 (76.9)e | 1526 | 1 | Biomarkers | No assessment |
| Fang et al. 2018 [58] | 8 (544336) | Co, NCC | 12.0 | Europe, America | 30.0–71.0 | NR | 2192 | NR | Habits | 7 (87.5) |
| Jin et al. 2018 [59] | 17 (3890) | CC | NA | Europe, America, Asia, Africa | Mean: 44.8–67.0 | NR (40.0–92.3) | 1203 | NR | Biomarkers | No assessment |
| Luo et al. 2018 [60] | 20 (5600) | CC, Co, CS | 3.0 | NR | Mean: 61.4–72.1 | NR | 2866 | NR | Biomarkers | 9 (45.0) |
| Wang et al. 2018 [61] | 11 (475615) | CC, Co | NR | Europe, America, Asia, Oceania | 27.0–88.0 | NR | NR | 3, 4 | Comorbid diseases | 7 (63.6) |
| Jiang et al. 2019 [62] | 12 (1726) | CC | NA | Europe, America, Asia | Mean: 56.9–79.0 | NR (33.1–77.5) | 933 | NR | Biomarkers | No assessment |
| Jiménez et al. 2019 [13] | 31 (627493) | CC, Co | NR | Europe, America, Asia | NR | NR | 11202 | NR | Habits | No assessment |
| Kasdagli et al. 2019 [14] | 15 (1559645) | CC, Co | 11.0 | America | NR | NR | 261392 | 3 | Environmental agents | NR |
| Qiu et al. 2019 [63] | 23 (4598) | CC | NA | Europe, America, Asia | Mean: 63.6–73.2 | NR | 2646 | 1, 2, 3 | Biomarkers | 10 (43.5) |
| Qu et al. 2019 [15] | 9 (778571) | CC, Co | Range: | Europe, America, Asia | 20.0–86.0 | NR | 5751 | 1 | Dietary factors | 9 (100.0) |
| 2.0–14.0 | ||||||||||
| Zhou et al. 2019 [16] | 7 (1086) | CC | NA | Europe, America, Asia | Mean: 62.0–76.3 | NR (40.0–78.2) | 448 | NR | Medical history | 6 (85.7) |
| Zhou et al. 2019 [17] | 8 (2418) | CC, Co, RCT | NR | America, Asia, Africa | Mean: 64.0–72.5 | NR (35.0–68.8) | 1333 | NR | Environmental agents, biomarkers | 7 (87.5) |
| Zhu et al. 2019 [18] | 5 (347556) | Co | 10.0 | Europe, America, Asia | NR | NR | 2644 | 3, 4 | Drugs | 0 (0.0) |
| Faustino et al. 2020 [19] | 7 (5796007) | Co, CS | 10.5 | Europe, America, Asia | Median: 47.0–54.5 | NR | NR | 3, 4, 5 | Medical history and comorbid diseases | 5 (71.4) |
| Wang et al. 2020 [20] | 23 (NR) | CC, Co | NR | NR | NR | NR | NR | 1, 3, 4, 5 | Personal medical history of infection | 23 (100.0) |
CC, case -control study; Co, cohort study; CS, cross-sectional study; NA, not applicable; NCC, nested case-control study; NR, not reported; RCT, randomized controlled trial. aMedian follow up duration is only applicable to the included cohort studies. b1 = UK Parkinson’s Disease Society Brain Bank clinical diagnostic criteria; 2 = Clinical Diagnosis Standard proposed by China; 3 = Physician-confirmed diagnosis or hospital records or from database; 4 = International classification of disease code or other code, primary care or death certificates; 5 = Questionnaires or self-reported; 6 = Direct interview; 7 = Diagnosed according to cardinal signs of Parkinson’s Disease. cDetailed description could be found in Table 2 and Supplementary Table 1. dTotal number and total proportion of male. eThe denominators are 74 and 39 respectively.
The number of primary studies included in the SRs ranged from 5 to 202. Nine SRs (19.6%) included only case-control studies, three (6.5%) included only cohort studies, and the remaining 34 (73.9%) included more than one of the following study designs: cohort study, case-control study, nested case-control study, cross-sectional study, and randomized controlled trial (RCT). Cross-sectional studies were included in four (11.8%) of the 34 SRs. Twenty-six SRs assessed the risk of bias of the included studies, and 22 (84.6%) of them provided the proportion of studies with a low risk of bias, which ranged from 0.0%to 100.0%. The median follow-up duration of cohort studies ranged from 3.0 to 18.1 years. Twenty-four SRs (52.2%) involved a literature search in or after 2015, with the most recent search conducted in October 2019. A wide range of risk factors were categorized as habits, exposure to toxic environmental agents, dietary factors, medical history, comorbid diseases, drugs, and biomarkers.
Participant characteristics
The mean age of the included participants ranged from 44.8 to 87.8 years, and the proportion of men ranged from 0.0%to 100.0%. Of the 38 SRs that reported regions of participants, 34 (89.5%) included European, 37 (97.4%) included American, 28 (73.7%) Asian, 2 (5.3%) and 1 (2.6%) included Oceanian and African populations, respectively. The number of PD patients in the included SRs ranged from 388 to 292,275. Among the 29 SRs that reported methods for PD identification, 11 (37.9%) used the UK Parkinson’s Disease Society Brain Bank clinical diagnostic criteria; the remaining used more than one method, such as physician-confirmed diagnosis and hospital records (Table 1). It is worth noting that 17 SRs (37.0%) did not provide information related to the PD diagnosis criteria.
Methodological quality of included systematic reviews
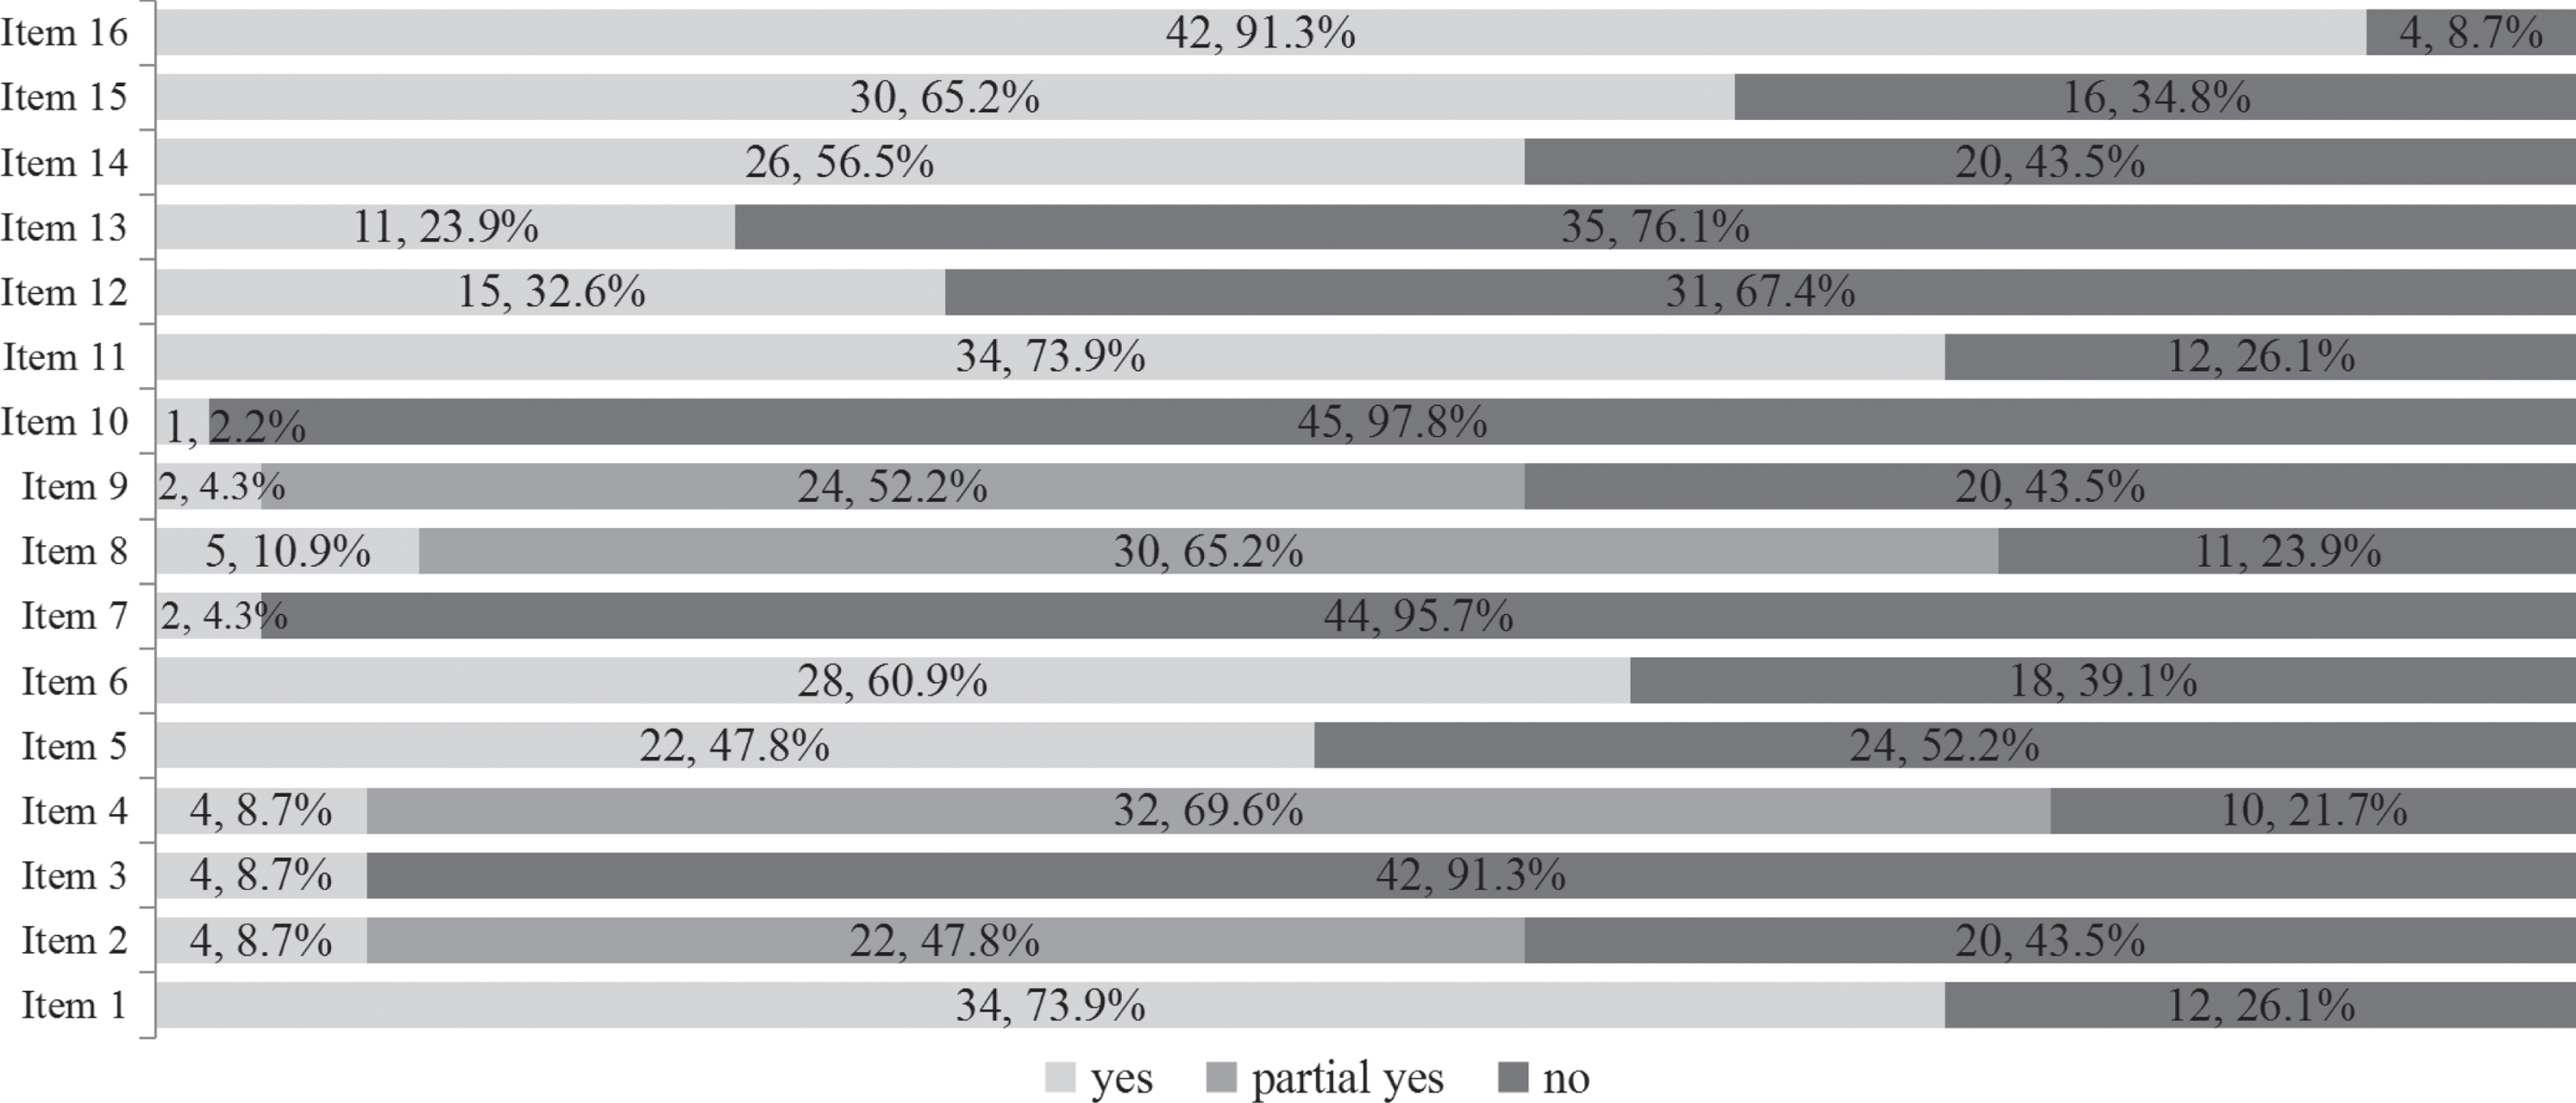
Overall, none of the included SRs were judged to be of high or moderate quality with the AMSTAR-2. Seven SRs (15.2%) were judged to be of low methodological quality, while the remaining 39 (84.8%) were judged to be of critically low quality. Details regarding the methodological quality of the included SRs are shown in Fig. 2. The included SRs had relatively better performance on two out of the seven critical items, with more than 60%of the SRs rated positive for the following: used appropriate methods for statistical combination of the results (34 SRs, 73.9%), carried out an adequate investigation of publication bias (small study bias) and discussed its likely impact on the results of the SRs (30 SRs, 65.2%). The included SRs generally had poor performance for the remaining five critical items, with less than 30%of SRs rated positive for the following: only 2 (4.3%) provided a list of excluded studies, justified the exclusions, and used a satisfactory technique to assess the risk of bias in individual studies included in the review; 4 (8.7%) registered a protocol and used a comprehensive literature search strategy, and 11 (23.9%) accounted for the risk of bias of individual studies when interpreting or discussing the results of the 1ptreview.
Fig. 2
The methodological quality of the 46 included systematic reviews based on AMSTAR-2 tool.
Note: AMSTAR-2 tool: Assessing the Methodological Quality of Systematic Reviews 2 tool.
Item 1: Did the research questions and inclusion criteria for the review include the components of PICO?
Item 2: Did the report of the review contain an explicit statement that the review methods were established prior to the conduct of the review and did the report justify any significant deviations from the protocol?
Item 3: Did the review authors explain their selection of the study designs for inclusion in the review?
Item 4: Did the review authors use a comprehensive literature search strategy?
Item 5: Did the review authors perform study selection in duplicate?
Item 6: Did the review authors perform data extraction in duplicate?
Item 7: Did the review authors provide a list of excluded studies and justify the exclusions?
Item 8: Did the review authors describe the included studies in adequate detail?
Item 9: Did the review authors use a satisfactory technique for assessing the risk of bias (RoB) in individual studies that were included in the review?
Item 10: Did the review authors report on the sources of funding for the studies included in the review?
Item 11: If meta-analysis was performed did the review authors use appropriate methods for statistical combination of results?
Item 12: If meta-analysis was performed, did the review authors assess the potential impact of RoB in individual studies on the results of the meta-analysis or other evidence synthesis?
Item 13: Did the review authors account for RoB in individual studies when interpreting/discussing the results of the review?
Item 14: Did the review authors provide a satisfactory explanation for, and discussion of, any heterogeneity observed in the results of the review?
Item 15: If they performed quantitative synthesis did the review authors carry out an adequate investigation of publication bias (small study bias) and discuss its likely impact on the results of the review?
Item 16: Did the review authors report any potential sources of conflict of interest, including any funding they received for conducting the review?
Non-genetic factors involved in PD development
Risk factors for PD were grouped into six categories: habits, environmental agents, dietary factors, medical history and comorbid diseases, drugs, and biomarkers. Evidence from prospective studies (e.g., cohort, nested case-control) are presented in Table 2, while evidence from study designs that included non-prospective studies (such as case-control studies, cross-sectional studies, or a combination of designs) are presented in Supplementary Table 1. The subgroup meta-analysis results of each included SR are presented in Supplementary Table 2. Detailed information on the methods used for exposure assessments in each meta-analysis is presented in Supplementary Table 3.
Table 2
Summary results of included systematic reviews with meta-analysis which included only prospective studya
| Author, Year | Risk factor | No. of studies (No. of PD cases) | Pooled results (95%CI) | I2 (%) | p (heterogeneity) |
| Habits | |||||
| Fang et al. 2018 [58] | Total physical activity (highest vs. lowest category) | 8 (2192) | RR: 0.79 (0.68, 0.91) | 0.0 | NR |
| Dietary factors | |||||
| Jiang et al. 2014 [36] | Dairy food (highest vs. lowest level of intake) | 5 (1083) | RR: 1.40 (1.20, 1.63) | 8.2 | 0.37 |
| Hughes et al. 2017 [54] | Milk (highest vs. lowest level of intake) | 4 (1725) | HR: 1.56 (1.30, 1.88) | 0.0 | 0.50 |
| Drugs | |||||
| Gao et al. 2011 [28] | Ibuprofen (use vs. no use) | 5 (2168) | RR: 0.73 (0.63, 0.85) | NR | < 0.01 |
| Gao et al. 2011 [28] | Aspirin (use vs. no use) | 6 (2779) | RR: 1.12 (1.01, 1.23) | NR | < 0.01 |
| Gao et al. 2011 [28] | Other NSAIDsb (use vs. no use) | 4 (1962) | RR: 1.00 (0.86, 1.16) | NR | 1.00 |
| Gao et al. 2011 [28] | Acetaminophen (use vs. no use) | 4 (1962) | RR: 1.06 (0.94, 1.19) | NR | 0.37 |
| Zhu et al. 2019 [18] | TZDs (TZDs vs. non-TZD treatments) | 5 (2644) | OR: 0.70 (0.51, 0.96) | 86.0 | < 0.01 |
| Biomarkers | |||||
| Shen et al. 2013 [33] | Serum urate (high vs. low level) | 6 (578) | RR: 0.68 (0.50, 0.91) | 42.1 | 0.10 |
| Wang et al. 2015 [48] | BMI (per 5 kg/m2 increase) | 10 (2706) | RR: 1.00 (0.89, 1.12) | 64.5 | < 0.01 |
| Gao et al. 2016 [51] | Plasma/serum urate level in male (highest vs. lowest quartiles) | 5 (202) | RR: 0.63 (0.42, 0.95) | NR | 0.22 |
| Gao et al. 2016 [51] | Plasma/serum urate level in woman (highest vs. lowest quartiles) | 4 (186) | RR: 0.89 (0.57, 1.40) | NR | 0.52 |
BMI, body mass index; CI, confidence interval.; HR, hazard ratio; NR, not reported; NSAIDs, nonsteroidal anti-inflammatory drugs; OR, odds ratio; PD, Parkinson’s disease; RR, relative risk; TZDs, thiazolidinediones. aProspective study including cohort study and nested case-control study. bNonaspirin NSAIDs.
Habits
Six SRs explored the association between habits and PD development, including physical activity; smoking; coffee, caffeine, tea, and alcohol consumption; and outdoor work [13, 22, 37, 40, 45, 58].
Pooled results based on eight cohort and nested case-control studies showed that physical activity significantly lowered the risk of PD [58] (pooled RR: 0.79, 95%CI: 0.68 to 0.91, I2 = 0.0%) (Table 2). Gender, intensity of physical activity, sample size, and study quality were factors that affected this negative association. The negative associations were maintained in men (pooled RR: 0.68, 95%CI: 0.56 to 0.82, I2 = 0.0%, 5 cohort and nested case-control studies), moderate to vigorous physical activity (pooled RR: 0.71, 95%CI: 0.58 to 0.87, I2 = 30.7%, 7 cohort and nested case-control studies), studies with a sample size > 5000 (pooled RR: 0.74, 95%CI: 0.61 to 0.90, I2 = 0.0%, 4 cohort and nested case-control studies), and studies with poorer methodological quality (Newcastle-Ottawa scale [NOS] score≤8) (pooled RR: 0.77, 95%CI: 0.64 to 0.92, I2 = 0.0%, 5 cohort and nested case-control studies). No significant associations were observed in women (pooled RR: 0.91, 95%CI: 0.72 to 1.14, I2 = 0.0%, 4 cohort and nested case-control studies), light physical activity (pooled RR: 0.86, 95%CI: 0.60 to 1.23, I2 = 37.5%, 3 cohort and nested case-control studies), studies with a sample size≤5000 (pooled RR: 0.87, 95%CI: 0.68 to 1.11, I2 = 0.0%, 4 cohort and nested case-control studies), or studies with better methodological quality (NOS score > 8) (pooled RR: 0.86, 95%CI: 0.61 to 1.20, I2 = 31.1%, 3 cohort and nested case-control studies). No significant differences were found among studies from different locations or with different follow-up durations (Supplementary Table 2).
Meta-analyses from case-control and cohort studies consistently showed that smoking (ever vs. never) (pooled RR: 0.64, 95%CI: 0.60 to 0.69, I2 = 49.6%, 67 case-control and cohort studies), coffee (pooled RR: 0.67, 95%CI: 0.58 to 0.76, I2 = 42.9%, 19 case-control and cohort studies), and caffeine (pooled RR: 0.55, 95%CI: 0.43 to 0.71, I2 = 53.0%, 7 case-control, cohort and nested case-control studies) significantly reduced the risk of PD [22, 37] (Supplementary Tables 1 and 2). Tea drinking was negatively associated with PD development (pooled RR: 0.64, 95%CI: 0.50 to 0.82, I2 = 16.2%, 4 cohort and nested case-control studies) (Supplementary Table 2). Subgroup analyses showed that the negative association was maintained in men (pooled RR: 0.64, 95%CI: 0.43 to 0.95, I2 = 0.0%, no information about number of studies) and Asian populations (pooled RR: 0.60, 95%CI: 0.45 to 0.79, I2 = 38.1%, 2 cohort and case-control studies) but not in women (pooled RR: 0.68, 95%CI: 0.44 to 1.06, I2 = 29.7%, no information about number of studies) or American populations (pooled RR: 0.85, 95%CI: 0.68 to 1.07, I2 = 47.1%, 4 cohort, case-control and nested case-control studies) [37] (Supplementary Table 2).
Although pooled results from case-control studies showed that alcohol consumption (pooled RR: 0.72, 95%CI: 0.61 to 0.86, I2 = 50.5%, 17 matched case-control studies) significantly reduced the risk of PD development, this was not confirmed by evidence from prospective studies (pooled RR: 0.86, 95%CI: 0.75 to 1.00, I2 = 14.5%, 8 cohort studies) [13, 40] (Supplementary Table 2). Two case-control studies showed that outdoor work decreased the risk of PD development (pooled RR: 0.72, 95%CI: 0.63 to 0.81, I2 = 0.0%) (Supplementary Table 1), but no related evidence from cohort studies was identified [45].
Environmental agents
Six SRs explored the association between PD development and environmental agents, including pesticides, solvents, farming, well-water drinking, rural living, air pollution, extremely low frequency magnetic fields (ELF-MF), welding, manganese, hydrocarbon, and sunlight exposure [14, 17, 29, 32, 42, 44].
Combined results from case-control and cohort studies showed that pesticides (pooled OR: 1.76, 95%CI: 1.56 to 2.04, I2 = 67.3%, 51 case-control and cohort studies), herbicides (pooled OR: 1.33, 95%CI: 1.08 to 1.65, I2 = 55.0%, 19 case-control and cohort studies), insecticides (pooled OR: 1.53, 95%CI: 1.12 to 2.08, I2 = 78.8%, 18 case-control and cohort studies), solvents (pooled OR: 1.35, 95%CI: 1.09 to 1.67, I2 = 35.5%, 16 case-control and cohort studies), and farming (pooled OR: 1.30, 95%CI: 1.14 to 1.49, I2 = 43.2%, 24 case-control and cohort studies) were positively associated with PD development [32], while welding negatively associated with PD development (pooled RR: 0.86, 95%CI: 0.80 to 0.92, I2 = 0.0%, 9 case-control and cohort studies) [29] (Supplementary Table 1). No significant associations were observed between PD development and air pollution (PM2.5, PM2.5–10, PM10, NO2, NOx, CO, O3), ELF-MF, or manganese (Supplementary Table 1) [14, 29, 42] based on combined results from case-control and cohort studies.
On the other hand, evidence from case-control studies indicated that paraquat (pooled OR: 2.19, 95%CI: 1.48 to 3.26, I2 = 51.1%, 7 case-control studies), well-water drinking (pooled OR: 1.34, 95%CI: 1.16 to 1.55, I2 = 66.4%, 37 case-control studies), rural living (pooled OR: 1.32, 95%CI: 1.15 to 1.51, I2 = 75.2%, 30 case-control studies), and hydrocarbon (pooled OR: 1.36, 95%CI: 1.13 to 1.63, I2 = 29.0%, 14 case-control studies) were positively associated with PD development, while sunlight exposure (≥15 min/week) (pooled OR: 0.02, 95%CI: 0.00 to 0.10, I2 = 78.8%, 3 case-control studies) was negatively associated with PD development [17, 32, 44] (Supplementary Table 1). No cohort studies covered the aforementioned factors.
Dietary factors
Six SRs explored the association between dietary factors and PD development, including dairy food, vitamin A and carotenoids, iron, zinc, copper, protein, carbohydrates, cholesterol, and energy intake [15, 36, 38, 41, 47, 54].
One SR showed that milk intake increased the risk of PD development (pooled HR: 1.56, 95%CI: 1.30 to 1.88, I2 = 0.0%, 4 cohort studies) [54] (Table 2), which is consistent with the results of a study that included a subgroup of milk intake based on dairy food (pooled RR for milk intake: 1.45, 95%CI: 1.23 to 1.73, I2 = 16.1%, 5 cohort studies) [36] (Supplementary Table 2).
Pooled evidence from cohort studies showed that fat intake significantly reduced the risk of PD (pooled RR: 0.80, 95%CI: 0.68 to 0.95, I2 = 3.0%, 6 cohort studies) [47] (Supplementary Table 2), which was in conflict with the results from case-control studies (pooled RR: 1.06, 95%CI: 0.75 to 1.52, I2 = 46.7%, 7 case-control studies). Conflicting results were found between a cohort study (RR: 0.78, 95%CI: 0.56 to 1.09, 1 cohort study) and several case-control studies (pooled OR: 1.85, 95%CI: 1.19 to 2.87, I2 = 27.0%, 3 case-control studies) regarding the association between lutein and PD development [38] (Supplementary Table 1). Pooled results showed that carbohydrates (pooled RR: 1.24, 95%CI: 1.05 to 1.48, I2 = 0.0%, 8 case-control and cohort studies) and energy intake (pooled RR: 1.39, 95% CI: 1.01 to 1.92, I2 = 83.8%, 8 case-control and cohort studies) were positively associated with PD development [47]. No significant associations were observed between PD development and vitamin A, α-carotene, β-carotene, β-cryptoxanthin, lycopene, protein, cholesterol intake, iron, zinc, and copper based on combined results from case-control and cohort studies [38, 41, 47] (Supplementary Table 1).
Medical history and comorbid diseases
Eleven SRs explored the associations between PD development and medical history and comorbid disease, including head trauma, family history of PD or tremor, mood disorder, diabetes, cancer, hypertension, gastric ulcer, general anesthetic, oophorectomy, gout, constipation, reproductive factors, bullous pemphigoid, depression, bipolar disorder, and Toxoplasma gondii, bacterial, viral, and fungal infections [16, 19–22, 31, 46, 49, 55, 56, 61].
Pooled results showed that depression (pooled OR: 1.92, 95%CI: 1.66 to 2.22, I2 = 0.0%, 6 cohort studies), mood disorder (pooled RR: 1.79, 95%CI: 1.72 to 1.87, I2 = 0.0%, 2 cohort studies), bipolar disorder (pooled OR: 3.12, 95%CI: 1.66 to 5.88, I2 = 95.0%, no information about the number of studies), and constipation (pooled RR: 2.36, 95%CI: 2.00 to 2.80, I2 not reported, 4 cohort studies) were positively associated with PD development [19, 22, 49, 61], while no significant associations were found between PD development and oophorectomy, gout, age at menarche, age at menopause, parity, or type of menopause [22, 46, 55] (Supplementary Tables 1 and 2).
Results from a meta-analysis showed that diabetes significantly increased the risk of PD (pooled RR: 1.31, 95%CI: 1.10 to 1.57, I2 = 34.7%, 4 cohort studies), while no significant association was found between hypertension and PD (pooled RR: 0.98, 95%CI: 0.82 to 1.17, I2 = 76.5%, 2 cohort studies) [21, 22] (Supplementary Table 2). Results from meta-analyses suggested that the following nine factors were positively associated with PD [20, 22, 31, 56]: family history of PD (pooled RR: 4.45, 95%CI: 3.39 to 5.83, I2 = 57.3%, 19 case-control studies), family history of tremor (pooled RR: 2.74, 95%CI: 2.10 to 3.57, I2 = 0.0%, 10 case-control studies), bullous pemphigoid (pooled OR: 3.06, 95%CI: 1.97 to 4.77, I2 = 0.0%, 10 case-control studies), helicobacter pylori (pooled OR: 1.65, 95%CI: 1.43 to 1.92, I2 = 0.7%, 9 case-control and cohort studies), hepatitis C virus (pooled OR: 1.20, 95%CI: 1.01 to 1.41, I2 = 79.0%, 7 case-control and cohort studies), Malassezia (pooled OR: 1.69, 95%CI: 1.37 to 2.10, I2 = 0.0%, 2 case-control and cohort studies), pneumonia infection (pooled OR: 1.60, 95%CI: 1.02 to 2.49, I2 = 17.5%, 2 case-control and cohort studies) and head trauma (pooled OR: 1.57, 95%CI: 1.35 to 1.83, I2 = 61.0%, 22 case-control, cohort and nested case-control studies). Nonetheless, no significant associations were observed between PD and cancer, gastric ulcer, general anesthetic, fertile lifespan, latent or acute infection of T. gondii, influenza virus, herpes virus, hepatitis B, measles, scarlet fever, mumps, chicken pox, pertussis, or German measles [16, 20, 22, 55] (Supplementary Table 1). Although results from cohort studies, case-control studies, and cross-sectional studies were pooled in a single meta-analysis for some of the aforementioned factors, no subgroup analysis based on study design was conducted.
Drugs
Eight SRs explored the association between PD development and drugs, including nonsteroidal anti-inflammatory drugs (NSAIDs), thiazolidinediones (TZDs), oral contraceptives, calcium channel blockers, hormone replacement therapy (HRT), acetaminophen/paracetamol, beta-blockers, and statin use [18, 22, 28, 39, 43, 50, 53, 55].
Evidence showed that aspirin intake increased the risk of PD (pooled RR: 1.12, 95%CI: 1.01 to 1.23, I2 not reported, 6 cohort and nested case-control studies), while ibuprofen intake decreased the risk of PD (pooled RR: 0.73, 95%CI: 0.63 to 0.85, I2 not reported, 5 cohort and nested case-control studies) [28] (Table 2). On the other hand, no significant association was found between PD and the remaining NSAIDs [22, 28] (Table 2 and Supplementary Table 2). Cohort studies also showed that TZDs decreased the risk of PD (pooled OR, 0.70; 95%CI, 0.51 to 0.96; I2 = 86.0%; 5 cohort studies) [18] (Table 2).
Meta-analysis showed that calcium channel blockers (pooled RR: 0.74, 95%CI: 0.64 to 0.85, I2 = 42.6%, 3 cohort studies) and statin use (pooled RR: 0.82, 95%CI: 0.68 to 0.99, I2 = 55.5%, 6 cohort studies) were negatively associated with PD development [43, 50, 53], while HRT (pooled RR: 1.24, 95%CI: 1.10 to 1.41, I2 = 0.0%, 4 cohort studies) and beta blockers (pooled RR: 1.28, 95%CI: 1.19 to 1.39, I2 = 0.0%, 3 case-control studies) increased the risk of PD [22, 39]. No significant associations were observed between PD development and oral contraceptives (pooled RR: 1.00, 95%CI: 0.79 to 1.28, I2 = 61.8%, 7 case-control and cohort studies) [55] or long-term statin use (pooled RR: 0.77, 95%CI: 0.56 to 1.07, I2 = 64.2%, 4 case-control and cohort studies) [50] (Supplementary Tables 1 and 2).
Biomarkers
Thirteen SRs explored the association between PD development and biomarkers, including plasma/serum urate, body mass index (BMI), serum vitamin D, serum cholesterol, serum uric acid, low-density lipoprotein cholesterol (LDL-C), serum iron, circulating magnesium levels, serum brain-derived neurotrophic factor (BDNF), and C-reactive protein (CRP) [30, 33–35, 45, 48, 51, 52, 57, 59, 60, 62, 63].
Pooled results revealed that a high serum urate level was negatively associated with PD development (pooled RR: 0.68, 95%CI: 0.50 to 0.91, I2 = 42.1%, 6 cohort and nested case-control studies) [33] (Table 2), and subgroup analysis showed this negative association was only observed in men (pooled RR: 0.60, 95%CI: 0.40 to 0.90, I2 = 50.6%, 4 cohort and nested case-control studies) [33], which is consistent with other SR (pooled RR in male: 0.63, 95%CI: 0.42 to 0.95, I2 not reported, 5 cohort and nested case-control studies) [51] (Table 2 and Supplementary Table 2). No significant associations were found between PD development and BMI or serum cholesterol [30, 48] (Table 2 and Supplementary Table 1 and 2).
Meta-analyses showed that deficiency and insufficiency of vitamin D were positively associated with PD development (deficiency and insufficiency, pooled OR: 1.50, 95% CI: 1.31 to 1.71, I2 = 55.9%, 6 case-control, cohort, and cross-sectional studies; deficiency, pooled OR: 2.08, 95% CI: 1.35 to 3.19, I2 = 84.7%, 10 case-control, cohort, and cross-sectional studies; insufficiency, pooled OR: 1.73, 95% CI: 1.48 to 2.03, I2 = 31.0%, 6 case-control, cohort, and cross-sectional studies) [45, 60]; no subgroup analysis based on study design was conducted (Supplementary Table 1). Pooled results of case-control studies showed that PD patients had lower levels of serum uric acid, serum BDNF, and serum iron and higher circulating Mg and CRP levels [34, 59, 62, 63]. No significant association between LDL-C and PD development was found (pooled RR: 0.58, 95%CI: 0.31 to 1.07, I2 = 71.0%, 3 case-control and cohort studies) [52] (Supplementary Table 1).
DISCUSSION
This overview of SRs comprehensively summarized non-genetic factors involved in the development of PD, covering six categories and more than 80 factors. Statistically significant associations were found between PD development and 50 factors, but only 19 of these were supported by evidence from prospective studies. Eleven factors, including physical activity; smoking, coffee, caffeine, tea, and fat intake; ibuprofen; calcium channel blocker use; statin use; TZD; and high serum urate levels were negatively associated with PD development, while the remaining eight factors, including dairy food, milk, diabetes, HRT, depression, mood disorder, bipolar disorder, and aspirin use were positively associated with PD development. No reliable conclusions could be drawn regarding the association between 31 factors and PD development, as they were only supported by evidence from case-control studies or the combination of case-control studies, cohort studies, and cross-sectional studies.
It is generally acknowledged that a healthy lifestyle can prevent chronic disease and prolong the life expectancy of individuals with chronic diseases [64, 65]. Physical activity also showed a beneficial effect in reducing the risk of PD development in the general population, which is consistent with the findings reported in a previous publication [66]. Furthermore, results from this overview suggest a negative association between PD and moderate to vigorous physical activity; this indicates recommendations of physical activity for preventing PD should emphasize its intensity as well. Although the benefits of physical activity were only observed among men in our results, we do not suggest excluding women from the targeted population due to the general health benefits of physical activity. Coffee and tea drinking may not only reduce the risk of PD, but also reduce the risk of other diseases such as metabolic diseases, cardiovascular diseases, and cancer [67, 68]. Promotion of the health benefits of coffee and tea consumption should be considered for the general population. However, due to the lack of details regarding the types of tea in the included SR [37], we were not able to explore this further.
Consistent evidence has suggested that smoking significantly reduces the risk of PD development. So far, no scientific consensus has been reached on whether the association between smoking and PD is a causal relationship. One hypothesis is that patients with PD were able to quit smoking more easily than controls [69], which may cause the observed reverse association. Other researchers believe there is a true causal link between smoking and PD [70]. Experimental evidence indicated nicotine, a major component of tobacco smoke, had beneficial effects in animal models of PD [71, 72], suggesting nicotine may have therapeutic potential for PD. It is well recognized that smoking is a risk factor for many other diseases such as chronic noncommunicable diseases and cancer [73–75]; therefore, its protective effect for PD development does not impact public health strategies for reducing smoking among populations.
Our findings suggest that individuals with depression, mood disorders, or constipation are at significantly increased risk for subsequent PD. Currently, there are two explanations for these associations. One is that these factors are prodromal symptoms of PD, and the other is that these factors are independent risk factors for PD [49, 61]. However, no consensus has been reached regarding these two explanations, which may also be subject to change over time. On the other hand, these two explanations indicate different preventive and clinical implications. Hence, future research is warranted to clarify these issues. Regardless of the explanation, identifying individuals with a history of depression, mood disorder, or constipation will help the diagnosis of prodromal PD [12, 76]. Patients with bipolar disorders also have a significantly increased risk of developing PD compared with the general population, long-term lithium use may be a possible explanation for this. However, the reasons underlying this association require further clarification [19].
Due to the possibility of genetic and/or environmental confounding, it is difficult to determine causality from observational studies, even with a cohort study design. The association observed may be a combination of both environmental and genetic factors. Thus, studies that use genetically informed approaches, such as twin studies that control for genetic factors, may better emphasize the effects of non-genetic factors on PD [77]. Mendelian randomization studies may also be considered to determine the causal relationship between exposure and PD [78, 79].
There were several limitations to this study. First, various study designs, including cohort studies, nested case-control studies, case-control studies, and even cross-sectional studies, have been adopted to investigate the risk factors involved in PD development. Based on the evidence pyramid [80], a cross-sectional study is a suboptimal choice for etiological research questions. Nevertheless, due to its retrospective nature, case-control studies are generally more likely to be effected by various biases (e.g., recall bias and selection bias due to hospital-based sampling of cases and controls) than cohort studies [81]. Therefore, in this overview, we emphasized the evidence from cohort studies, especially when conflicting conclusions arose between cohort studies and case-control studies. The longitudinal nature of cohort studies empowers the cause and effect inference to some extent. However, because of the long prodromal period of PD, symptoms before the diagnosis may affect exposure (i.e., reduced physical activity, smoking, or coffee intake) [82]. Therefore, even with a cohort study design, we cannot completely rule out the fact that the observed association may be a reverse causal association. Accordingly, for sensitivity analysis and to avoid reverse causality, some cohort studies removed cases in which PD occurred in the first several years. However, there is currently no standard time interval for conducting such a sensitive analysis [83, 84]. Another major threat to the interval validity of observational studies is confounding, which may lead to biased estimation of the observed association if it is not well controlled. For example, the association between β-adrenergic receptor drugs and PD may be an indirect effect of smoking [85]. A cautious consideration of key methodological issues during study design is suggested for future studies on the risk factors for PD.
Second, among the 34 SRs that included more than one type of study design, 33 (97.1%) combined results from different study designs, and 17 (50.0%) did not conduct subgroup analysis based on study design. Moreover, most studies did not investigate many important factors that might explain the heterogeneity observed in the meta-analyses, such as gender, region, risk of bias of the included studies, sample size, and duration of exposure. The methods used for exposure assessment varied among the included primary studies; 18 (39.1%) adopted indirect measurement methods, such as questionnaire or self-report, but some did not provide details regarding the exposure measurements. Similar drawbacks were observed regarding the diagnostic criteria for PD among the included SRs. It is worth noting that OR instead of RR was used in some meta-analyses that pooled results from cohort studies. OR is generally considered a suboptimal index for measuring effect, as it might exaggerate effect size and is not easily interpreted [86]. All of the abovementioned issues limited our interpretation and the generalizability of the results generated from the included SRs. Future SRs should conduct subgroup analysis to explore sources of heterogeneity, especially considering variability in study design; they should provide details regarding exposure measurement and diagnostic criteria for PD and use RR for effect measurements in cohort studies. The studies we included mainly covered Europe, America, and Asia, while few studies covered Africa and Oceania. In addition, few included SRs reported ethnic information, so some populations may not have been covered. This limited the generalizability of our research results.
Third, the methodological quality of the included SRs was generally unsatisfactory. Based on the results shown in Fig. 2, authors of future SRs should provide an a priori protocol by registering within PROSPERO [87], reduce potential publication bias by conducting a comprehensive literature search, increase transparency by providing lists of included and excluded studies, and consider the scientific rigor by using a satisfactory technique to assess the risk of bias of included studies.
Finally, the present overview only included SRs from within the last 10 years; therefore, this overview may not cover all non-genetic factors related to the development of PD. Furthermore, as stated in the criteria, some risk factors for prodromal PD (e.g., substantia nigra hyperechogenicity), which is beyond the scope of the present study, were not included in our overview [12]. However, we believe that most of the up-to-date evidence has been covered by this overview. Since the reporting guidelines for overviews of SRs are still under development [70], we conducted this overview based on the Preferred Reporting Items for Systematic Reviews and Meta-Analyses (PRISMA) statement [88].
CONCLUSION
This overview summarizes the non-genetic factors related to the development of PD. Modifiable lifestyle factors such as physical activity and tea and coffee consumption may reduce the risk of PD development. Promotion of the health benefits of physical activity and coffee and tea consumption should be considered for the general population. The methodological quality of future SRs strongly requires improvement, and international standards such as Conducting Systematic Reviews and Meta-Analyses of Observational Studies of Etiology (COSMOS-E), should be adhered to when conducting SRs [89, 90].
ACKNOWLEDGMENTS
This research was supported by the High-level Talents Introduction Plan from Central South University (No.502045003), Special Funding for the Construction of Innovative Provinces in Hunan (Grant No.2019SK2141), and the China Oceanwide Holding Group Project Fund (Contract No. 143010100). And we would like to thank Editage (www.editage.cn) for English language editing.
CONFLICT OF INTEREST
The authors have no conflict of interest to report.
SUPPLEMENTARY MATERIAL
[1] The supplementary material is available in the electronic version of this article: https://dx.doi.org/10.3233/JPD-202521.
REFERENCES
[1] | Kalia LV , Lang AE ((2015) ) Parkinson’s disease. Lancet 386: , 896–912. |
[2] | Poewe W , Seppi K , Tanner CM , Halliday GM , Brundin P , Volkmann J , Schrag AE , Lang AE ((2017) ) Parkinson disease. Nat Rev Dis Primers 3: , 17013. |
[3] | Reich SG , Savitt JM ((2019) ) Parkinson’s disease. Med Clin North Am 103: , 337–350. |
[4] | Dorsey ER , Elbaz A , Nichols E , Abd-Allah F , Abdelalim A , Adsuar JC , Ansha MG , Brayne C , Choi J-YJ , Collado-Mateo D , Dahodwala N , Do HP , Edessa D , Endres M , Fereshtehnejad S-M , Foreman KJ , Gankpe FG , Gupta R , Hankey GJ , Hay SI , Hegazy MI , Hibstu DT , Kasaeian A , Khader Y , Khalil I , Khang Y-H , Kim YJ , Kokubo Y , Logroscino G , Massano J , Mohamed Ibrahim N , Mohammed MA , Mohammadi A , Moradi-Lakeh M , Naghavi M , Nguyen BT , Nirayo YL , Ogbo FA , Owolabi MO , Pereira DM , Postma MJ , Qorbani M , Rahman MA , Roba KT , Safari H , Safiri S , Satpathy M , Sawhney M , Shafieesabet A , Shiferaw MS , Smith M , Szoeke CEI , Tabarés-Seisdedos R , Truong NT , Ukwaja KN , Venketasubramanian N , Villafaina S , weldegwergs g K , Westerman R , Wijeratne T , Winkler AS , Xuan BT , Yonemoto N , Feigin VL , Vos T , Murray CJL ((2018) ) Global, regional, and national burden of Parkinson’s disease, 1990-2016: A systematic analysis for the Global Burden of Disease Study 2016. Lancet Neurol 17: , 939–953. |
[5] | Hechtner MC , Vogt T , Zöllner Y , Schröder S , Sauer JB , Binder H , Singer S , Mikolajczyk R ((2014) ) Quality of life in Parkinson’s disease patients with motor fluctuations and dyskinesias in five European countries. Parkinsonism Relat Disord 20: , 969–974. |
[6] | Prakash KM , Nadkarni NV , Lye WK , Yong MH , Tan EK ((2016) ) The impact of non-motor symptoms on the quality of life of Parkinson’s disease patients: A longitudinal study. Eur J Neurol 23: , 854–860. |
[7] | Rizek P , Kumar N , Jog MS ((2016) ) An update on the diagnosis and treatment of Parkinson disease. CMAJ 188: , 1157–1165. |
[8] | Kieburtz K , Wunderle KB ((2013) ) Parkinson’s disease: Evidence for environmental risk factors. Mov Disord 28: , 8–13. |
[9] | Klein C , Westenberger A ((2012) ) Genetics of Parkinson’s disease. Cold Spring Harb Perspect Med 2: , a008888. |
[10] | Tysnes OB , Storstein A ((2017) ) Epidemiology of Parkinson’s disease. J Neural Transm (Vienna) 124: , 901–905. |
[11] | Chen H ((2018) ) The changing landscape of Parkinson epidemiologic research. J Parkinsons Dis 8: , 1–12. |
[12] | Heinzel S , Berg D , Gasser T , Chen H , Yao C , Postuma RB ((2019) ) Update of the MDS research criteria for prodromal Parkinson’s disease. Mov Disord 34: , 1464–1470. |
[13] | Jimenez-Jimenez FJ , Alonso-Navarro H , Garcia-Martin E , Agundez JAG ((2019) ) Alcohol consumption and risk for Parkinson’s disease: A systematic review and meta-analysis. J Neurol 266: , 1821–1834. |
[14] | Kasdagli M-I , Katsouyanni K , Dimakopoulou K , Samoli E ((2019) ) Air pollution and Parkinson’s disease: A systematic review and meta-analysis up to 2018. Int J Hyg Environ Health 222: , 402–409. |
[15] | Qu Y , Chen X , Xu MM , Sun Q ((2019) ) Relationship between high dietary fat intake and Parkinson’s disease risk: A meta-analysis. Neural Regen Res 14: , 2156–2163. |
[16] | Zhou Z , Zhou R , Li K , Wei W , Zhang Z , Zhu Y , Luan R ((2019) ) The association between toxoplasma gondii infection and risk of Parkinson’s disease: A systematic review and meta-analysis. Biomed Res Int 2019: , 8186017. |
[17] | Zhou Z , Zhou R , Zhang Z , Li K ((2019) ) The association between vitamin D status, vitamin D supplementation, sunlight exposure, and Parkinson’s disease: A systematic review and meta-analysis. Med Sci Monit 25: , 666–674. |
[18] | Zhu Y , Pu J , Chen Y , Zhang B ((2019) ) Decreased risk of Parkinson’s disease in diabetic patients with thiazolidinediones therapy: An exploratory meta-analysis. PloS One 14: , e0224236. |
[19] | Faustino PR , Duarte GS , Chendo I , Caldas AC , Reimao S , Fernandes RM , Vale J , Tinazzi M , Bhatia K , Ferreira JJ ((2020) ) Risk of developing Parkinson disease in bipolar disorder: A systematic review and meta-analysis. JAMA Neurol 77: , 192–198. |
[20] | Wang H , Liu X , Tan C , Zhou W , Jiang J , Peng W , Zhou X , Mo L , Chen L ((2020) ) Bacterial, viral, and fungal infection-related risk of Parkinson’s disease: Meta-analysis of cohort and case–control studies. Brain Behav 10: , e01549. |
[21] | Lu L , Fu DL , Li HQ , Liu AJ , Li JH , Zheng GQ ((2014) ) Diabetes and risk of Parkinson’s disease: An updated meta-analysis of case-control studies. PLoS One 9: , e85781. |
[22] | Noyce AJ , Bestwick JP , Silveira-Moriyama L , Hawkes CH , Giovannoni G , Lees AJ , Schrag A ((2012) ) Meta-analysis of early nonmotor features and risk factors for Parkinson disease. Ann Neurol 72: , 893–901. |
[23] | Montori VM , Wilczynski NL , Morgan D , Haynes RB ((2005) ) Optimal search strategies for retrieving systematic reviews from Medline: Analytical survey. BMJ 330: , 68. |
[24] | Wong SS , Wilczynski NL , Haynes RB ((2006) ) Developing optimal search strategies for detecting clinically sound treatment studies in EMBASE. J Med Libr Assoc 94: , 41–47. |
[25] | Health Information Research Unit E-BHI MU: Search Strategies for PsycINFO in Ovid Syntax, https://hiru.mcmaster.ca/hiru/HIRU_Hedges_PsycINFO_Strategies.aspx, Last updated February 9, 2016, Accessed on June 3, 2020. |
[26] | Shea BJ , Reeves BC , Wells G , Thuku M , Hamel C , Moran J , Moher D , Tugwell P , Welch V , Kristjansson E , Henry DA ((2017) ) AMSTAR 2: A critical appraisal tool for systematic reviews that include randomised or non-randomised studies of healthcare interventions, or both. BMJ 358: , j4008. |
[27] | Higgins JP , Thompson SG , Deeks JJ , Altman DG ((2003) ) Measuring inconsistency in meta-analyses. BMJ 327: , 557–560. |
[28] | Gao X , Chen H , Schwarzschild MA , Ascherio A ((2011) ) Use of ibuprofen and risk of Parkinson disease. Neurology 76: , 863–869. |
[29] | Mortimer JA , Borenstein AR , Nelson LM ((2012) ) Associations of welding and manganese exposure with Parkinson disease: Review and meta-analysis. Neurology 79: , 1174–1180. |
[30] | Gudala K , Bansal D , Muthyala H ((2013) ) Role of serum cholesterol in Parkinson’s disease: A meta-analysis of evidence. J Parkinsons Dis 3: , 363–370. |
[31] | Jafari S , Etminan M , Aminzadeh F , Samii A ((2013) ) Head injury and risk of Parkinson disease: A systematic review and meta-analysis. Mov Disord 28: , 1222–1229. |
[32] | Pezzoli G , Cereda E ((2013) ) Exposure to pesticides or solvents and risk of Parkinson disease. Neurology 80: , 2035–2041. |
[33] | Shen C , Guo Y , Luo W , Lin C , Ding M ((2013) ) Serum urate and the risk of Parkinson’s disease: Results from a meta-analysis. Can J Neurol Sci 40: , 73–79. |
[34] | Shen L , Ji HF ((2013) ) Low uric acid levels in patients with Parkinson’s disease: Evidence from meta-analysis. BMJ Open 3: , e003620. |
[35] | Chen J , Guan Z , Wang L , Song G , Ma B , Wang Y ((2014) ) Meta-analysis: Overweight, obesity, and Parkinson’s disease. Int J Endocrinol 2014: , 203930–. |
[36] | Jiang W , Ju C , Jiang H , Zhang D ((2014) ) Dairy foods intake and risk of Parkinson’s disease: A dose-response meta-analysis of prospective cohort studies. Eur J Epidemiol 29: , 613–619. |
[37] | Qi H , Li S ((2014) ) Dose-response meta-analysis on coffee, tea and caffeine consumption with risk of Parkinson’s disease. Geriatr Gerontol Int 14: , 430–439. |
[38] | Takeda A , Nyssen OP , Syed A , Jansen E , Bueno-de-Mesquita B , Gallo V ((2014) ) Vitamin A and carotenoids and the risk of Parkinson’s disease: A systematic review and meta-analysis. Neuroepidemiology 42: , 25–38. |
[39] | Wang P , Li J , Qiu S , Wen H , Du J ((2014) ) Hormone replacement therapy and Parkinson’s disease risk in women: A meta-analysis of 14 observational studies. Neuropsychiatr Dis Treat 11: , 59–66. |
[40] | Zhang D , Jiang H , Xie J ((2014) ) Alcohol intake and risk of Parkinson’s disease: A meta-analysis of observational studies. Mov Disord 29: , 819–822. |
[41] | Cheng P , Yu J , Huang W , Bai S , Zhu X , Qi Z , Shao W , Xie P ((2015) ) Dietary intake of iron, zinc, copper, and risk of Parkinson’s disease: A meta-analysis. Neurol Sci 36: , 2269–2275. |
[42] | Huss A , Koeman T , Kromhout H , Vermeulen R ((2015) ) Extremely low frequency magnetic field exposure and Parkinson’s disease –a systematic review and meta-analysis of the data. Int J Environ Res Public Health 12: , 7348–7356. |
[43] | Lang Y , Gong D , Fan Y ((2015) ) Calcium channel blocker use and risk of Parkinson’s disease: A meta-analysis. Pharmacoepidemiol Drug Saf 24: , 559–566. |
[44] | Palin O , Herd C , Morrison KE , Jagielski AC , Wheatley K , Thomas GN , Clarke CE ((2015) ) Systematic review and meta-analysis of hydrocarbon exposure and the risk of Parkinson’s disease. Parkinsonism Relat Disord 21: , 243–248. |
[45] | Shen L , Ji HF ((2015) ) Associations between vitamin D status, supplementation, outdoor work and risk of Parkinson’s disease: A meta-analysis assessment. Nutrients 7: , 4817–4827. |
[46] | Ungprasert P , Srivali N , Thongprayoon C ((2015) ) Gout is not associated with a lower risk of Parkinson’s disease: A systematic review and meta-analysis. Parkinsonism Relat Disord 21: , 1238–1242. |
[47] | Wang A , Lin Y , Wu Y , Zhang D ((2015) ) Macronutrients intake and risk of Parkinson’s disease: A meta-analysis. Geriatr Gerontol Int 15: , 606–616. |
[48] | Wang YL , Wang YT , Li JF , Zhang YZ , Yin HL , Han B ((2015) ) Body mass index and risk of Parkinson’s disease: A dose-response meta-analysis of prospective studies. PLoS One 10: , e0131778. |
[49] | Adams-Carr KL , Bestwick JP , Shribman S , Lees A , Schrag A , Noyce AJ ((2016) ) Constipation preceding Parkinson’s disease: A systematic review and meta-analysis. J Neurol Neurosurg Psychiatry 87: , 710–716. |
[50] | Bai S , Song Y , Huang X , Peng L , Jia J , Liu Y , Lu H ((2016) ) Statin use and the risk of Parkinson’s disease: An updated meta-analysis. PLoS One 11: , e0152564. |
[51] | Gao X , O’Reilly EJ , Schwarzschild MA , Ascherio A ((2016) ) Prospective study of plasma urate and risk of Parkinson disease in men and women. Neurology 86: , 520–526. |
[52] | Sheng Z , Jia X , Kang M ((2016) ) Statin use and risk of Parkinson’s disease: A meta-analysis. Behav Brain Res 309: , 29–34. |
[53] | Bykov K , Yoshida K , Weisskopf MG , Gagne JJ ((2017) ) Confounding of the association between statins and Parkinson disease: Systematic review and meta-analysis. Pharmacoepidemiol Drug Saf 26: , 294–300. |
[54] | Hughes KC , Gao X , Kim IY , Wang M , Weisskopf MG , Schwarzschild MA , Ascherio A ((2017) ) Intake of dairy foods and risk of Parkinson disease. Neurology 89: , 46–52. |
[55] | Lv M , Zhang Y , Chen GC , Li G , Rui Y , Qin L , Wan Z ((2017) ) Reproductive factors and risk of Parkinson’s disease in women: A meta-analysis of observational studies. Behav Brain Res 335: , 103–110. |
[56] | Milani-Nejad N , Zhang M , Kaffenberger J ((2017) ) The association between bullous pemphigoid and neurological disorders: A systematic review. Eur J Dermatol 27: , 472–481. |
[57] | Mostile G , Cicero CE , Giuliano L , Zappia M , Nicoletti A ((2017) ) Iron and Parkinson’s disease: A systematic review and meta-analysis. Mol Med Rep 15: , 3383–3389. |
[58] | Fang X , Han D , Cheng Q , Zhang P , Zhao C , Min J , Wang F ((2018) ) Association of levels of physical activity with risk of Parkinson disease: A systematic review and meta-analysis. JAMA Netw Open 1: , e182421. |
[59] | Jin X , Liu M-Y , Zhang D-F , Gao H , Wei M-J ((2018) ) Elevated circulating magnesium levels in patients with Parkinson’s disease: A meta-analysis. Neuropsychiatr Dis Treat 14: , 3159–3168. |
[60] | Luo X , Ou R , Dutta R , Tian Y , Xiong H , Shang H ((2018) ) Association between serum vitamin D levels and Parkinson’s disease: A systematic review and meta-analysis. Front Neurol 9: , 909. |
[61] | Wang S , Mao S , Xiang D , Fang C ((2018) ) Association between depression and the subsequent risk of Parkinson’s disease: A meta-analysis. Prog Neuropsychopharmacol Biol Psychiatry 86: , 186–192. |
[62] | Jiang L , Zhang H , Wang C , Ming F , Shi X , Yang M ((2019) ) Serum level of brain-derived neurotrophic factor in Parkinson’s disease: A meta-analysis. Prog Neuropsychopharmacol Biol Psychiatry 88: , 168–174. |
[63] | Qiu X , Xiao Y , Wu J , Gan L , Huang Y , Wang J ((2019) ) C-Reactive protein and risk of Parkinson’s disease: A systematic review and meta-analysis. Front Neurol 10: , 384. |
[64] | Li Y , Schoufour J , Wang DD , Dhana K , Pan A , Liu X , Song M , Liu G , Shin HJ , Sun Q , Al-Shaar L , Wang M , Rimm EB , Hertzmark E , Stampfer MJ , Willett WC , Franco OH , Hu FB ((2020) ) Healthy lifestyle and life expectancy free of cancer, cardiovascular disease, and type 2 diabetes: Prospective cohort study. BMJ 368: , l6669. |
[65] | Dietz WH , Douglas CE , Brownson RC ((2016) ) Chronic disease prevention: Tobacco avoidance, physical activity, and nutrition for a healthy start. JAMA 316: , 1645–1646. |
[66] | Xu X , Fu Z , Le W ((2019) ) Exercise and Parkinson’s disease. Int Rev Neurobiol 147: , 45–74. |
[67] | Poole R , Kennedy OJ , Roderick P , Fallowfield JA , Hayes PC , Parkes J ((2017) ) Coffee consumption and health: Umbrella review of meta-analyses of multiple health outcomes. BMJ 359: , j5024. |
[68] | Abe SK , Inoue M (2020) Green tea and cancer and cardiometabolic diseases: A review of the current epidemiological evidence. Eur J Clin Nutr, doi: 10.1038/s41430-020-00710-7 |
[69] | Ritz B , Lee PC , Lassen CF , Arah OA ((2014) ) Parkinson disease and smoking revisited: Ease of quitting is an early sign of the disease. Neurology 83: , 1396–1402. |
[70] | Pollock M , Fernandes RM , Pieper D , Tricco AC , Gates M , Gates A , Hartling L ((2019) ) Preferred reporting items for overviews of reviews (PRIOR): A protocol for development of a reporting guideline for overviews of reviews of healthcare interventions. Syst Rev 8: , 335. |
[71] | Nicholatos JW , Francisco AB , Bender CA , Yeh T , Lugay FJ , Salazar JE , Glorioso C , Libert S ((2018) ) Nicotine promotes neuron survival and partially protects from Parkinson’s disease by suppressing SIRT6. Acta Neuropathol Commun 6: , 120. |
[72] | Quik M , Perez XA , Bordia T ((2012) ) Nicotine as a potential neuroprotective agent for Parkinson’s disease. Mov Disord 27: , 947–957. |
[73] | Hackshaw A , Morris JK , Boniface S , Tang JL , Milenković D ((2018) ) Low cigarette consumption and risk of coronary heart disease and stroke: Meta-analysis of 141 cohort studies in 55 study reports. BMJ 360: , j5855. |
[74] | Freedman ND , Silverman DT , Hollenbeck AR , Schatzkin A , Abnet CC ((2011) ) Association between smoking and risk of bladder cancer among men and women. JAMA 306: , 737–745. |
[75] | Willi C , Bodenmann P , Ghali WA , Faris PD , Cornuz J ((2007) ) Active smoking and the risk of type 2 diabetes: A systematic review and meta-analysis. JAMA 298: , 2654–2664. |
[76] | Berg D , Postuma RB , Adler CH , Bloem BR , Chan P , Dubois B , Gasser T , Goetz CG , Halliday G , Joseph L , Lang AE , Liepelt-Scarfone I , Litvan I , Marek K , Obeso J , Oertel W , Olanow CW , Poewe W , Stern M , Deuschl G ((2015) ) MDS research criteria for prodromal Parkinson’s disease. Mov Disord 30: , 1600–1611. |
[77] | D’Onofrio BM , Lahey BB , Turkheimer E , Lichtenstein P ((2013) ) Critical need for family-based, quasi-experimental designs in integrating genetic and social science research. Am J Public Health 103: (Suppl 1), S46–S55. |
[78] | Allman PH , Aban IB , Tiwari HK , Cutter GR ((2018) ) An introduction to Mendelian randomization with applications in neurology. Mult Scler Relat Disord 24: , 72–78. |
[79] | Katikireddi SV , Green MJ , Taylor AE , Davey Smith G , Munafò MR ((2018) ) Assessing causal relationships using genetic proxies for exposures: An introduction to Mendelian randomization. Addiction 113: , 764–774. |
[80] | Murad MH , Asi N , Alsawas M , Alahdab F ((2016) ) New evidence pyramid. Evid Based Med 21: , 125–127. |
[81] | Grimes DA , Schulz KF ((2002) ) Bias and causal associations in observational research. Lancet 359: , 248–252. |
[82] | Evans AH , Lawrence AD , Potts J , MacGregor L , Katzenschlager R , Shaw K , Zijlmans J , Lees AJ ((2006) ) Relationship between impulsive sensation seeking traits, smoking, alcohol and caffeine intake, and Parkinson’s disease. J Neurol Neurosurg Psychiatry 77: , 317–321. |
[83] | Peters SA-O , Gallo VA-O , Vineis P , Middleton LT , Forsgren L , Sacerdote C , Sieri S , Kyrozis A , Chirlaque MD , Zamora-Ros R , Hansson O , Petersson J , Katzke V , Kühn T , Mokoroa O , Masala G , Ardanaz E , Panico S , Bergmann MM , Key TJ , Weiderpass E , Ferrari P , Vermeulen R ((2020) ) Alcohol consumption and risk of Parkinson’s disease: Data from a large prospective European cohort. Mov Dis 35: , 1258–1263. |
[84] | Yang F , Trolle Lagerros Y , Bellocco R , Adami HO , Fang F , Pedersen NL , Wirdefeldt K ((2015) ) Physical activity and risk of Parkinson’s disease in the Swedish National March Cohort. Brain 138: , 269–275. |
[85] | Hopfner F , Höglinger GU , Kuhlenbäumer G , Pottegård A , Wod M , Christensen K , Tanner CM , Deuschl G ((2020) ) β-adrenoreceptors and the risk of Parkinson’s disease. Lancet Neurol 19: , 247–254. |
[86] | Viera AJ ((2008) ) Odds ratios and risk ratios: What’s the difference and why does it matter? South Med J 101: , 730–734. |
[87] | Booth A , Clarke M , Dooley G , Ghersi D , Moher D , Petticrew M , Stewart L ((2012) ) The nuts and bolts of PROSPERO: An international prospective register of systematic reviews. Syst Rev 1: , 2. |
[88] | Liberati A , Altman DG , Tetzlaff J , Mulrow C , Gøtzsche PC , Ioannidis JP , Clarke M , Devereaux PJ , Kleijnen J , Moher D ((2009) ) The PRISMA statement for reporting systematic reviews and meta-analyses of studies that evaluate health care interventions: Explanation and elaboration. J Clin Epidemiol 62: , e1–34. |
[89] | Dekkers OM , Vandenbroucke JP , Cevallos M , Renehan AG , Altman DG , Egger M ((2019) ) COSMOS-E: Guidance on conducting systematic reviews and meta-analyses of observational studies of etiology. PLoS Med 16: , e1002742. |
[90] | Mueller M , D’Addario M , Egger M , Cevallos M , Dekkers O , Mugglin C , Scott P ((2018) ) Methods to systematically review and meta-analyse observational studies: A systematic scoping review of recommendations. BMC Med Res Methodol 18: , 44. |

