
The Human Hippocampus in Parkinson’s Disease: An Integrative Stereological and Proteomic Study
Abstract
Background:
Parkinson’s disease (PD) is a prevalent neurodegenerative disease that is pathologically described as a six-stage α-synucleinopathy. In stage 4, α-synuclein reaches the hippocampus, inducing cognitive deficits, from which it progresses to the isocortex, leading to dementia. Among hippocampal fields, cornu ammonis 2 is particularly affected by this α-synucleinopathy and critical for cognitive decline. Volumetric studies using magnetic resonance imaging have produced controversial results, with only some reporting volume loss, whereas stereological data obtained using nonspecific markers do not reveal volume changes, neural or glial loss. Proteomic analysis has not been carried out in the hippocampus of patients with PD.
Objective:
This study aims to explain hippocampal changes in patients with PD at the cellular and proteomic levels.
Methods:
α-Synuclein inclusions, volume and neural (NeuN), microglial (Iba-1) and astroglial (GFAP) populations were stereologically analyzed. SWATH-MS quantitative proteomic analysis was also conducted.
Results:
Area fraction fractionator probe revealed a higher area fraction α-synucleinopathy in cornu ammonis 2. No volume change, neurodegeneration, microgliosis or astrogliosis was detected. Proteomic analysis identified 1,634 proteins, of which 83 were particularly useful for defining differences among PD and non-PD groups. Among them, upregulated (PHYIP, CTND2, AHSA1 and SNTA1) and downregulated (TM163, REEP2 and CSKI1) proteins were related to synaptic structures in the diseased hippocampus.
Conclusion:
The distribution of α-synuclein in the hippocampus is not associated with volumetric, neural or glial changes. Proteomic analysis, however, reveals a series of changes in proteins associated with synaptic structures, suggesting that hippocampal changes occur at the synapse level during PD.
INTRODUCTION
Parkinson’s disease (PD) is an idiopathic, highly prevalent neurodegenerative disorder [1, 2]. Neuropathologically, PD is characterized by the misfolding and intracellular aggregation of α-synuclein (α-syn), which forms so-called Lewy bodies and neurites [3]. According to the prion-like hypothesis, α-syn spreads through neuronal connections and glia [4–6]. This spread may explain the involvement of α-syn in different connected brain areas in a predictable six-stage sequence [7], which to some extent relates to clinical symptoms [8–10]. A long prodromal period during stages 1 and 2 characterized by nonmotor manifestations has been reported [11, 12]. Motor symptoms (tremor, bradykinesia and rigidity), which are used for clinical diagnosis, result from substantia nigra damage in stage 3. In stage 4, Lewy pathology reaches the hippocampus (HP), leading to cognitive impairment, which spreads into the cortex and eventually leads to dementia in late stages 5-6 [13].
In patients with PD, cognitive dysfunction affects multiple domains, but episodic memory impairment is among the most remarkable manifestations reported [14]. To date, researchers have focused on the HP because the medial temporal lobe has been identified as crucial for encoding and memory consolidation [15]. Considering the HP as a unique structure, however, does not facilitate the elucidation of the different mechanisms of cognitive performance [16]. Indeed, the HP comprises different subfields (cornu ammonis, CA1-3, and the dentate gyrus, DG) [17]. Moreover, the HP (proper) is connected with other parahippocampal structures, such as the subiculum and the entorhinal cortex (EC). Cortical inputs to the EC are relayed through the perforant path to the DG and to the CA1, CA3 and subiculum. Intrahippocampally, the DG projects onto CA3 via mossy fibers, these neurons project onto CA1 via Schaffer collaterals, which in turn project to the subiculum. CA1 and the subiculum project back to the EC, which is interconnected to the isocortex [18]. This well-established network includes a number of hubs, but not CA2, which is paradoxically early and preferentially involved in Lewy pathology [7, 19]. New data on the CA2 connectome may provide insights into this issue [20–22].
Previous stereological analyses showed that the accumulation of Lewy pathology in CA2 [23–25], particularly Lewy neurites [7, 19], correlates with the severity of cognitive impairment in patients with PD [26, 27]. The relationship between CA2, α-syn and cognitive dysfunction constitutes a cornerstone in the field that is far from being resolved [21]. However, no studies have analyzed the area fraction, namely, the area occupied by α-syn, in the hippocampal fields. The present study constitutes the first evaluation using this stereological approach.
Several magnetic resonance imaging (MRI) studies have indicated correlations between hippocampal atrophy and the degree of mild cognitive impairment with dementia [28–31]. Few studies, however, have considered the different hippocampal subfields. Although some studies have correlated CA2-CA3 atrophy with the level of dementia and suggest that CA2 is a distinctive subfield for neurodegeneration in individuals with PD, as it is the starting point for cognitive decline [32–34], these findings remain inconclusive due to the difficulty of clearly discriminating the CA2 subfield in imaging studies [35].
Several stereological studies have verified atrophy and neurodegeneration in different areas in the postmortem brain of patients with PD [36, 37]. Two reports analyzing volumetric changes and neuronal and glial populations in different hippocampal subfields in Giemsa-stained [38] and cresyl violet-stained [39] sections concluded that no differences existed between PD and non-Parkinson’s disease (NPD) groups [38]. Recently, proteomic approaches have shown how α-syn accumulation affects protein homeostasis, leading to cell death, but these analyses have not been carried out in the HP [40]. The present study, therefore, aims to analyze α-synucleinopathy, volumetry, neurodegeneration (neuronal nuclear protein, NeuN) and gliosis (ionized calcium-binding adapter molecule 1, Iba-1; glial fibrillary acidic protein, GFAP) among hippocampal fields and to provide the first proteomic overview of the HP by identifying proteins as putative biomarkers of PD.
MATERIALS AND METHODS
Human brain tissue
Samples (N = 40) from patients with PD (n = 20) and NPD (n = 20) were used in the present study (Table 1 and Supplementary Figure 1). Samples, clinical data and neuropathological diagnoses were provided by Institut d’Investigacions Biomèdiques August Pi i Sunyer (IDIBAPS), Biobanco en Red de la Región de Murcia (BIOBANC-MUR), Biobanco de Tejidos de la Fundación CIEN (BTCIEN) and Biobanco del Principado de Asturias, integrated in the Spanish National Biobanks Network, and they were processed according to standard operating procedures with appropriate approval of the Ethical and Scientific Committees. Fixed samples were used for Nissl staining and immunohistochemistry was performed with antibodies against NeuN, Iba-1 and GFAP (PD n = 15 and NPD n = 15) or α-syn (PD n = 9 and NPD n = 2) (see IH1 and IH2 in the Assay column of Table 1, and Supplementary Figure 1). Among the fixed samples from patients with PD, n = 8 individuals were neuropathologically diagnosed with PD with dementia (PDD) (Table 1 and Supplementary Figure 1). Frozen samples were used for proteomic analyses (PD n = 5 and NPD n = 5) (see PR in the Assay column of Table 1 and Supplementary Figure 1). Immunofluorescence staining was carried out to validate the proteomic results (PD n = 3; NPD n = 3) (see IF in the Assay column of Table 1 and Supplementary Figure 1). All experiments were performed in accordance with the Ethics Committee of Clinical Research at Ciudad Real University Hospital (SAF2016-75768-R and PID2019-108659RB-I00).
Table 1
Demographic, clinicopathological features and assay of the subjects with PD and NPD
| Case | PDx | Assay | Braak α-syn stage | Rg | BH | A | Sex | PMD | W | D-PD | OF | Cause of death | ||
| 1# | PD* | IH1,2 | 5 | R | L | 77 | M | 05:00 | 1320 | 4 | Fd | Cardiorespiratory arrest | ||
| 2 | PD | IH1,2 | 6 | R | L | 65 | M | n.a. | 1305 | 9 | Fd | n.a. | ||
| 3# | PD* | IH1 | 6 | R | L | 77 | M | 12:00 | 1050 | 6 | Fd | Pulmonary thromboembolism | ||
| 4# | PD* | IH1 | 4 | R | R | 77 | M | 12:00 | 1310 | 7 | Fd | Multiorgan failure | ||
| 5# | PD* | IH1,2 | IF | 5 | R | L | 78 | M | 05:15 | 1210 | n.a. | FF | Respiratory infection (Bronchoaspiration) | |
| 6# | PD* | IH1,2 | 6 | I | L | 80 | M | 05:00 | 1062 | n.a. | Fd | Bronchial aspiration pneumonia | ||
| 7 | PD | IH1,2 | IF | 5 | I | L | 79 | F | 06:00 | 1210 | 9 | Fd | Respiratory insufficiency | |
| 8 | PD | IH1,2 | 6 | I | L | 90 | F | 03:50 | 812 | l.e. | Fd | Adenocarcinoma of the breast | ||
| 9 | PD | IH1 | 4 | I | L | 79 | F | 05:00 | 1025 | n.a. | Fd | n.a. | ||
| 10 | PD | IH1 | 4 | I | R | 80 | M | 16:30 | 1360 | n.a. | Fd | Cardiorespiratory arrest | ||
| 11# | PD* | IH1,2 | 5 | C | L | 82 | F | 02:00 | 1300 | 22 | Fd | Cardiorespiratory arrest | ||
| 12# | PD* | IH1 | 6 | C | L | 82 | M | 05:00 | n.a. | 8 | Fd | n.a. | ||
| 13 | PD | IH1,2 | IF | 5 | C | L | 80 | M | 06:00 | 1231 | n.a. | Fd | Nosocomial pneumonia | |
| 14 | PD | IH1 | 5 | C | R | 81 | M | 07:20 | 1405 | n.a. | Fd | Acute cardiorespiratory insufficiency | ||
| 15# | PD* | IH1,2 | 6 | C | L | 80 | F | 03:00 | 1200 | 5 | Fd | Multiorgan failure | ||
| 16 | PD* | PR | 5 | C | L | 75 | F | 03:45 | 1095 | n.a. | F | Multiorgan failure | ||
| 17 | PD* | PR | 6 | C | L | 72 | M | 06:00 | 1160 | 15 | F | Advanced cognitive deterioration and kidney failure | ||
| 18 | PD* | PR | 5 | R | L | 62 | M | 13:30 | 1355 | n.a. | F | Cardiorespiratory arrest. Enterocolitis and urinary infection | ||
| 19 | PD* | PR | 6 | C | L | 79 | M | 01:50 | 1260 | 11 | F | Multiorgan failure | ||
| 20 | PD* | PR | 5 | C | L | 87 | M | 15:15 | 1370 | n.a. | F | Multiorgan failure | ||
| 21# | NPD | IH1 | – | R | L | 58 | F | 05:00 | 944 | – | Fd | Pneumonia | ||
| 22 | NPD | IH1 | – | R | L | 43 | M | 05:00 | 1412 | – | Fd | Septic shock secondary to pneumonia | ||
| 23# | NPD | IH1,2 | IF | – | R | L | 75 | M | 04:00 | 1250 | – | Fd | Multiorgan failure | |
| 24# | NPD | IH1 | – | R | L | 62 | F | 02:00 | 1050 | – | Fd | Cardiorespiratory arrest | ||
| 25# | NPD | IH1 | – | R | L | 78 | M | 12:00 | 1400 | – | Fd | Respiratory insufficiency. Multiorgan failure | ||
| 26# | NPD | IH1 | – | I | L | 81 | F | 05:00 | 1100 | – | Fd | Multiorgan failure | ||
| 27 | NPD | IH1 | – | I | R | 83 | F | 07:20 | 1320 | – | Fd | Intestinal ischemia due to embolism during IQ Rheumatic heart valve disease | ||
| 28 | NPD | IH1 | – | I | L | 84 | M | 03:00 | 1400 | – | Fd | Cardiac arrest | ||
| 29 | NPD | IH1 | – | I | R | 90 | F | 12:20 | 1175 | – | Fd | Cerebral hemorrhage | ||
| 30 | NPD | IH1 | IF | – | I | R | 86 | M | 07:25 | 1365 | – | Fd | Cardio-Renal Syndrome | |
| 31# | NPD | IH1 | – | C | L | 83 | M | 04:00 | 1152 | – | Fd | n.a. | ||
| 32# | NPD | IH1 | – | C | L | 88 | M | 03:00 | 1285 | – | Fd | n.a. | ||
| 33# | NPD | IH1,2 | IF | – | C | L | 78 | M | 04:00 | 1100 | – | Fd | Respiratory insufficiency | |
| 34 | NPD | IH1 | – | C | L | 62 | F | 02:00 | 1050 | – | Fd | Cardiorespiratory arrest | ||
| 35 | NPD | IH1 | – | C | L | 63 | M | 02:00 | 1400 | – | Fd | Cardiorespiratory arrest | ||
| 36 | NPD | PR | – | R | L | 69 | M | 10:15 | 1110 | – | F | Pneumonia (background COPD) | ||
| 37 | NPD | PR | – | C | L | 83 | M | 13:00 | 1630 | – | F | Cardiorespiratory insufficiency in the context of gastroenteritis | ||
| 38 | NPD | PR | – | R | L | 83 | F | 07:20 | 1320 | – | F | Intestinal ischemia due to embolism during IQ Rheumatic heart valve disease | ||
| 39 | NPD | PR | – | C | R | 37 | F | 09:00 | 1200 | – | F | Cardiorespiratory arrest | ||
| 40 | NPD | PR | – | C | R | 57 | M | 12:00 | 1560 | – | F | Cardiorespiratory arrest | ||
# Cases used in the stereological analysis not shown between the PD* and NPD group. PDx, pathological diagnosis; PD, Parkinson’s disease; PD*, Parkinson’s disease with dementia (PDD); NPD, non-Parkinson’s disease; IH1, immunohistochemistry against NeuN, Iba-1 and GFAP; IH2, immunohistochemistry against α-synuclein; IF, immunofluorescence against selected proteins of proteomic study; PR, proteomic; Rg, anatomical region; R, rostral; I, intermediate; C, caudal; BH, brain hemisphere; L, left; R, right; A, age (years); M, male; F, female; PMD, post-mortem delayed (hh:mm); W, autopsy brain weight (g); D-PD, PD duration (years); l.e,: long evolution; OF, Original Fixation; Fd, formaldehyde; FF, frozen turned to formaldehyde; F, frozen; n.a., not available.
Tissue sections for histology
Tissues were postfixed in fresh 4%paraformaldehyde in phosphate-buffered saline to standardize the sample conditions. For cryoprotection, tissues were embedded in a solution of phosphate-buffered saline containing 2%dimethyl sulfoxide (DMSO) and 10%glycerol for 48 h and subsequently in a solution of phosphate-buffered saline containing 2%DMSO and 20%glycerol for 48 h. The tissues were covered in 30%sucrose and cut into 50μm coronal sections with a freezing microtome. Thirteen serial sections were obtained: one was stained with Nissl and the remaining sections were used for immunohistochemistry or immunofluorescence staining or were stored [41, 42].
Immunohistochemical and immunofluorescence staining procedures
For immunohistochemical staining, epitopes were unmasked by boiling the tissue in citrate buffer under pressure for 2 min. The tissue was then immersed in formic acid for 3 min and rinsed with 0.01 M phosphate-buffered saline (PBS, pH 7.4). The activity of endogenous peroxidases was quenched by adding 1%H2O2 and incubating the sections for 20 min. The blocking buffer step was carried out depending on the markers assessed (Table 2). Sections were incubated overnight at 4°C with primary antibodies against NeuN, Iba-1 and GFAP or for 72 h at 4°C with a primary α-syn antibody. Sections were incubated with the secondary biotinylated antibody for 2 h at room temperature (Table 2). Subsequently, the avidin-biotin complex (ABC standard, Vector) was applied to the sections, incubated for 90 min, and then reacted with 0.025%3,3’-diaminobenzidine and 0.1%H2O2. The sections were mounted onto slides, counterstained with Nissl, and coverslipped with DPX (BDH, Poole, UK).
Table 2
Primary and secondary antibodies used
| Antigen | Company | Catalog | Host | Dilution | BB | Incubation | Secondary antibody |
| Number | |||||||
| NeuN | Abcam (Cambridge, USA) | ab104225 | Rabbit polyclonal | 1:500 | PBS + 0.4%TX-100 + 10%NHS | 4°C overnight | 1:200 Biotinylated horse anti-rabbit IgG (H + L). Vector laboratories (CA, USA). |
| Iba-1 | Fujifilm WAKO (Neuss, Germany) | 019–19741 | Rabbit polyclonal | 1:2000 | PBS + 0.1%TX-100 | 4°C overnight | 1:200 Biotinylated horse anti-rabbit IgG (H + L). Vector laboratories (CA, USA) |
| GFAP | Dako (Denmark) | Z0334 | Rabbit polyclonal | 1:10000 | PBS + 0.1%TX-100 + 10%NHS | 4°C overnight | 1:200 Biotinylated horse anti-rabbit IgG (H + L). Vector laboratories (CA, USA). |
| α-Synuclein | Novocastra (Newcastle, UK) | NCL-L-ASYN | Mouse monoclonal | 1:20 | – | 4°C 72 hours | 1:200 Biotinylated horse anti-mouse IgG (H + L). Vector laboratories (CA, USA). |
| TMEM163 | Thermo Fisher Scientifi (Massachusetts, USA) | PA5107039 | Rabbit polyclonal | 1:100 | TBS + 0.1%TX-100 + 5%NHS | 4°C overnight | 1:200 Alexa Fluor® 488 donkey anti-rabbit. Invitrogen (Massachusetts, USA). |
| Caskin-1 | Thermo Fisher Scientific (Massachusetts, USA) | PA563228 | Rabbit polyclonal | 1:100 | TBS + 0.1%TX-100 + 5%NHS | 4°C overnight | 1:200 Alexa Fluor® 488 donkey anti-rabbit. Invitrogen (Massachusetts, USA). |
| REEP2 | Thermo Fisher Scientific (Massachusetts, USA) | PA556867 | Rabbit polyclonal | 1:100 | TBS + 0.1%TX-100 + 5%NHS | 4°C overnight | 1:200 Alexa Fluor® 488 donkey anti-rabbit. Invitrogen (Massachusetts, USA). |
| PHYHIPL | Santa Cruz (Santa Cruz, California) | sc-514256 | Mouse monoclonal | 1:100 | TBS + 0.1%TX-100 + 5%NHS | 4°C overnight | 1:200 Alexa Fluor® 568 donkey anti-mouse. Invitrogen (Massachusetts, USA). |
| AHA-1 | Santa Cruz (Santa Cruz, California) | sc-166610 | Mouse monoclonal | 1:100 | TBS + 0.1%TX-100 + 5%NHS | 4°C overnight | 1:200 Alexa Fluor® 568 donkey anti-mouse. Invitrogen (Massachusetts, USA). |
| α-1-Syntrophin | Santa Cruz (Santa Cruz, California) | sc-166634 | Mouse monoclonal | 1:100 | TBS + 0.1%TX-100 + 5%NHS | 4°C overnight | 1:200 Alexa Fluor® 568 donkey anti-mouse. Invitrogen (Massachusetts, USA). |
| δ2-Catenin | Santa Cruz (Santa Cruz, California) | sc-81793 | Mouse monoclonal | 1:100 | TBS + 0.1%TX-100 + 5%NHS | 4°C overnight | 1:200 Alexa Fluor® 568 donkey anti-mouse. Invitrogen (Massachusetts, USA). |
For immunofluorescence staining, tissue antigenicity was unmasked as described above. Sections were incubated overnight at 4°C with the primary antibody and with a fluorescent secondary antibody for 2 h at room temperature (Table 2). The sections were counterstained with 0.01%4’,6-diamidino-2-phenylindole (DAPI) for 5 min, mounted, dried, and coverslipped with PVA-DABCO (Sigma–Aldrich, St. Louis, MO, USA).
Stereological quantification
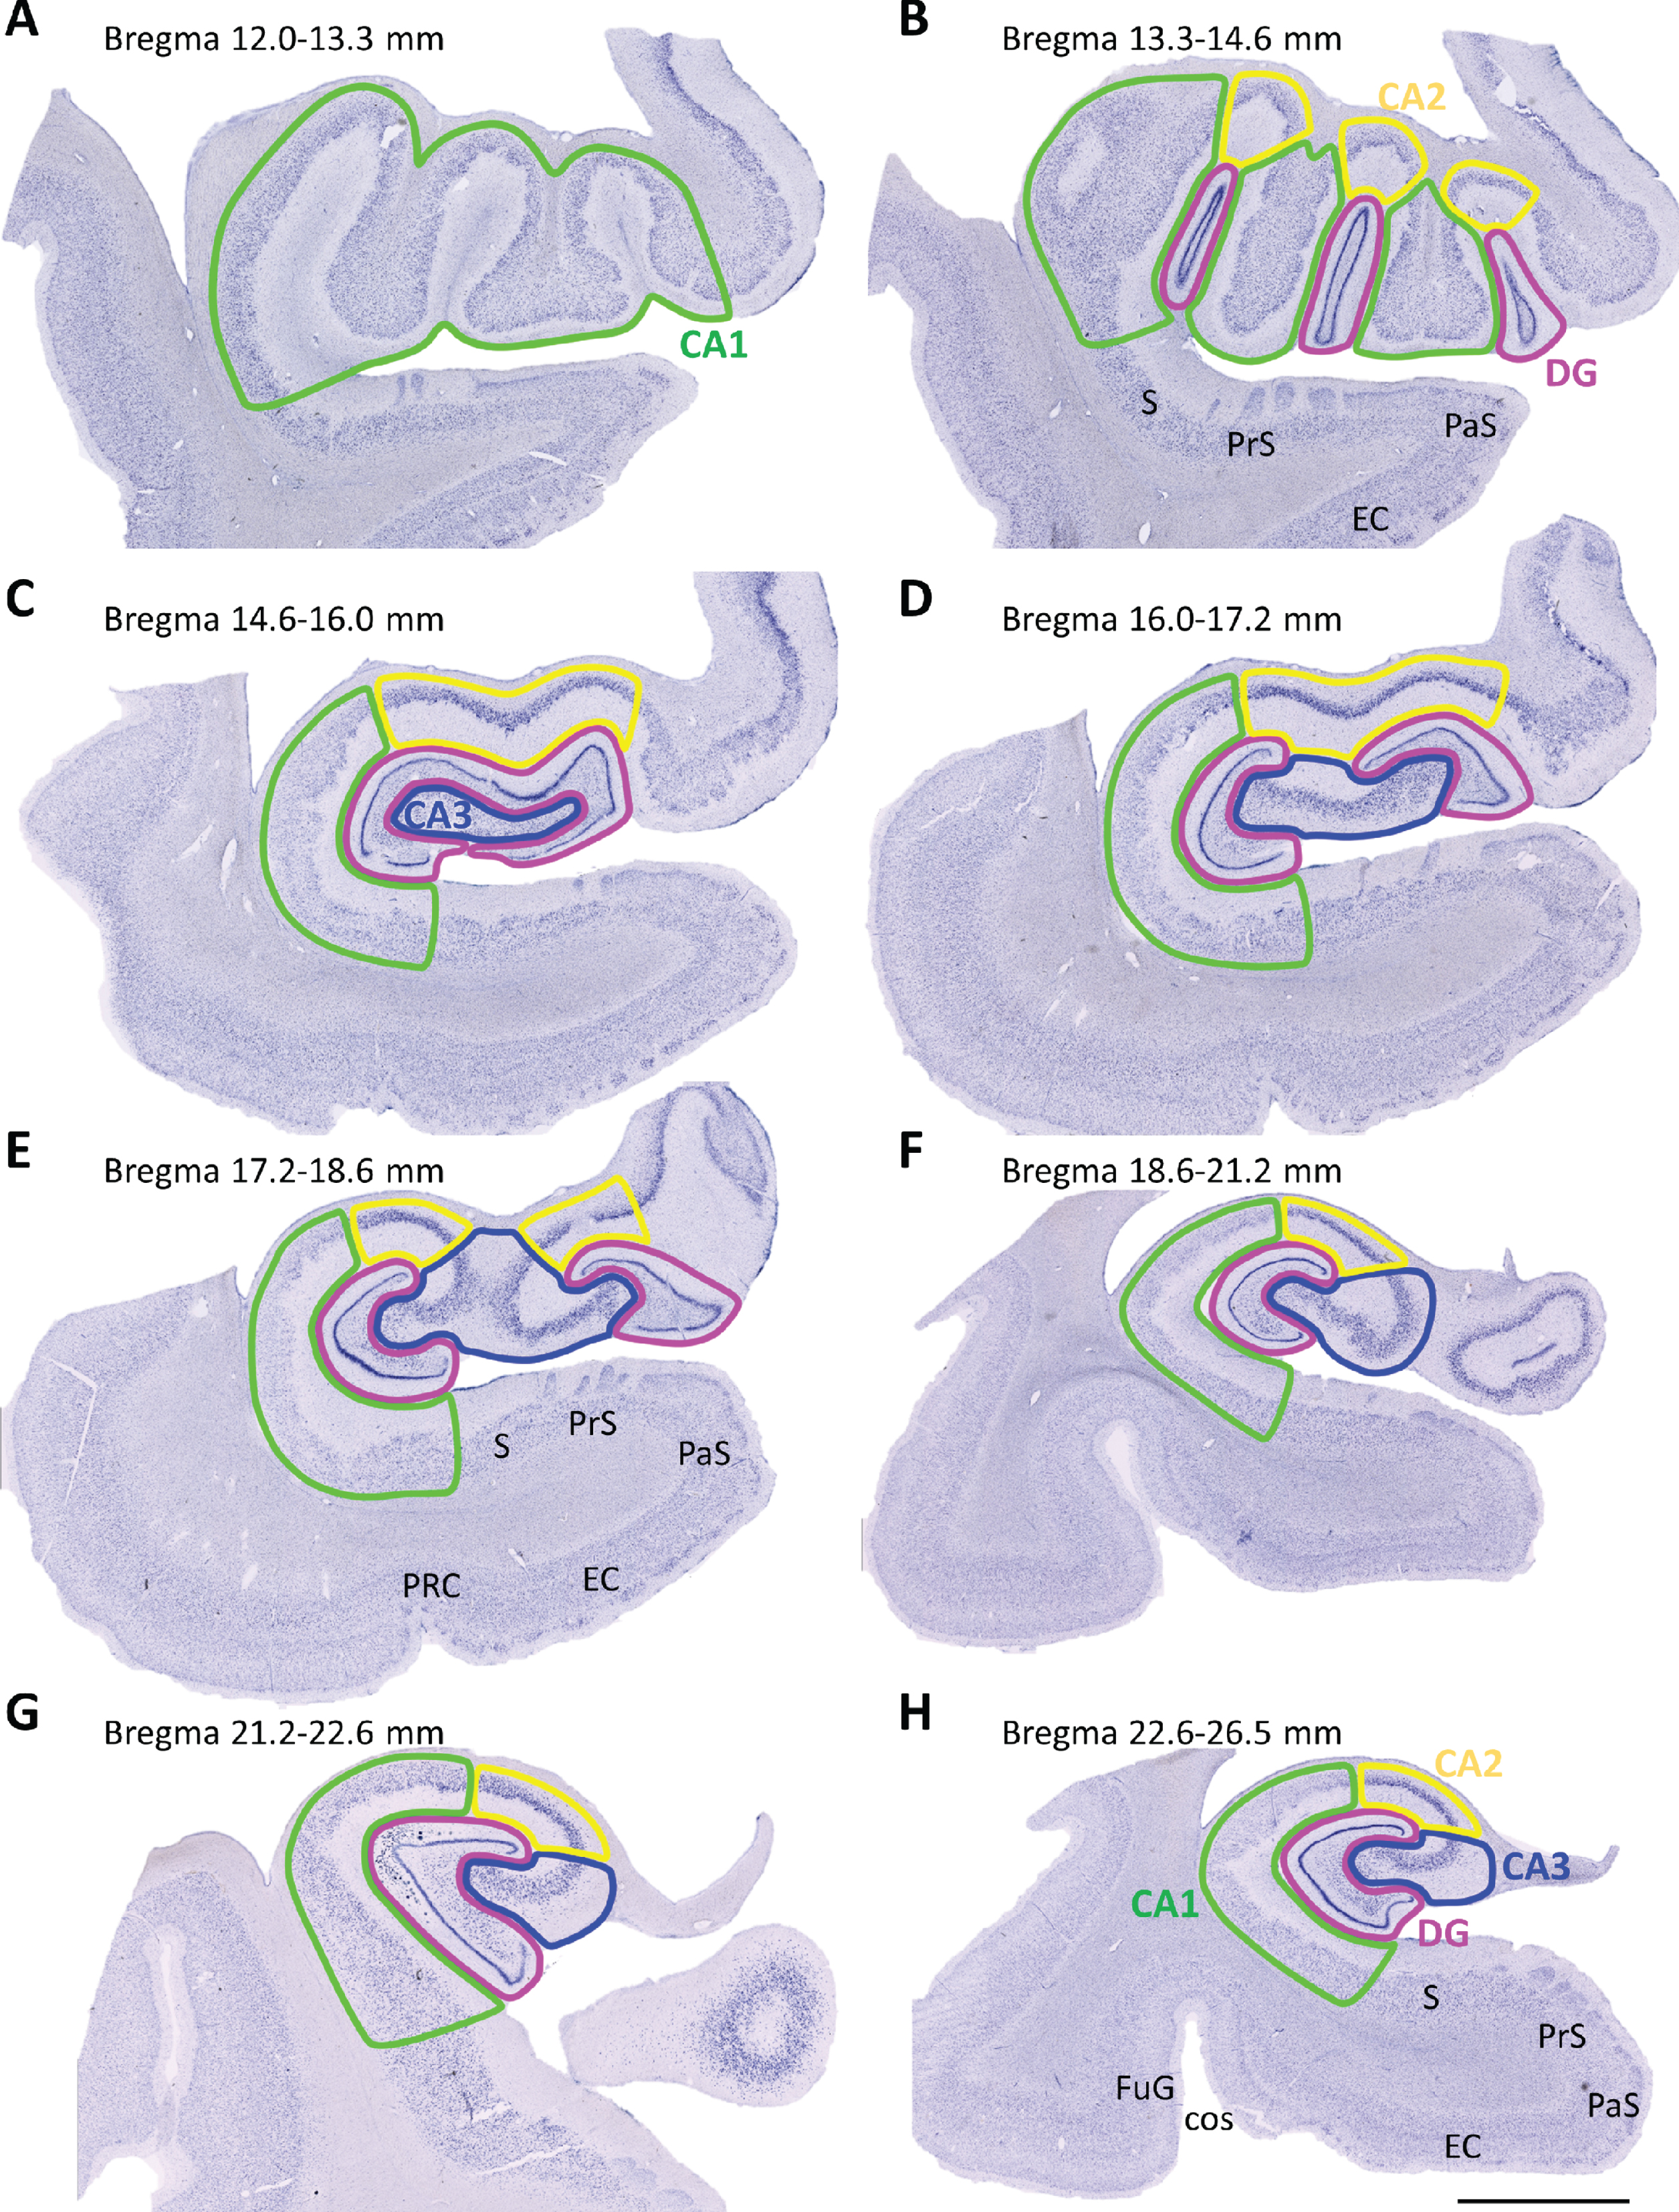
Samples were divided into three groups according to the rostrocaudal extent of the tissue blocks: rostral (bregma 12.0–16.0 mm), intermediate (bregma 16.0–21.2 mm) and caudal HP (bregma 21.2–26.5 mm) (Fig. 1) [43]. Stereo Investigator software (MBF Bioscience coupled to a Zeiss Axio Imager M2 microscope) was used for stereological analyses. Boundaries of the DG, CA3, CA2, CA1 and HP were outlined (Plan-Neofluar 1x/0.025, Ref. 420300-9900) (Fig. 1) [43–45].
Fig. 1
Mosaic reconstruction of coronal Nissl-stained sections of the human hippocampus. The numbers above show the level of bregma (mm). (A-B) Rostral (12.0–16.0 mm), (C-E) intermediate (16.0–21.2 mm) and (F-H) caudal (21.2–26.5 mm) hippocampus sections were examined. Dentate gyrus (DG), cornu ammonis (CA), subiculum (S), presubiculum (PrS), parasubiculum (PaS), entorhinal cortex (EC), perirhinal cortex (PRC), fusiform gyrus (FuG), collateral sulcus (cos). Scale bar 5000μm.
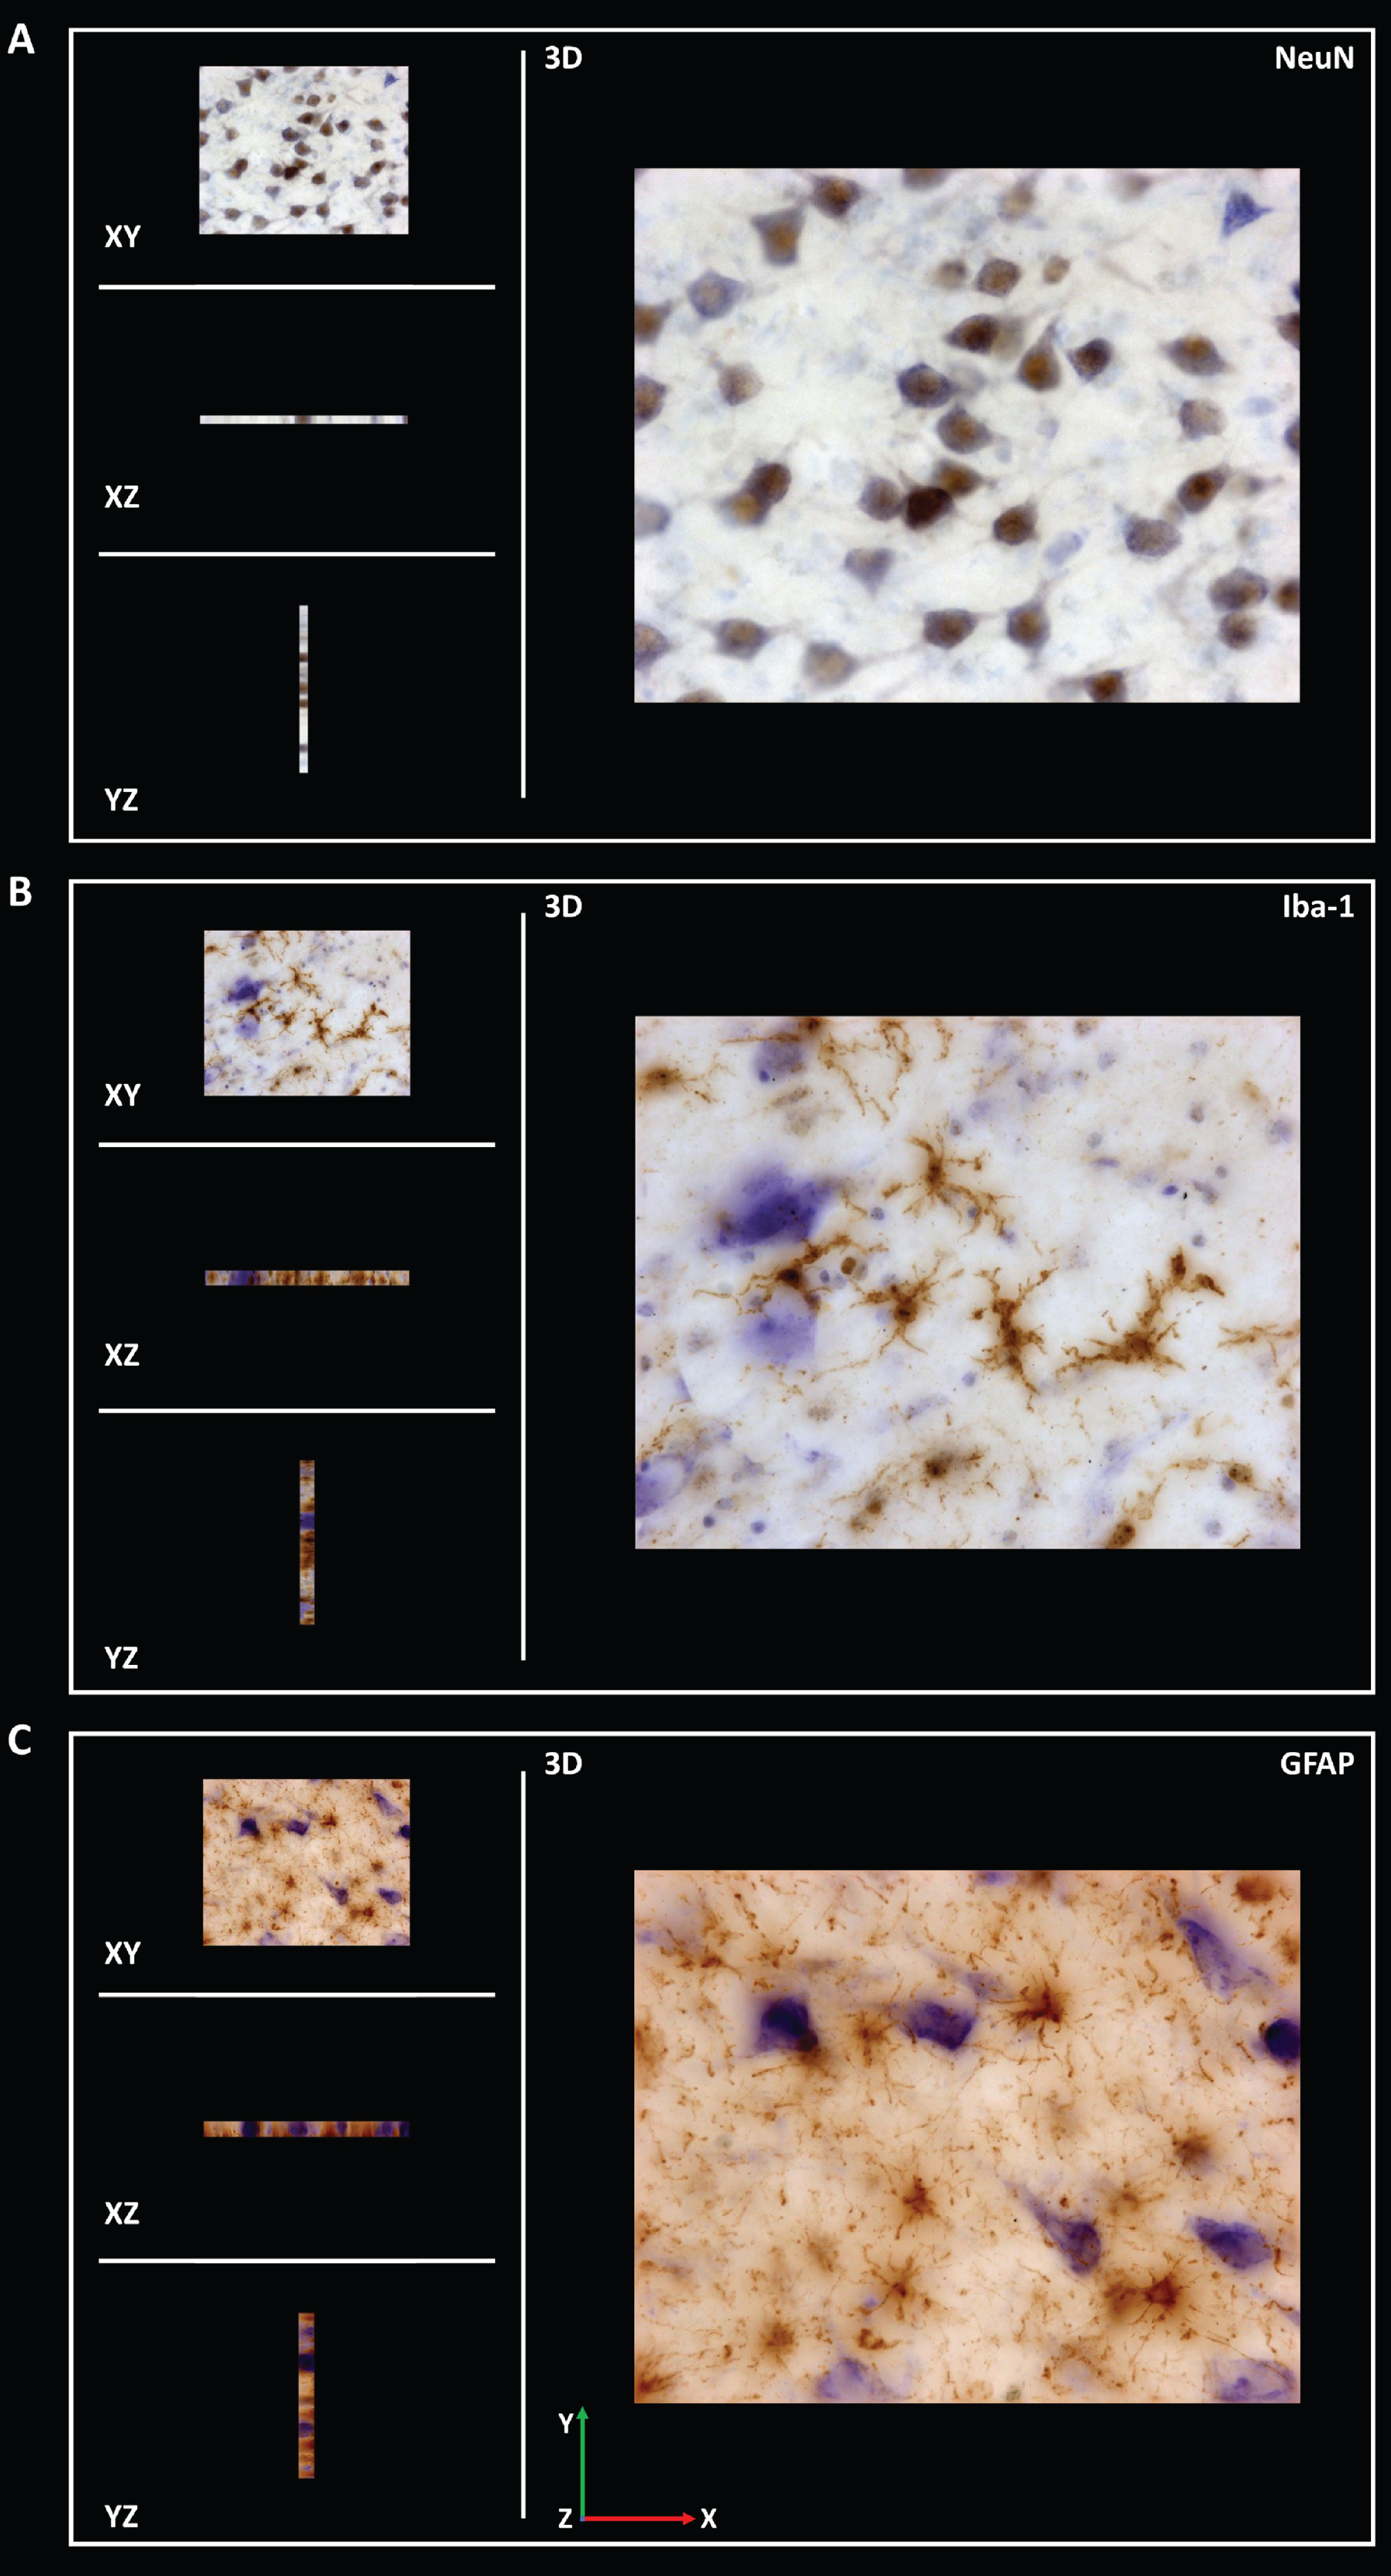
Different probes were consecutively used for the stereological analysis. The fraction of area occupied by α-syn (area fraction) was analyzed using the area fraction fractionator method (Plan Apochromat 20x/0.5, Ref. 420650-9901) (Supplementary Table 1). This analysis estimates the percentage of area occupied by α-syn. The software randomly superimposes a two-dimensional frame with a point grid on the study area. One marker is correlated with points for one type of staining (α-syn), while another marker is used for the remaining tissue (neuropil). The number of points on α-syn is divided by the total number of points to obtain the estimated area [37]. Volume was estimated with Cavalieri’s probe using Nissl staining (Plan-Neofluar 1x/0.025, Ref. 420300-9900) (Supplementary Table 2). The optical fractionator method was applied to analyze the density (estimated population using mean section thickness/measured volume) of neurons (NeuN), microglia (Iba-1) and astroglia (GFAP) (Plan Apochromat, 63x/1.4, Oil lens, Ref. 420782–9900) (Supplementary Tables 3–5). Z-stacks of NeuN, Iba-1 and GFAP (15μm thickness) staining were acquired to analyze the infiltration of the corresponding antibodies. The distance between z-stack images was 1μm (Fig. 2 and Supplementary Figures 2–4). The optical fractionator is an unbiased probe that is not influenced by the size, shape, spatial orientation or spatial distribution of the cells under study. The counting frame is composed of red and green lines. Cells were counted if their soma was within the counting frame or if they touched the green line without touching the red line. A height dissector was obtained from a previous analysis of several measurements of the thickness of each section, selecting the shorter section. This value was maintained throughout the quantification. Guard zones prevent possible tissue artifacts on the top and bottom surfaces and reduce the section thickness available for counting. The number of cells counted in the study area was divided by the estimated volume of the region [37].
Fig. 2
Coronal sections of z-stack of the human hippocampus immunohistochemically stained for NeuN (A), Iba-1 (B) and GFAP (C) were acquired to analyze the infiltration of respective antibodies.
Sample preparation for the proteomic analysis
Frozen tissue was cut into coronal sections with a cryostat and divided into 12 mg samples, which were homogenized with a pellet pestle (Sigma-Aldrich, Z317314, St. Louis, MO, USA) and sonicated in 0.4 ml of radioimmunoprecipitation assay (RIPA) buffer (50 mM Tris-HCl pH 7.4, 150 mM NaCl, 0.1%Triton X-100, 0.1%SDS, and 0.5%Na-deoxycholate) containing a protease inhibitor cocktail (Sigma-Aldrich, St. Louis, MO, USA) on ice. The homogenates were agitated for 2 h at 4°C. The samples were centrifuged at 12.000×g for 5 min at 4°C, and the supernatant was collected.
The protein content was quantified using Bradford’s colorimetric method, with minor modifications. Briefly, 200μl of the reagent (Sigma-Aldrich Bicinchoninic Acid Kit for Protein Determination 1002738548, St. Louis, MO, USA) were added to 50μl of diluted samples. In parallel, a calibration curve was established using bovine serum albumin (BSA), with concentrations ranging from 0 to 1μg/μl. Absorbance was measured at 562 nm (iMark™ Microplate Absorbance Reader, Bio-Rad, Hercules, California, USA) and used to interpolate unknown values.
SWATH-MS quantitative proteomics analysis
Protein extracts were obtained from tissue samples, and proteins were precipitated with TCA/acetone to remove contaminants and resuspended in 0.2%RapiGest SF (Waters, Milford, MA, USA). The total protein concentration was measured with a Qubit fluorimetric protein assay (Thermo Fisher Scientific, Waltham, MA, USA), and 40μg of protein from each sample were subjected to trypsin digestion and massive protein relative quantitation following a sequential window acquisition of all theoretical spectra-mass spectrometry (SWATH-MS) approach, as described in a previous study [46]. Briefly, the protocol and proteomic analysis were provided and carried out at Instituto Maimonides de Investigación Biomédica de Córdoba IMIBIC Proteomic Facility.
Creation of the spectral library
The peptide solutions were analyzed using a shotgun data-dependent acquisition approach with nano-LC-MS/MS to build the MS/MS spectral libraries. Pooled vials were prepared consisting of equal mixtures of the original samples to obtain a good representation of the peptides and proteins present in all 30 samples. One microgram of the pooled samples (2μl was injected into an Ekspert nLC415 nano-LC system (Eksigent, Dublin, CA, USA) equipped with an Acclaim PepMap C18 column (75μm×25 cm, 3μm, 100 Å) (Thermo Fisher Scientific) at a flow rate of 300 nl/min. Water and ACN, both containing 0.1%formic acid, were used as solvents A and B, respectively. The gradient run consisted of 5%to 25%B for 90 min, 10 min at 90%B and 15 min at 5%B for column equilibration.
As the peptides eluted, they were directly injected into a Triple TOF 5600 + hybrid quadrupole-TOF mass spectrometer (Sciex, Redwood City, CA, USA) operated with a ‘top 65’ data-dependent acquisition system in positive ion mode. A NanoSpray III ESI source (Sciex) was used for the interface between nLC and MS, with an application voltage of 2,600 V. The acquisition mode consisted of a 250 ms survey MS scan from 350 to 1,250 m/z followed by an MS/MS scan from 230 to 1,700 m/z (60 ms acquisition time, rolling collision energy) of the top 65 precursor ions from the survey scan for a total cycle time of 4.2 s. The fragmented precursors were then added to a dynamic exclusion list for 15 s; any singly charged ions were excluded from the MS/MS analysis. Additionally, each pooled sample was also run on a gas-phase fractionation basis to increase the number of peptides and proteins identified: six runs with the same LC and MS parameters as described above, but using a ‘top 50’ method consisting of a 250 ms survey MS scan in the m/z ranges 349 to 450, 449 to 550, 549 to 650, 649 to 750, 749 to 900, or 899 to 1200 (one range for each run), followed by an MS/MS scan from 230 to 1,700 m/z (90 ms acquisition time, rolling collision energy) of the top 50 precursor ions from the survey scan.
Peptides and proteins were identified using Protein Pilot software (version 5.0.1, Sciex) with a human Swiss-Prot concatenated target-reverse decoy database (downloaded in July 2019) containing 20,416 target protein sequences, specifying iodoacetamide as Cys alkylation. The false discovery rate (FDR) was set to 0.01 for both peptides and proteins. The MS/MS spectra of the identified peptides were then used to generate the spectral library for SWATH peak extraction using the add-in for PeakView Software (version 2.1, Sciex) MS/MSALL with SWATH Acquisition MicroApp (version 2.0, Sciex). Peptides with a confidence score greater than 99%(as obtained from the Protein Pilot database search) were included in the spectral library.
Relative quantification by SWATH acquisition
Individual samples were analyzed using a data-independent acquisition method. Each sample (2μl) was analyzed using the LC-MS equipment and LC gradient described above for building the spectral library but instead using the SWATH-MS acquisition method. Samples were run in random order, and a quality control run containing digestion of the protein β-galactosidase was run after each sample for mass calibration, quality control and column cleaning. The SWATH acquisition method consisted of repeating a cycle that consisted of the acquisition of 50 TOF MS/MS scans (230 to 1,500 m/z, high sensitivity mode, 90 ms acquisition time) of overlapping sequential precursor isolation windows of variable width (1 m/z overlap) covering the 350 to 1,200 m/z mass range with a previous TOF MS scan (350 to 1,200 m/z, 50 ms acquisition time) for each cycle. The total cycle time was 4.6 s. For each sample set, the width of the 50 variable windows was optimized according to the ion density observed in the data-dependent acquisition runs using a SWATH variable window calculator worksheet from Sciex.
Data analysis
Targeted data extraction of the fragment ion chromatogram traces from the SWATH runs was performed by PeakView (version 2.1) using MS/MSALL with SWATH Acquisition MicroApp (version 2.0). This application processed the data using the spectral library created from the shotgun data. Up to ten peptides per protein and seven fragments per peptide were selected based on signal intensity; any shared and modified peptides were excluded from processing. Six-minute windows and 50 ppm widths were used to extract the ion chromatograms; SWATH quantitation was attempted for all proteins in the ion library that were identified by ProteinPilot with an FDR < 1%. The retention times of the peptides that were selected for each protein were realigned in each run according to 18 endogenous peptides from the protein pyruvate kinase and eluted along the whole-time axis. The extracted ion chromatograms were then generated for each selected fragment ion; the peak areas for the peptides were obtained by summing the peak areas from the corresponding fragment ions. PeakView computed an FDR and a score for each assigned peptide according to the chromatographic and spectral components; only peptides with an FDR < 1%were used for protein quantitation. Protein quantitation was calculated by adding the peak areas of the corresponding peptides. MarkerView (version 1.2.1, Sciex) was used for signal normalization.
Bioinformatics
MetaboAnalyst was used to conduct principal component analysis (PCA) and generate heat maps and volcano plots. Ingenuity Pathway Analysis was used to investigate the potential implication of the observed changes in metabolic pathways and protein interaction networks using the proteins identified to be altered in patients with PD with a p < 0.05 (143 proteins). Information regarding the up- or downregulation of the proteins in patients with PD was also considered in the study. The algorithm used to calculate the Z-scores and p-values of overlap provided by Ingenuity Pathway Analysis software has been described previously [47].
Validation of proteomic results
After a careful analysis of the identified proteins in the proteomic study and considering the information obtained with the bioinformatics approaches and the functions of the proteins reported in the literature, PHYIP (or PHYHIPL), CTND2 (or δ-catenin), AHSA1 (or AHA-1), SNTA1 (or α-1-syntrophin), TM163 (or TMEM163), REEP2 and CSKI1 (or caskin-1) were further investigated using immunofluorescence staining (described above) (see IF in the Assay column of Table 1 and Table 2).
Statistical analysis
For stereological data, GraphPad Prism® v.6 (San Diego, CA, USA) was used for statistical analyses. Shapiro-Wilk tests (n < 30) were performed to analyze the normality of the sample (p > 0.05). The Rout test was used to identify any outliers. Statistical comparisons were performed using one-way ANOVA followed by Tukey’s post hoc test to estimate the significance of the area fraction occupied by α-syn. Unpaired two-tailed t-tests or Mann-Whitney U tests were employed to estimate significant differences in volume and NeuN, Iba-1 and GFAP densities between HP regions. All data are presented as the means±standard deviations (SD). Differences were regarded as statistically significant at *p < 0.05, **p < 0.01 and ****p < 0.0001. For the proteomic analysis, protein abundance was normalized by log transformation, and an unpaired two-tailed t-test was used to estimate differential abundance. Two statistical criteria were used to select the proteins. First, differentially expressed proteins were selected by p < 0.05; afterwards, a fold change≤0.66 (downregulated) or≥1.5 (upregulated) was applied to the final validation.
RESULTS
Age
Age was compared among groups using an unpaired two-tailed t-test or Mann-Whitney test. For the stereological analysis, the cohort was divided into three sampling groups (rostral, intermediate and caudal HP) according to the rostrocaudal axis of the HP (Table 1). Ages of patients with PD and NPD in rostral (PD 74.80±2.458; NPD 63.20±6.304), intermediate (PD 81.60±2.112; NPD 84.80±1.53), caudal (PD 81±0.4472; NPD 74.80±5.267) and total HP (PD 77.07±2.092; NPD 76.33±3.218) cases were not significantly different. No statistically significant differences were reported in the cases selected for the stereological study between the PDD and NPD groups (see “*” in the Case column of Table 1) (data not shown). Additionally, the ages of the patients with PD and NPD whose samples were examined using proteomic analyses were not different (PD 77±3.907 years; NPD 67±7.193 years). However, one of the patients with NPD whose sample was used in the proteomic analysis was 37 years old, which represents a limitation for the study since a young age is associated with no or minimal age-related pathologies.
α-Synuclein area fraction
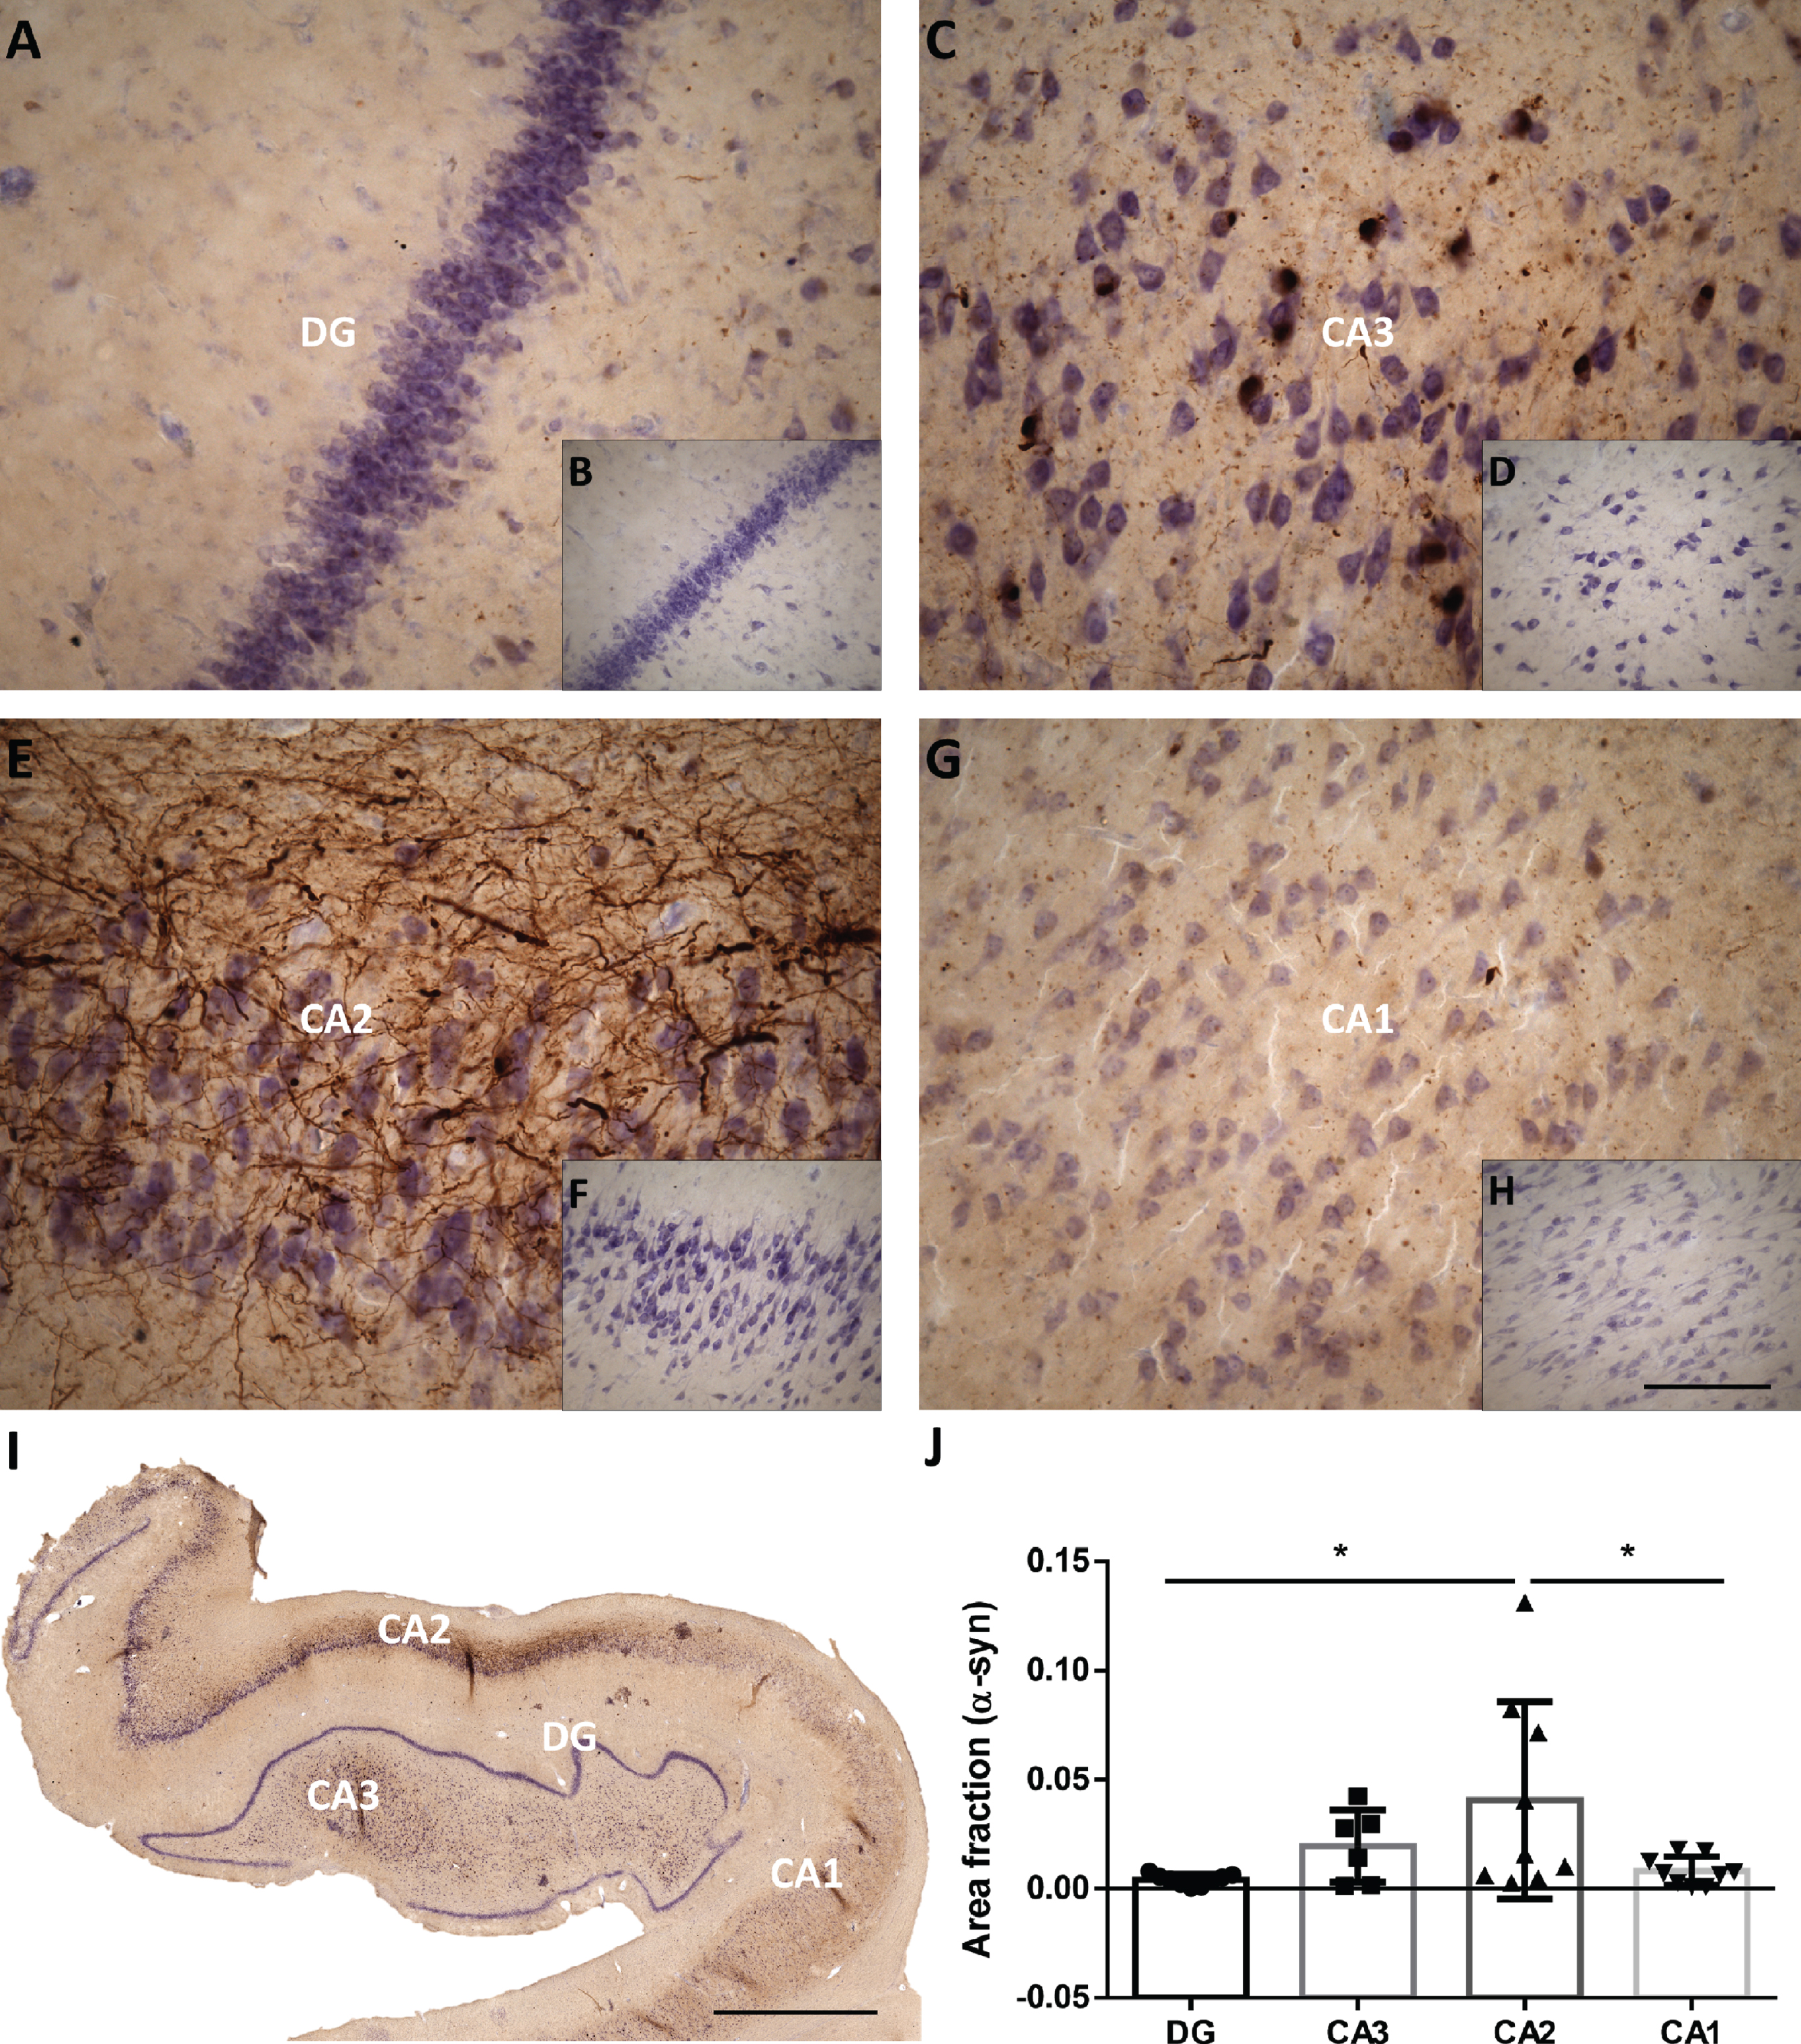
The area fraction of hippocampal subfields occupied by α-syn was stereologically analyzed in a representative sample of the PD cohort (see IH2 in the Assay column of Table 1), and the area fraction occupied by α-syn was compared between subfields with one-way ANOVA followed by Tukey’s post hoc test. The α-syn area fraction was significantly higher in CA2 than in DG and CA1 (F (3, 29) = 3.859; p = 0.0194) (Fig. 3 and Supplementary Table 1).
Fig. 3
Mosaic reconstruction (I) and picture of the DG, CA3, CA2 and CA1 of the human hippocampus with PD (A, C, E, G respectively) and without PD (B, D, F, G respectively) immunohistochemistry stained for α-synuclein. The mean±SD of the area fraction occupied by α-synuclein in the different regions of the hippocampus in the total hippocampus of PD cases (J). Scale bars 90μm (A, C, E, G), 250μm (B, D, F, H) and 2000μm (I).
Volume
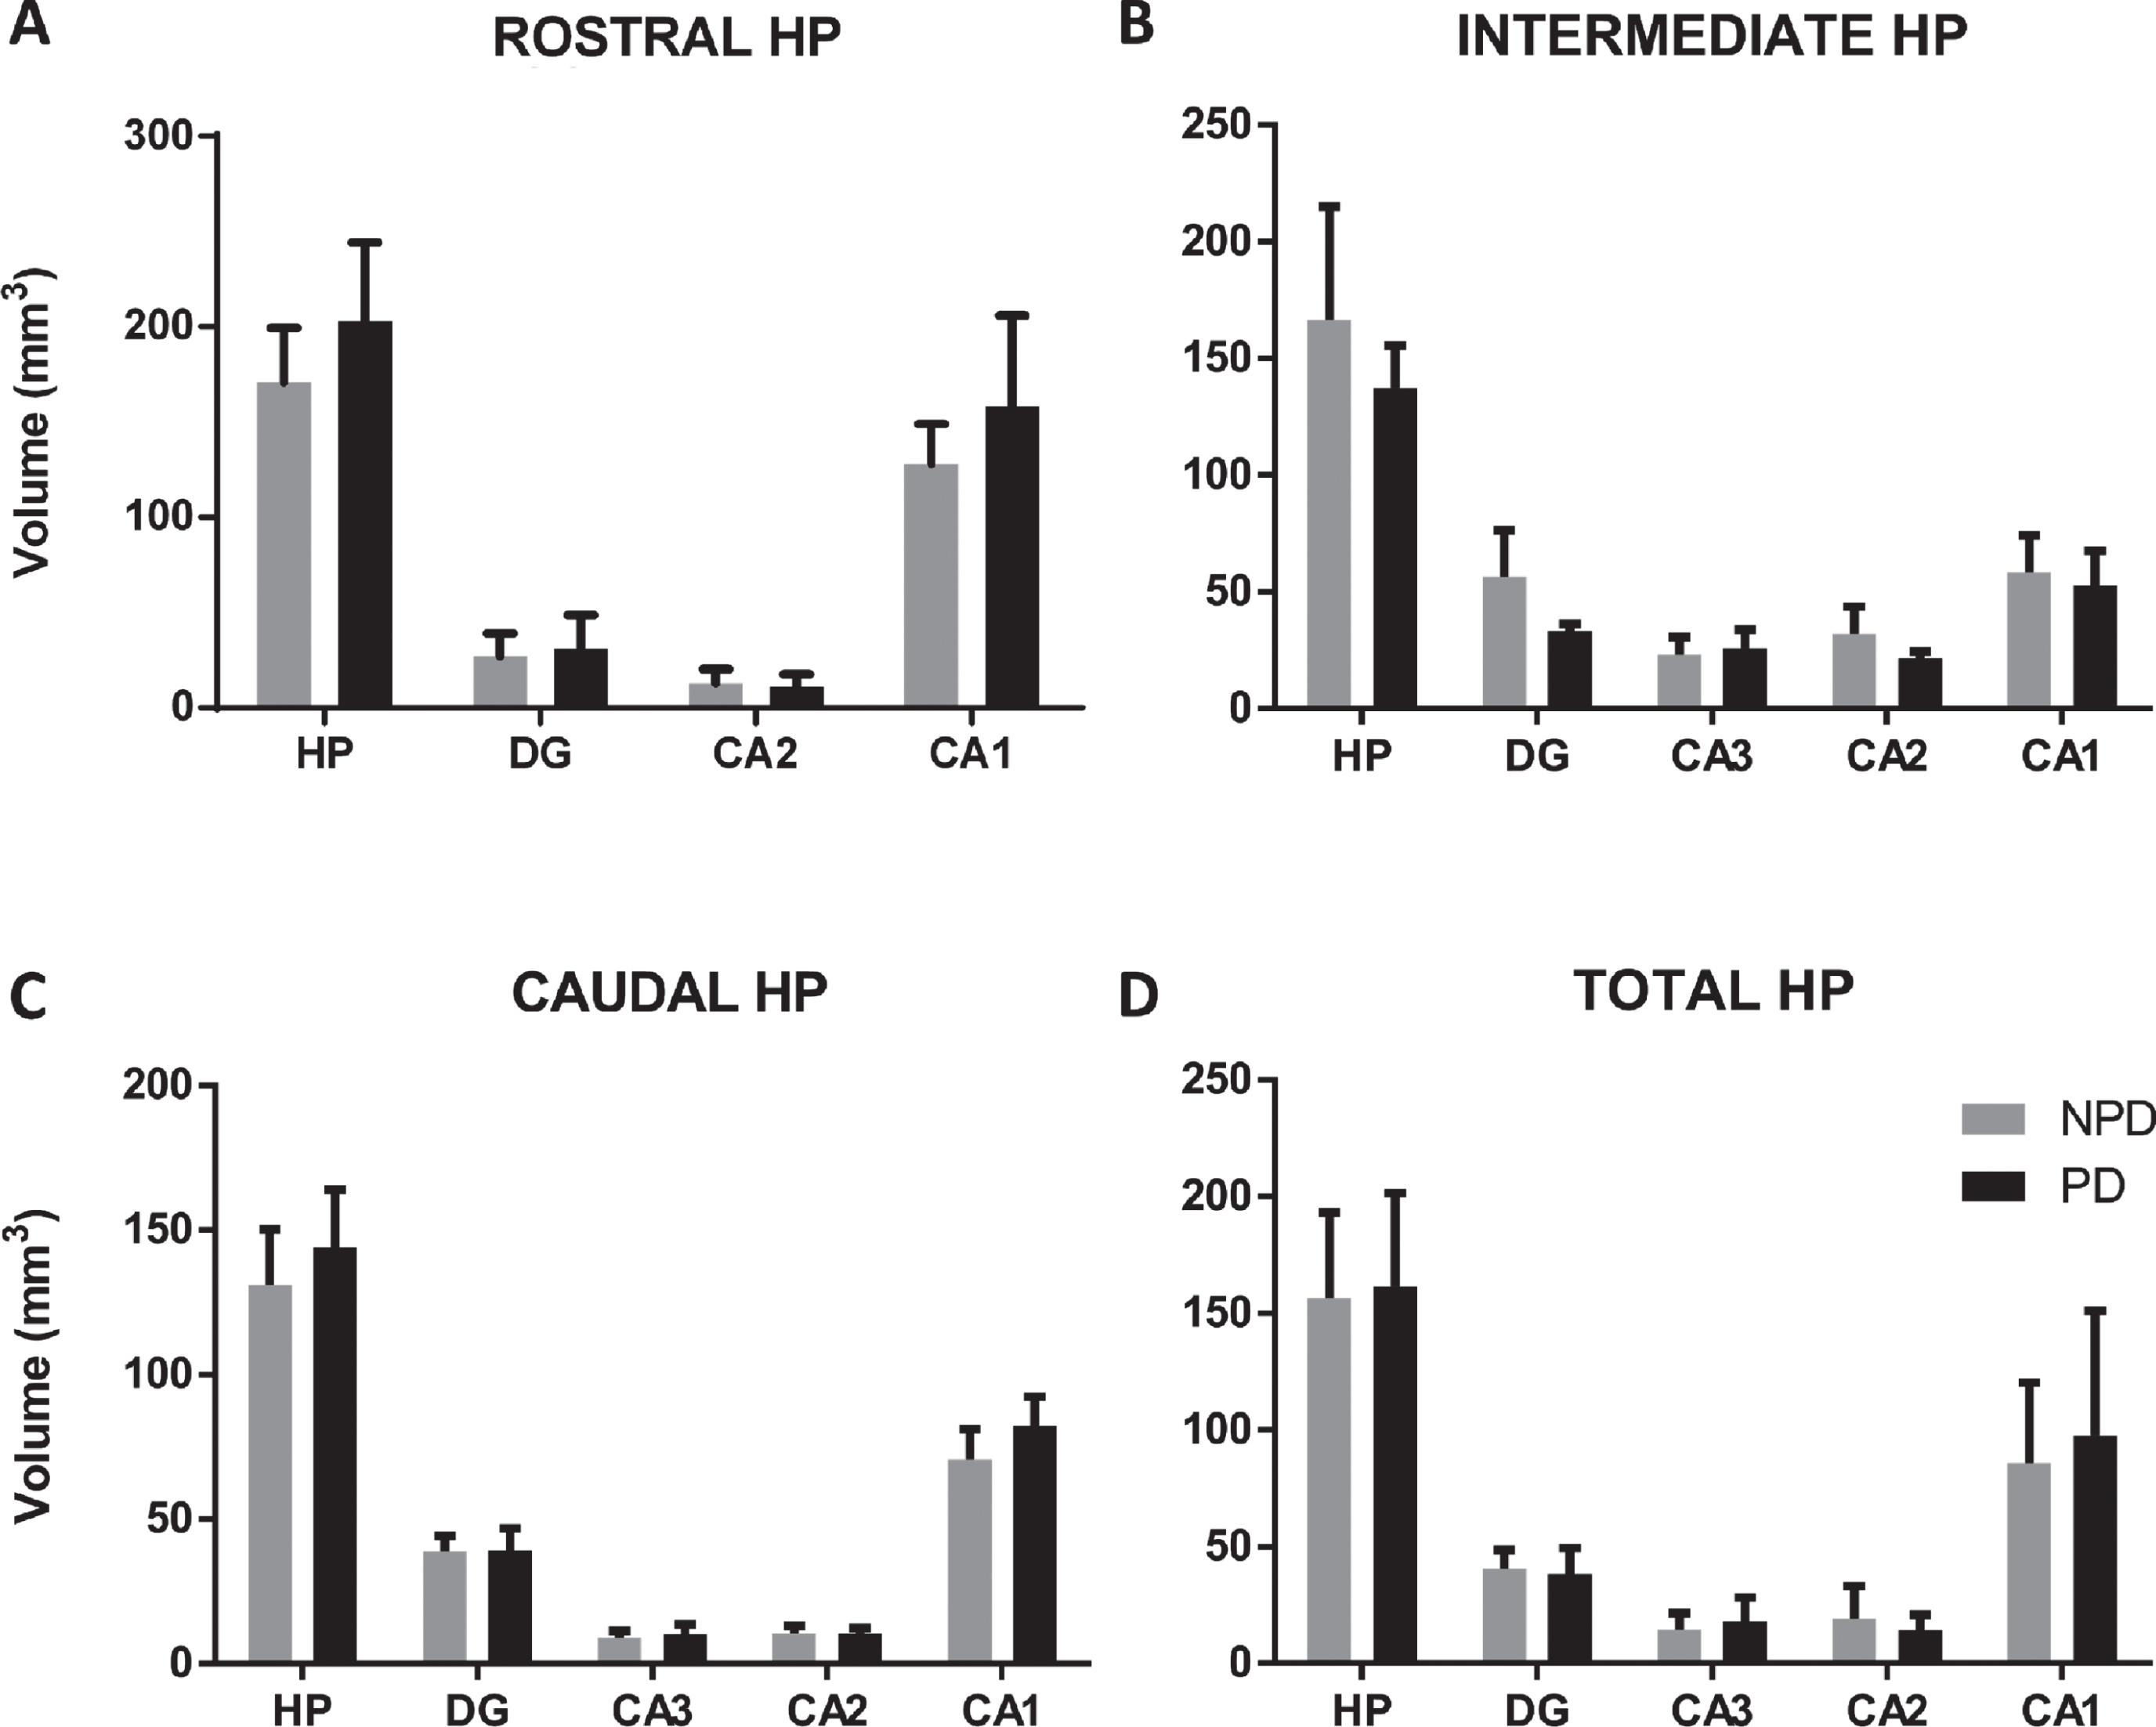
Total hippocampal and subfield volumes were analyzed using Cavalieri’s method (N = 15 PD and N = 15 NPD, n = 5 in rostral, intermediate and caudal levels in each group) (Table 1 and Fig. 1). No differences in total or partial volumes were observed along the rostrocaudal axis (Fig. 4 and Supplementary Tables 2 and 6). A volumetric analysis between the PDD (n = 8) and NPD (n = 8) groups stratified by age and HP regions did not show significant changes in the total or partial hippocampal volume (see “#” in the Case column Table 1) (data not shown).
Fig. 4
The mean±SD of the total volume of the hippocampus and hippocampal regions of the rostral (A), intermediate (B), caudal (C) and total (D) hippocampus in PD and NPD cases.
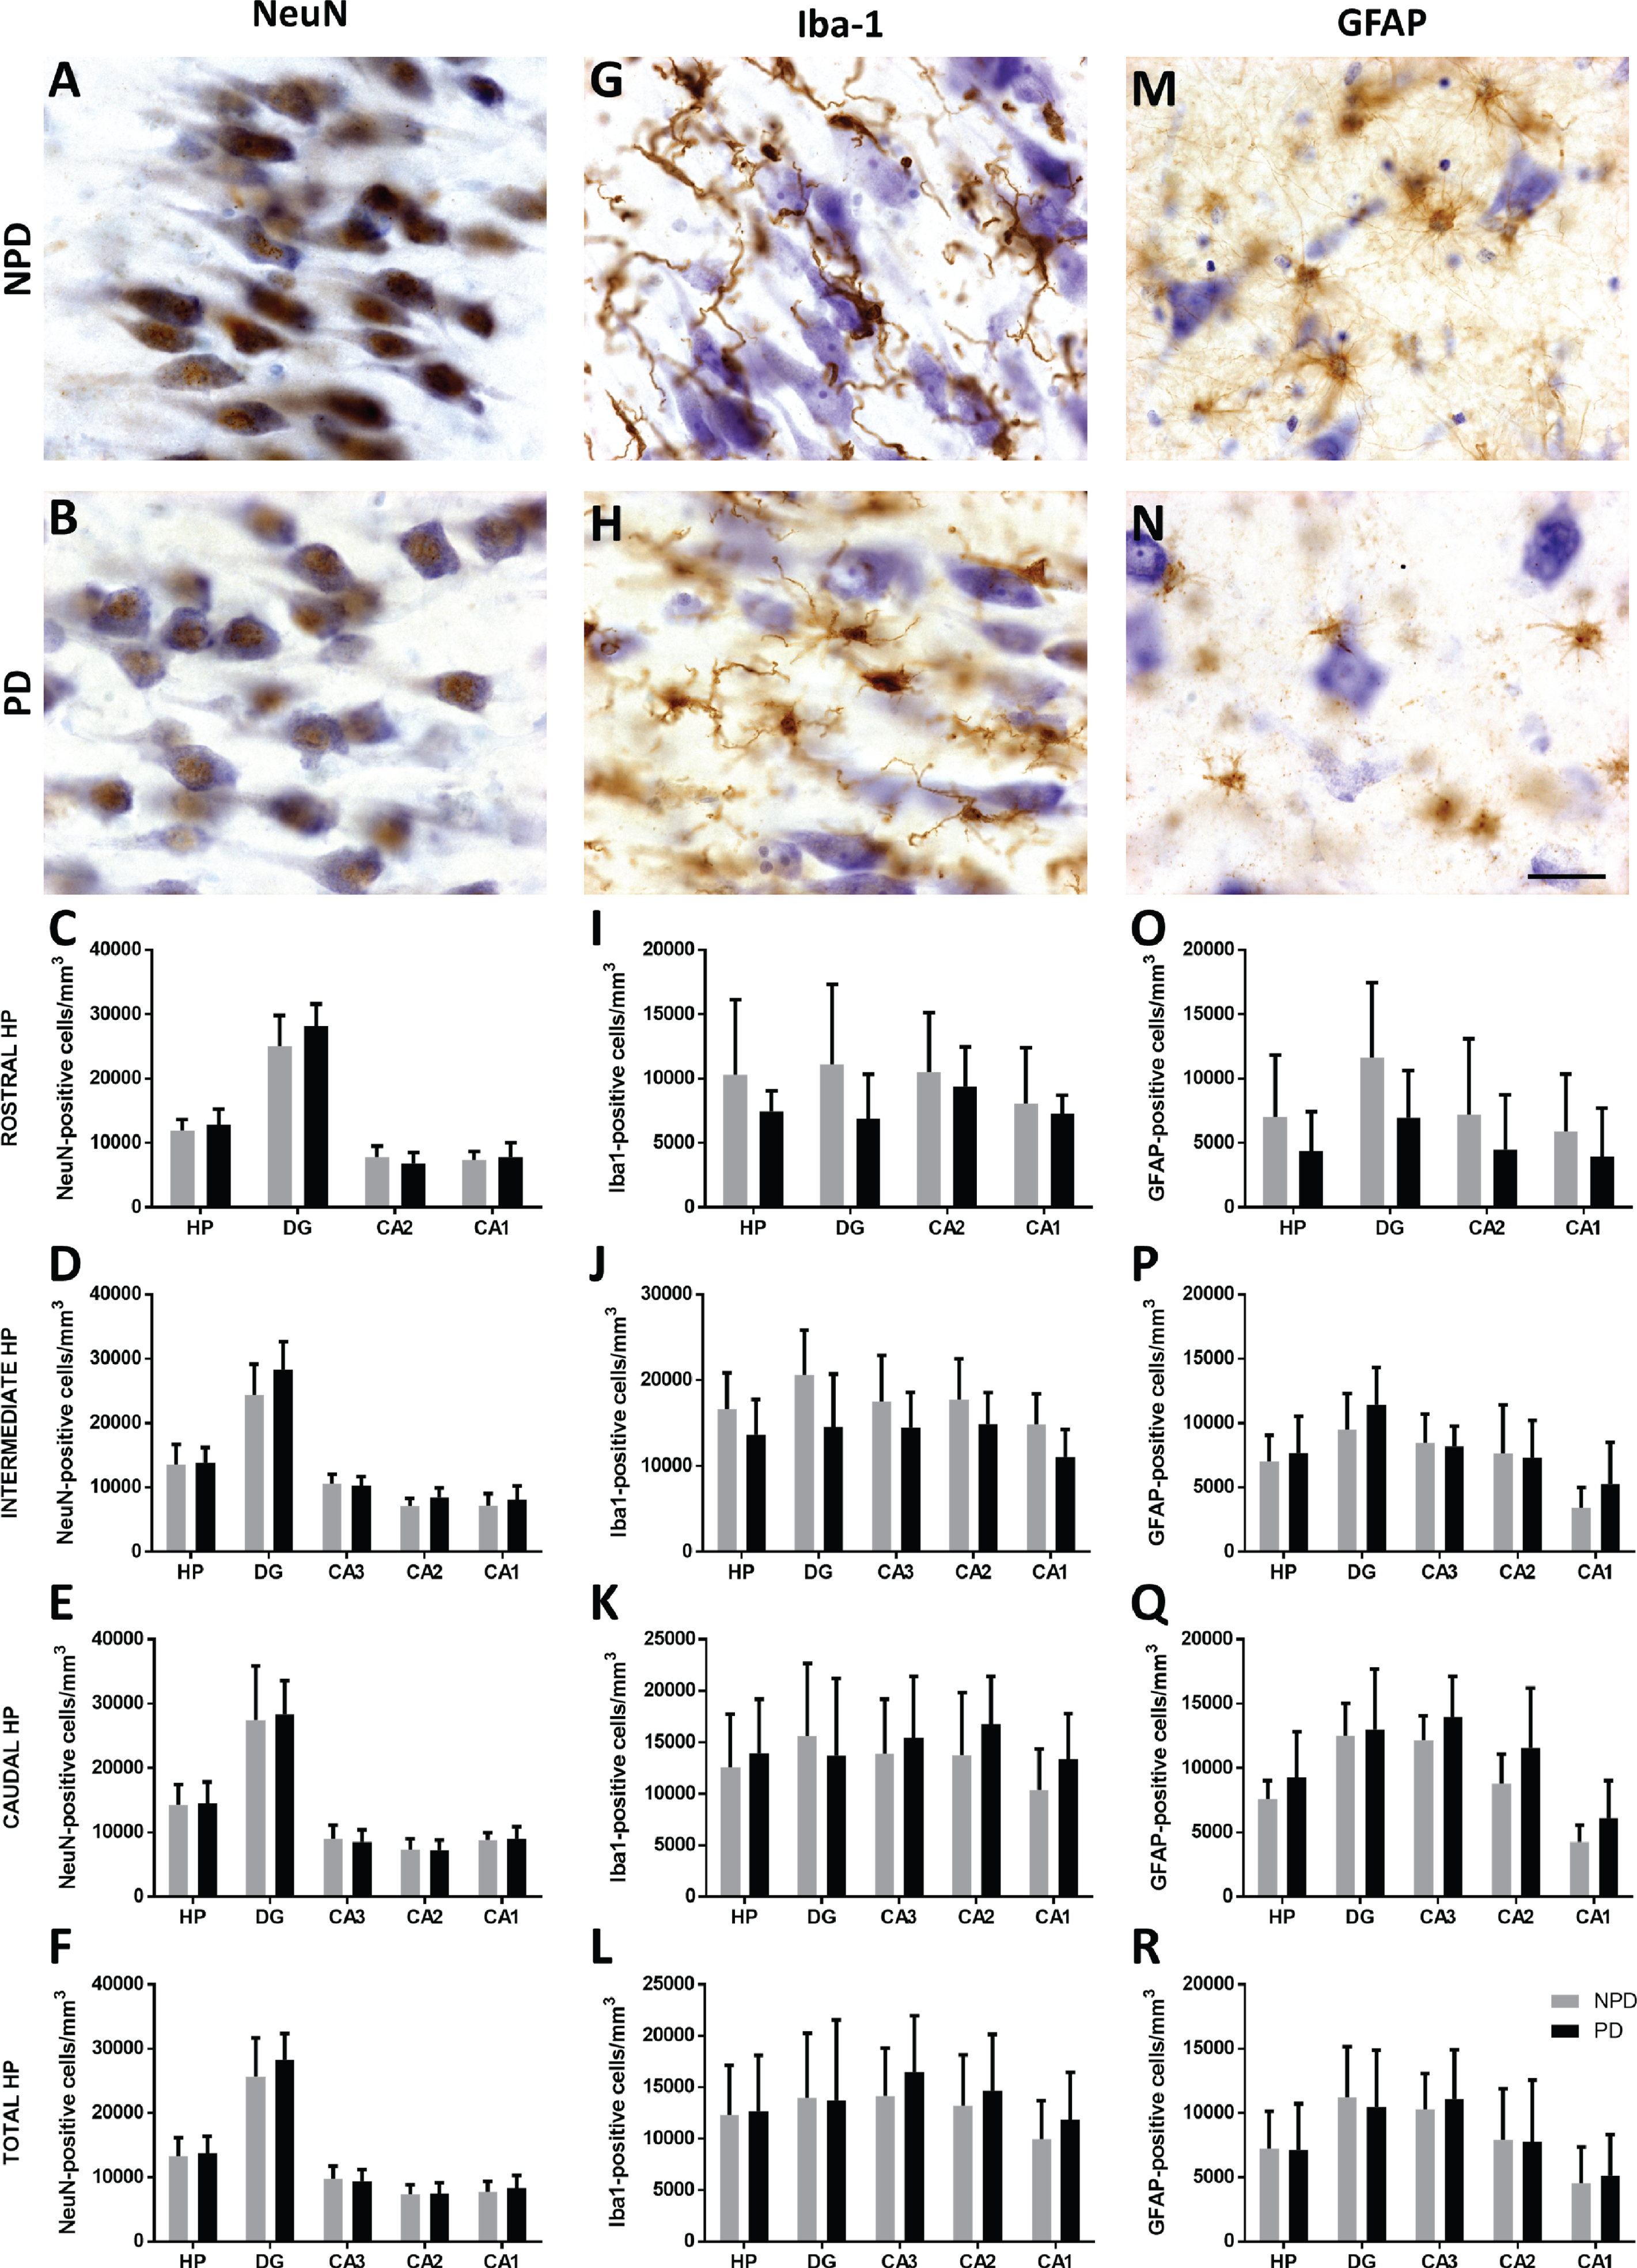
Estimation of neurons, microglia and astroglia
An optical fractionator was used to count NeuN- (Fig. 5A, B), Iba-1- (Fig. 5G, H) and GFAP-positive (Fig. 5M, N) cells (see IH1 in the Assay column of Table 1 and Supplementary Figure 1). No differences in total or partial cell population densities were observed along rostrocaudal levels in the different hippocampal fields (Fig. 5C-F, I-L, O-R, Fig. 2, Supplementary Tables 3–5 and 6, and Supplementary Figures 2 –4). The analysis of the stereological data from the patients with PDD (n = 8) and NPD (n = 8) matched by age and HP region did not show significant changes in the studied cell populations of the total HP and its subfields (see “#” in the Case column of Table 1) (data not shown).
Fig. 5
Coronal sections of the human hippocampus immunohistochemically stained for NeuN (A-B), Iba-1 (G-H) and GFAP (M-N). The mean±SD of NeuN (C-F)-, Iba-1 (I-L)- and GFAP (O-R)-positive cell density of hippocampal regions in the rostral, intermediate, caudal and total hippocampus. Scale bar 25μm (A-N).
Proteomic analysis
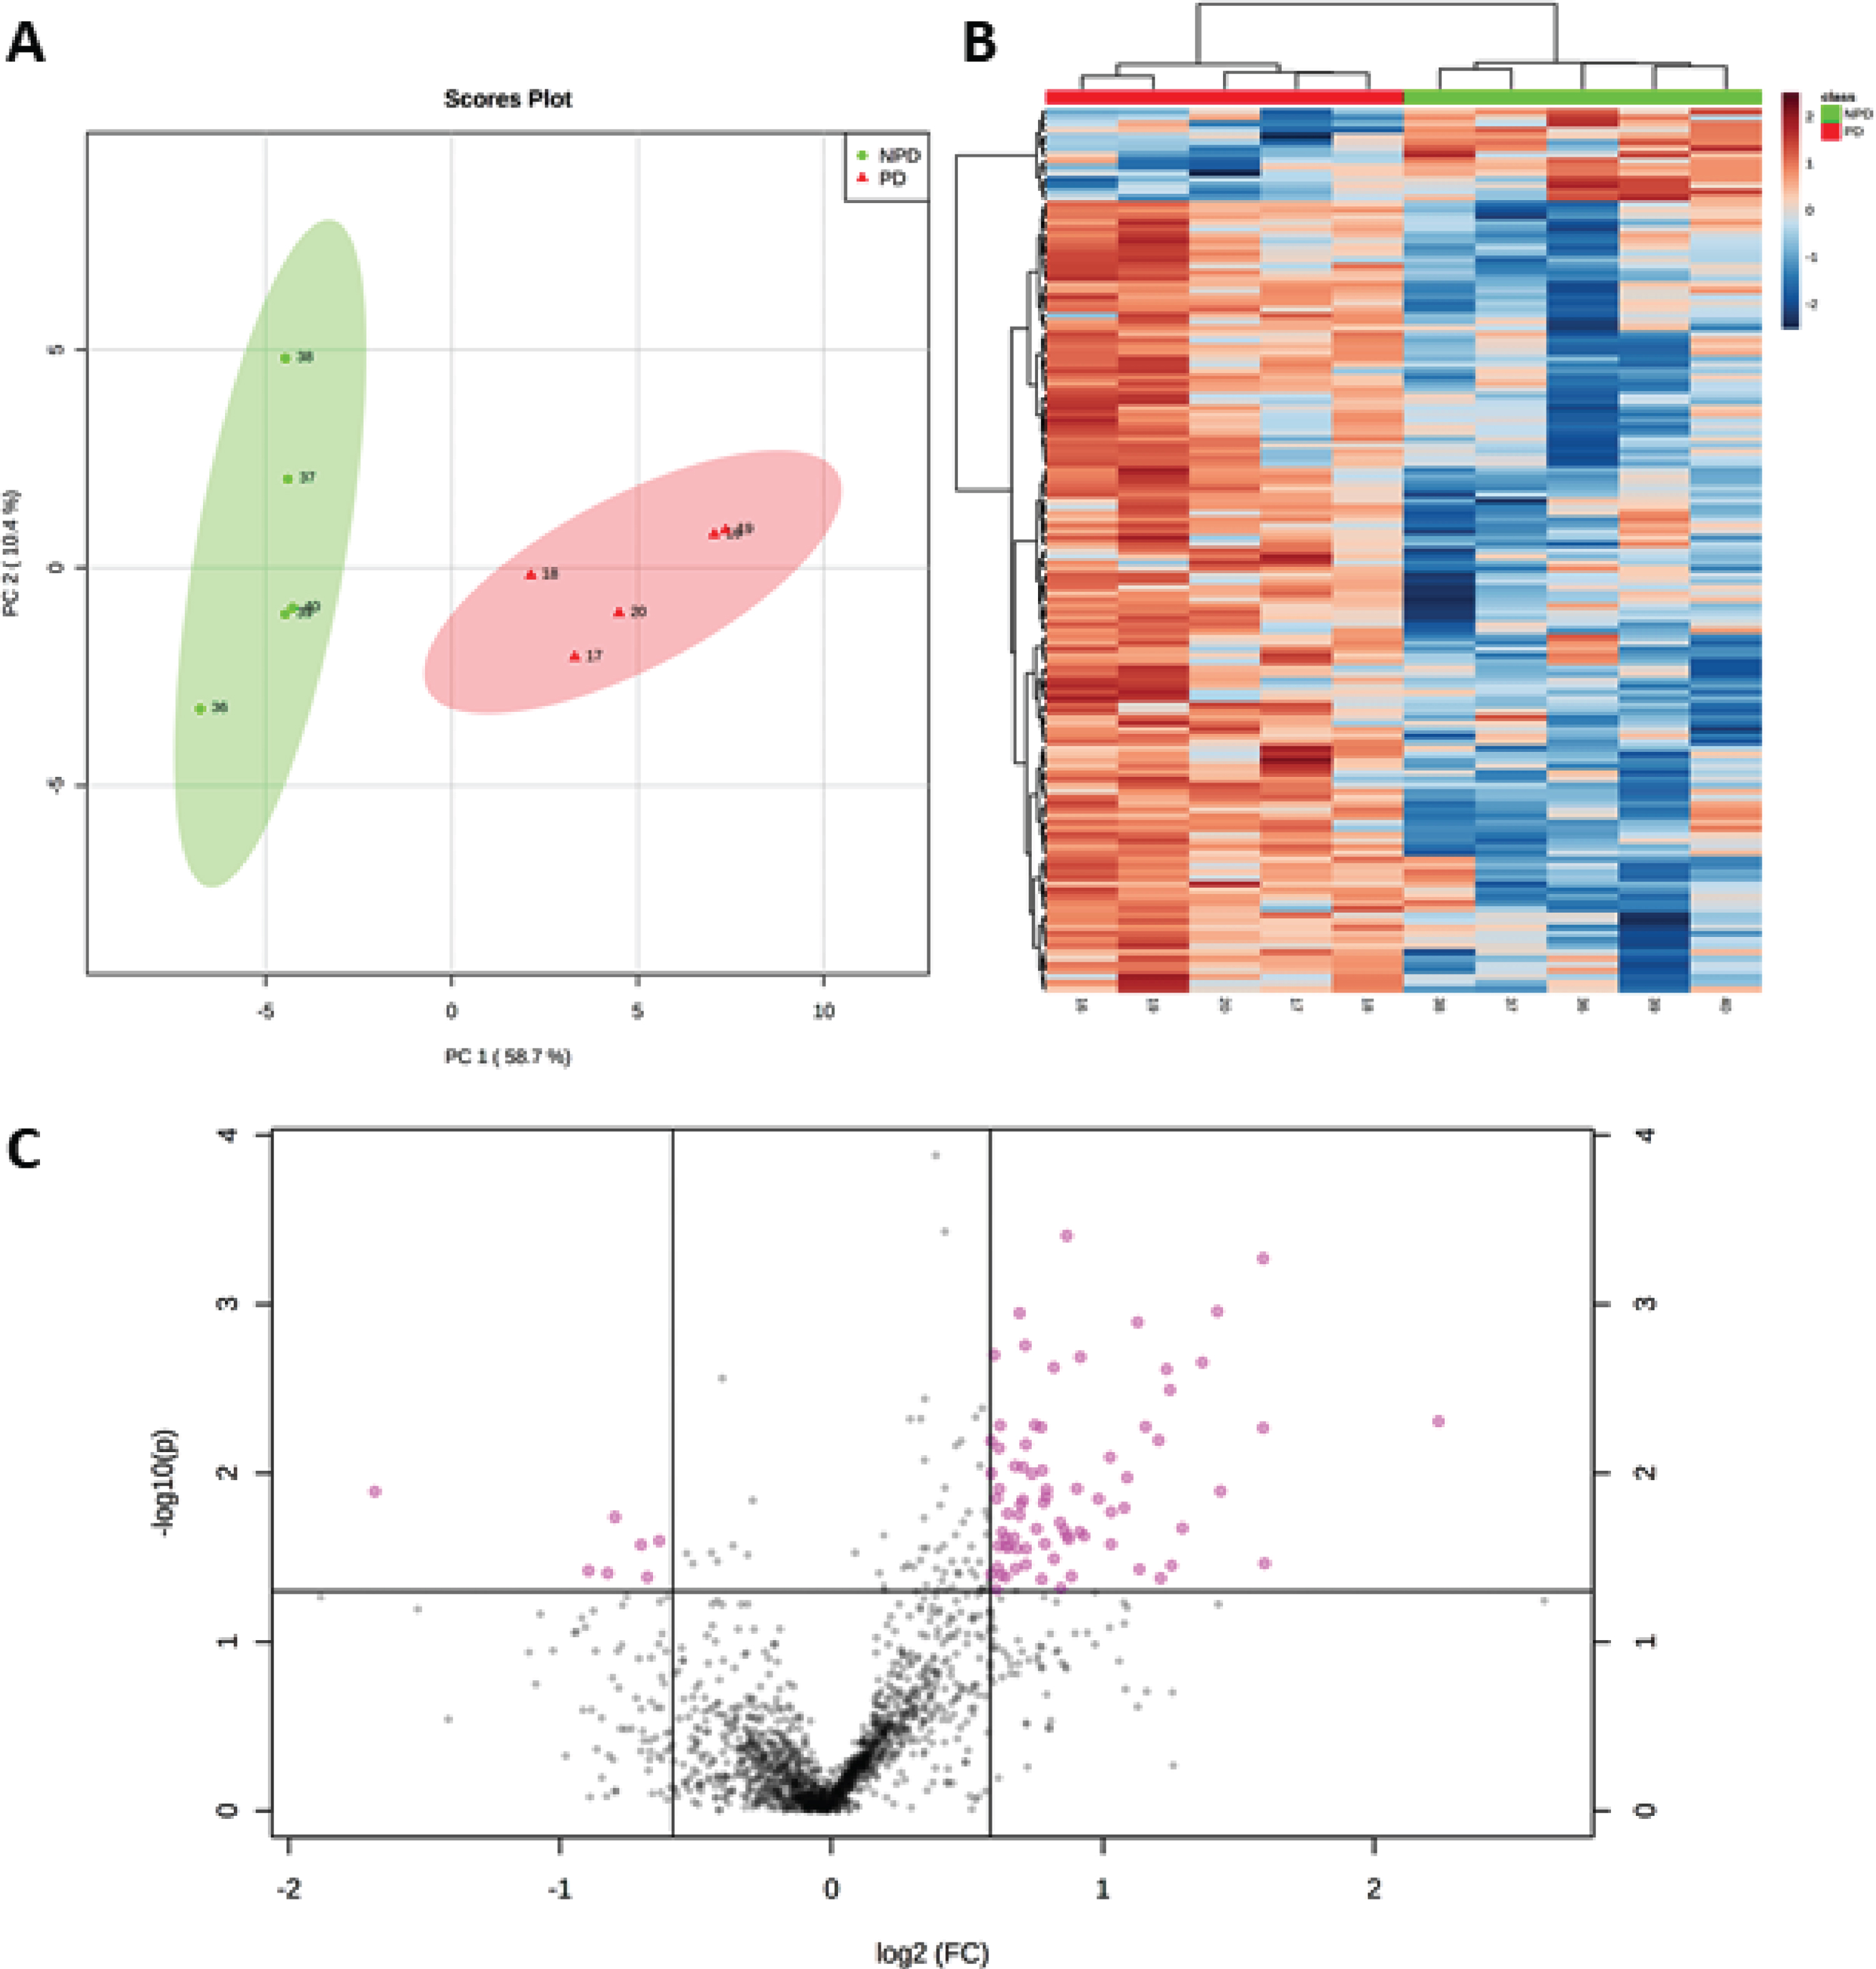
SWATH-MS quantification identified 1,634 proteins (see PR in the Assay column of Table 1 and Supplementary Data 1). After normalization by log transformation and filtering by p < 0.05, 142 proteins were obtained, which separately identified PD and NPD groups according to PCA (Fig. 6A) and in a heat map (Fig. 6B and Supplementary Data 2). A restrictive 1.5-fold change and p < 0.05 were also used to ensure confidence in the selection of 83 differentially expressed proteins (Supplementary Data 3). Changes in expression were detected for 76 upregulated and 7 downregulated proteins, as illustrated in the volcano plot shown in Fig. 6C.
Fig. 6
A) PCA plot, using principal components 1 and 2, shows that the NPD cases (green dots) and PD cases (red triangles) are distributed in two well-separated groups based on significantly altered proteins in PD (p < 0.05). B) Heat map of proteins with levels varying significantly (p < 0.05) across PD and NPD cases and used for sample clustering. C) Volcano plot showing 7 downregulated and 76 upregulated proteins (pink points) with fold change≥1.5 (or≤0.66) and p < 0.05.
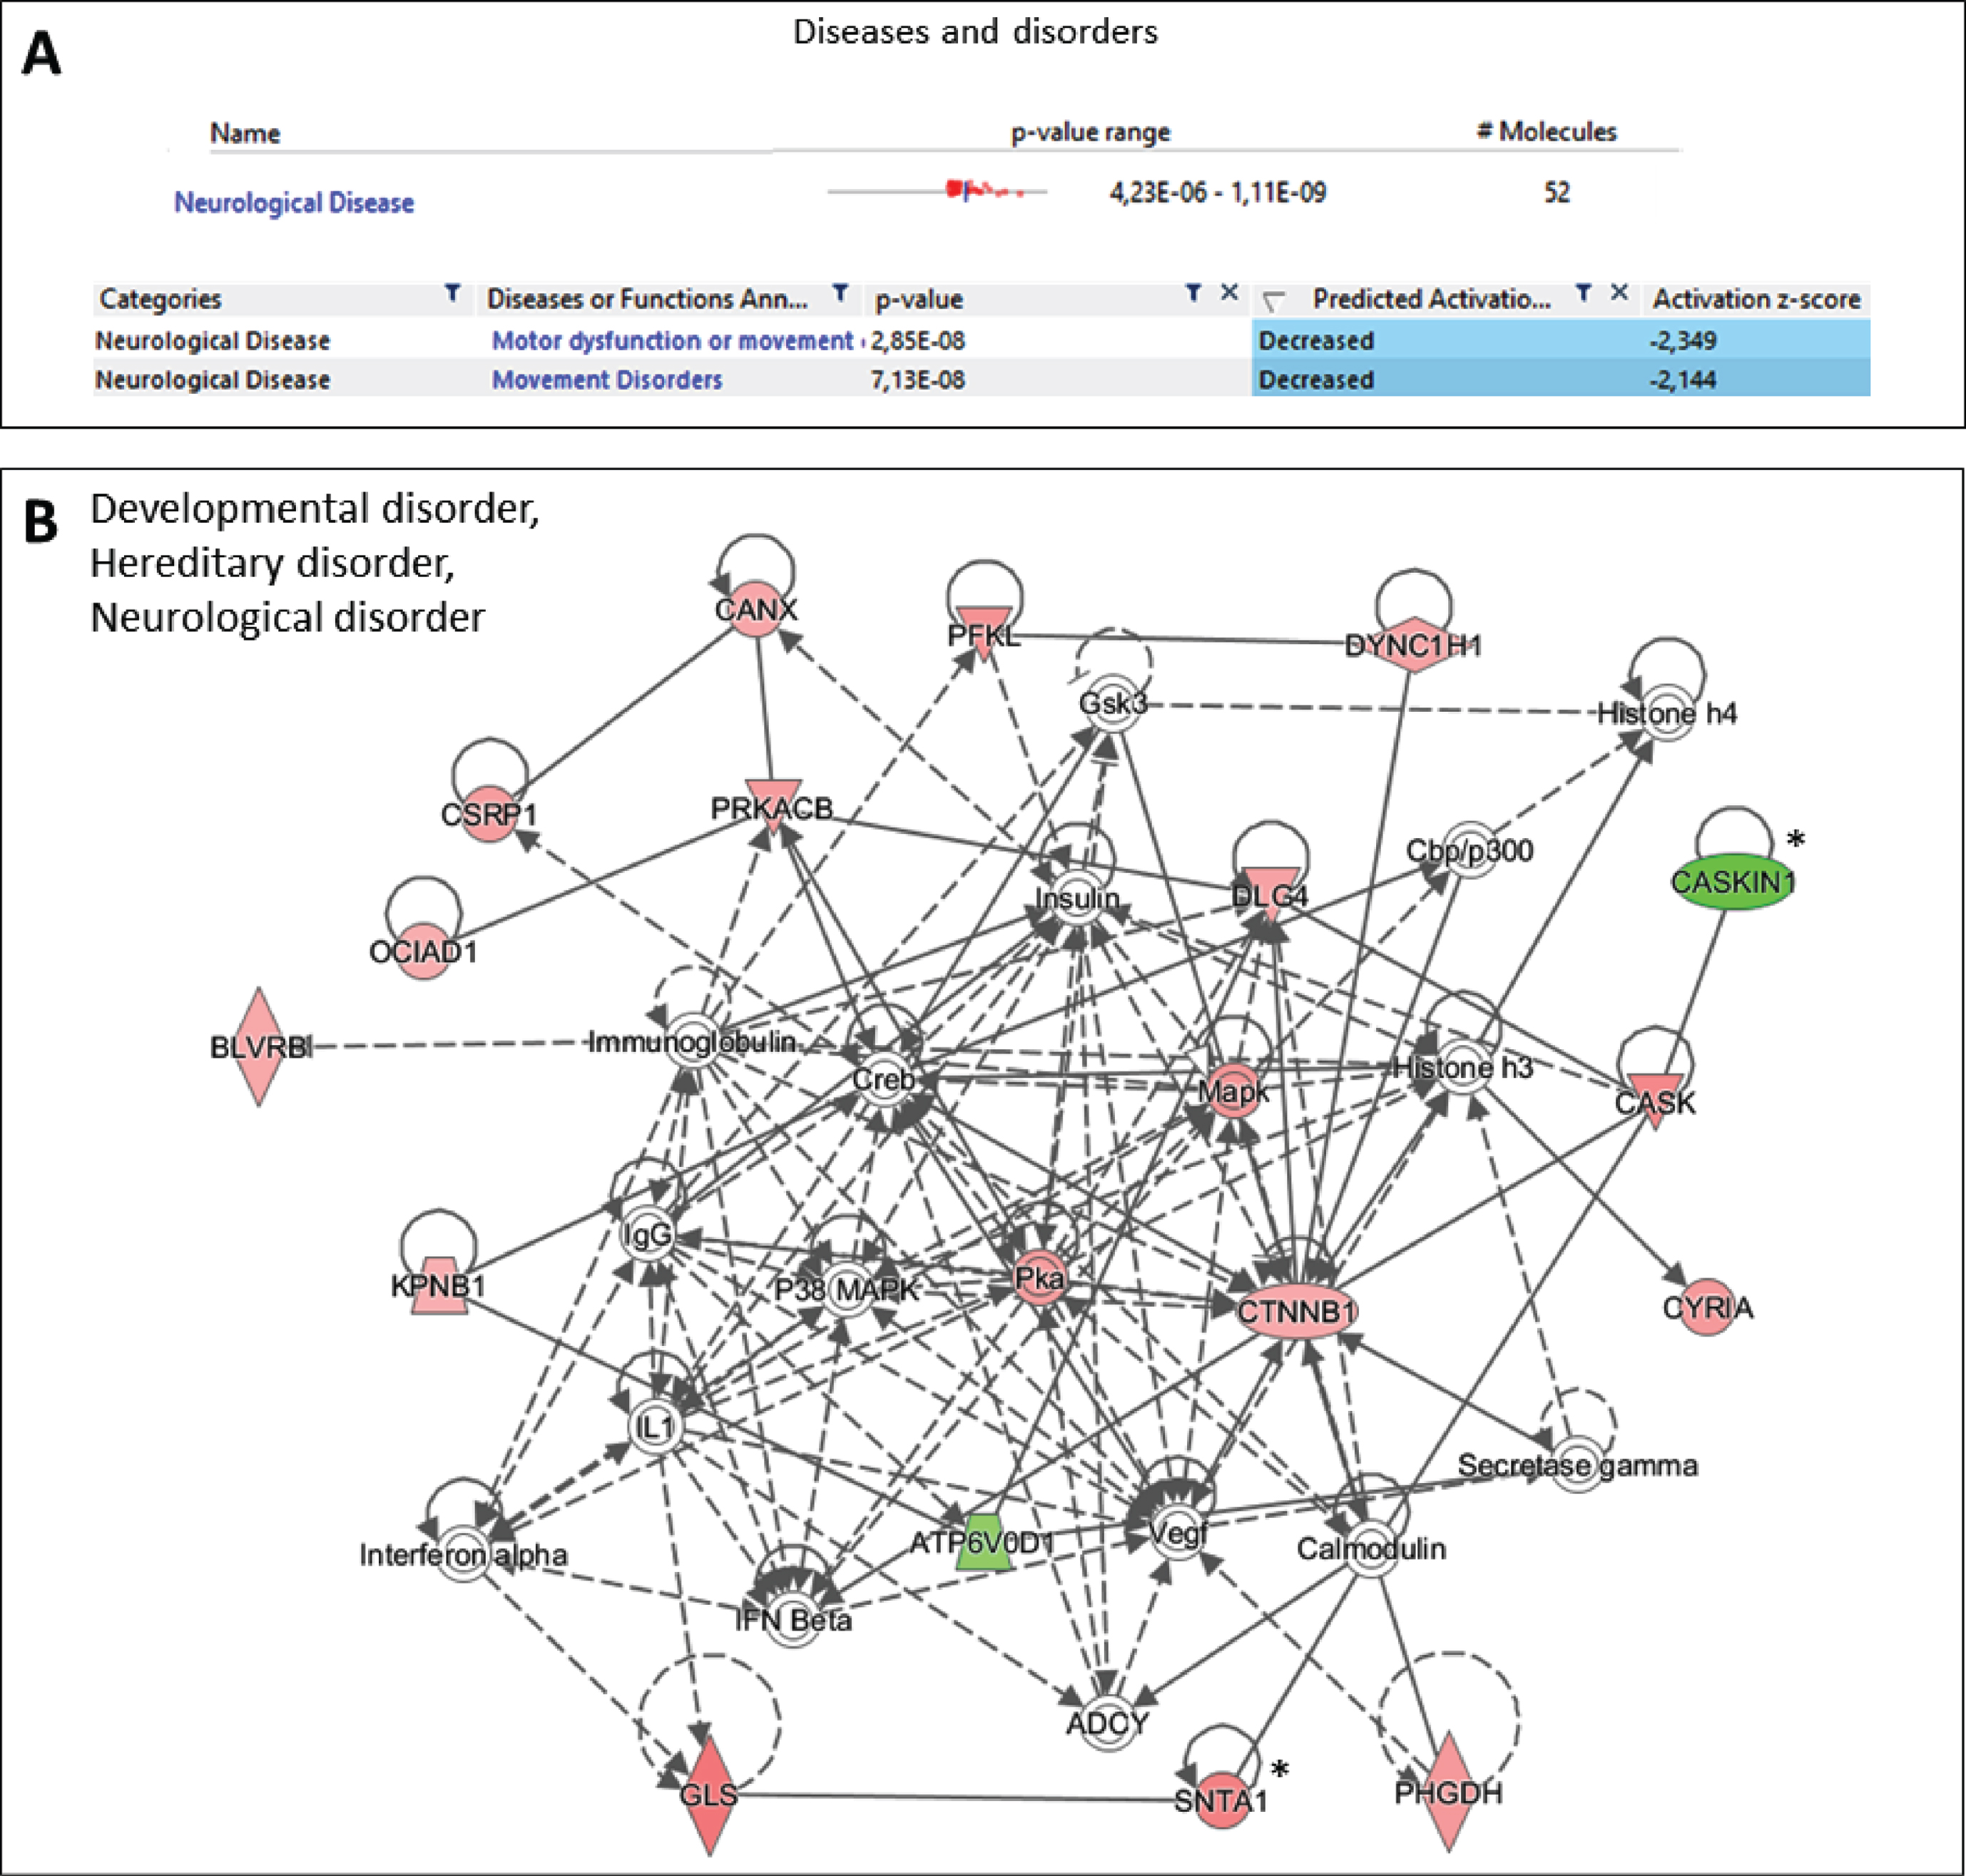
Additionally, Ingenuity Pathway Analysis software was used to accurately determine the implications of the observed changes at the protein level between PD and NPD samples, taking into account the intensity and direction of change in the expression of each protein. This analysis was especially relevant to the finding that overall expression analysis of the proteomic data identified motor dysfunction and movement disorder as unique diseases predicted to be negatively affected (Fig. 7A). Specifically, in movement disorder disease, 32 proteins found altered in PD samples were predicted to be associated significantly to the existence of potential motor dysfunction or movement disorders (AHCY, AK1, ARL3, ATL1, CANX, CASKIN1, CKB, COMT, CRYM, CSNK2A1, CTNNB1, DBNL, DNM1, DYNC1H1, EEF1A1, EIF3K, GLS, HNRNPDL, HNRNPU, HSPB1, MAP2K4, PIN1, PTGES3, PTK2B, PURA, SUCLA2, TUBA4A, TUBA8, TUBB3, TUBB4B, VPS35 and XRCC6) (p < 7.13E-8) (Fig. 7A). As shown in the present study, 31 proteins also participated in one interaction network strongly related to neurological diseases (Fig. 7B). Several of the proteins observed in this network were further investigated in the present article (see * in Fig. 7B) including caskin-1 (CASKIN1) as the most important downregulated protein in the network.
Fig. 7
Ingenuity Pathway Analysis of the proteins differentially expressed between PD and NPD samples. All the proteins with a p < 0.05 were included in the study. A) The overall changes observed at proteomic scale correlates specifically with potential motor dysfunction and/or movement and movement disorders, according to Ingenuity Pathway Analysis (p < 7.13E-8). B) Ingenuity Pathway Analysis identified one significant associated network of proteins that include neurological disorder. The network agglutinates a total of 31 proteins. *proteins investigated further in the current article. Green, proteins decreased in PD; Red, proteins increased in PD.
Structural characterization of proteomic changes
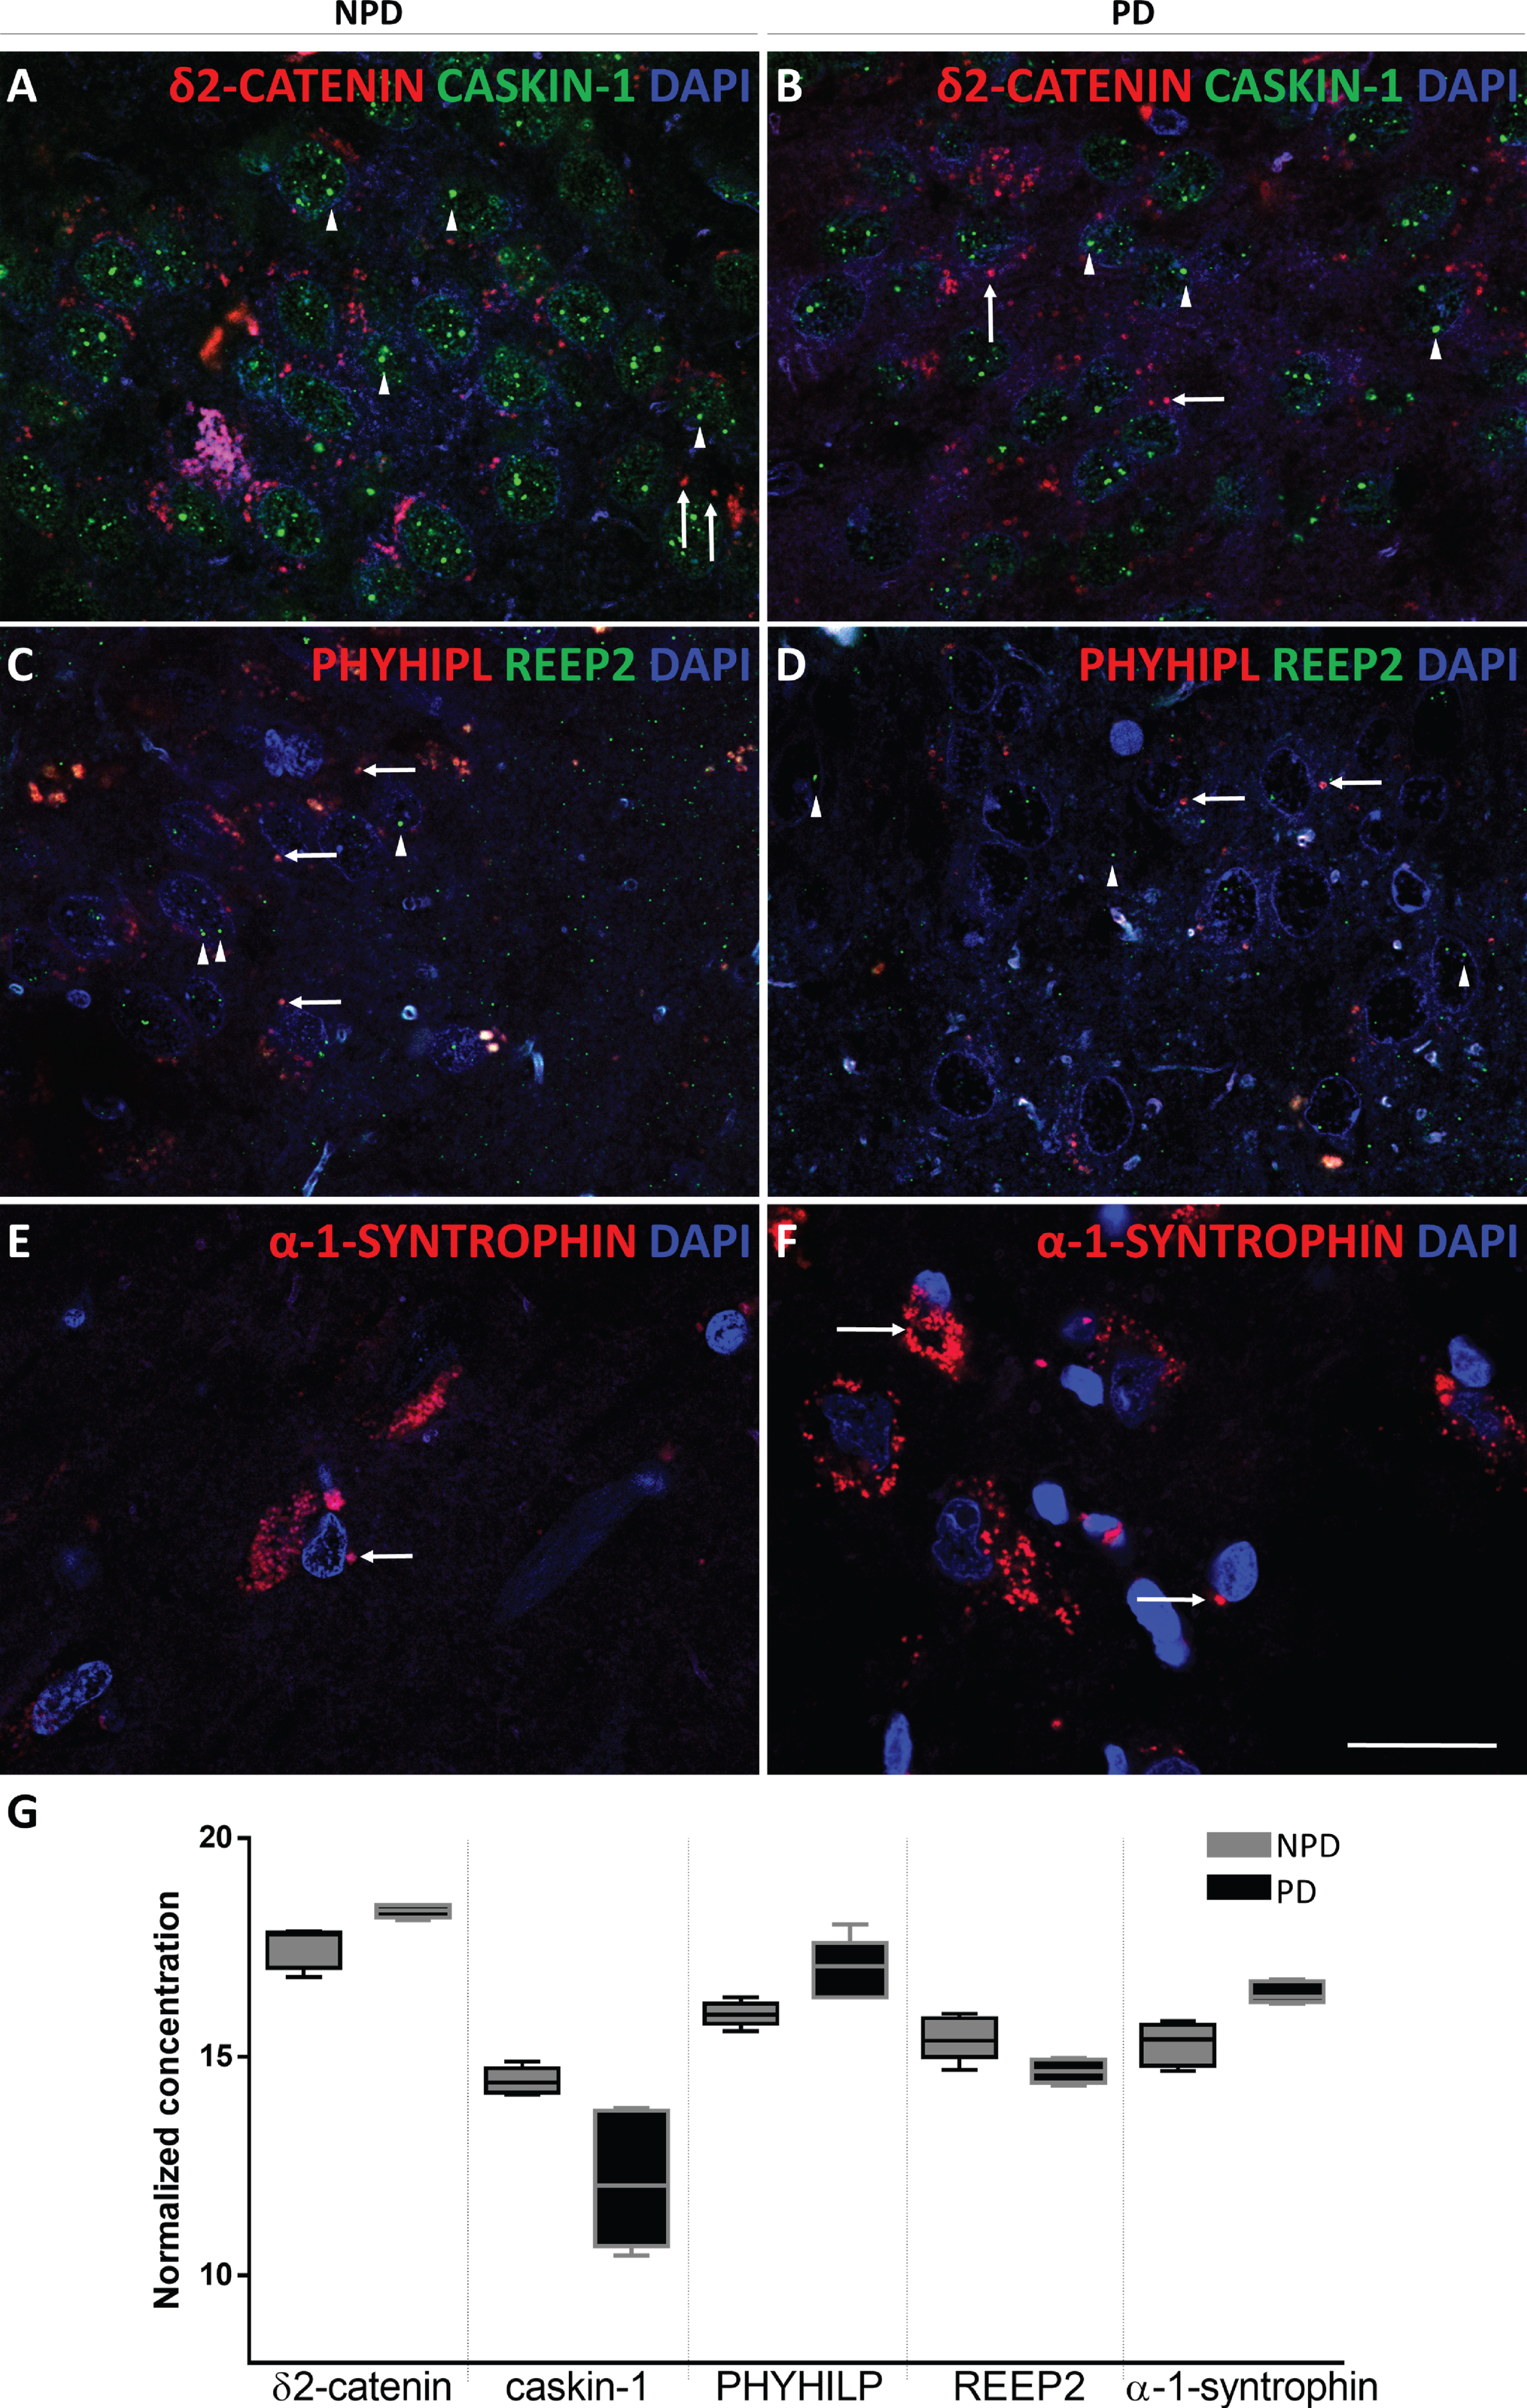
Among structural proteins with higher fold changes, either up- or downregulated, some related to the synaptic complex were selected to characterize hippocampal changes in individuals with PD compared to subjects with NPD. Proteins were selected according to the restrictive fold change and p < 0.05. Focusing on the PD group compared to the NPD group, the upregulated proteins were δ2-catenin, α-1-syntrophin, activator of 90-kDa heat shock protein ATPase homolog (AHA-1) and phytanoyl-CoA hydroxylase-interacting protein (PHYHIPL); the downregulated proteins were caskin-1, receptor expression-enhancing protein 2 (REEP2) and transmembrane protein 163 (TMEM163). The upregulation or downregulation of these proteins was validated by immunofluorescence staining (see IF in the Assay column of Table 1 and Fig. 8); however, the antibodies against AHA-1 and TMEM163 yielded inconclusive results.
Fig. 8
Coronal sections of the human hippocampus immunofluorescently stained for δ2-catenin (RED) and caskin-1 (GREEN) in NPD (A) and PD (B), REEP2 (GREEN) and PHYHIPL (RED) in NPD (C) and PD (D) and α-syntrophin (RED) in NPD (E) and NPD (F). Arrow heads and arrows point green and red markers, respectively. Scale bar 20μm (A-F). The mean±SD of selected proteins comparing NPD and PD (G).
DISCUSSION
The results of the present study indicate that synucleinopathy occupies a larger area fraction in CA2. The stereological analysis did not reveal changes in volume, neurodegeneration or gliosis, although proteomic approaches did detect substantial alterations in the HP that were previously unreported in patients with PD.
α-Synuclein distribution among hippocampal fields
According to the description provided by Braak and colleagues, CA2 was particularly affected by this α-synucleinopathy [7]. Previous reports have shown the highest levels of α-syn in this hippocampal subfield (density or total number of Lewy bodies and neurites) [19, 25], which increase in patients with PDD [26, 27, 48] (Table 7a in Supplementary Table 7). Other studies have used qualitative (biased) and quantitative approaches and only examined CA2 or CA2/CA3 combined, without comparing the levels to DG, CA1 and CA3 [23, 24]. Similar reports compared different neurodegenerative diseases or other brain areas, such as the substantia nigra [24] or periamygdaloid cortex [49]. To date, however, the fraction of area occupied by α-syn inclusions in the hippocampal subfields had not been studied. Therefore, the present data constitute the first unbiased stereological analysis of α-syn in the DG and CA1-3 using the area fraction fractionator. According to the literature, our results indicate a greater effect of α-syn on CA2 followed by CA3 and, to a much lesser extent, by DG and CA1 (Fig. 3). In addition, synucleinopathy mainly occurs in the form of Lewy neurites in CA2, whereas Lewy bodies are more frequent or larger in the DG, CA1 and CA3 and the EC [19, 27, 50].
As proposed by the prion-like hypothesis, α-syn spreads through neuronal connections and glia [4–6]. Therefore, the CA2 connectome might help to explain its greater involvement by α-syn. The EC is the main input, and output relies on the transfer of cortical information to the HP. Classically, the EC has been described as projecting through the perforant path to the DG and to CA1, CA3 and the subiculum. The DG projects to CA3 through mossy fibers, which in turn projects to CA1 via Shaffer collaterals. Finally, CA1 and the subiculum close the circuit by projecting to the EC [18]. Classically, CA2 was considered out of this loop. Recently, it has been reported that both the EC, DG and CA3 send direct projections to CA2 which, together with the fact that the spread of synuclein is initially retrograde, could explain the preferential synucleinopathy of CA2 [20, 21]. After affecting CA2, synuclein could travel retrograde affecting CA3 and DG. Later, the pathology could affect CA1 thanks to antegrade transport from the affected areas [50]. Furthermore, the subcortical connections of CA2 could explain its greater initial involvement. Murine studies have identified subcortical afferences to CA2 from regions affected in stages prior to HP pathology such as the raphe nucleus (stage 2), the basal nucleus of the amygdala, the supramamillary nucleus, the septal nuclei and the nucleus of the band Broca’s diagonal (stage 3) [51].
Changes in hippocampal structure
According to previous studies, α-syn plays a fundamental role in the brain changes associated with PD, including neurodegeneration and gliosis [3, 52]. Accordingly, differential changes among hippocampal fields, particularly in CA2, were expected. To the best of our knowledge, only two previous stereological studies have analyzed the number of neurons [39] or neurons and glial cells [38] among hippocampal subfields in patients with PD. Using cresyl violet and Giemsa staining, researchers concluded that the numbers of neurons and glial cells did not change significantly [38, 39]. In the present study, specific neuronal, microglial, and astroglial markers were analyzed, producing similar results (Fig. 5). The presence of α-syn is greater in patients with PDD, which is presumed to induce cell death [27]. The present report is the first to analyze the neuronal, microglial and astroglial densities in hippocampal subfields in patients with PDD. Nevertheless, among our patients with PDD and NPD, no cell death was observed in the studied cell populations (see “#” in the Case column of Table 1) (data not shown). As α-syn fibrils permeabilize the plasma membrane, they may allow calcium to enter the cell and induce death. However, consistent with our results, preformed α-syn fibrils infused into CA2/CA3 are not sufficient to cause cell death [53]. Researchers have proposed that this resistance of CA2 neurons to toxic substances such as α-syn is due to an increased capacity of these cells to buffer calcium [54].
Although no changes in the numbers of various cell populations have been reported, α-syn may cause changes in cell structure, leading to volume loss. Previous MRI studies of HP volumetric changes in patients with PD have produced controversial results. Most of them have reported a decrease or no changes in the HP volume in patients with PD, whereas only a few indicate an increase in volume (see Table 7b in Supplementary Table 7 for a detailed literature review on this topic). Since CA2 is particularly affected by α-syn, many studies have focused on its use as a biomarker. However, imaging studies attempting to discriminate volumetric changes among hippocampal subfields have been inconclusive [32, 35] (see also Table 7c in Supplementary Table 7), probably due to the difficulty in delimiting hippocampal subfields based on MRI images. According to our results, stereological approaches using postmortem material neither reported partial nor total volume changes [38] (Fig. 4 and Supplementary Tables 2 and 6). CA2 is also interesting since it has been identified as a critical structure for social memory, and this structure is impaired in patients with PD [21]. In fact, CA2 has been shown to be critical for PDD development. Most MRI studies indicate a loss of HP volume in patients with PDD (Table 7b in Supplementary Table 7), and some reports focus on CA2 [34] (Table 7c in Supplementary Table 7). Among our subjects, individuals with PDD did not show total or partial volumetric differences compared to the NPD group (see “#” in the Case column of Table 1) (data not shown).
Hippocampal proteome
As expected, an overall analysis of the results obtained using proteomic approaches revealed a network of proteins that participate in neurological diseases, but a deeper analysis of the results enabled the identification of specific proteins, such as caskin-1 or α-1-syntrophin, constituting new markers of this neurodegenerative disease. Furthermore, this analysis also revealed important changes in proteins directly related to motor dysfunction, a known symptom of PD. The proteomic analysis appears to be a challenging strategy for identifying subtle pathological changes, but it has not been performed in the HP [40, 55, 56].
Previous studies support the hypothesis that the pathophysiology of PD begins with the accumulation of α-syn microaggregates in presynapses [57]. This accumulation of α-syn leads to a reduction in presynaptic spines, and due to their association with postsynaptic spines, these spines are also altered. Alterations of the synapse affect the release of neurotransmitters, which might explain the clinical alterations in patients with PD, even in the absence of cell death. Although the sample was limited (PD n = 5, NPD n = 5) and included the youngest patient with NPD (37 years old), our proteomic study identified downregulated (caskin-1, TMEM163 and REEP2) and upregulated (δ2-catenin, AHA-1, PHYHIPL and α-1-syntrophin) proteins in patients with PD that play an important role in the synapse (Figs. 7 and 8).
Caskin-1 is a neuronal scaffold protein that is primarily expressed in presynapses. Caskin-1-knockout mice present a decreased density and altered morphology of pre- and postsynaptic dendrites in hippocampal neurons, learning and spatial memory impairments and alterations in LTP. Decreased caskin-1 levels at the presynapse may also exert a negative effect on the postsynapse [58]. An attempt by δ2-catenin to avoid postsynaptic damage might explain why this postsynaptic protein is upregulated in individuals with PD. Indeed, δ2-catenin plays a role in synaptic forward junctions, and it has been to induce morphological changes in the branching and/or prolongation of postsynaptic dendrites based on measurements of synaptic activity [59]. Overexpression of δ2-catenin has also been reported to improve memory [60]. TMEM163, or synaptic vesicle 31, is part of several cellular compartments, including synaptic-like microvesicles, which overlap with zinc enrichment in presynaptic vesicles [61]. This protein is responsible for the uptake of cytoplasmic zinc into the vesicle interior. A lack of TMEM163 expression has been related to PD, as possibly explained by an accumulation of cytoplasmic zinc that deteriorates the proteasome-ubiquitin system, causing greater α-syn aggregation [61, 62]. AHA-1 is a chaperone that has often been linked to tau folding in Alzheimer’s disease. Overexpression of AHA-1 in patients with PD also contributes to the addition of α-syn inclusions in individuals with PD [63].
REEP2 is a tubular ER structural protein that is overexpressed after DNA damage, facilitating the formation of tubular ER. Tubular ER extensions allow contact and signal transduction with the mitochondria [64]. In our study, REEP2 was downregulated, which may indicate a cellular protection mechanism (Fig. 8). α-Syn oligomers and fibrils induce the formation of pores in neurons; therefore, calcium enters cells and might be stored in the ER [65]. Loss of REEP2 might prevent calcium from entering the mitochondria, inducing apoptosis, which may explain why the HP did not show neuronal or glial degeneration. On the other hand, the lack of connection to the ER may leave mitochondria without a supply of calcium necessary for its proper metabolic function. The PHYHIPL mitochondrial protein, which has been shown to protect against ischemic damage, may be required to ameliorate potential mitochondrial deficits [66].
Finally, α-1-syntrophin has been studied due to its relationship with aquaporin-4, which is present in the feet of astrocytes. A decrease in α-1-syntrophin expression reduces the expression of aquaporin-4. However, in our study, the levels of both proteins were increased, which may constitute a protective mechanism against the toxic effect of α-syn on the synapse (Fig. 8). Lower expression of aquaporin-4 leads to lower reuptake of potassium by the feet of astrocytes, which delays neuronal reactivation [67–69].
CONCLUSIONS
To the best of our knowledge, this report is the first to describe the hippocampal proteome in patients with PD, and the findings facilitate the implementation of a number of new research approaches. Synucleinopathy in the HP might not be sufficient to induce cell death, but it might alter the proteome at the synaptic level by downregulating caskin1 and upregulating δ2-catenin. Downregulation of REEP2 and upregulation of PHYHIPL and α-1-syntrophin might be a protective mechanism to ameliorate the toxicity of α-syn and, therefore, these proteins may constitute potential biomarkers of early damage in the HP during PD development. In conclusion, hippocampal synaptic dysfunction, is likely to play a role in cognitive decline in PD, but according to the present results, it is unlikely to be a prominent factor.
ACKNOWLEDGMENTS
The study was sponsored by the UCLM/ERDF (2020-GRIN-29145 to NPND), the Spanish Ministries of Economy and Competitiveness/ERDF (grant no. SAF2016-75768-R) and Science and Innovation (grant no. PID2019-108659RB-I00 to AMM) and the Autonomous Government of Castilla-La Mancha/ERDF (grant no. SBPLY/17/180501/000430 to AMM and DSS). SVC and MGR held a predoctoral fellowship granted by UCLM/ESF and VAL held an assistant professorship granted by UCLM/ERDF. The authors are indebted to our donors, and IDIBAPS, BIOBANK-MUR, BTCIEN and Biobanco del Principado de Asturias integrated in the Spanish National Biobanks Network provided the samples used in this study. We thank Juan R. Peinado from the Oxidative Stress and Neurodegeneration group for validating and rechecking the proteomic data. In addition, we are grateful to American Journal Experts for reviewing the English language of the manuscript. This work is part of the doctoral thesis of Sandra Villar Conde.
CONFLICT OF INTEREST
The authors have no conflict of interest to report.
SUPPLEMENTARY MATERIAL
[1] The supplementary material is available in the electronic version of this article: https://dx.doi.org/10.3233/JPD-202465.
REFERENCES
[1] | Kalia LV , Lang AE ((2015) ) Parkinson’s disease. Lancet 386: , 896–912. |
[2] | Poewe W , Seppi K , Tanner CM , Halliday GM , Brundin P , Volkmann J , Schrag AE , Lang AE ((2017) ) Parkinson disease. Nat Rev Dis Primers 3: , 1–21. |
[3] | Goedert M , Spillantini MG , Del Tredici K , Braak H ((2013) ) 100 years of Lewy pathology. Nat Rev Neurol 9: , 13–24. |
[4] | Jucker M , Walker LC ((2018) ) Propagation and spread of pathogenic protein assemblies in neurodegenerative diseases. Nat Neurosci 21: , 1341–1349. |
[5] | Peng C , Trojanowski JQ , Lee VM ((2020) ) Protein transmission in neurodegenerative disease. Nat Rev Neurol 16: , 199–212. |
[6] | Prusiner SB ((2012) ) Cell biology. A unifying role for prions in neurodegenerative diseases. Science 336: , 1511–1513. |
[7] | Braak H , Del Tredici K , Rub U , de Vos RA , Jansen Steur EN , Braak E ((2003) ) Staging of brain pathology related to sporadic Parkinson’s disease. Neurobiol Aging 24: , 197–211. |
[8] | Burke RE , Dauer WT , Vonsattel JP ((2008) ) A critical evaluation of the Braak staging scheme for Parkinson’s disease. Ann Neurol 64: , 485–491. |
[9] | Jellinger KA ((2010) ) Critical evaluation of the Braak staging scheme for Parkinson’s disease. Ann Neurol 67: , 550. |
[10] | Tolosa E , Pont-Sunyer C ((2011) ) Progress in defining the premotor phase of Parkinson’s disease. J Neurol Sci 310: , 4–8. |
[11] | Heinzel S , Berg D , Gasser T , Chen H , Yao C , Postuma RB , MDS Task Force on the Definition of Parkinson’s Disease ((2019) ) Update of the MDS research criteria for prodromal Parkinson’s disease. Mov Disord 34: , 1464–1470. |
[12] | Postuma RB , Berg D ((2019) ) Prodromal Parkinson’s disease: The decade past, the decade to come. Mov Disord 34: , 665–675. |
[13] | Del Tredici K , Braak H ((2016) ) Review: Sporadic Parkinson’s disease: Development and distribution of alpha-synuclein pathology. Neuropathol Appl Neurobiol 42: , 33–50. |
[14] | Das T , Hwang JJ , Poston KL ((2019) ) Episodic recognition memory and the hippocampus in Parkinson’s disease: A review. Cortex 113: , 191–209. |
[15] | Squire LR , Stark CE , Clark RE ((2004) ) The medial temporal lobe. Annu Rev Neurosci 27: , 279–306. |
[16] | Wang N , Zhang L , Yang HG , Luo XG , Fan GG ((2019) ) Do multiple system atrophy and Parkinson’s disease show distinct patterns of volumetric alterations across hippocampal subfields? An exploratory study. Eur Radiol 29: , 4948–4956. |
[17] | Lorente de Nó R ((1934) ) Studies on the structure of the cerebral cortex. II. Continuation of the study of the Ammonic system. J Psychol Neurol 46: , 113–177. |
[18] | Witter MP ((2007) ) The perforant path: Projections from the entorhinal cortex to the dentate gyrus. Prog Brain Res 163: , 43–61. |
[19] | Flores-Cuadrado A , Ubeda-Banon I , Saiz-Sanchez D , de la Rosa-Prieto C , Martinez-Marcos A ((2016) ) Hippocampal alpha-synuclein and interneurons in Parkinson’s disease: Data from human and mouse models. Mov Disord 31: , 979–988. |
[20] | Middleton SJ , McHugh TJ ((2019) ) CA2: A highly connected intrahippocampal relay. Annu Rev Neurosci 43: , 55–79. |
[21] | Pang CC , Kiecker C , O’Brien JT , Noble W , Chang RC ((2019) ) Ammon’s horn 2 (CA2) of the hippocampus: A long-known region with a new potential role in neurodegeneration. Neuroscientist 25: , 167–180. |
[22] | Dudek SM , Alexander GM , Farris S ((2016) ) Rediscovering area CA2: Unique properties and functions. Nat Rev Neurosci 17: , 89–102. |
[23] | Dickson DW , Schmidt ML , Lee VM , Zhao ML , Yen SH , Trojanowski JQ ((1994) ) Immunoreactivity profile of hippocampal CA2/3 neurites in diffuse Lewy body disease. Acta Neuropathol 87: , 269–276. |
[24] | Kim H , Gearing M , Mirra SS ((1995) ) Ubiquitin-positive CA2/3 neurites in hippocampus coexist with cortical Lewy bodies. Neurology 45: , 1768–1770. |
[25] | Armstrong RA , Kotzbauer PT , Perlmutter JS , Campbell MC , Hurth KM , Schmidt RE , Cairns NJ ((2014) ) A quantitative study of alpha-synuclein pathology in fifteen cases of dementia associated with Parkinson disease. J Neural Transm 121: , 171–181. |
[26] | Churchyard A , Lees AJ ((1997) ) The relationship between dementia and direct involvement of the hippocampus and amygdala in Parkinson’s disease. Neurology 49: , 1570–1576. |
[27] | Bertrand E , Lechowicz W , Szpak GM , Lewandowska E , Dymecki J , Wierzba-Bobrowicz T ((2004) ) Limbic neuropathology in idiopathic Parkinson’s disease with concomitant dementia. Folia Neuropathol 42: , 141–150. |
[28] | Camicioli R , Moore MM , Kinney A , Corbridge E , Glassberg K , Kaye JA ((2003) ) Parkinson’s disease is associated with hippocampal atrophy. Mov Disord 18: , 784–790. |
[29] | Chung SJ , Shin JH , Cho KH , Lee Y , Sohn YH , Seong JK , Lee PH ((2017) ) Subcortical shape analysis of progressive mild cognitive impairment in Parkinson’s disease. Mov Disord 32: , 1447–1456. |
[30] | Melzer TR , Watts R , MacAskill MR , Pitcher TL , Livingston L , Keenan RJ , Dalrymple-Alford JC , Anderson TJ ((2012) ) Grey matter atrophy in cognitively impaired Parkinson’s disease. J Neurol Neurosurg Psychiatry 83: , 188–194. |
[31] | Rektorova I , Biundo R , Marecek R , Weis L , Aarsland D , Antonini A ((2014) ) Grey matter changes in cognitively impaired Parkinson’s disease patients. PLoS One 9: , e85595. |
[32] | Lenka A , Ingalhalikar M , Shah A , Saini J , Arumugham SS , Hegde S , George L , Reddy V , Reddy YCJ , Yadav R , Pal PK ((2018) ) Hippocampal subfield atrophy in patients with Parkinson’s disease and psychosis. J Neural Transm 125: , 1361–1372. |
[33] | Foo H , Mak E , Chander RJ , Ng A , Au WL , Sitoh YY , Tan LCS , Kandiah N ((2016) ) Associations of hippocampal subfields in the progression of cognitive decline related to Parkinson’s disease. Neuroimage Clin 14: , 37–42. |
[34] | Novellino F , Vasta R , Sarica A , Chiriaco C , Salsone M , Morelli M , Arabia G , Saccà V , Nicoletti G , Quattrone A ((2018) ) Relationship between hippocampal subfields and category cued recall in AD and PDD: A multimodal MRI study. Neuroscience 371: , 506–517. |
[35] | Pereira JB , Junque C , Bartres-Faz D , Ramirez-Ruiz B , Marti MJ , Tolosa E ((2013) ) Regional vulnerability of hippocampal subfields and memory deficits in Parkinson’s disease. Hippocampus 23: , 720–728. |
[36] | Giguere N , Burke Nanni S , Trudeau LE ((2018) ) On cell loss and selective vulnerability of neuronal populations in Parkinson’s disease. Front Neurol 9: , 455. |
[37] | Flores-Cuadrado A , Saiz-Sanchez D , Mohedano-Moriano A , Lamas-Cenjor E , Leon-Olmo V , Martinez-Marcos A , Ubeda-Banon I ((2021) ) Astrogliosis and sexually dimorphic neurodegeneration and microgliosis in the olfactory bulb in Parkinson’s disease. NPJ Parkinsons Dis 7: , 11. |
[38] | Joelving FC , Billeskov R , Christensen JR , West M , Pakkenberg B ((2006) ) Hippocampal neuron and glial cell numbers in Parkinson’s disease–a stereological study. Hippocampus 16: , 826–833. |
[39] | Harding AJ , Lakay B , Halliday GM ((2002) ) Selective hippocampal neuron loss in dementia with Lewy bodies. Ann Neurol 51: , 125–128. |
[40] | Dixit A , Mehta R , Singh AK ((2019) ) Proteomics in human Parkinson’s disease: Present scenario and future directions. Cell Mol Neurobiol 39: , 901–915. |
[41] | Flores-Cuadrado A , Ubeda-Banon I , Saiz-Sanchez D , Martinez-Marcos A ((2017) ) alpha-Synucleinopathy in the human amygdala in Parkinson disease: Differential vulnerability of somatostatin- and parvalbumin-expressing neurons. J Neuropathol Exp Neurol 76: , 754–758. |
[42] | Ubeda-Banon I , Saiz-Sanchez D , de la Rosa-Prieto C , Argandona-Palacios L , Garcia-Munozguren S , Martinez-Marcos A ((2010) ) alpha-Synucleinopathy in the human olfactory system in Parkinson’s disease: Involvement of calcium-binding protein- and substance P-positive cells. Acta Neuropathol 119: , 723–735. |
[43] | Mai J , Majtanik M , Paxinos G ((2015) ) Atlas of the Human Brain, Elsevier, New York. |
[44] | West MJ , Gundersen HJ ((1990) ) Unbiased stereological estimation of the number of neurons in the human hippocampus. J Comp Neurol 296: , 1–22. |
[45] | Insausti R , Amaral DG ((2003) ) Hippocampal formation. In The Human Nervous System, Paxinos G, Mai J, eds. Academic Press, pp. 871–914. |
[46] | Gonzalez-Fernandez MJ , Fabrikov D , Ramos-Bueno RP , Guil-Guerrero JL , Ortea I ((2019) ) SWATH differential abundance proteomics and cellular assays show in vitro anticancer activity of arachidonic acid- and docosahexaenoic acid-based monoacylglycerols in HT-29 colorectal cancer cells. Nutrients 11: , 2984. |
[47] | Kramer A , Green J , Pollard J Jr. , Tugendreich S ((2014) ) Causal analysis approaches in ingenuity pathway analysis. Bioinformatics 30: , 523–530. |
[48] | Harding AJ , Halliday GM ((2001) ) Cortical Lewy body pathology in the diagnosis of dementia. Acta Neuropathol 102: , 355–363. |
[49] | Mattila PM , Rinne JO , Helenius H , Roytta M ((1999) ) Neuritic degeneration in the hippocampus and amygdala in Parkinson’s disease in relation to Alzheimer pathology. Acta Neuropathol 98: , 157–164. |
[50] | Adamowicz DH , Roy S , Salmon DP , Galasko DR , Hansen LA , Masliah E , Gage FH ((2017) ) Hippocampal alpha-synuclein in dementia with Lewy bodies contributes to memory impairment and is consistent with spread of pathology. J Neurosci 37: , 1675–1684. |
[51] | Cui Z , Gerfen CR , Young WS 3rd ((2013) ) Hypothalamic and other connections with dorsal CA2 area of the mouse hippocampus. J Comp Neurol 521: , 1844–1866. |
[52] | Ubeda-Banon I , Saiz-Sanchez D , Flores-Cuadrado A , Rioja-Corroto E , Gonzalez-Rodriguez M , Villar-Conde S , Astillero-Lopez V , Cabello-de la Rosa JP , Gallardo-Alcaniz MJ , Vaamonde-Gamo J , Relea-Calatayud F , Gonzalez-Lopez L , Mohedano-Moriano A , Rabano A , Martinez-Marcos A ((2020) ) The human olfactory system in two proteinopathies: Alzheimer’s and Parkinson’s diseases. Transl Neurodegener 9: , 1–20. |
[53] | Nouraei N , Mason DM , Miner KM , Carcella MA , Bhatia TN , Dumm BK , Soni D , Johnson DA , Luk KC , Leak RK ((2018) ) Critical appraisal of pathology transmission in the alpha-synuclein fibril model of Lewy body disorders. Exp Neurol 299: , 172–196. |
[54] | Simons SB , Escobedo Y , Yasuda R , Dudek SM ((2009) ) Regional differences in hippocampal calcium handling provide a cellular mechanism for limiting plasticity. Proc Natl Acad Sci U S A 106: , 14080–14084. |
[55] | Vermeiren Y , Hirschberg Y , Mertens I , De Deyn PP ((2020) ) Biofluid markers for prodromal Parkinson’s disease: Evidence from a catecholaminergic perspective. Front Neurol 11: , 595. |
[56] | Raghunathan R , Hogan JD , Labadorf A , Myers RH , Zaia J ((2020) ) A glycomics and proteomics study of aging and Parkinson’s disease in human brain. Sci Rep 10: , 12804. |
[57] | Schulz-Schaeffer WJ ((2010) ) The synaptic pathology of alpha-synuclein aggregation in dementia with Lewy bodies, Parkinson’s disease and Parkinson’s disease dementia. Acta Neuropathol 120: , 131–143. |
[58] | Bencsik N , Pusztai S , Borbely S , Fekete A , Dulk M , Kis V , Pesti S , Vas V , Szucs A , Buday L , Schlett K ((2019) ) Dendritic spine morphology and memory formation depend on postsynaptic Caskin proteins. Sci Rep 9: , 16843. |
[59] | Kosik KS , Donahue CP , Israely I , Liu X , Ochiishi T ((2005) ) Delta-catenin at the synaptic-adherens junction. Trends Cell Biol 15: , 172–178. |
[60] | Ryu T , Park HJ , Kim H , Cho YC , Kim BC , Jo J , Seo YW , Choi WS , Kim K ((2019) ) Improved memory and reduced anxiety in delta-catenin transgenic mice. Exp Neurol 318: , 22–31. |
[61] | Cuajungco MP , Kiselyov K ((2017) ) The mucolipin-1 (TRPML1) ion channel, transmembrane-163 (TMEM163) protein, and lysosomal zinc handling. Front Biosci 22: , 1330–1343. |
[62] | Lauterbach EC ((2012) ) Psychotropic drug effects on gene transcriptomics relevant to Parkinson’s disease. Prog Neuropsychopharmacol Biol Psychiatry 38: , 107–115. |
[63] | Shelton LB , Baker JD , Zheng D , Sullivan LE , Solanki PK , Webster JM , Sun Z , Sabbagh JJ , Nordhues BA , Koren J 3rd , Ghosh S , Blagg BSJ , Blair LJ , Dickey CA ((2017) ) Hsp90 activator Aha1 drives production of pathological tau aggregates. Proc Natl Acad Sci U S A 114: , 9707–9712. |
[64] | Zheng P , Chen Q , Tian X , Qian N , Chai P , Liu B , Hu J , Blackstone C , Zhu D , Teng J , Chen J ((2018) ) DNA damage triggers tubular endoplasmic reticulum extension to promote apoptosis by facilitating ER-mitochondria signaling. Cell Res 28: , 833–854. |
[65] | Veeresh P , Kaur H , Sarmah D , Mounica L , Verma G , Kotian V , Kesharwani R , Kalia K , Borah A , Wang X , Dave KR , Rodriguez AM , Yavagal DR , Bhattacharya P ((2019) ) Endoplasmic reticulum-mitochondria crosstalk: From junction to function across neurological disorders. Ann N Y Acad Sci 1457: , 41–60. |
[66] | James R , Searcy JL , Le Bihan T , Martin SF , Gliddon CM , Povey J , Deighton RF , Kerr LE , McCulloch J , Horsburgh K ((2012) ) Proteomic analysis of mitochondria in APOE transgenic mice and in response to an ischemic challenge. J Cereb Blood Flow Metab 32: , 164–176. |
[67] | Amiry-Moghaddam M , Williamson A , Palomba M , Eid T , de Lanerolle NC , Nagelhus EA , Adams ME , Froehner SC , Agre P , Ottersen OP ((2003) ) Delayed K+clearance associated with aquaporin-4 mislocalization: Phenotypic defects in brains of alpha-syntrophin-null mice. Proc Natl Acad Sci U S A 100: , 13615–13620. |
[68] | Puwarawuttipanit W , Bragg AD , Frydenlund DS , Mylonakou MN , Nagelhus EA , Peters MF , Kotchabhakdi N , Adams ME , Froehner SC , Haug FM , Ottersen OP , Amiry-Moghaddam M ((2006) ) Differential effect of alpha-syntrophin knockout on aquaporin-4 and Kir4.1 expression in retinal macroglial cells in mice. Neuroscience 137: , 165–175. |
[69] | Hubbard JA , Szu JI , Binder DK ((2018) ) The role of aquaporin-4 in synaptic plasticity, memory and disease. Brain Res Bull 136: , 118–129. |

