
Gait Kinematic Parameters in Parkinson’s Disease: A Systematic Review
Abstract
Background:
Gait impairments are common and highly disabling for Parkinson’s disease (PD) patients. With the development of technology-based tools, it is now possible to measure the spatiotemporal parameters of gait with a reduced margin of error, thereby enabling a more accurate characterization of impairment.
Objective:
To summarize and critically appraise the characteristics of technology-based gait analysis in PD and to provide mean and standard deviation values for spatiotemporal gait parameters.
Methods:
A systematic review was conducted using the databases CENTRAL, MEDLINE, Embase, and PEDro from their inception to September 2019 to identify all observational and experimental studies conducted in PD or atypical parkinsonism that included a technology-based gait assessment. Two reviewers independently screened citations and extracted data.
Results:
We included 95 studies, 82.1% (n = 78) reporting a laboratory gait assessment and 61.1% (n = 58 studies) using a wearable sensor. The most frequently reported parameters were gait velocity, stride and step length, and cadence. A statistically significant difference was found when comparing the mean values of each of these parameters in PD patients versus healthy controls. No statistically significant differences were found in the mean value of the parameters when comparing wearable versus non-wearable sensors, different types of wearable sensors, and different sensor locations.
Conclusion:
Our results provide useful information for performing objective technology-based gait assessment in PD, as well as mean values to better interpret the results. Further studies should explore the clinical meaningfulness of each parameter and how they behave in a free-living context and throughout disease progression.
BACKGROUND
Parkinson’s disease (PD) gait impairments increase with disease progression and are a marker of global health, cognition status, falls risk, and institutionalization [1, 2].
The use of accurate and reliable quantitative information about the mechanics of PD gait is perhaps one of the most promising outcomes that enables early diagnosis, assessment of disease progression and evaluation of therapeutic interventions [3, 4]. In the last decades, with the appearance of technology-based objective measures (TOMs), the evaluation of different spatial and temporal parameters of gait paved the way for a more ecological (i.e., closer to patients’ real-life environment performance) and efficient assessment, with a reduced margin of error. Two types of devices have been commonly used: non-wearable sensors (NWS) and wearable sensors (WS) [4]. The NWS are considered the gold standard. They require a controlled and calibrated environment, where individuals walk with skin-mounted markers whose instantaneous positions are obtained using stereophotogrammetry (motion capture) most often based on optoelectronic sensors. WS are small, lightweight sensors (e.g., inertial measurement units) that are attached to one or several body segments, enabling human motion reconstruction in both the context of a laboratory or during activities of daily living [4].
The International Society of Biomechanics has attempted to standardize reports of joint motion in the field of biomechanics for human movement [5]. However, in the PD field, there is a lack of consensus on the best type of sensors and which gait spatiotemporal parameters are clinically relevant. This limits the use of objective measurements of gait in clinical practice and research. [6–8]. Therefore, we aimed to summarize and critically appraise the characteristics of technology-based gait analysis in PD and to provide mean and standard deviation values for spatiotemporal gait parameters.
METHODS
Literature search
We searched CENTRAL, MEDLINE, and PEDro from their inception to September 2019 using “Parkinson*”, “Gait”, “Walking”, “Accelerometer”, “Algorithm” and “Body-fix sensor” as key words. Reference lists from the identified articles were cross-checked to identify any further potentially eligible studies.
Study selection
We included all observational and experimental studies, or study protocols, conducted in PD patients or atypical parkinsonisms, that included a technology-based gait analysis focused on continuous gait disturbances and that specified which parameters had been studied. There were no restrictions regarding the type of intervention in the active and control arms.
We excluded reviews and studies written in languages other than English, French, Spanish, and Portuguese. All retrieved abstracts were independently screened by two authors. The full texts of potentially relevant articles were retrieved for further assessment. Disagreements were resolved by consensus.
Data extraction
Five pre-defined domains of items were extracted: general information (year and journal of publication, aim of the study, study design, population, intervention, time point assessments, technology development phase), gait assessment supplies (equipment, type of sensor, type of assessment), gait assessment procedures (protocol, medication status, and other outcome tools) and gait parameters values.
According to Maetzler’s classification [6], we classified studies according to their technology development phase, which covered three phases: i) preclinical development and testing (those studies focused on how to measure, i.e., testing algorithms or validating a new gait assessment system), ii) clinical development and testing phase (studies focused on the parameters that can be measured and on their clinical relevance) and iii) clinical validation (experimental and observational studies that use gait analysis as an outcome).
We also used an adaptation of the conceptual model of gait presented by Del Din, 2016 [9] to present and analyze the gait parameters reported in the included studies. Parameters that were only reported in one study, and not fitting the model, were included in the “other parameters” section. Data were extracted by two independent authors. Discrepancies were resolved through discussion.
Data analysis
We summarized the publication characteristics using frequencies and percentages. Review Manager software (v 5.3; Cochrane Collaboration) was used for calculating pooled mean difference (MD) and the 95% confidence interval (CI). Heterogeneity was assessed using the Q test and I2 statistic. An I2 value of <25% was chosen to represent low heterogeneity and an I2 value of >75% to indicate high heterogeneity. A random-effects model was used to pool all outcomes. A p-value of <0.05 was considered to be statistically significant.
RESULTS
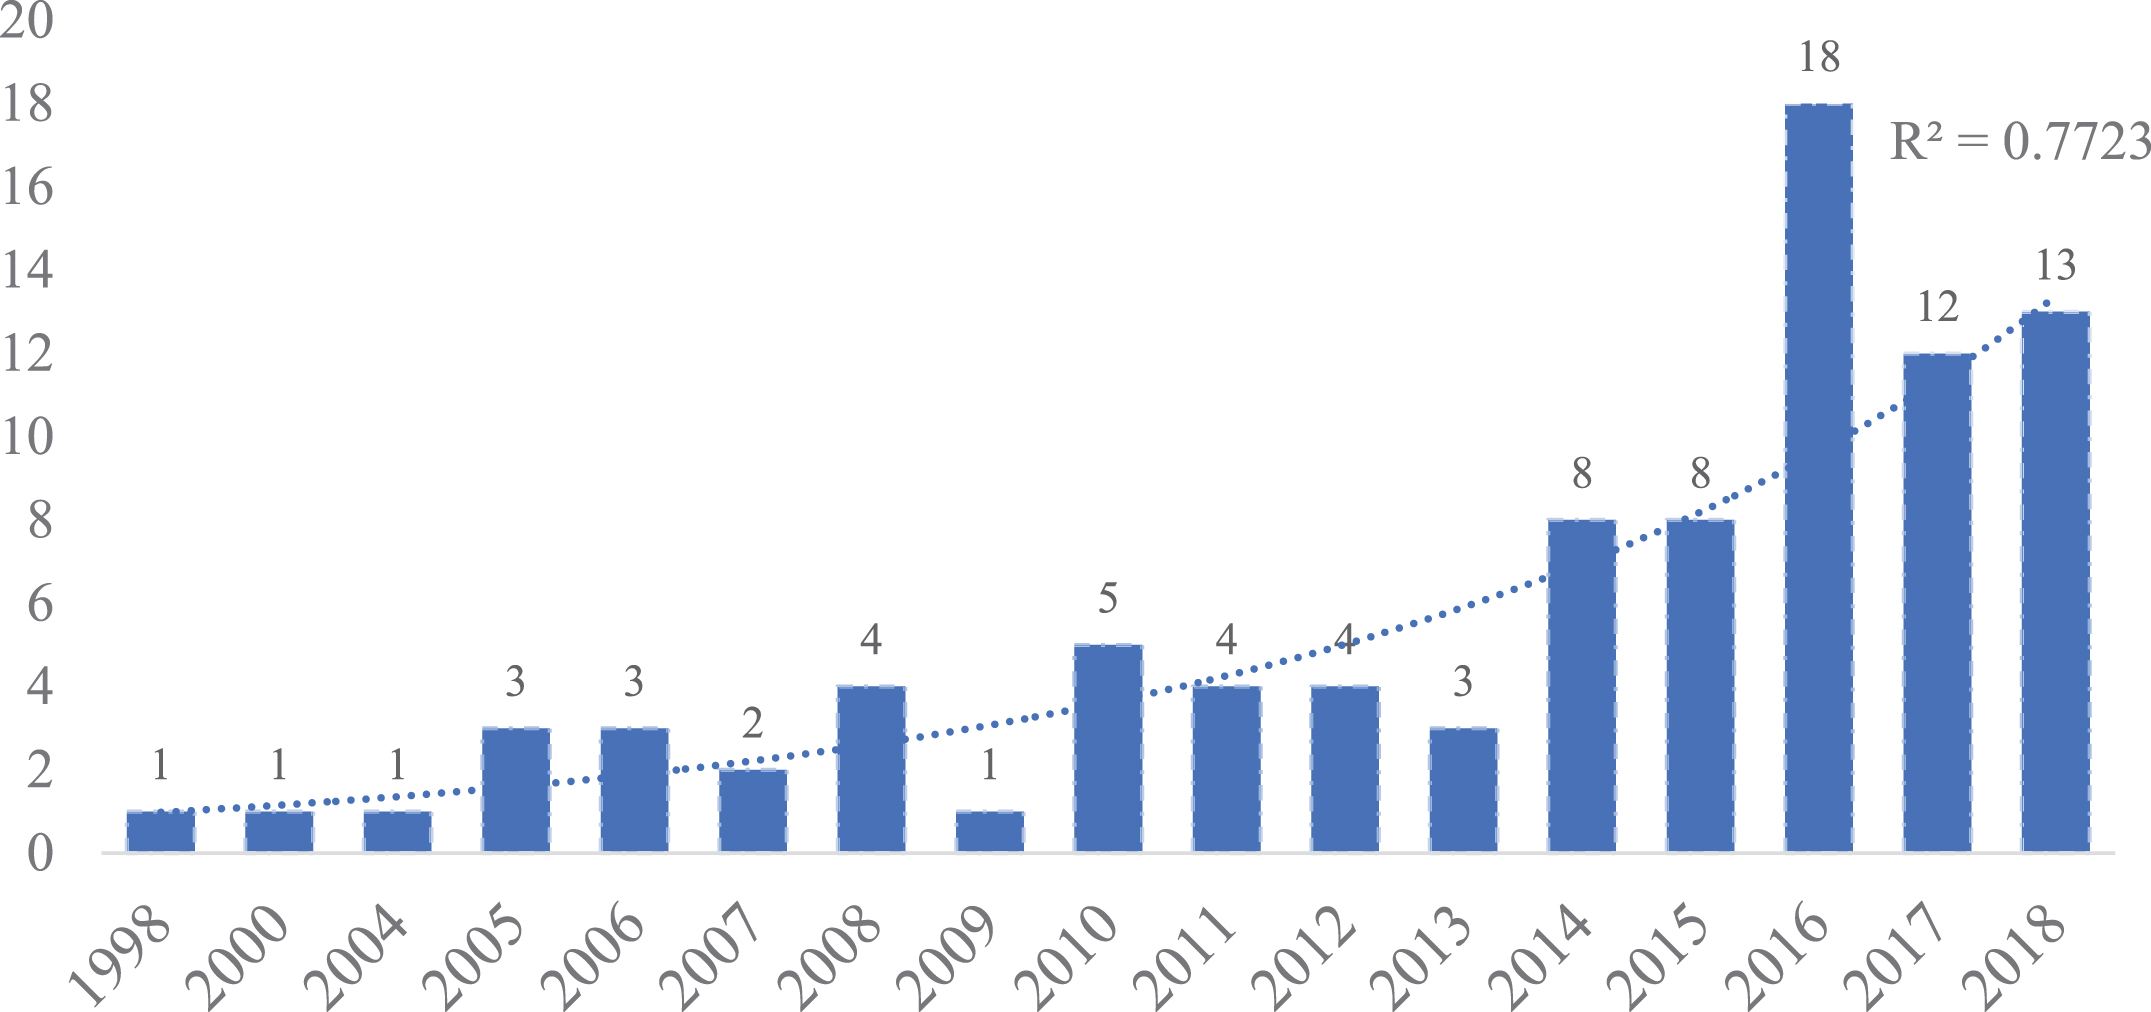
The electronic and hand searches identified 3727 citations. Full-text assessment for eligibility resulted in 95 studies being included (Fig. 1). Overall, the main reasons for exclusion were inappropriate study population (n = 2607) and inadequately defined outcome (n = 378) (Supplementary Material 1).
Fig.1
Number of studies including a technology-based assessment per year in PD.
The most common study designs used were case-control studies (34.7%, n = 33), cross-sectional studies (28.4%, n = 27), and randomized controlled trials (27.4%, n = 26). Of the 95 included studies, 61.1% (n = 58 studies) used WS, 32.6% (n = 31 studies) NWS, and 6.3% (n = 6 studies) both types of devices. Seventy-eight studies (82.1%) reported a laboratory gait assessment, 6.3% (n = 6) a free-living assessment, and 11.6% (n = 11) made the assessment in both contexts (Table 1).
Table 1
Demographic data, clinical data and mean values of gait parameters assessed with non-wearable devices. Unk, unkown; NA, not applicable; SD, standard deviation; CV, coefficient of variation
| Demographic and clinical characteristics | Non-wearable devices (n = 37) | ||||||
| PD | HC | |||||
| Age (Mean, SD (n)) | 67.64±4.76 (33) | 66.72±5.96 (9) | ||||
| Average % Male (Mean, SD (n)) | 65.25±15.83 (26) | 48.14±13.02 (9) | ||||
| Height (Mean, SD (n)) | 1.68±0.07 (13) | 1.68±0.05 (7) | ||||
| BMI (Mean, SD (n)) | 26.34±1,92 (17) | 27.23±1,68 (7) | ||||
| Disease duration (Mean, SD (n)) | 7.71±2.51 (28) | NA | ||||
| UPDRS III (Mean, SD (n)) | 29.31±8.24 (26) | NA | ||||
| Hoenh &Yahr (Mean, SD (n)) | 2.46±0.40 (27) | NA | ||||
| Gait Parameters Mean Values | ||||||
| Domain | Variable | Studies (n) | Units | Most frequent unit (n,%) | PD mean value (mean, SD (n)) | HC mean value (mean, SD (n)) |
| Ambulatory activity | Step count | 3 | number or mean number of steps | NA | NA | NA |
| Gait Velocity | 30 | km/h, m/s, cm/s | m/s (22, 73.33%) | 1.00±0.25 (19) | 1.15±0.32 (5) | |
| Cadence | 18 | strides/min, steps/min | steps/min (15, 83.33%) | 104.04±9.57 (15) | NA | |
| Pace | Stride length | 21 | cm, m | m (11, 52.38%) | 0,99±0.22 (19) | 1,20±0.28 (4) |
| Stride velocity | 1 | m/s | NA | NA | NA | |
| Step length | 17 | cm, m | m (13, 76.47%) | 0.54±0.13 (17) | 0.64±0.06 (6) | |
| Step velocity | 2 | m/s | m/s (2, 100.00%) | 0.98±0.21 (2) | 1.10±0.26 (2) | |
| Stance phase | 8 | % of gait cycle | % of gait cycle (8, 100.00%) | 65.47±3.76 (8) | NA | |
| Swing phase | 5 | % of gait cycle | % of gait cycle (4, 80.00%) | 34.98±1.92 (4) | NA | |
| Swing velocity | 2 | m/s | m/s (2, 100%) | 1.73±0.08 (2) | NA | |
| Double support phase | 10 | % of gait cycle | % of gait cycle (8, 80.00%) | 22.71±8.94 (8) | NA | |
| Rhythm | Stride time | 6 | msec, seconds, strides/second | seconds (3, 50.00%) | 1.22±0.12 (3) | NA |
| Step time | 6 | msec, seconds | seconds (3, 50.00%) | 0.60±0.05 (3) | NA | |
| Stance time | 4 | seconds | seconds (3, 75%) | 0.74±0.11 (3) | NA | |
| Swing time | 4 | msec, seconds | seconds (3, 75.00%) | 0.43±0.07 (3) | NA | |
| Double support time | 4 | msec, seconds | seconds (2, 50.00%) | 0.34±0.19 (2) | NA | |
| Variability | Stride time variability | 2 | SD, % CV | NA | NA | NA |
| Stride length variability | 2 | SD, % CV | NA | NA | NA | |
| Step length variability | 2 | m | m (2, 100%) | 0.020±0.000 (2) | 0.019±0.001 (2) | |
| Step time variability | 3 | msec, % CV | NA | NA | NA | |
| Step velocity variability | 1 | m/s | NA | NA | NA | |
| Stance time variability | 1 | Unk | NA | NA | NA | |
| Swing time variability | 0 | NA | NA | NA | NA | |
| Double support variability | 1 | % | NA | NA | NA | |
| Asymmetry | Step time asymmetry | 1 | Unk | NA | NA | NA |
| Stance time asymmetry | 1 | Unk | NA | NA | NA | |
| Swing time asymmetry | 1 | Unk | NA | NA | NA | |
| Postural control | Step length asymmetry | 2 | cm, m | NA | 0.030±0.014 (2) | NA |
| Step width | 9 | m | m (8, 88.89%) | 0.129±0.027 (9) | 0.100±0.014 (2) | |
| Other parameters | ||||||
| Range of motion of shoulder, trunk, hip, pelvis, knee, ankle | ||||||
| Support base (cm), Latency of postural response to backward translation of center of mass | ||||||
| Maximal voluntary contraction, rate and peak rate of force development | ||||||
| Peak heel clearance (mm), Landing (heel) gradient, Take-off toe (gradient), Max and Min toe clearance (mm) | ||||||
| Magnitude, Smoothness, Attenuation, Regularity, Symmetry, Harmonic ratio | ||||||
| Fractal index | ||||||
| Phase Coordination Index (PCI, %), Asymmetry Index | ||||||
Since only two studies [9, 10] presented values for spatiotemporal gait parameters in free-living assessments, and patients are known to perform differently in the laboratory and free-living contexts, these values were excluded from data analysis [11].
Gait parameters measured with non-wearable sensors
Table 3 lists the gait parameters using NWS reported in the included studies; the most frequently used unit of measurement and the mean and standard deviations of the reported values are also listed.
The most frequently reported parameters (≥20% of the studies) were gait velocity (81.1%, n = 30, PD mean value = 0.99±0.24 m/s), stride length (56.8%, n = 21, PD mean value = 1.06±0.18 m), cadence (48.7%, n = 18, PD mean value = 102.71±10.50 steps/min), step length (46.0%, n = 17, PD mean value = 0.58±0.13 m), double support phase (27.0%, n = 10, PD mean value = 25.89±7.23%) and step width (24.3%, n = 9, PD mean value = 0.13±0.02 m).
Gait parameters measured with wearable sensors
Table 2 lists the gait parameters assessed with a WS reported in the included studies; the most frequently used unit of measurement and the mean and standard deviations of the reported values are also listed.
Table 2
Demographic data, clinical data and mean values of gait parameters assessed with wearable devices. Unk, unkown; NA, not applicable; SD, standard deviation; CV, coefficient of variation
| Demographic and clinical characteristics | Wearable devices (n = 64) | ||||||
| PD | HC | |||||
| Age (Mean, SD (n)) | 66.98±6.89 (56) | 63.40±13.04 (27) | ||||
| Average % Male (Mean, SD (n)) | 60.69±15.60 (53) | 50.42±18.02 (25) | ||||
| Height (Mean, SD (n)) | 1.69±0,04 (27) | 1.69±0,06 (14) | ||||
| BMI (Mean, SD (n)) | 25,76±1,42 (35) | 25,49±1,77 (17) | ||||
| Disease duration (Mean, SD (n)) | 6.78±5.38 (33) | NA | ||||
| UPDRS III (Mean, SD (n)) | 29.46±12.88 (35) | NA | ||||
| Hoenh &Yard (Mean, SD (n)) | 2,28±0,44 (39) | NA | ||||
| Gait Parameters | ||||||
| Domain | Variable | Studies (n) | Units | Most frequent unit (n,%) | PD mean value (mean, SD (n)) | HC mean value (mean, SD (n)) |
| Ambulatory activity | Step count | 12 | number of steps, steps/day | number of steps (7, 53.85%) | NA | NA |
| Gait Velocity | 39 | cm/sec, m/sec | m/sec (34, 87.18%) | 1.01±0.26 (32); 1.04±0.19 (DT, 8) | 1.19±0.31 (17); 1.22±0.1 (DT,3) | |
| Cadence | 18 | Hz, steps/min, steps/sec | steps/min (12, 66.67%) | 106.68±20.57 (11) | 113.34±7.55 (6) | |
| Pace | Stride length | 24 | m, cm, % of the stature | meters (17, 70.83%) | 1.14±0.28 (18) | 1.37±0,08 (8) |
| Stride velocity | 2 | seconds | NA | NA | NA | |
| Step length | 15 | cm, m | m (12, 80.00%) | 0.55±0.13 (13) | 0.61±0.21 (8) | |
| Step velocity | 8 | m/sec | m/sec (6, 75,00%) | 1.18±0.06 (6) | 1.31±0.07 (3) | |
| Stance phase | 2 | % | % (2, 100,00%) | 60.25±1.76 (2) | 57.45±2.75 (2) | |
| Swing phase | 7 | % gait cycle | % gait cycle (7, 100%) | 36.95±5.11 (7) | 39.21±3.62 (4) | |
| Double support phase | 8 | % gait cycle | % gait cycle (8, 100%) | 29.03±5.00 (8) | 23.40±5.83 (6) | |
| Rhythm | Stride time | 18 | %, msec, seconds | seconds (14, 77.78%) | 1.18±0.18 (12) | 1.09±0.07 (9) |
| Step time | 14 | msec, seconds | seconds (7, 50.00%) | 0.55±0.03 (7) | 0.54±0.02 (4) | |
| Stance time | 9 | seconds | seconds (5, 55.56%) | 0.74±0.07 (5) | 0.71±0.03 (3) | |
| Swing time | 12 | msec, seconds | seconds (6, 50.00%) | 0.39±0.03 (6) | 0.39±0.02 (4) | |
| Double support time | 1 | msec | NA | NA | NA | |
| Variability | Stride time variability | 14 | % CV | % CV (12, 85.71%) | 3.84±2.94 (12) | 2.18±0.59 (9) |
| Step length variability | 6 | m | m (4, 66,67%) | 0.032±0.012 (4) | NA | |
| Step time variability | 13 | % CV, msec, seconds | seconds (5, 38.46%) | 0.030±0.005 (5) | 0.022±0.004 (2) | |
| Step velocity variability | 7 | m/sec | m/sec (5, 71.43%) | 0.057±0.021 (5) | 0.055±0.015 (3) | |
| Stance time variability | 8 | % CV, seconds | seconds (4, 50.00%) | 0.036±0.015 (4) | 0.024±0.003 (2) | |
| Swing time variability | 13 | % CV, seconds | % CV (7, 53.85%) | 4.714±3.388 (7) | 2.481±0.624 (5) | |
| Double support variability | 3 | %, CV | % CV (3, 100.00%) | 9.803±4.617 (3) | 6.552±2.224 (3) | |
| Asymetry | Stride time asymetry | 1 | % of stature | NA | NA | NA |
| Step time asymetry | 10 | msec, sec | seconds (4, 40,00%) | 0.021±0.010 (4) | 0.011±0.010 (2) | |
| Stance time asymetry | 7 | seconds | seconds (4, 57.1%) | 0.021±0.010 (4) | 0.011±0.005 (2) | |
| Swing time asymetry | 9 | msec, seconds | seconds (4, 44.44%) | 0.020±0.009 (4) | 0.012±0.002 (2) | |
| Postural control | Step length asymetry | 8 | m | m (6, 75,00%) | 0.024±0.011 (6) | 0.010±0.004 (3) |
| Step width | 2 | m | m (2, 100.00%) | 0.080±0.014 (2) | NA | |
| Other parameters | ||||||
| Ambulatory activity (walking bouts, total time, activity counts/day) | ||||||
| Arm swing amplitude, variability, asymmetry, jerk | ||||||
| Angular velocity of shanks, thighs, trunk and head | ||||||
| Range of head, trunk, shank, thigh and knee rotation | ||||||
| Entropy (measure of variability) | ||||||
| Energy, Power | ||||||
| Magnitude, Smoothness, Attenuation, Regularity, Symmetry, Harmonic ratio, Jerk | ||||||
| SPARC (measure of smoothness) | ||||||
The more frequently reported parameters (≥20% of the studies) were gait velocity (60.9%, n = 39, PD mean value = 1.01±0.26 m/s), stride length (37.5%, n = 24, PD mean value = 1.14±0.25 m), stride time (28.1%, n = 18, PD mean value = 1.18±0.18 s), cadence (28.1%, n = 18, PD mean value = 106.42±19.60 steps/min), step length (23.4%, n = 15, PD mean value = 0.60±0.06 m), step time (21.9%, n = 14, PD mean value = 0.55±0.03 s), stride time variability (21.9%, n = 14, PD mean value = 4.33±2.81% of the coefficient of variation (% CV)) and step time variability (20.3%, n = 13, PD mean value = 0.02±0.00 s).
Three studies evaluated gait in a controlled environment and nine in a free-living context. Due to both the low number of studies presenting a value for this parameter and the heterogeneity of the measurement units, we did not summarize the data nor present a reference value.
PD patients versus healthy controls
We were able to perform a forest plot analysis comparing the mean values of PD patients versus healthy controls (HC) for the following gait parameters: gait velocity, cadence, stride length, stride time, stride time variability, step length, step time, swing time, and double support time. All, except step time using WS, presented a statistically significant difference between groups. For gait velocity and stride length, a statistically significant difference between groups was found in WS assessment, but not in the assessment using NWS (Supplementary Material 2).
Wearable versus non-wearable sensors assessment
Comparison between the two types of devices was possible for gait velocity, stride, and step length. While gait velocity presented a statistically significant difference (p = 0.04, I2 = 76.7%), there was no difference between WS and NWS in stride (p = 0.35, I2 = 0%) or step length (p = 0.14, I2 = 55%) (Supplementary Material 2).
Type of wearable sensor
The use of an accelerometer was compared with the use of other types of sensors for gait velocity. The subgroup analysis was not statistically significant (p = 0.18 and I2 = 44.7%). Both groups showed a statistically significant difference between PD and HC (p≤0.05). The available data did not allow other comparisons for this topic (Supplementary Material 2).
Sensor location
The impact of sensor location (lower back versus feet versus other locations) was studied for gait velocity, stride time, and stride time variability. No differences between groups were registered. Heterogeneity (I2) ranged between 0–52.9%. All the parameters, except for stride time variability, using the sensor in the lower back, showed a statistically significant difference between PD and HC (p≤0.05) (Supplementary Material 2).
Sample characteristics
Studies using non-wearable sensors
Eleven studies used a healthy control group. The mean age of PD patients was 67.1±4.8 years (n = 29 studies) and of 66.3±5.7 years (n = 7 studies) in HC. The mean percentage of male patients was 63.5±16.0 % for PD (n = 22 studies) and of 49.0±11.2 for HC (n = 7 studies). The mean disease duration of PD patients was 7.9±2.3 years (n = 25 studies). The mean Hoehn and Yahr (HY) score was 2.5±0.4 (77.1%, n = 27 studies), and the mean motor score for the Unified Parkinson’s Disease Rating Scale (UPDRS III) was 28.9±7.9 points (71.4%, n = 25 studies) (Table 1).
Studies using wearable sensors
Twenty-nine studies used a healthy control group. The mean age of PD patients was 66.8±6.8 years (82.3%, n = 51 studies) and of 65.1±11.3 in HC (35.5%, n = 22 studies). The mean percentage of male patients was 60.4±15.9 % for PD (77.4%, n = 48 studies) and of 47.4±16.2 for HC (30.6%, n = 19 studies). The mean disease duration of PD patients was 6.7±5.4 years (51.6%, n = 32 studies). The mean HY score was 2.3±0.4 (61.3%, n = 38 studies), and the mean motor score for the UPDRS III was 30.0±13.9 points (53.2%, n = 33 studies) (Table 2).
General characteristics of technology-based gait analysis in PD
From the 95 included studies, according to the technology development phase classification: 24.2% of the studies (n = 23) were in the preclinical development and testing phase, 31.6% (n = 30) were in the clinical development and testing phase and 44.2% (n = 42) belong to the clinical validation phase.
Preclinical development and testing phase
In 56.5% (n = 13) of the 23 studies, gait assessment was performed in the laboratory, in 17.4% (n = 4) it was performed in a free-living context, and in 26.1% (n = 6) it was performed in both contexts.
In 87.0% (n = 20) WS was used, while 13.0% (n = 3) used both type of devices. The most common types of sensors were accelerometers (56.5%, n = 13), accelerometers and gyroscopes (17.4%, n = 4), only gyroscopes (8.7%, n = 2) and smartphones (using an accelerometer and gyroscope, 8.7%, n = 2).
The most common position for the sensor was on the lower back, between the second and fifth lumbar vertebras (43.5%, n = 10 of the studies) (Table 3).
Table 3
General characteristics of technology-based gait analysis in PD
| Preclinical development and testing | Clinical development and testing | Clinical validation | Total | |
| N | 23 | 30 | 42 | 95 |
| Type of assessment | ||||
| Lab | 13 | 25 | 40 | 78 |
| FL | 4 | 2 | 0 | 6 |
| Both | 6 | 3 | 2 | 11 |
| Type of device | ||||
| Wearable | 20 | 23 | 15 | 58 |
| Non wearable | 0 | 5 | 26 | 31 |
| Both | 3 | 2 | 1 | 6 |
| Type of sensor | ||||
| Accelerometer | 13 | 17 | 9 | 39 |
| Accelerometer and gyroscope | 4 | 2 | 3 | 9 |
| Force-sensitive insoles | 0 | 4 | 3 | 7 |
| Accelerometer, gyroscope and magnetometer | 1 | 2 | 0 | 3 |
| Gyroscopes | 2 | 0 | 0 | 2 |
| Smartphone – Accelerometer and gyroscope | 2 | 0 | 0 | 2 |
| Pressure sensor | 1 | 0 | 0 | 1 |
| Magnetometers | 0 | 0 | 1 | 1 |
| Location of the sensor | ||||
| Lower back (L2–L5) | 10 | 18 | 2 | 30 |
| Ankles/Feet | 3 | 4 | 3 | 10 |
| Lower back and ankles/feet | 2 | 2 | 5 | 9 |
| 4–6 sensors | 3 | 0 | 1 | 4 |
| Other | 3 | 1 | 0 | 4 |
| Lower back and wrists | 0 | 0 | 1 | 1 |
| Unknown | 2 | 0 | 4 | 6 |
| Medication state | ||||
| ON-phase medication | 5 | 15 | 28 | 48 |
| OFF-phase medication | 1 | 1 | 5 | 7 |
| ON- and OFF-phase medication | 1 | 2 | 1 | 4 |
| Not described | 12 | 10 | 8 | 30 |
| Not applicable (Free-living) | 4 | 2 | 0 | 6 |
Clinical development and testing phase
In 83.3% (n = 25) of the 30 studies, gait assessment was performed in the laboratory, while in 6.7% (n = 2) it was performed in a free-living context, and in 10.0% (n = 3) it was performed in both contexts.
In 76.7% of the studies (n = 23) a WS was used, 16.7% (n = 5) used NWS and 6.7% (n = 2) used both type of devices. Accelerometer (68.0%, n = 17) and force-sensitive insoles (16.0%, n = 4) were the most frequently used type of sensor. The most common position for the sensor was in the lower back, between the second and fifth lumbar vertebras (72.0%, n = 18) (Table 3).
Clinical validation phase
The majority of the assessments were performed in the laboratory (95.2%, n = 40). NWS was used in 61.9% (n = 26) of the studies, a WS in 35.7% (n = 15) and both devices in one study. Accelerometers (60.0%, n = 9) were the most frequently used type of sensor. The most common position for the sensor was on the lower back and the feet/ankles (33.3%, n = 5). (Table 3)
Protocol details
Table 4 shows the characteristics of the gait assessment protocol. The most frequently used distance in laboratory assessments was 10 meters (n = 23), the shortest distance reported was 3 meters and the longest 500 meters. Table 5 compares PD patients’ gait velocity using a gait assessment protocol with less than 10 meters, 10 meters and more than 10 meters. Due to the heterogeneity of the data, this comparison was only performed for gait velocity and a forest plot analysis was not possible.
Table 4
Protocol details of laboratory and free-living gait assessments
| Protocol details | ||
| Laboratory assessment | ||
| Distance | ||
| Median [Min, Max in meters] | 10 [3,500] | |
| Mode (n, %) | 10 (23, 24.2%) | |
| Trials | ||
| Mean, SD | 4,52±2,98 | |
| Protocol | ||
| Self-selected comfortable speed | 44 | |
| Self-selected comfortable and dual task | 8 | |
| Self-selected comfortable, fast speed and dual task | 6 | |
| Self-selected comfortable and fast speed | 5 | |
| Self-selected comfortable and cueing | 4 | |
| Fast speed | 2 | |
| Fast, normal, and slow speed | 2 | |
| Other | 7 | |
| Unknown | 11 | |
| Free-living assessment | ||
| Duration | ||
| 7 days | 10 | |
| 3 days | 3 | |
| 10 days | 2 | |
Table 5
Analysis of gait speed according to the distance covered in the gait protocol
| Wearable | Non-Wearable | |
| Less than 10 meters (mean, SD (n)) | 0.9±0.2 (5) | 0.9±0.3 (7) |
| 10 meters (mean, SD (n)) | 1.0±0.1 (7) | 0.9±0.4 (8) |
| More than 10 meters (mean, SD (n)) | 1.1±0.3 (18) | NA |
The mean number of trials was 4.3±2.9. In 46.1% of the studies (n = 41), gait assessment was performed at a self-selected comfortable speed. In free-living assessments, the most common duration of data collection was 7 days (58.8%, n = 10).
In 58.5% of studies (n = 48), patients were in an “ON-state” during the assessment, in 7.4% (n = 7) in an “OFF-state” and in 4.2% of the studies (n = 4) the assessment was performed in both conditions (Table 4). Table 6 compares the PD mean values with and without having into account the “ON/OFF” medication state. Due to the low number of studies assessing gait in “OFF” state medication (n = 11, 11.6%) and the heterogeneity of the data, this analysis was only possible to perform for some gait parameters and did not allow for a forest plot analysis. Except for stride time variability, all the mean values of the studies only including an “On” state medication assessment, were closer to those from the HC group.
Table 6
Analysis of PD gait parameters according to the “ON/OFF” medication state during the gait assessment
| Wearable devices | |||
| All | “ON” State Medication | Healthy controls | |
| Gait velocity | 1.01±0.26 (32) | 1.06±0.20 (29) | 1.19±0.31 (17) |
| Cadence | 106.68±20.57 (11) | 112.33±8.89 (10) | 113.34±7.55 (6) |
| Stride Length | 1.14±0.28 (18) | 1.15±0.26 (15) | 1.37±0,08 (8) |
| Stride Time | 1.18±0.17 (13) | 1.18±0.18 (12) | 1.09±0.07 (9) |
| Stride Time Var | 3.84±2.94 (12) | 4.01±3.02 (11) | 2.18±0.59 (9) |
| Double support phase | 29.03±5.00 (8) | 29.22±5.37 (7) | 23.40±5.83 (6) |
| Non-wearable devices | |||
| All | “ON” State Medication | Healthy controls | |
| Gait velocity | 1.00±0.25 (19) | 1.01±0.25 (18) | 1.15±0.32 (5) |
| Cadence | 104.04±9.57 (15) | 105.75±7.15 (14) | NA |
| Stride Length | 0.77±0.40 (19) | 0.77±0.43 (17) | 1,20±0.28 (4) |
| Step Length | 0.54±0.13 (17) | 0.55±0.13 (16) | 0.64±0.06 (6) |
DISCUSSION
The number of studies including a technology-based gait assessment is increasing (Fig. 1). Of the 95 studies included, the majority performed a laboratory assessment (82.1%, n = 78) and used WS (61.1%, n = 58). Accelerometers were the most frequently used type of sensor (67.2%, n = 39), usually on the lower back (51.7%, n = 30). The sample characteristics of the included studies were very similar, not allowing for subgroup analysis.
1) What should be measured?
The most frequently reported parameters in the included studies were gait velocity, stride and step length, and cadence. Compared to HC, PD patients had decreased velocity, reduced stride and step length, decreased swing time, increased stride time, stride time variability and dual support time (p < 0.05). These differences are in line with the usual description of PD gait impairments, i.e., a slow, short-stepped, shuffling, with a forward-stooped posture and asymmetrical arm swing [7, 12, 13].
Beyond this, a large number of different, or differently measured gait parameters, were found in the included studies. From a clinical point of view, not every parameter that can be measured should be measured [6, 8]. The collection and interpretation of the data must lead to justified outcomes, i.e., those with an impact on activities of daily living, displayed in a visually intuitive format that covers the clinical information needs of the stakeholders (health professionals, patients, and caregivers) [6, 8]. For this, gait parameters should be correlated with robust measures of clinical meaningfulness, such as the MDS-UPDRS motor score or the Timed Up and Go Test (TUG). Once the most suitable parameters to measure PD gait impairments in different contexts are established, then the minimal clinically important differences should be addressed for each [6, 8]. Other measures emerging from the nonlinear analysis of human variability (e.g., entropy, fractals, and others) can give us a more accurate angle of patients’ gait dynamics in a real-life environment. However, work is needed to make them more intuitive and clinically informative [6, 8].
Although currently, sensor-based gait analysis has demonstrated feasibility and applicability for objectively assess PD gait impairments, differences still exist measuring the same parameter, with different devices or devices from different manufacturers [3, 14, 15]. This highlights the difficulty of accurately measuring the spatiotemporal gait parameters and the need to continue developing valid and reliable mathematical algorithms. Despite the major technological advances and the current possibility of capturing and store extremely high amounts of data with TOMs, the ability to algorithmically analyze (eliminating the noise) and summarize the clinically relevant data to stakeholders remains limited. [3]
2) Which devices should be used?
The comparison between assessments using WS and NWS was investigated for gait velocity, stride and step length parameters. A statistically significant difference between groups was found in gait velocity (p = 0.04). Although it was the analysis with the highest number of studies (n = 18), due to the level of heterogeneity (I2 = 76.7%), the results should be interpreted with caution. We believe that the differences in the type of devices and in the assessment protocols of the included studies might have contributed to this result.
No statistically significant difference was found in the two other parameters (stride length – p = 0.35, step length – p = 0.14). Taking into account the low value for heterogeneity (I2 = 0%, p < 0.001), we believe that wearable sensors can be used in place of NWS (the gold standard of gait analysis).
WS have the added value of enabling the assessment of gait during activities of daily living in the patients’ actual environment. However, more studies exploring how gait parameters behave in a real-world context are needed [4].
It was only possible to explore the impact of the type of WS for gait velocity. This was undertaken by comparing the use of accelerometer (used in 67.2% of the WS) with all other types of sensors.
Accelerometers allow the measurement of dynamic accelerations of a body, when submitted to an external force, and provide information about the device orientation related to gravity [3, 14, 15]. They are frequently combined with a gyroscope, which allow for the measurement of angular velocities [3, 14, 15]. In some devices, a 3D-magnetometer is also added for orientation purposes.
Since no difference was found in this subgroup analysis (accelerometer versus all other types of sensors) and both groups were able to detect a statistically significant difference between PD and HC, we believe that for an accurate assessment and monitorization of PD patients’ gait impairments, the use of a single accelerometer is feasible. However, for the assessment of turns or of a more complex movement that requires the information captured by angular velocity, wearable devices including at least a gyroscope, seem more suitable.
In the included studies, only one study used an isolated magnetometer for gait analysis. Since magnetometers are very sensitive to magnetic changes (e.g., those produced by proximity with ferromagnetic objects) and therefore to many external interferences, they are more frequently used as a complement to accelerometers and gyroscopes, than as a single sensor [3, 14, 15].
3) Where to place the sensor?
Our results showed that in 46.9% (n = 30) of the studies using WS, the sensor was used on the lower back, between the second and the fifth lumbar vertebra. Although it was only possible to investigate the impact of sensor location for three parameters, it was limited to the comparison between lower back, feet and all other locations, the results consistently show no statistically significant difference between groups. Stride time variability measured with the sensor in the lower back was the only parameter that did not show a statistically significant difference between PD and HC. However, a heterogeneity (I2) of 82% was found, whereby these results should be interpreted carefully.
Several gait analyses protocols have been used. However, an optimal and standardized method remains for establishing [15]. The number and location of the sensors are key aspects for the success of assessments with TOMs, especially in a free-living context [8, 16]. To increase wearing compliance without hindering the precision of data collection the number of sensors should be kept to a minimum, and the least obtrusive devices preferred [8, 16]. Today, although the lower back is not considered the most comfortable and unobtrusive location, it has been shown that a single sensor (accelerometer) in this location is able to capture with precision, physical activity and gait parameters in a laboratory and free-living context [16, 17]. Recently, there has been a move toward using sensors on the wrist or embedded in smartphones. However, problems still exist when collecting data. Kim et al., 2019 [16] report that sensors used on the wrist tend to overestimate the number of steps and the time spent at different intensities of activity. Höchsmann et al., 2018 [18] compared the accuracy of step detection of a smartphone (placed in a trouser pocket, shoulder bag, and backpack) with a WS used on the wrist and waist. At a gait velocity of 4.8 km/h (shoulder bag and backpack) and 6.0 km/h (all positions), smartphones did not exceed a 1% error deviation from the gold standard (threshold to be considered an accurate measurement). However, for a gait velocity of 1.6 km/h, a 3% error was found. In a free-living context, smartphones underestimate the number of steps [18]. Another limitation of free-living assessment with smartphones is the place where it is used. While for men a trouser pocket is a commonly preferred position, for women it is more likely to be the purse or backpack [18]. In the search for a solution for a smartphone-based body location the magnetometer sensor will most certainly be a crucial sensor to consider when dealing with the device’s orientation.
4) Which gait assessment protocol
The comparison between all the included studies and those that only used an assessment in “ON” state medication, revealed that PD gait parameters under the effect of the medication are closer to the HC. Only stride time variability did not follow this pattern. According to the literature [12], stride time variability is increased in PD patients and diminishes in response to dopaminergic medication. In our analysis, we found that the difference between PD on and HC increased when only studies assessing gait in “ON” state medication, were taking into account. However, this result should be interpreted with caution, since this was only a basic comparison of means and gait protocols differentiated substantially in the included studies.
The distance covered during gait analysis varied in the included studies. According to the analysis performed, the distance doesn’t seem to have a high impact on gait velocity tested in a controlled environment. However, the data from the included studies doesn’t allow us to conclude on this topic. More studies are needed to understand the implications of gait protocol length in PD gait parameters.
Almost half of the included studies (43.2%, n = 41) used only a self-selected comfortable speed, during gait assessment. Since some of the gait parameters, like stride length and cadence, are sensitive to velocity and to the presence of concurrent attention demands, gait assessment protocols should include different velocities and both single- and dual-task activities [19]. The most common duration of free-living assessment data collection was seven days, varying between three and ten days. Based on our results, we cannot conclude if this is the best option. These are challenging assessments due to the heterogeneity of ambulatory activity within habitual environments. We believe that the duration of data collection during free-living assessments should be a balance between not performing a burdensome assessment and the ability to collect enough and precise data to obtain a pattern of patients’ performance during the day [8]. As a fluctuating disease, the duration applied in other research fields, may not be appropriate. This topic should be addressed in future studies.
Conclusion
Our results support previous descriptions of PD gait impairments when compared with HC. No statistically significant differences were found for the impact of different types of devices (WS vs NWS), or different types or locations of wearable sensors during assessments. Future studies should test the reported gait parameters against validated clinical meaningful outcome measures in PD to select those most suitable for evaluating and monitoring the progression of gait impairments in PD. More studies are also needed to explore gait parameter behavior in a free-living context, with more complex movements (e.g., including turns, sequences of movements and others).
CONFLICT OF INTEREST
The authors declare that there are no conflicts of interest relevant to this work.
ACKNOWLEDGMENTS
UID/BIM/50005/2019, project funded by Fundação para a Ciência e a Tecnologia (FCT)/ Ministério da Ciência, Tecnologia e Ensino Superior (MCTES) through Fundos do Orçamento de Estado.
Fundação para a Ciência e a Tecnologia (FCT) (PhD SFRH/BD/120773/2016 to RBM and PhD SFRH/BD/144242/2019 to DB).
SUPPLEMENTARY MATERIAL
[1] The supplementary material is available in the electronic version of this article: https://dx.doi.org/10.3233/JPD-201969.
REFERENCES
[1] | Morris R , Hickey A , Del Din S , Godfrey A , Lord S , Rochester L ((2017) ) A model of free-living gait: A factor analysis in Parkinson’s disease. Gait Posture 52: , 68–71. |
[2] | Geroin C , Nonnekes J , de Vries NM , Strouwen C , Smania N , Tinazzi M , Nieuwboer A , Bloem BR ((2018) ) Does dual-task training improve spatiotemporal gait parameters in Parkinson’s disease? Parkinsonism Relat Disord 55: , 86–91. |
[3] | Espay AJ , Bonato P , Nahab FB , Maetzler W , Dean JM , Klucken J , Eskofier BM , Merola A , Horak F , Lang AE , Reilmann R , Giuffrida J , Nieuwboer A , Horne M , Little MA , Litvan I , Simuni T , Dorsey ER , Burack MA , Kubota K , Kamondi A , Godinho C , Daneault JF , Mitsi G , Krinke L , Hausdorff JM , Bloem BR , Papapetropoulos S ; Movement Disorders Society Task Force on Technology ((2016) ) Technology in Parkinson’s disease: Challenges and opportunities. Mov Disord 31: , 1272–1282. |
[4] | Muro-de-la-Herran A , Garcia-Zapirain B , Mendez-Zorrilla A ((2014) ) Gait analysis methods: An overview of wearable and non-wearable systems, highlighting clinical applications. Sensors (Basel) 14: , 3362–3394. |
[5] | Wu G , Siegler S , Allard P , Kirtley C , Leardini A , Rosenbaum D , Whittle M , D’Lima DD , Cristofolini L , Witte H , Schmid O , Stokes I ; Standardization and Terminology Committee of the International Society of Biomechanics ((2002) ) ISB recommendation on definitions of joint coordinate system of various joints for the reporting of human joint motion–part I: ankle, hip, and spine. International Society of Biomechanics. J Biomech 35: , 543–548. |
[6] | Maetzler W , Klucken J , Horne M ((2016) ) A clinical view on the development of technology-based tools in managing Parkinson’s disease. Mov Disord 31: , 1263–1271. |
[7] | Hass CJ , Malczak P , Nocera J , Stegemöller EL , Wagle Shukla A , Malaty I , Jacobson CE 4th , Okun MS , McFarland N ((2012) ) Quantitative normative gait data in a large cohort of ambulatory persons with Parkinson’s disease. PLoS One 7: , e42337. |
[8] | Espay AJ , Hausdorff JM , Sánchez-Ferro Á , Klucken J , Merola A , Bonato P , Paul SS , Horak FB , Vizcarra JA , Mestre TA , Reilmann R , Nieuwboer A , Dorsey ER , Rochester L , Bloem BR , Maetzler W ; Movement Disorder Society Task Force on Technology ((2019) ) A roadmap for implementation of patient-centered digital outcome measures in Parkinson’s disease obtained using mobile health technologies. Mov Disord 34: , 657–663. |
[9] | Del Din S , Godfrey A , Galna B , Lord S , Rochester L ((2016) ) Free-living gait characteristics in ageing and Parkinson’s disease: Impact of environment and ambulatory bout length. J Neuroeng Rehabil 13: , 46. |
[10] | Del Din S , Godfrey A , Rochester L ((2016) ) Validation of an accelerometer to quantify a comprehensive battery of gait characteristics in healthy older adults and Parkinson’s disease: Toward clinical and at home use. IEEE J Biomed Health Inform 20: , 838–847. |
[11] | Heijmans M , Habets JGV , Herff C , Aarts J , Stevens A , Kuijf ML , Kubben PL ((2019) ) Monitoring Parkinson’s disease symptoms during daily life: A feasibility study. NPJ Parkinsons Dis 5: , 21. |
[12] | Hausdorff JM ((2009) ) Gait dynamics in Parkinson’s disease: Common and distinct behavior among stride length, gait variability, and fractal-like scaling. Chaos 19: , 026113. |
[13] | König N , Singh NB , Baumann CR , Taylor WR ((2016) ) Can gait signatures provide quantitative measures for aiding clinical decision-making? A systematic meta-analysis of gait variability behavior in patients with Parkinson’s disease. Front Hum Neurosci 10: , 319. |
[14] | Schlachetzki JCM , Barth J , Marxreiter F , Gossler J , Kohl Z , Reinfelder S , Gassner H , Aminian K , Eskofier BM , Winkler J , Klucken J ((2017) ) Wearable sensors objectively measure gait parameters in Parkinson’s disease. PLoS One 12: , e0183989. |
[15] | Rovini E , Maremmani C , Cavallo F ((2017) ) How wearable sensors can support Parkinson’s disease diagnosis and treatment: A systematic review. Front Neurosci 11: , 555. |
[16] | Kim DW , Hassett LM , Nguy V , Allen NE ((2019) ) A comparison of activity monitor data from devices worn on the wrist and the waist in people with Parkinson’s disease. Mov Disord Clin Pract 6: , 693–699. |
[17] | Godfrey A , Bourke A , Del Din S , Morris R , Hickey A , Helbostad JL , Rochester L ((2016) ) Towards holistic free-living assessment in Parkinson’s disease: Unification of gait and fall algorithms with a single accelerometer. Conf Proc IEEE Eng Med Biol Soc 2016: , 651–654. |
[18] | Höchsmann C , Knaier R , Eymann J , Hintermann J , Infanger D , Schmidt-Trucksäss A ((2018) ) Validity of activity trackers, smartphones, and phone applications to measure steps in various walking conditions. Scand J Med Sci Sports 28: , 1818–1827. |
[19] | van Wegen E , Lim I , de Goede C , Nieuwboer A , Willems A , Jones D , Rochester L , Hetherington V , Berendse H , Zijlmans J , Wolters E , Kwakkel G ((2006) ) The effects of visual rhythms and optic flow on stride patterns of patients with Parkinson’s disease. Parkinsonism Relat Disord 12: , 21–27. |


