
Fecal and Blood Microbial 16s rRNA Gene Alterations in Chinese Patients with Multiple System Atrophy and Its Subtypes
Abstract
Background and Objective:
To explore the alterations of microbial 16s ribosomal (rRNA) gene in the feces and blood of Chinese patients with multiple system atrophy (MSA) and its relationships with clinical features.
Methods:
40 MSA patients (MSA-P/MSA-C: 23/17) and their healthy spouses were recruited. Fecal and blood microbiota were investigated by high-throughput IllUmina Miseq sequencing targeted on the V3-V4 functional region of 16s rRNA gene. The relationships between microbiota and clinical characteristics were analyzed.
Results:
The abundances of Lactobacillus, Gordonibacter, Phascolarctobacterium, and Haemophilus in feces and abundances of Leucobacter, and Bacteroides in blood were different between MSA patients and healthy controls (HC). Combining the taxa from feces and blood, six genera were identified to be predictive of MSA, achieving an area under the curve (AUC) of 0.853. The abundances of Phascolarctobacterium and Ruminococcus in feces were lower in MSA-P than those in MSA-C. The abundances of Blastococcus, Bacillus, and Acinetobacter in blood were different between MSA subtypes. These five genera differentiated MSA subtypes with an AUC of 0.898. Functional predictions indicated that gene functions involving biosynthetic metabolism and bacterial secretion systems were significantly different between the MSA and HC. The differential genera were associated with disease duration, anxiety, and autonomic dysfunctions.
Conclusions:
We confirmed the alterations of microbial 16s rRNA gene in the feces and blood occurs in Chinese patients with MSA. Microbiota dysbiosis was related to MSA clinical manifestations. Elucidating these differences in microbiomes will be helpful to improve our knowledge of the microbiota in the pathogenesis of MSA.
INTRODUCTION
Multiple system atrophy (MSA) is a progressive neurodegenerative disease characterized by progressive autonomic failure, parkinsonism, cerebellar ataxia, and pyramidal dysfunction [1]. Gastrointestinal symptoms are frequent complaints of patients with MSA due to autonomic nervous system dysfunction. Similar to idiopathic Parkinson’s disease (PD), subjects with MSA suffer from multiple gastrointestinal symptoms including constipation [2–4], fecal incontinence [5, 6], delayed gastric emptying [4, 5], slow colonic transit, and abnormal electromyography of the external anal sphincter [4, 6, 7]. The pathological hallmark is the formation of α-synuclein-containing glial cytoplasmic inclusions (GCIs) in olivopontocerebellar and striatonigral areas [8, 9], and α-synuclein deposits can also be observed in the enteric nervous system of MSA [10].
Gastrointestinal dysfunction is closely related to gut microbiota dysbiosis. Gut microbiota can regulate both the enteric and central nervous system activities through neural, endocrine and metabolic mechanisms according to the concept of the microbiota-gut-brain axis [11]. Alteration of gut microbiota was associated with a series of neurodegenerative diseases [11, 12], including PD [13–16]. There are two reports of intestinal microflora dysbiosis in MSA patients from different populations [17, 18], such as subjects from Malaysia [17], and from Chicago [18], however, the results of these two studies with small sample sizes were totally different, there is no report in the Chinese patients with MSA so far.
It has long been thought that blood is a sterile environment [19]. However, sequence-based studies have uncovered that blood microbiota were associated with non-communicable disease [20–22]. Microscopic measurement revealed that microbes were in close proximity to the red blood cells (RBCs) of patients with PD [19]. Once the alterations of microbial 16s ribosomal RNA (rRNA) gene in the blood of patients with PD were reported [23], whether the 16s rRNA gene in the blood of MSA patients were changed has not been reported yet.
Our study mainly explored the alterations of microbial 16s rRNA gene in the feces and blood of Chinese patients with MSA and their healthy spouses. We also established a disease diagnosis and differential diagnosis model for MSA in the combination of fecal and blood 16s rRNA genes. The associations between microbiota and clinical variables were also analyzed in detail.
MATERIALS AND METHODS
Subjects and clinical evaluation
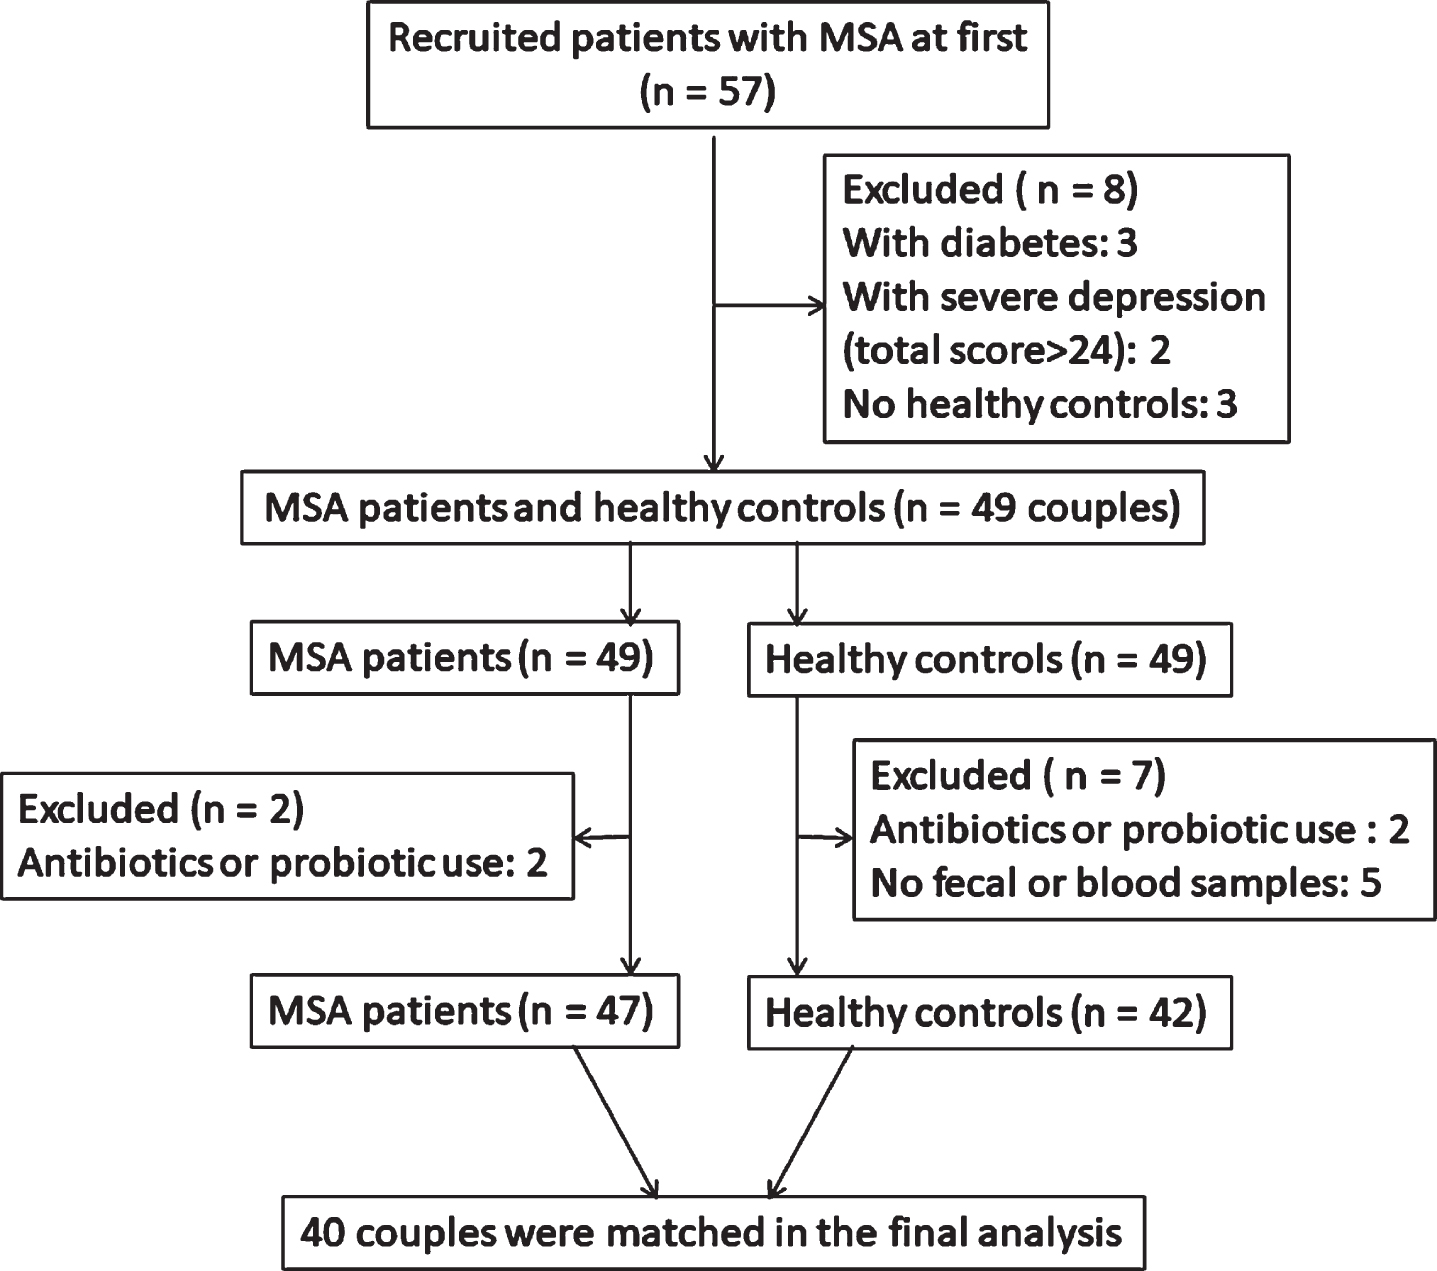
57 patients with MSA and 54 health controls (HCs) were recruited at first in our study. All subjects were enrolled from the movement disorder clinic at Department of Neurology, Ruijin Hospital affiliated to Shanghai Jiao Tong University School of Medicine during the period from October 2016 to May 2018. Patients were diagnosed as probable MSA according to the second consensus criteria for MSA by senior movement disorder specialists [1]. HCs who had no signs of parkinsonism or potential premotor symptoms were enrolled from the spouses of the patients who lived with patients for at least 20 years to minimize variation caused by different living environments. A total of 40 MSA and 40 HC subjects were included in the final analysis (Fig. 1). Demographic data (age, gender, and BMI (kg/cm)) in all subjects and clinical features in MSA patients including disease duration, levodopa equivalent daily dosage (LEDD), constipation condition, motor and non-motor symptoms were recorded in our study. Exclusion criteria and clinical evaluation scales were seen in the Supplementary Methods. To verify the significantly different genera identified in feces using real-time polymerase chain reaction (PCR), another independent group of 40 probable MSA patients and 40 HCs was recruited. This study protocol was approved by the Ethics Committee of Ruijin Hospital affiliated to Shanghai Jiao Tong University School of Medicine. All subjects consented to cooperate with this study, the written informed consents were obtained from all subjects in the study as well.
Fig.1
Recruitment flowchart illustrating the couples based on the exclusion and inclusion criteria.
Fecal and blood sample collection and DNA extraction
Fecal DNA was extracted using the QIAamp Fast DNA Stool Mini Kit (Qiagen, Hilden, Germany) after the sample collection. The blood DNA was extracted from peripheral blood leukocytes using a classical phenol/chloroform extraction method [22]. Regarding potential contamination of the study, fecal and blood DNA extractions were conducted carefully to decrease the risk of contamination by the operating steps. All the DNA extraction were performed by one person within 4 days. Detailed stool and blood collection requirements were seen in the Supplementary Methods.
Analysis of microbial DNA
After extraction of total 16s rRNA gene from both the fecal and blood samples, PCR amplification was carried out for high-throughput IllUmina Miseq sequencing targeted on the V3-V4 functional region of the 16s rRNA gene. Detailed amplification, sequencing, and analysis processes were described in the Supplementary Methods. After quality control and mergence, an average of 40000 reads per sample were selected, and numbers of the optimized sequences were shown in Supplementary Table 1.
Genus-specific quantification by Real-Time PCR
The 16S rRNA gene copies of each sample was evaluated by real-time PCR using universal forward and reverse primers, EUBF: 50-GCTCGTGTCGTGAGATGTT-30 and EUBR: 50-TGTAGCCCAGGTCATAAGG-30. The genus-specific primer sequences used in this study are listed in Supplementary Table 2.
Statistical analysis
Mothur and R version software were used for the statistical analysis. Continuous data were presented as mean and standard deviation (mean±SD) and compared by Wilcoxon rank-sum test. Categorical variables were presented as numbers/percentage and compared between groups using chi-squared (χ2) test. For taxa with a prevalence≥10%, differences in microbial abundances between patients and controls were analyzed using Wilcoxon rank-sum test at the phylum, class, order, family, genus, and species levels. For multiple comparisons of bacterial analysis, the false discovery rate (FDR) was calculated. We chose the genus level for further analysis (Supplementary Methods).
RESULTS
Demographics and clinical data
Demographic and clinical characteristics of patients with MSA and HCs are presented in Table 1. No differences were observed in age, gender, BMI, history of smoke, alcohol, tea, or yogurt consumption between MSA and HC groups (p > 0.05). MSA patients had higher percentage of constipation than HC group (p < 0.001). The severity of constipation in MSA patients was much more obvious than in HC subjects assessed by Wexner Scale (p < 0.001). MSA patients had mean disease duration of 3.93±1.91 years, LEDD of 563.78±405.64 mg/d, UMSARS-II score of 21.3±9.4, MMSE score of 26.0±3.1, and SCOPA-AUT score of 22.2±9.8.
Table 1
Demographic data and clinical characteristics in all subjects
| MSA (n = 40) | MSA-P (n = 23) | MSA-C (n = 17) | HC (n = 40) | p valuec | p valued | |
| Age(y)a | 60.98±6.7 | 62.48±5.48 | 58.94±7.83 | 60.88±7.0 | 1.000 | 0.157 |
| Male% (male/female)b | 57.5% (23/17) | 52.2% (12/11) | 64.7% (11/6) | 42.5% (17/23) | 0.180 | 0.525 |
| BMI (kg/cm2)a | 23.93±3.25 | 24.10±3.10 | 23.70±3.53 | 23.78±2.80 | 1.000 | 0.529 |
| Wexnera | 8.40±5.30 | 8.78±5.41 | 7.88±5.27 | 1.35±2.17 | <0.001 | 0.621 |
| Constipation% (±)b | 75% (30/10) | 69.6% (16/7) | 82.3(14/3) | 12.5% (5/35) | <0.001 | 0.471 |
| HAMD-17a | 11.63±4.72 | 12.43±5.09 | 10.53±4.05 | 0.85±1.61 | <0.001 | 0.336 |
| HAMAa | 12.18±5.12 | 12.48±4.80 | 11.76±5.65 | 0.73±1.59 | <0.001 | 0.681 |
| Smoke (±)b | 10% (4/36) | 4.3% (1/22) | 17.6% (3/14) | 20% (8/32) | 0.348 | 0.294e |
| Alcohol (±)b | 17.5% (7/33) | 8.7% (2/21) | 29.4% (5/12) | 15% (6/34) | 1.000 | 0.113e |
| Tea (±)b | 17.5% (7/33) | 13.0% (3/20) | 23.5% (4/13) | 12.5 (5/35) | 0.754 | 0.432e |
| Yogurt (±)b | 25% (10/30) | 21.7% (5/18) | 29.4% (5/12) | 32.5% (13/27) | 0.621 | 0.717e |
| Disease duration (y)a | 3.93±1.91 | 4.52±1.68 | 3.12±1.97 | / | / | 0.014 |
| LEDD (mg/d)a | 563.78±405.64 | 802.22±313.554 | 241.18±271.273 | / | / | <0.001 |
| UMSARS-IIa | 21.3±9.4 | 25.87±8.66 | 15.18±6.57 | / | / | <0.001 |
| MMSEa | 26.0±3.1 | 25.57±3.30 | 26.59±2.83 | / | / | 0.423 |
| SCOPA-AUTa | 22.2±9.8 | 22.52±10.35 | 21.65±9.30 | / | / | 0.956 |
aData were shown as mean±SD, compared by Wilcoxon test. bData were shown as number %, compared by χ2 test. cCompared between MSA and HC. dCompared between MSA-P vs MSA-C. eFisher test. MSA, Multiple system atrophy; MSA-P, multiple system atrophy with predominately parkinsonism; MSA-C, multiple system atrophy with predominately cerebellar ataxia; HC, Health controls; BMI, Body Mass Index; HAMD-17, 17-item Hamilton Rating Scale for Depression; HAMA, Hamilton Anxiety Scale; LEDD, levodopa equivalent daily dosage; UMSARS-II, the Unified Multiple System Atrophy Rating Scale-II; MMSE, Mini-Mental State Examination; SCOPA-AUT, The Scale for Outcomes in PD autonomic dysfunction.
Alterations of microbiota
Comparisons of microbiota between MSA and HC group
A total of 26 phyla, 45 classes, 68 orders, 108 families, and 222 genera were identified in gut microbiota in MSA and HC groups. No significant difference was observed in α-diversity (Fig. 2A). β-diversity based on Bray-Curtis did not show any significant difference (p > 0.05, FDR p > 0.05, data not shown). Also, there was no difference in the weighted Unifrac-based β-diversity (p = 0.243; FDR p = 0.441). However, the unweighted Unifrac-based β-diversity revealed a significant difference between MSA and HC groups (p = 0.001; FDR p = 0.021) (Fig. 2B). This indicated the composition of fecal microbiota in MSA patients was significantly different from that in HC group. Here we only paid attention to the genus level between these two groups. We used LEfSe analysis to investigate the specific changes of the microbial abundance. The mean relative abundant genera of Scardovia , Lactobacillus, Gordonibacter, and Phascolarctobacterium were higher in MSA group, while the mean relative abundant genus of Haemophilus was lower in MSA group than that in HC group (Fig. 3A&B, LDA score (log10)>2). To control the effects of confounding factors (age, gender, BMI, constipation, LEDD, depression, and anxiety) on the abundance differences, GLMs were applied to model the differences of bacterial abundances (Supplementary Table 3). Finally, the increased abundances of Lactobacillus, Gordonibacter, and Phascolarctobacterium, and decreased abundances of Haemophilus were significantly related to MSA diagnosis.
Fig.2
The α-diversity and β-diversity of gut microbiota in MSA and HC groups. A) Ace, chao, Shannon, Simpson and PD whole tree indexes were described in box plots and compared by Wilcoxon test. Each box plot represented the median, interquartile range, minimum, and maximum values. B) PCoA depicted the differences of β-diversity based on unweighted and weighted UniFrac dissimilarity matrix. ANOSIM was used to compare the differences of β-diversity between the two groups. The axes represented the principal coordinate component that interprets the data variance. MSA, multiple system atrophy (green); HC, healthy control (red); PCoA, principal coordinate analysis; ANOSIM, analyses of similarity; PC, principal coordinate.

Fig.3
Taxonomic differences of fecal and blood microbiota. A) Comparisons of gut microbiota between MSA and HC groups. The most differentially abundant taxa in feces between MSA and HC groups were identified through the LDA scores which was generated from LEfSe analysis. The LDA scores (log10)>2 and p < 0.05 were listed. B) The enriched taxa in MSA and HC groups were listed in Cladogram. The central point represents the highest classified level, and each ring represents the next lower taxonomic level. The diameter of each circle represents the relative abundance of the taxon. C) Comparisons of blood microbiota between MSA and HC group. D) ROC curves were built to evaluate the diagnostic value for MSA based on the specifically differential bacteria by LEfSe analysis. With six genera both in feces and blood, MSA could be separated from HCs with an AUC of 0.853. E) Comparisons of gut microbiota between MSA subtypes. F) Comparisons of blood microbiota between MSA subtypes. G) ROC curves were used for the differential diagnosis of MSA subtypes. With five genera both in feces and blood, MSA-P could be separated from MSA-C with an AUC of 0.898. p, phylum; c, class; o, order; f, family; g, genus; s, species; MSA, multiple system atrophy (green); HC, healthy control (red); MSA-P, multiple system atrophy with predominately parkinsonism (green); MSA-C, multiple system atrophy with predominately cerebellar ataxia (red); LDA, linear discriminant analysis; ROC, receiver operating characteristic curve; AUC, area under the curve.

Blood microbiota was also detected in MSA and HC group. A total of 24 phyla, 31 classes, 70 orders, 92 families, and 156 genera were identified in blood microbiota. No significant difference was observed in α-diversity (Supplementary Figure 1A). β-diversity based on Bray-Curtis did not show significant difference (p > 0.05, FDR p > 0.05, data not shown). However, the unweighted and weighted Unifrac-based β-diversity revealed significant differences between MSA and HC groups (unweighted p = 0.018 (FDR, p = 0.029); weighted p = 0.047 (FDR, p = 0.034)) (Supplementary Figure 1B). With LEfSe analysis, the mean relative abundant genus of Bacteroides was higher in MSA group, while the mean relative abundance of Leucobacter was lower in MSA group (Fig. 3C, LDA score (log10)>2). Finally, the increased abundance of Bacteroides and decreased abundance of Leucobacter were significantly related to MSA diagnosis based on GLMs adjusting for age, gender, BMI, constipation, LEDD, depression, and anxiety (Supplementary Table 3).
To evaluate the diagnostic status for MSA based on specifically differential bacteria by LEfSe analysis, receiver operating characteristic curve (ROC) was used to build a predictive model. The combination of 4 differential taxa in feces (Lactobacillus, Gordonibacter, Phascolarctobacterium, and Haemophilus) differentiated MSA patients from controls with a modest accuracy (area under the curve [AUC] 0.798, 95% CI 0.702–0.894, p < 0.001), yielding a sensitivity of 90.0% and a specificity of 62.5% in the ROC curve (Fig. 3D). However, the combination of Leucobacter and Bacteroides in blood differentiated MSA patients from controls with an AUC of 0.748 (95% CI 0.640–0.855, sensitivity 60.0% and specificity 85.0%, p < 0.001) in the ROC curve (Fig. 3D). Combining the different taxa from the feces and blood, 6 genera were identified to be predictive of MSA, achieving an AUC of 0.853 (95% CI 0.771–0.936, sensitivity 62.5% and specificity 100%, p < 0.001) (Fig. 3D).
Comparisons of microbiota between MSA subtypes
We also used LEfSe analysis to explore the different microbiota between MSA subtypes in order to discriminate these two groups. We first compared the MSA subtypes with their respective HCs to eliminate the environmental factors that could interrupt the differential bacteria. In fecal samples, the mean relative abundant genera of Phascolarctobacterium and Ruminococcus were lower in MSA-P group than those in MSA-C group (Fig. 3E, Supplementary Table 4), these bacteria were significantly different in the comparison between MSA-P and their corresponding HCs, as well as the comparison between MSA-C and their matched HC (Supplementary Figure 2A&2B). ROC curve revealed that these two genera together differentiated MSA-C patients from MSA-P patients with an AUC of 0.844 (95% CI 0.722–0.966, sensitivity 82.4% and specificity 78.3%, p < 0.001) (Fig. 3G). In blood samples, the mean relative abundance of Blastococcus and Bacillus was increased in MSA-P patients, while Acinetobacter was decreased in MSA-P patients compared with MSA-C patients (Fig. 3F, Supplementary Table 4). However, the predictive model could not discriminate well between the MSA subtypes based on differential genera in blood ([AUC] 0.655, 95% CI 0.485–0.825, p = 0.098) (Fig. 3G). Combining the different taxa from the feces and blood, 5 genera differentiated MSA-C patients from MSA-P patients, achieving an AUC of 0.898 (95% CI 0.801–0.994, sensitivity 94.1% and specificity 78.3%, p < 0.001) (Fig. 3G).
Verification of different genera in feces by Real-Time PCR
Particularly, we designed the genus-specific primers and conducted real-time PCR to verify the changes of these genera based on the LEfSe in feces, the increased abundances of Phascolarctobacterium, Lactobacillus, Gordonibacter, and the decreased abundances of Haemophilus were identified in MSA patients using real-time PCR (p = 0.028, 0.001, 0.040, and 0.021, Supplementary Figure 2C). Compared with MSA-C patients, the decreased abundances of Phascolarctobacterium and Ruminococcus were also identified in MSA-P patients (p = 0.036 and 0.018, Supplementary Figure 2E). Furthermore, we verified these genera using real-time PCR in the fecal samples of another independent group of 40 MSA patients and 40 HCs (Supplementary Table 5), the increased Phascolarctobacterium (p = 0.020) and Gordonibacter (p = 0.014) were identified in MSA patients (Supplementary Figure 2D). There was an upward trend in the abundance of Lactobacillus (p = 0.053) and a downward trend in the abundance of Haemophilus (p = 0.751) in MSA patients (Supplementary Figure 2D). Compared with MSA-C patients, the decreased Phascolarctobacterium and Ruminococcus were also identified in MSA-P patients (p = 0.039 and 0.011, Supplementary Figure 2F).
Functional prediction of fecal and blood microbiota
In order to predict the functional alterations of the microbes in feces and blood, PICRUSt was applied to estimate the KO abundances using the 16s rRNA gene sequencing data in MSA patients and HCs. Significant difference was identified in 6 KEGG pathways (Level 3) in fecal microbiota. The KEGG pathways involved in synthesis and degradation of ketone bodies, taurine and hypotaurine metabolism, and bacterial secretion system had higher abundances in MSA patients than that in HCs (p < 0.05) (Fig. 4A). Conversely, the KEGG pathways including restriction enzyme, linoleic acid metabolism, and RNA transport were less abundant in MSA patients relative to HCs (p < 0.05) (Fig. 4A).
Fig.4
Functional predictions of the microbiota and its associations between clinical features. Functional predictions of the microbiota in MSA and HC groups were listed in (A), (B), and (C). In feces, significant differences of KEGG pathways at level 3 were identified by STAMP software (A). In blood, significant KEGG pathways at level 2 (B) and 3 (C) were identified. Associations between clinical features and microbiota in feces (D) and blood (E) were listed in the heat maps using Spearman’s rank-correlation analysis. The intensity of the color represented the “r” value (negative score, blue; positive score, red). *p < 0.05, **p < 0.001. KEGG, Kyoto Encyclopedia of Genes and Genomes; UMSARS-II, The Unified Multiple System Atrophy Rating Scale-II; HAMD-17, 17-item Hamilton Rating Scale for Depression; HAMA, Hamilton Anxiety Scale; MMSE, Mini-Mental State Examination; SCOPA-AUT, The Scale for Outcomes in PD autonomic dysfunction.
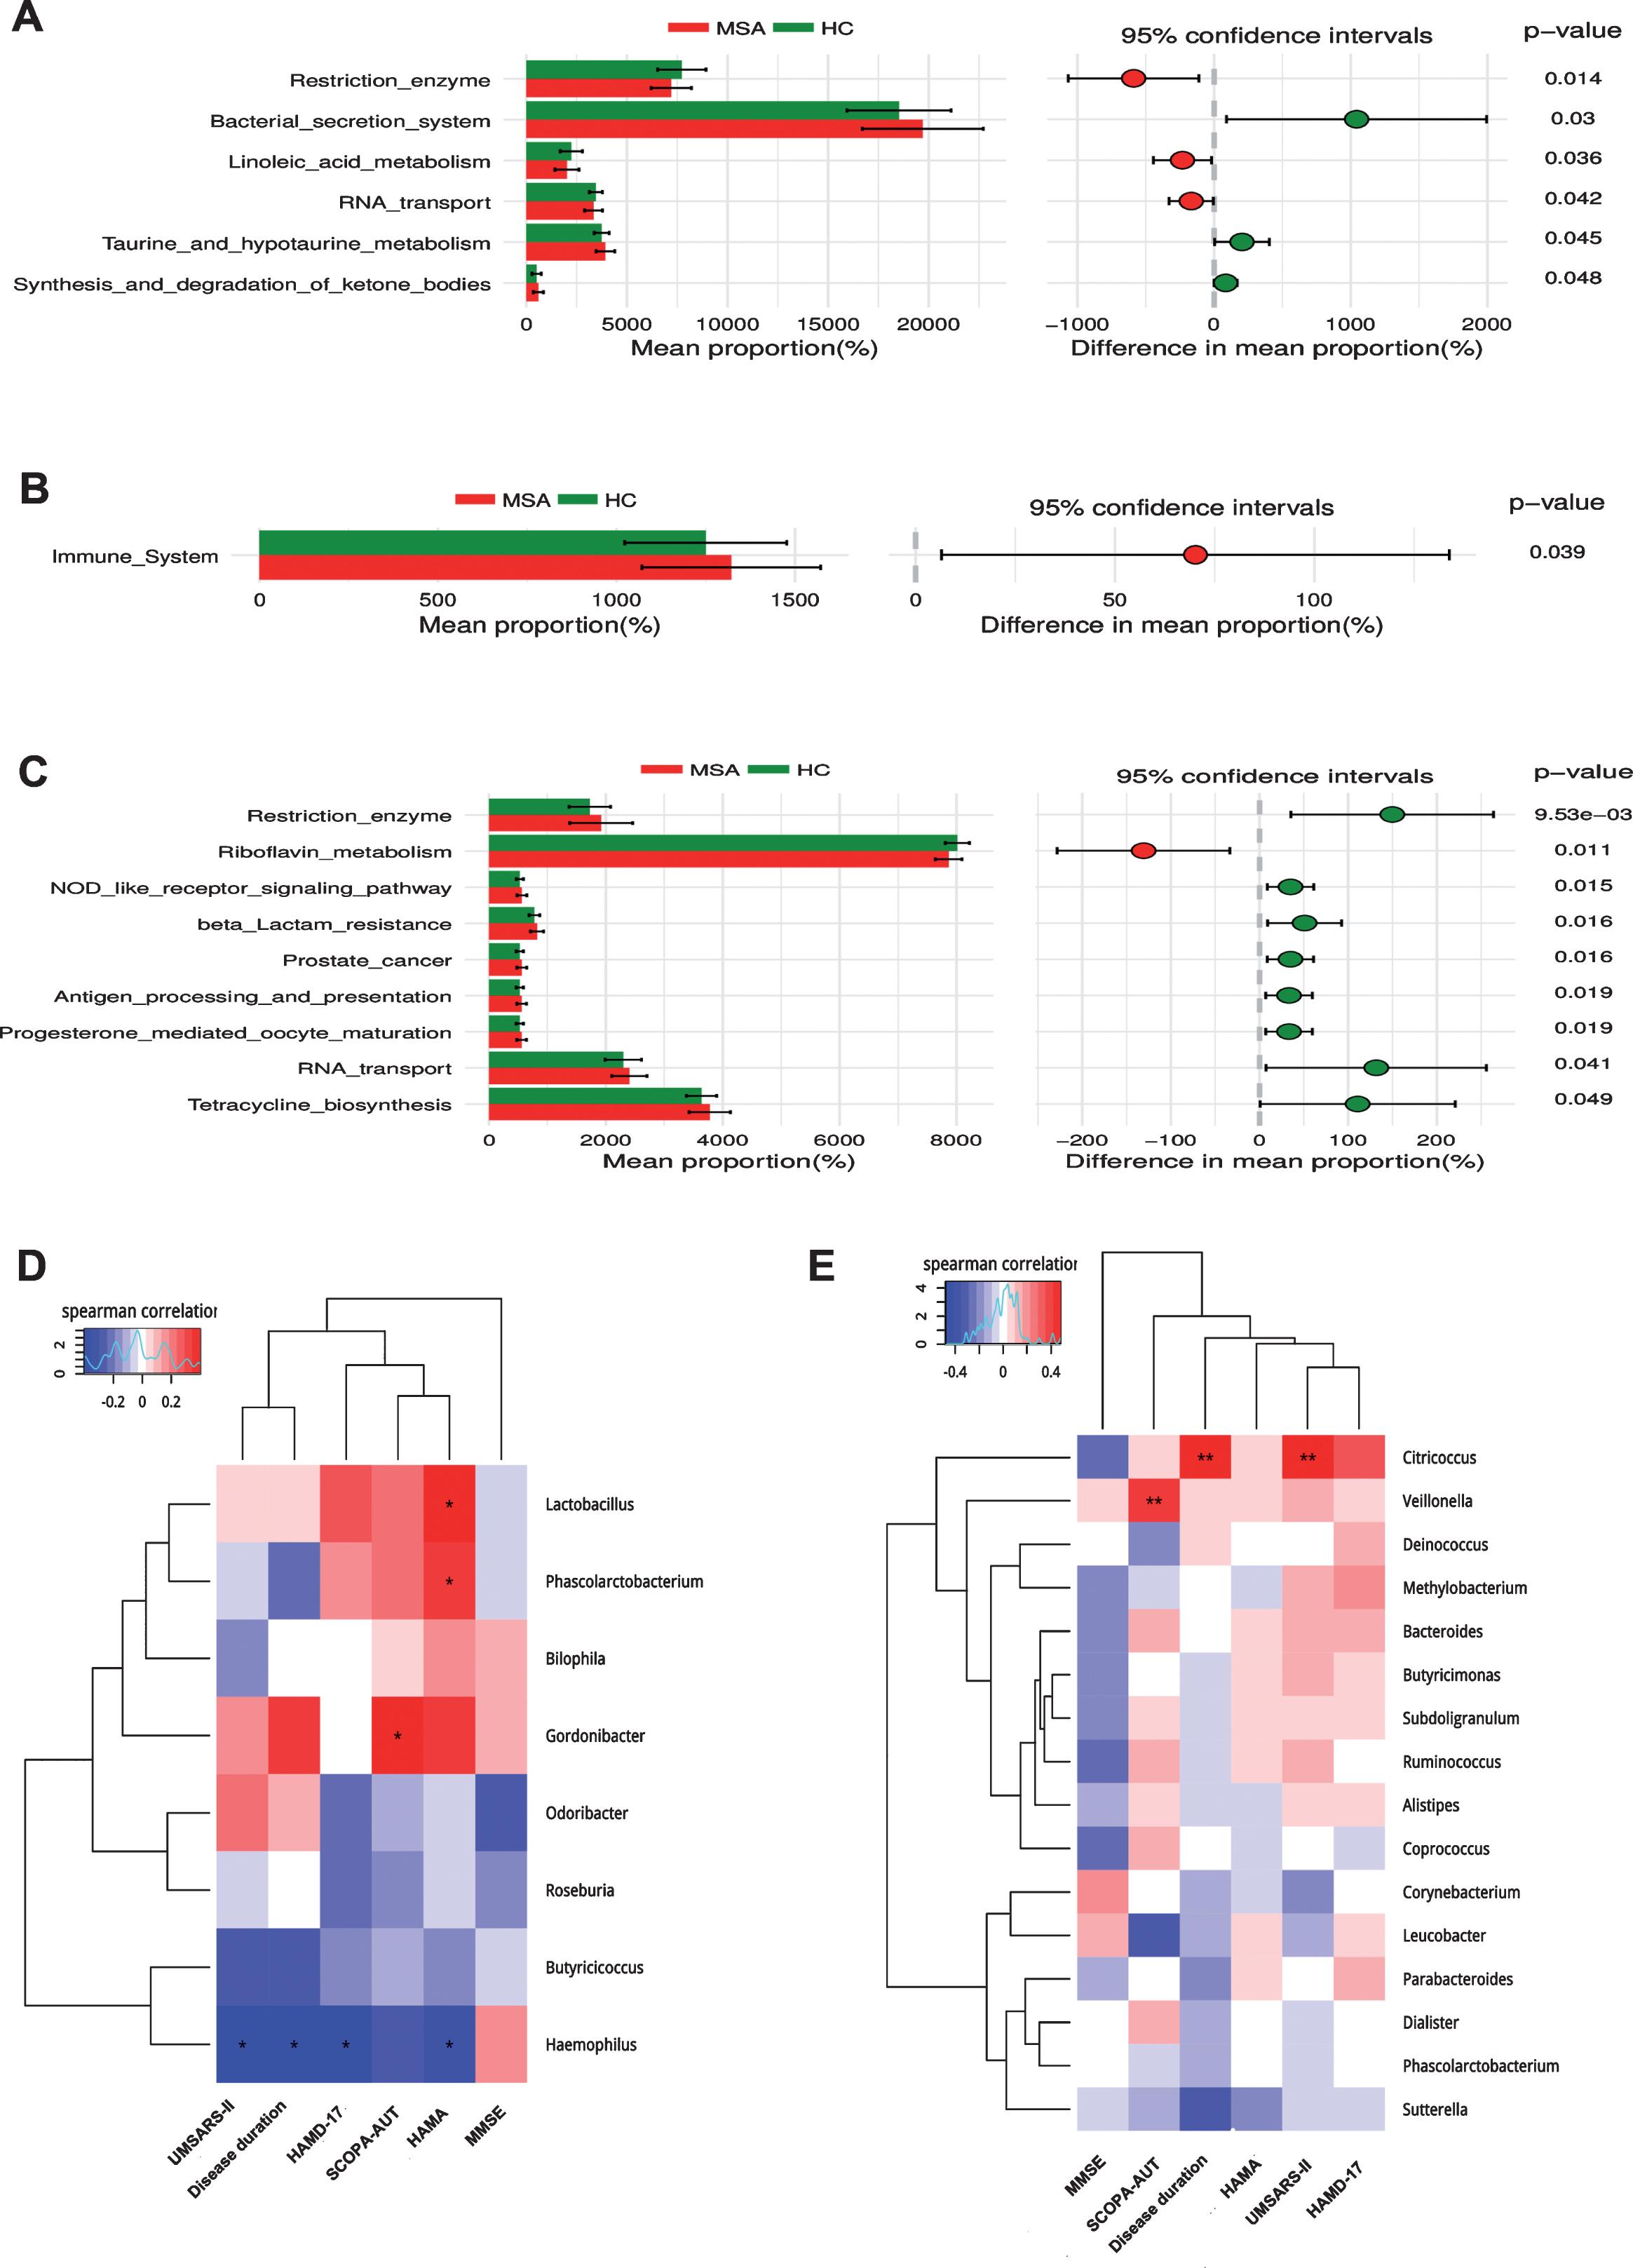
Significant different pathways were identified both in the level 2 and 3 KEGG pathways in blood microbiota. The level 2 KEGG pathway related to immune system was increased in the blood of MSA patients (p < 0.05) (Fig. 4B). The level 3 KEGG pathways related to RNA transport, prostate cancer, beta lactam resistance, tetracycline biosynthesis, progesterone mediated oocyte maturation, antigen processing and presentation, NOD like receptor signaling pathway, and restriction enzyme were higher in MSA patients, whereas riboflavin metabolism was lower in MSA patients compared with HCs (p < 0.05) (Fig. 4C). However, no significantly different KEGG pathways were detected either in feces or blood at an FDR of 5%.
Associations between clinical features and microbiota in feces and blood
The associations between altered gut microbes (genus level) and clinical features are listed in Fig. 4D. Gut microbes were weakly associated with clinical symptoms. Haemophilus was negatively correlated with disease duration (r = –0.399, p = 0.010), USMARS-II scores (r = –0.395, p = 0.012), HAMD-17 scores (r = –0.387, p = 0.014), and HAMA scores (r = –0.346, p = 0.028). HAMA scores were also positively associated with Lactobacillus (r = 0.386, p = 0.013) and Phascolarctobacterium (r = 0.333, p = 0.035). In addition, SCOPA-AUT scores were positively related with Gordonibacter (r = 0.195, p = 0.011). GLM method was used to adjust the potential confounders (age, gender, BMI, LEDD, disease duration) (Supplementary Table 6). Haemophilus was negatively correlated with disease duration (p < 0.001), HAMA scores were only associated with Phascolarctobacterium (p = 0.002), SCOPA-AUT scores were still positively related with Gordonibacter (p < 0.001).
As for the associations of clinical parameters with blood microbiota (Fig. 4E), we also observed significant positive correlations between Citricoccus and clinical features including disease duration (r = 0.418, p = 0.007) and UMSARS-II scores (r = 0.480, p = 0.001). SCOPA-AUT scores were also positively associated with Veillonella (r = 0.408, p = 0.008). After adjusting for confounders by GLM (Supplementary Table 7), Citricoccus was only related with disease duration (p < 0.001), and Veillonella was related with SCOPA-AUT scores (p = 0.030).
DISCUSSION
Our study confirmed the alterations of microbiome in patients with MSA and its relationships with clinical features. This is the first report on the intestinal microflora changes in the Chinese MSA population. We also first reported the alterations of the microbiota in the blood and microbial dysbiosis between different MSA subtypes in the world. The predictive model of differential bacterial taxa for MSA in the combination of fecal and blood 16s rRNA genes was first proposed as well. Furthermore, the recruitment of healthy spouses as controls is an important advantage that greatly reduced the impact of different environments and diets on the results. Each couple included in our study have lived together in a family for at least 20 years, so that they share more common microbiota than individuals from different households [24].
Previous studies addressing differences in gut microbiota between MSA patients and HCs were not consistent with our results [17, 18, 25]. A recent study from Malaysia found a reduction in Paraprecotella and an increase in Bacteroides at the taxonomic level of genus [17]. Another study from Chicago population found a decrease in the abundance of anti-inflammatory bacteria such as Ruminococcus, Roseburia, Coprococcus, and Faecalibacterium. It was suggested that race, geographical location, dietary habits, climatic conditions, host genetics, age, and sequencing technologies from different populations might influence the results [26]. As for the different alterations of microbiome between different MSA subtypes, the abundances of Phascolarctobacterium and Ruminococcus in MSA-P group were lower than that in MSA-C group. A recent study indicated decreased Ruminococcus in fecal samples of PD subjects which was consistent with our results in MSA-P group [27]. Particularly, those gut microbial differences between MSA and HCs, including those differences between MSA-P and MSA-C were consistently confirmed in the same fecal samples using real-time PCR.
In our study, MSA differed from HCs both in the fecal and blood microbes, however, the results in the feces and blood showed totally different patterns. It was consistent with our previous findings that the blood and fecal microbial changes in PD were different [23, 28], indicating that blood bacteria may not be derived from the intestine through bacterial translocation directly, which has been proposed in the previous studies [29, 30]. As for the source of the microflora in the blood, Koren suggested that blood bacteria might be translocated from oral cavity in patients with atherosclerosis [31]. The oral and nasal microbiota changes in PD patients were also reported previously [32], however, the blood microbiota in this study was not detected. Thus, the microbial investigations should not be limited to the intestines, but should be checked in the blood and oral cavity as well in the future. Although the team has not yet been able to fully eliminate the contamination with the help of microbiologists in the operational steps, the discovery in blood will provide more evidence for our understanding of the relationship between microbiota and MSA.
The content of microbial 16s rRNA gene in the blood is much lower than that in the intestinal flora, so the value of blood predictive model for MSA alone was not enough. Thus, we proposed a combined diagnostic model with fecal and blood taxa, a higher AUC was achieved to predict MSA and to differentiate MSA subtypes, which can provide us a new method for the diagnosis of MSA.
The functional predictions inferred significantly different abundances of KEGG pathways both in blood and fecal samples, especially pathways involved in biosynthetic metabolism. Our study also demonstrated the increased abundance of bacterial secretion system pathway in patients with MSA, which was consistent with the functional analysis in PD patients [15]. The activation of bacterial secretion system can promote the formation of bacterial products including inflammatory proteins [33]. However, the PICRUSt through 16s rRNA gene sequencing has its limitations compared with metagenomic analyses, as the functional alterations of the microbes cannot be predicted comprehensively by 16s rRNA gene sequencing. Further study using metagenomic sequencing to study the functional alterations of microbes in MSA patients is necessary.
As for the influence of gut microbiota on clinical symptoms, no analysis in patients with MSA has been performed so far. The increase of Lactobacillus and Phascolarctobacterium in the feces were weakly associated with anxiety in our results. The relationship between gut microflora and emotional disorders such as anxiety and depression was also reported before [34, 35]. The gram-positive bacteria such as Lactobacillus can metabolize glutamate to produce gamma-aminobutyric acid (GABA), which is the major inhibitory neurotransmitter in the brain. Disorders in the GABA pathway may cause anxiety, depression, and cognitive impairment [36]. In addition, it has also been reported that the increased abundance of Lactobacillus was associated with the decreased level of the gut hormone ghrelin [37], which was seen in patients with PD [38]. In the analysis of MSA blood samples, Citricoccus was found to be related with disease duration, and Veillonella was related with autonomic dysfunction. No previous study has directly indicated an association between autonomic dysfunction and microbiota.
There are several limitations in our study. First, this study is a cross-sectional study. First of all, the results can not indicate the causal relationship between microbiota and MSA, further study might focus on whether altered microbiota could induce MSA. Secondly, there are many factors that could affect the gut microbiota. Although we chose the spouses as controls to minimize the differences in the dietary habit and living environment, and controlled many potential confounders such as age, gender, BMI, constipation, disease severity, depression and anxiety, the confounding factors could not be completely eliminated. In addition, the microflora of different geographical environments and ethnic groups were different at certain degree, which limits the generalizability of this conclusion. Furthermore, the analysis between MSA and HC is not enough to be accepted as a biomarker, further study should focus on the effect of intestinal microflora on PD and other Parkinson-plus syndrome.
Conclusions
Overall, we confirmed that the gut and blood microbial alterations existed in Chinese patients with MSA. Additionally, the fecal and blood microbiota was related to clinical features such as disease duration, anxiety, and autonomic dysfunction. KEGG pathways involved in biosynthetic metabolism and bacterial secretion systems were significantly different between the MSA and HC groups. Elucidating these differences in microbiomes will be helpful to improve our knowledge of the microbiota in the pathogenesis of MSA.
CONFLICT OF INTEREST
The authors have no conflict of interest to report.
ACKNOWLEDGMENTS
The authors thank the patients and their families for their participation in the project. This work was supported by grants from the National Natural Science Foundation of China (No. 81430022, 81771374, 81371407, 81801267) and Brain Disease Clinical Research Center of Shanghai Jiao Tong University School of Medicine (No.2017NKX001).
SUPPLEMENTARY MATERIAL
[1] The supplementary material is available in the electronic version of this article: http://dx.doi.org/10.3233/JPD-191612.
REFERENCES
[1] | Gilman S , Wenning GK , Low PA , Brooks DJ , Mathias CJ , Trojanowski JQ , Wood NW , Colosimo C , Durr A , Fowler CJ , Kaufmann H , Klockgether T , Lees A , Poewe W , Quinn N , Revesz T , Robertson D , Sandroni P , Seppi K , Vidailhet M ((2008) ) Second consensus statement on the diagnosis of multiple system atrophy. Neurology 71: , 670–676. |
[2] | Mathias CJ ((2006) ) Multiple system atrophy and autonomic failure. J Neural Transm Suppl, 343–347. |
[3] | Colosimo C , Morgante L , Antonini A , Barone P , Avarello TP , Bottacchi E , Cannas A , Ceravolo MG , Ceravolo R , Cicarelli G , Gaglio RM , Giglia L , Iemolo F , Manfredi M , Meco G , Nicoletti A , Pederzoli M , Petrone A , Pisani A , Pontieri FE , Quatrale R , Ramat S , Scala R , Volpe G , Zappulla S , Bentivoglio AR , Stocchi F , Trianni G , Del Dotto P , Simoni L , Marconi R ((2010) ) Non-motor symptoms in atypical and secondary parkinsonism: The PRIAMO study. J Neurol 257: , 5–14. |
[4] | Tanaka Y , Kato T , Nishida H , Yamada M , Koumura A , Sakurai T , Hayashi Y , Kimura A , Hozumi I , Araki H , Murase M , Nagaki M , Moriwaki H , Inuzuka T ((2012) ) Is there delayed gastric emptying in patients with multiple system atrophy? An analysis using the (13)C-acetate breath test. J Neurol 259: , 1448–1452. |
[5] | Thomaides T , Karapanayiotides T , Zoukos Y , Haeropoulos C , Kerezoudi E , Demacopoulos N , Floodas G , Papageorgiou E , Armakola F , Thomopoulos Y , Zaloni I ((2005) ) Gastric emptying after semi-solid food in multiple system atrophy and Parkinson disease. J Neurol 252: , 1055–1059. |
[6] | Sakakibara R , Odaka T , Uchiyama T , Liu R , Asahina M , Yamaguchi K , Yamaguchi T , Yamanishi T , Hattori T ((2004) ) Colonic transit time, sphincter EMG, and rectoanal videomanometry in multiple system atrophy. Mov Disord 19: , 924–929. |
[7] | Winge K , Jennum P , Lokkegaard A , Werdelin L ((2010) ) Anal sphincter EMG in the diagnosis of parkinsonian syndromes. Acta Neurol Scand 121: , 198–203. |
[8] | Ahmed Z , Asi YT , Sailer A , Lees AJ , Houlden H , Revesz T , Holton JL ((2012) ) The neuropathology, pathophysiology and genetics of multiple system atrophy. Neuropathol Appl Neurobiol 38: , 4–24. |
[9] | Sastry N , Zheng W , Liu G , Wang H , Chen X , Cai M , Contractor P , Sgobio C , Sun L , Xie C , Cai H ((2015) ) No apparent transmission of transgenic α–synuclein into nigrostriatal dopaminergic neurons in multiple mouse models. Transl Neurodegener 4: , 23. |
[10] | Pouclet H , Lebouvier T , Coron E , Rouaud T , Flamant M , Toulgoat F , Roy M , Vavasseur F , Bruley des Varannes S , Neunlist M , Derkinderen P ((2012) ) Analysis of colonic alpha-synuclein pathology in multiple system atrophy. Parkinsonism Relat Disord 18: , 893–895. |
[11] | Wang Y , Kasper LH ((2014) ) The role of microbiome in central nervous system disorders. Brain Behav Immun 38: , 1–12. |
[12] | Pistollato F , Sumalla Cano S , Elio I , Masias Vergara M , Giampieri F , Battino M ((2016) ) Role of gut microbiota and nutrients in amyloid formation and pathogenesis of Alzheimer disease. Nutr Rev 74: , 624–634. |
[13] | Scheperjans F , Aho V , Pereira PA , Koskinen K , Paulin L , Pekkonen E , Haapaniemi E , Kaakkola S , Eerola-Rautio J , Pohja M , Kinnunen E , Murros K , Auvinen P ((2015) ) Gut microbiota are related to Parkinson’s disease and clinical phenotype. Mov Disord 30: , 350–358. |
[14] | Petrov VA , Saltykova IV , Zhukova IA , Alifirova VM , Zhukova NG , Dorofeeva YB , Tyakht AV , Kovarsky BA , Alekseev DG , Kostryukova ES , Mironova YS , Izhboldina OP , Nikitina MA , Perevozchikova TV , Fait EA , Babenko VV , Vakhitova MT , Govorun VM , Sazonov AE ((2017) ) Analysis of Gut Microbiota in Patients with Parkinson’s Disease. Bull Exp Biol Med 162: , 734–737. |
[15] | Keshavarzian A , Green SJ , Engen PA , Voigt RM , Naqib A , Forsyth CB , Mutlu E , Shannon KM ((2015) ) Colonic bacterial composition in Parkinson’s disease. Mov Disord 30: , 1351–1360. |
[16] | Unger MM , Spiegel J , Dillmann KU , Grundmann D , Philippeit H , Burmann J , Fassbender K , Schwiertz A , Schafer KH ((2016) ) Short chain fatty acids and gut microbiota differ between patients with Parkinson’s disease and age-matched controls. Parkinsonism Relat Disord 32: , 66–72. |
[17] | Tan AH , Chong CW , Song SL , Teh CSJ , Yap IKS , Loke MF , Tan YQ , Yong HS , Mahadeva S , Lang AE , Lim SY ((2018) ) Altered gut microbiome and metabolome in patients with multiple system atrophy. Mov Disord 33: , 174–176. |
[18] | Engen PA , Dodiya HB , Naqib A , Forsyth CB , Green SJ , Voigt RM , Kordower JH , Mutlu EA , Shannon KM , Keshavarzian A ((2017) ) The potential role of gut-derived inflammation in multiple system atrophy. J Parkinsons Dis 7: , 331–346. |
[19] | Potgieter M , Bester J , Kell DB , Pretorius E ((2015) ) The dormant blood microbiome in chronic, inflammatory diseases. FEMS Microbiol Rev 39: , 567–591. |
[20] | Lelouvier B , Servant F , Païssé S , Brunet AC , Benyahya S , Serino M , Valle C , Ortiz MR , Puig J , Courtney M ((2016) ) Changes in blood microbiota profiles associated with liver fibrosis in obese patients: A pilot analysis. Hepatology 64: , 2015. |
[21] | Amar J , Lange C , Payros G , Garret C , Chabo C , Lantieri O , Courtney M , Marre M , Charles MA , Balkau B ((2013) ) Blood microbiota dysbiosis is associated with the onset of cardiovascular events in a large general population: The D.E.S.I.R. Study. Plos One 8: , e54461. |
[22] | Amar J , Serino M , Lange C , Chabo C , Iacovoni J , Mondot S , Lepage P , Klopp C , Mariette J , Bouchez O ((2011) ) Involvement of tissue bacteria in the onset of diabetes in humans: Evidence for a concept. Diabetologia 54: , 3055–3061. |
[23] | Qian Y , Yang X , Xu S , Wu C , Qin N , Chen S-D , Xiao Q ((2018) ) Detection of microbial 16S rRNA gene in the blood of patients with Parkinson’s disease. Front Aging Neurosci 10: , 156. |
[24] | Song SJ , Lauber C , Costello EK , Lozupone CA , Humphrey G , Berg-Lyons D , Caporaso JG , Knights D , Clemente JC , Nakielny S , Gordon JI , Fierer N , Knight R ((2013) ) Cohabiting family members share microbiota with one another and with their dogs. Elife 2: , e00458. |
[25] | Barichella M , Severgnini M , Cilia R , Cassani E , Bolliri C , Caronni S , Ferri V , Cancello R , Ceccarani C , Faierman S , Pinelli G , De Bellis G , Zecca L , Cereda E , Consolandi C , Pezzoli G ((2019) ) Unraveling gut microbiota in Parkinson’s disease and atypical parkinsonism. Mov Disord 34: , 396–405. |
[26] | Escobar JS , Klotz B , Valdes BE , Agudelo GM ((2014) ) The gut microbiota of Colombians differs from that of Americans, Europeans and Asians. BMC Microbiol 14: , 311. |
[27] | Li W , Wu X , Hu X , Wang T , Liang S , Duan Y , Jin F , Qin B ((2017) ) Structural changes of gut microbiota in Parkinson’s disease and its correlation with clinical features. Sci China Life Sci 60: , 1223–1233. |
[28] | Qian Y , Yang X , Xu S , Wu C , Song Y , Qin N , Chen SD , Xiao Q ((2018) ) Alteration of the fecal microbiota in Chinese patients with Parkinson’s disease. Brain Behav Immun 70: , 194–202. |
[29] | Bellot P , García-Pagán JC , Francés R , Abraldes JG , Navasa M , Pérez-Mateo M , Such J , Bosch J ((2010) ) Bacterial DNA translocation is associated with systemic circulatory abnormalities and intrahepatic endothelial dysfunction in patients with cirrhosis. Hepatology 52: , 2044–2052. |
[30] | Severance EG , Gressitt KL , Stallings CR , Origoni AE , Khushalani S , Leweke FM , Dickerson FB , Yolken RH ((2013) ) Discordant patterns of bacterial translocation markers and implications for innate immune imbalances in schizophrenia. Schizophr Res 148: , 130–137. |
[31] | Koren O , Spor A , Felin J , Fåk F , Stombaugh J , Tremaroli V , Behre CJ , Knight R , Fagerberg B , Ley RE , Bäckhed F ((2011) ) Human oral, gut, and plaque microbiota in patients with atherosclerosis. Proc Natl Acad Sci U S A 108: , 4592–4598. |
[32] | Heintz-Buschart A , Pandey U , Wicke T , Sixel-Döring F , Janzen A , Sittig-Wiegand E , Trenkwalder C , Oertel WH , Mollenhauer B , Wilmes P ((2017) ) The nasal and gut microbiome in Parkinson’s disease and idiopathic rapid eye movement sleep behavior disorder. Mov Disord 33: , 88. |
[33] | Galan JE , Collmer A ((1999) ) Type III secretion machines: Bacterial devices for protein delivery into host cells. Science 284: , 1322–1328. |
[34] | Lach G , Schellekens H , Dinan TG , Cryan JF ((2018) ) Anxiety, Depression, and the Microbiome: A Role for Gut Peptides. Neurotherapeutics 15: , 36–59. |
[35] | Rao AV , Bested AC , Beaulne TM , Katzman MA , Iorio C , Berardi JM , Logan AC ((2009) ) A randomized, double-blind, placebo-controlled pilot study of a probiotic in emotional symptoms of chronic fatigue syndrome. Gut Pathogens 1: , 6. |
[36] | Bhattacharjee S , Lukiw WJ ((2013) ) Alzheimer’s disease and the microbiome. Front Cell Neurosci 7: , 153. |
[37] | Queipo-Ortuno MI , Seoane LM , Murri M , Pardo M , Gomez-Zumaquero JM , Cardona F , Casanueva F , Tinahones FJ ((2013) ) Gut microbiota composition in male rat models under different nutritional status and physical activity and its association with serum leptin and ghrelin levels. PLoS One 8: , e65465. |
[38] | Unger MM , Moller JC , Mankel K , Eggert KM , Bohne K , Bodden M , Stiasny-Kolster K , Kann PH , Mayer G , Tebbe JJ , Oertel WH ((2011) ) Postprandial ghrelin response is reduced in patients with Parkinson’s disease and idiopathic REM sleep behaviour disorder: A peripheral biomarker for early Parkinson’s disease? J Neurol 258: , 982–990. |


