
Olfactory Impairment in Parkinson’s Disease Studied with Diffusion Tensor and Magnetization Transfer Imaging
Abstract
Background: Olfactory impairment is an early manifestation of Parkinson’s disease (PD). Diffusion Tensor Imaging (DTI) and Magnetization Transfer (MT) are two imaging techniques that allow noninvasive detection of microstructural changes in the cerebral white matter.
Objective: To assess white matter alterations associated with olfactory impairment in PD, using a binary imaging approach with DTI and MT.
Methods: 22 PD patients and 13 healthy controls were examined with DTI, MT and an odor discrimination test. DTI data were first analyzed with tract-based spatial statistics (TBSS) in order to detect differences in fractional anisotropy, mean, radial and axial diffusivity between PD patients and controls. Voxelwise randomized permutation was employed for the MT analysis, after spatial and intensity normalization. Additionally, ROI analysis was performed on both the DTI and MT data, focused on the white matter adjacent to olfactory brain regions.
Results: Whole brain voxelwise analysis revealed decreased axial diffusivity in the left uncinate fasciculus and the white matter adjacent to the left olfactory sulcus of PD patients. ROI analysis demonstrated decreased axial diffusivity in the right orbitofrontal cortex, as well as decreased mean diffusivity and axial diffusivity in the white matter of the left entorhinal cortex of PD patients. There were no significant differences regarding fractional anisotropy, radial diffusivity or MT between patients and controls.
Conclusions: ROI analysis of DTI could detect microstructural changes in the white matter adjacent to olfactory areas in PD patients, whereas MT imaging could not.
INTRODUCTION
Olfactory loss is one of the most common non-motor symptoms in Parkinson’s disease (PD), occurring often in early stages, before the onset of motor symptoms [1–3]. Olfactory impairment is independent of age of onset, treatment, duration and severity of the disease [1, 4, 5]. Recent studies indicate that olfactory dysfunction is associated with cognitive decline and faster disease progression [6–9]. Although olfactory impairment is also evident in other neurodegenerative disorders, such as Alzheimer’s disease, and therefore not a unique distinguishing feature for PD, olfactory testing is a recommended diagnostic tool for PD by the European Federation of Neurological Societies and the Movement Disorders Society [10, 11].
Neural responses to olfactory stimuli are transmitted from the nasal epithelium to the olfactory bulb and, thereafter, to the olfactory cortex and its main projections in the brain [12, 13]. The olfactory cortex includes the anterior olfactory nucleus, the olfactory tubercle, the piriform cortex, the amygdala and the entorhinal cortex, all of which receive direct, monosynaptic input from olfactory bulb output neurons. The piriform cortex is the largest recipient of bulbar projections and can be divided, both anatomically and functionally, into anterior and posterior piriform cortex. Odorant identity is encoded in the anterior piriform cortex, while odor quality is encoded in the posterior piriform cortex [14]. The entorhinal cortex serves as the gateway of the hippocampal formation and its malfunction is associated with effects on odor discrimination memory [15, 16]. The orbitofrontal cortex is one of the main olfactory projections beyond the olfactory cortex. Its role in olfaction has not yet been well defined; it has been associated with odor discrimination and identification as well as olfactory attentional modulation [17–19], however it does not mediate olfactory discrimination once learning the discrimination task is established [20, 21]. Post-mortem studies in PD patients have revealed the presence of Lewy bodies in the olfactory bulb, the entorhinal cortex and the piriform cortex [22, 23].
Noninvasive imaging techniques can characterize tissue properties and reveal changes in the brain induced by disease. Diffusion tensor imaging (DTI) is a magnetic resonance imaging (MRI) technique that allows the characterization of white matter and is highly sensitive to microstructural tissue changes [24, 25]. DTI provides quantitative information about the degree and the direction of water diffusion in the brain. Commonly used DTI measures include fractional anisotropy, axial diffusivity, radial diffusivity and mean diffusivity. Fractional anisotropy is a summary measure of microstructural integrity, without being able to characterize the kind of structural changes [26]. Axial and radial diffusivity represent microstructural directions in parallel and perpendicularly to the white matter tracts [24]. Elevated radial diffusivity may indicate demyelination, according to studies in animal models [27], whereas decreased axial diffusivity reflects axonal injury [28]. Mean diffusivity derives from averaging radial and axial diffusivity; it is sensitive to the effects of tissue cellularity, edema and necrosis, and it decreases with age due to the maturation of white matter [24, 26, 29].
Magnetization Transfer (MT) is another magnetic resonance imaging technique that can detect myelin abnormalities. MT is based on the exchange of energy between highly bound protons within structures (e.g. myelin) and the mobile protons of free water [24]. The most common measure for characterizing the MT effect is the MT ratio. MT is sensitive to macromolecular content, whereas DTI reflects the structural integrity of white matter.
Few studies have investigated the ability of DTI to detect structural changes in the white matter adjacent to the olfactory cortex and its main projections in PD patients. These previous studies have mainly focused on fractional anisotropy and, to some parts, on mean diffusivity [30–34]. The analytical approach of these studies varies significantly: some have performed both whole brain, voxelwise comparisons and region of interest (ROI) analysis of the olfactory cortex, others have focused only on fiber tractography of the olfactory tract or ROI analysis of the olfactory bulb and the substantia nigra. As for MT, several studies have shown a decreased MT ratio in the basal ganglia in PD, but to our knowledge there is no study investigating if MT can detect abnormalities in olfactory brain areas [35–38]. In the present study, we employed DTI, including all four DTI scalars, and MT in order to assess changes both in integrity and content of the white matter adjacent to the olfactory cortex and the orbitofrontal cortex. In order to assure reproducibility, we employed two analytical approaches: a) standardized whole brain, voxelwise comparisons, and b) ROI analysis of olfactory areas.
MATERIALS AND METHODS
Participants
PD patients were recruited randomly from the register of the Department of Neurology at the University Hospital of Linköping, Sweden. Age-matched healthy controls were recruited among patients’ spouses or friends. Patients were diagnosed in accordance with the United Kingdom Parkinson’s Disease Society Brain Bank Clinical Diagnostic Criteria [39]. Prior to inclusion in the study, all PD patients underwent the following clinical evaluation: Mini-Mental State Examination (MMSE), Unified Parkinson’s Disease Rating Scale (UPDRS), Hoehn and Yahr Staging (H&Y) and Schwab and England activities of daily living scale (S&E). Healthy controls were clinically evaluated only with the MMSE. Inclusion criteria included age less than 79 years and MMSE score above 25. Subjects with history of severe head injury, intracranial surgery, surgery in the nasal cavity, seasonal allergies, sinusitis or other current respiratory infection, as well as current smoking were excluded from the study. Patients were assessed and scanned whilst medicated with L-DOPA and/or dopamine agonists. Written informed consent was obtained from all participants. This study was conducted in accordance with the 1964 Helsinki declaration and its later amendments and was approved by the Regional Ethical Review Board in Linköping, Sweden (registration number 2011/415-31).
Olfactory evaluation
Prior to the MRI examination, all participants underwent an evaluation of their olfactory performance with the “Sniffin’ Sticks” discrimination test (Burghart Messtechnik GmbH, Wedel, Germany). Each participant was presented with three odorants, two of which were identical, while the third one was different. The task was to identify the divergent odorant. The test consisted of sixteen triplets of odorants, contained in felt-tip pens (maximal possible score was, therefore, 16). Each pen was presented only once, for approximately 3 seconds, with a time interval of at least 30 seconds between triplets.
MRI data acquisition
All MR images were acquired on a 3T Philips Ingenia MR scanner (Philips Healthcare, Eindhoven, the Netherlands), using a 32-channel head coil. T1-weighted images were acquired and reviewed by a radiologist to ensure that no subject had any morphological abnormalities. Diffusion imaging was performed in the transverse plane with a single-shot, gradient-echo echo planar imaging sequence and a b-value of 800 s/mm2 in 32 encoding directions [Field of view (FOV) 224×224 mm, 2 mm slice thickness (0 mm gap), acquisition matrix 112×110, reconstruction matrix 128×128, 60 slices, repetition time (TR) = 8494 ms, echo time (TE) = 100 ms, flip angle = 90°, voxel size: 2×2×2 mm]. Sensitivity encoding (SENSE) with a reduction factor of 2 and spectral pre-saturation with inversion recovery for fat suppression was used. The total scan time for the diffusion sequence was 10 minutes and 35 seconds.
MT imaging was performed using a method described by Helms et al. [40]. It consisted of three consecutive 3D gradient echo acquisitions with a FOV = 220×220 mm, 224×224 matrix, 28 slices of 4 mm slice thickness. The TE was 2.3 ms, TR was 21.7 ms and number of echoes (ETL) = 74. One acquisition was T1-weighted (flip angle 25°), one was proton density-weighted (PDW), flip angle 5°, and one intermediate, flip angle 15°, the latter containing the off-resonance MT saturation pulse (flip angle 620°, offset frequency 2 kHz). The total scan time was 6 minutes.
DTI processing
Two analytical approaches were employed for the DTI analysis. First, voxelwise, whole brain, statistical analysis of the diffusion data was performed using TBSS (Tract-Based Spatial Statistics), part of the FSL software, from the FMRIB software library (http://www.fmrib.ox.ac.uk/fsl) [41, 42]. Diffusion-weighted images were firstly corrected for the effects of eddy currents and head motion. Then, a brain mask was created for each subject, by using BET (Brain Extraction Toolbox). Fractional anisotropy, mean diffusivity, radial diffusivity and axial diffusivity images were created, by fitting a diffusion tensor model to the raw diffusion data. Thereafter, fractional anisotropy data were aligned into the Montreal Neurological Institute (MNI) common space (1 mm slice thickness) using nonlinear registration. Next, the mean fractional anisotropy image was created, from which the mean fractional anisotropy skeleton was generated. The aligned data from each subject were then projected onto this skeleton and the projected fractional anisotropy data were fed into voxelwise cross-subject statistics. TBSS was also employed for the mean diffusivity, radial diffusivity and axial diffusivity processing, by using the original fractional anisotropy nonlinear registration to the data and then projecting them to the mean fractional anisotropy skeleton. The voxelwise statistical analysis compared the fractional anisotropy, mean diffusivity, radial diffusivity and axial diffusivity between PD patients and healthy controls, with age, gender and olfactory score serving as covariates. Two contrasts were employed: controls vs. PD and PD vs. controls. Additionally, we performed a correlation analysis between each DTI scalar and the score of the olfactory evaluation, focusing only on PD patients in order to examine if lower olfactory score is associated with diffusivity changes. Analysis was performed with a cluster size significance level of p < 0.05, corrected with threshold-free cluster enhancement.
The second analytical approach included ROI analysis of fractional anisotropy, mean diffusivity, radial diffusivity and axial diffusivity between healthy controls and PD patients. ROI analysis was performed on the TBSS-normalized data, focusing on main olfactory brain regions. Analyzing the olfactory tract and the olfactory bulb demands a single-subject approach, with ROI extraction from the structural, non-normalized data of each subject, which may affect reproducibility; therefore these regions were not included in the analysis. Instead, olfactory brain areas with widely available image masks, normalized in the MNI common space, were employed. The following ROIs were used: (1) anterior piriform cortex, (2) posterior piriform cortex, (3) entorhinal cortex, and (4) orbitofrontal cortex (Fig. 1). The image masks of anterior piriform, posterior piriform and the orbitofrontal cortex were designed in accordance to Seubert et al. [43]. The image mask of the entorhinal cortex was extracted from the Jülich histological atlas, part of the FSL toolbox. In order to isolate the tracts of white matter adjacent to these regions, these ROIs were multiplied with the mean fractional anisotropy skeleton, using the FSLtoolbox.
Fig.1
Regions of interest (ROIs): ROI analysis for both the DTI and the MT data included the anterior piriform cortex, the posterior piriform cortex, the entorhinal cortex, and the orbitofrontal cortex. The original image masks of anterior piriform, posterior piriform and the orbitofrontal cortex were designed in accordance to Seubert et al. [43]. The original image mask of the entorhinal cortex was extracted from the Jülich histological atlas, part of FSL. In order to isolate the tracts of white matter adjacent to these regions, the original ROIs were multiplied with the mean fractional anisotropy (FA) skeleton, using the FSL toolbox, therefore producing skeletonized ROIs.
![Regions of interest (ROIs): ROI analysis for both the DTI and the MT data included the anterior piriform cortex, the posterior piriform cortex, the entorhinal cortex, and the orbitofrontal cortex. The original image masks of anterior piriform, posterior piriform and the orbitofrontal cortex were designed in accordance to Seubert et al. [43]. The original image mask of the entorhinal cortex was extracted from the Jülich histological atlas, part of FSL. In order to isolate the tracts of white matter adjacent to these regions, the original ROIs were multiplied with the mean fractional anisotropy (FA) skeleton, using the FSL toolbox, therefore producing skeletonized ROIs.](https://content.iospress.com:443/media/jpd/2017/7-2/jpd-7-2-jpd161060/jpd-7-jpd161060-g001.jpg)
MT processing
Using the 3D T1-weighted and proton density-weighted acquisitions an apparent T1 relaxation can be estimated for each voxel in the acquisition volume, as well as the expected signal intensity of the intermediate acquisition (flip angle 15°), without the MT saturation. The MT value is proportional to the signal difference of with/without MT saturation and of T1. Explicit expressions are provided by Helms et al. [40].
As with DTI, two analytical approaches were employed in the analysis of MT data: a) voxelwise, whole brain analysis, and b) ROI analysis. Each subject’s MT map was aligned into the MNI common space (2 mm slice thickness), by using the spatial normalization tool, implemented in SPM12. Further MT processing was performed using the FSL software. The normalized MT maps were merged in a 4D volume and the mean MT map was created. Thereinafter, intensity normalization was performed, by dividing each subject’s MT map with the intensity of the mean MT map. The MT ratios between PD patients and healthy controls were then compared using FSL’s randomize permutation tool (5000 permutations) and a cluster significance level of p < 0.05, corrected with threshold-free cluster enhancement. ROI analysis was performed, using the abovementioned brain areas, after aligning them into the MNI common space (2 mm slicethickness).
Statistics
Potential differences between groups regarding age, olfactory testing and ROI analysis were investigated with Mann-Whitney U test. Fisher’s exact test was employed to investigate potential differences in sex and MMSE score. Statistical analysis was performed using IBM® SPSS® Statistics v23. All plots were created in GraphPad® Prism 6. For the demographic and ROI analysis, significance was defined at p < 0.05. For the voxelwise whole brain analysis of DTI and MT, significance was defined at p < 0.05, corrected with threshold-free cluster enhancement. All results are presented in the form of median value with lower and upper 95% confidenceintervals (CI).
RESULTS
Participants
In total, 22 PD patients and 13 healthy controls were included in the study; their demographics are summarized in Table 1. Two PD patients were excluded from the MT analysis due to motion artifacts. There was no significant difference regarding gender, age or MMSE score between the twogroups.
Table 1
Demographics of PD patients and healthy controls (median value with 95% lower and upper CI)
| PD | Healthy controls | |
| Participants (number) | 22 | 13 |
| Age (years) | 68 (95% CI 67 and 70) | 68 (95% CI 65 and 70) |
| Sex (male/female) | 12/10 | 5/8 |
| Disease duration (years) | 7 (95% CI 5 and 9) | |
| MMSE | 29 (95% CI 29 and 30) | 29 (95% CI 29 and 30) |
| UPDRS part I | 2 (95% CI 1.5 and 3) | |
| UPDRS part II | 10 (95% CI 9 and 13) | |
| UPDRS part III | 20 (95% CI 16 and 27) | |
| UPDRS part IV | 2 (95% CI 1 and 3) | |
| UPDRS total score | 38 (95% CI 27.5 and 46.5) | |
| H&Y | 2 (95% CI 1 and 2.5) | |
| S&E | 80% (95% CI 80% and 90%) | |
| Olfactory testing score* | 8 out of 16 (95% CI 7 and 10) | 11 out of 16 (95% CI 10 and 11) |
PD, Parkinson’s disease; MMSE, Mini-Mental State Examination; UPDRS, Unified Parkinson’s disease rating scale; H&Y, Hoehn and Yahr staging; S&E, Schwab and England activities of daily living scale. *indicates significant difference between PD patients and healthy controls (p = 0.007).
Olfactory evaluation
The median value of the odor discrimination test was 8 out of 16 (95% CI 7 and 10) for the PD group and 11 out of 16 (95% CI 10 and 11) for the healthy controls. Mann-Whitney U test showed that PD patients had significantly lower olfactory score than healthy controls (p = 0.007).
DTI analysis
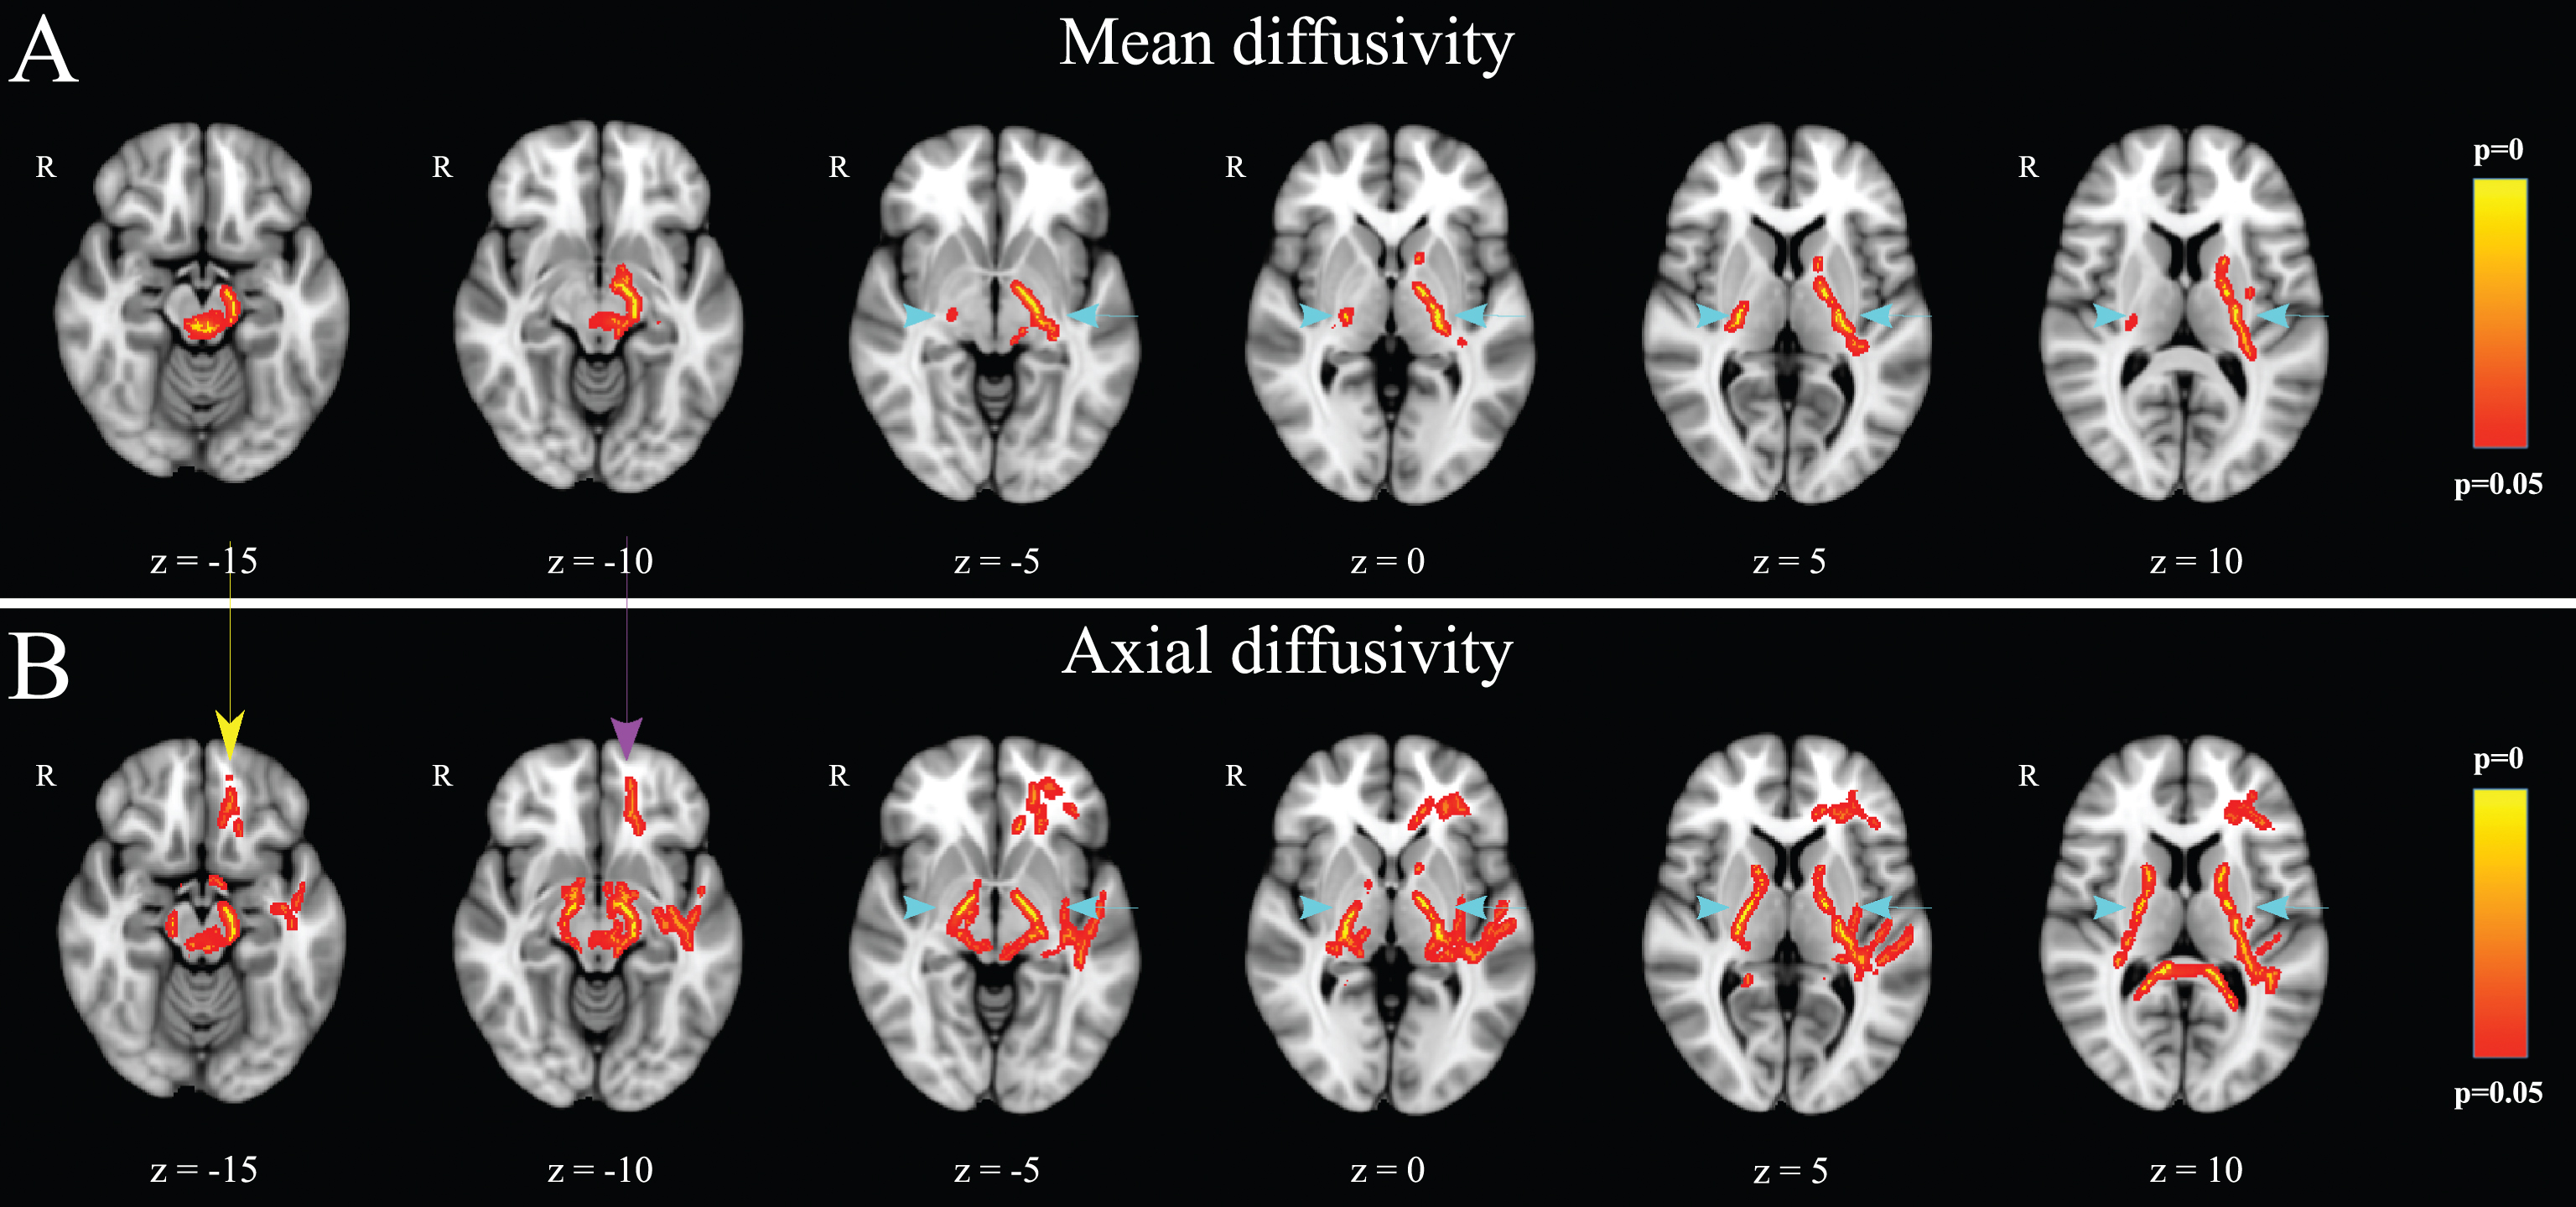
Voxelwise statistical comparison between healthy controls and PD patients showed significantly lower mean diffusivity (Fig. 2A) in the left corticospinal tract of PD patients, prominently in the posterior limb of the left internal capsule and the neural tracts adjacent to left substantia nigra. Similarly, the posterior part of the posterior limb of the right internal capsule had lower mean diffusivity in PD patients. Axial diffusivity was lower in the body and the splenium of corpus callosum, in both the anterior and the posterior limb of the internal capsule bilaterally (however more predominantly on the left side), the frontal component of the left uncinate fasciculus, as well as the white matter of left gyrus rectus (Fig. 2B) in PD patients. There were no significant differences between the two groups regarding fractional anisotropy and radialdiffusivity. There was no significant correlation between the olfactory evaluation score and any of the four DTI scalars within PD patients.
Fig.2
Voxelwise DTI analysis (PD patients compared to healthy controls): PD patients demonstrated lower mean (A) and axial (B) diffusivity in the left corticospinal tract and the posterior limb of the right internal capsule (light blue arrows). Additionally, PD patients showed lower axial diffusivity (B) in the body and the splenium of corpus callosum, in both the anterior and the posterior limb of the internal capsule bilaterally (light blue arrows), the frontal component of the left uncinate fasciculus (purple arrow), as well as the white matter adjacent to the left olfactory sulcus (yellow arrow). There were no significant differences between the two groups regarding fractional anisotropy and radial diffusivity (p < 0.05, corrected with threshold-free cluster enhancement).
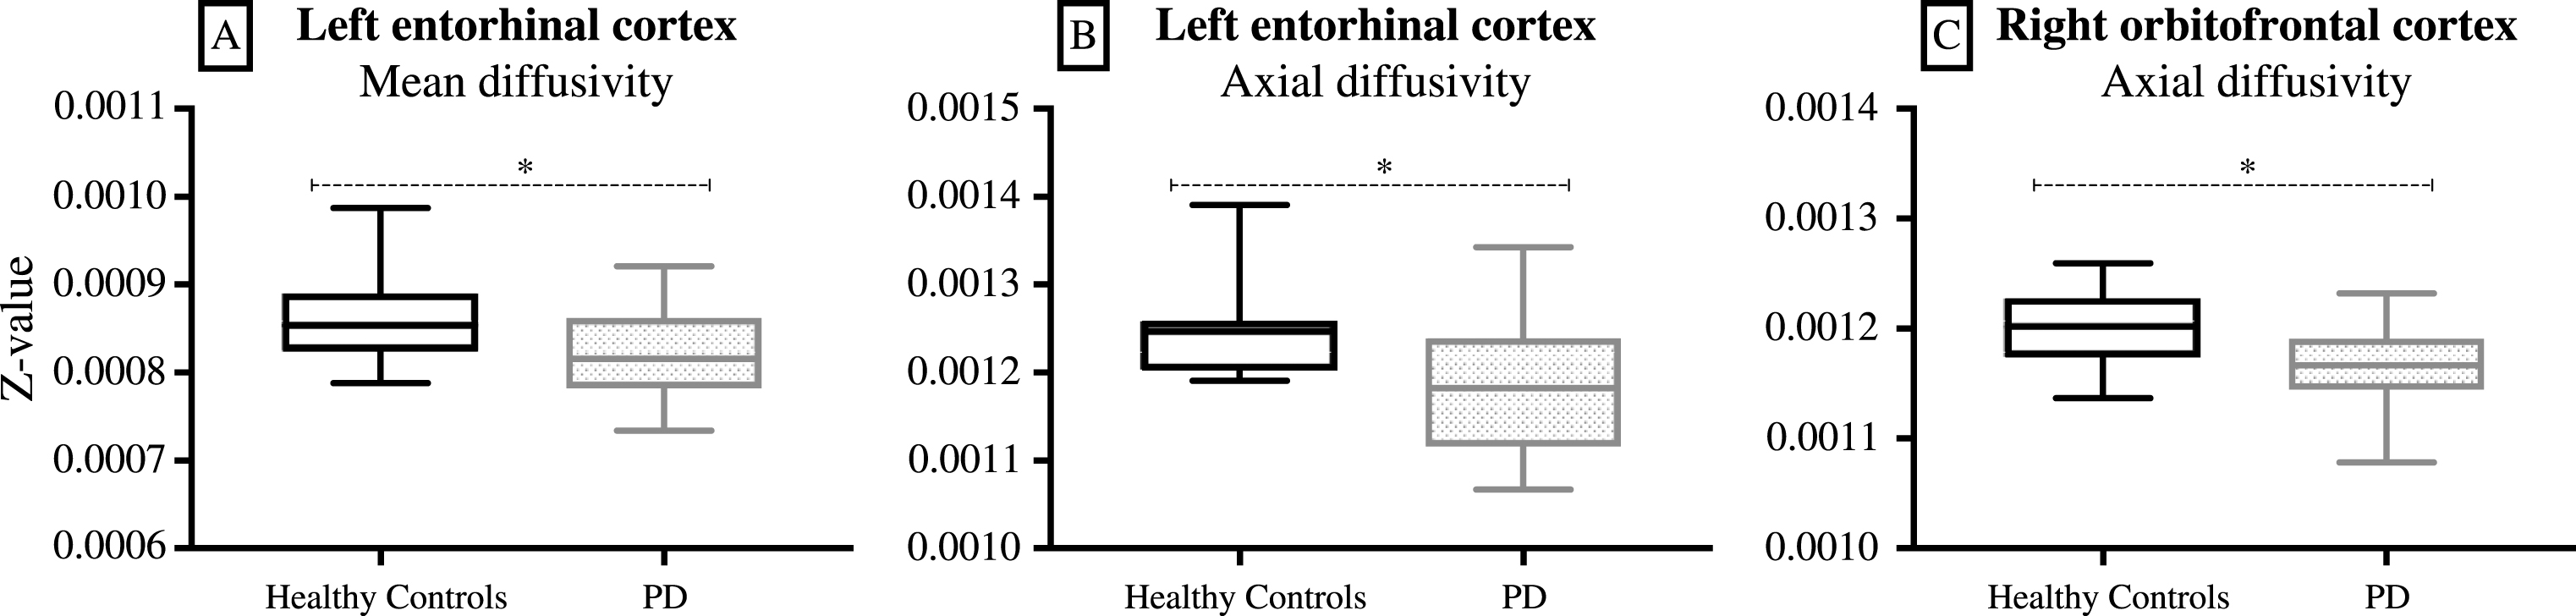
ROI analysis for all DTI scalars included four olfactory brain areas (i.e. the white matter adjacent to anterior and posterior piriform cortex, entorhinal cortex and orbitofrontal cortex). The white matter adjacent to the left entorhinal cortex had significantly lower mean diffusivity (p = 0.045) and axial diffusivity (p = 0.013) in PD patients (Fig. 3A and B). The white matter adjacent to the right orbitofrontal cortex had significantly lower axial diffusivity (p = 0.024) in PD patients (Fig. 3C). There were no significant differences in the white matter adjacent to the anterior or the posterior piriform cortex for any DTI scalar.
Fig.3
ROI analysis of DTI data: The white matter adjacent to the left entorhinal cortex had significantly lower mean diffusivity (A, p = 0.045) and axial diffusivity (B, p = 0.013) in PD patients. The white matter adjacent to the right orbitofrontal cortex had significantly lower axial diffusivity (C, p = 0.024) in PD patients (box-and-whisker diagram, where the whiskers represent the minimum and the maximum values). *p < 0.05.
MT analysis
No voxel survived the threshold of p < 0.05 (corrected with threshold-free cluster enhancement) during the voxelwise statistical comparison of the MT maps between PD patients and healthy controls. Similarly, the ROI analysis revealed no significant differences in the MT ratios between the two groups, for any of the abovementioned olfactory ROIs.
DISCUSSION
The present study investigated the ability of DTI and MT to detect microstructural changes in central olfactory areas of PD patients. To our knowledge, this is the first study in this field, which includes all four DTI scalars. Two analytical approaches were employed for each imaging application: whole brain voxelwise comparison and ROI analysis. DTI could detect alterations in the white matter adjacent to central olfactory areas in PD, whereas MT could not, suggesting that DTI is more sensitive for this purpose. ROI analysis of the DTI data showed lower mean and axial diffusivity in the left entorhinal cortex as well as lower axial diffusivity in the right orbitofrontal cortex of PD patients. There were no significant differences in the MT ratio between the two groups.
PD patients demonstrate impaired odor identification, discrimination and detection threshold [44]. In this study, the “Sniffin’ Sticks” odor discrimination test validated the deficit in odor discrimination in PD. Previous studies in this field have either employed the odor identification test or a combination of odor identification and odor detection threshold test. According to two of these studies, PD patients with impaired olfaction present lower fractional anisotropy in the white matter adjacent to gyrus rectus and in the white matter surrounding olfactory areas of the medial temporal lobe [30, 31]. Moreover, the values of fractional anisotropy in the aforementioned areas correlate with the score of the odor identification test [30]. Decreased fractional anisotropy has also been found in the olfactory nerve and in the olfactory bulb of PD patients [32, 34]. However, the skull base is susceptible to artifacts, which could potentially explain why the present cohort did not present significant differences in the fractional anisotropy of olfactory areas. Besides, Skorpil et al. examined their cohort with two identical DTI series, getting significant differences for their two chosen ROIs only in one DTI series [34]. Additionally, estimating fractional anisotropy is reliable in homogeneous tissues with high orientation coherence [45], but only 10% of the brain is estimated to consist of such tissues [46].
Whole brain voxelwise analysis demonstrated lower axial diffusivity in the left uncinate fasciculus and in the left gyrus rectus of PD patients. The uncinate fasciculus connects the lateral orbitofrontal cortex with anterior temporal areas, playing a suggested role in decision making, which in its turn is mediated by dopaminergic mechanisms [47, 48]. The function of gyrus rectus remains unclear; it appears to be associated with executive function [49]. This analytical method did not show significant diffusivity changes in any component of the olfactory cortex, which mainly comprises small neural tracts. Furthermore, this analytical approach did not reveal any significant correlation between the olfactory evaluation score and any of the four DTI scalars within PD patients.
ROI analysis showed microstructural changes in two olfactory areas, the left entorhinal cortex and the right orbitofrontal cortex. Previous studies suggest a dominance of the right orbitofrontal cortex in odor perception [17, 18, 50]. The right hemisphere appears to participate in recognition memory, whereas the left hemisphere appears to be associated with the emotional processing of odors [51]. However, there is no evidence of lateralization regarding specifically the entorhinal cortex, indicating that this finding is rather idiosyncratic for this specific cohort. The changes in axial diffusivity can be attributed to potential axonal degeneration in the aforementioned olfactory areas. The interpretation of decreased mean diffusivity in the left entorhinal cortex is more complicated since mean diffusivity is the average of axial and radial diffusivity. ROI analysis did not demonstrate any significant diffusivity changes in the piriform cortex, which can be attributed to the fact that it mainly consists of grey matter.
MT is an indirect estimate of macromolecular content and MT ratio is decreased in demyelinating disorders such as multiple sclerosis [24]. In the present study, neither voxelwise randomized permutation nor olfactory ROI analysis revealed significant differences in the MT ratio between PD patients and healthy controls, implying a similar number of macromolecules. This in its turn suggests that the amount of myelin does not appear to differ between PD and healthy subjects. It could also indicate a lower sensitivity of the acquisition method. According to previous studies, PD patients demonstrate lower MT ratios in substantia nigra, putamen, and thalamus, despite the fact that these structures consist mainly of grey matter and MT ratio reflects myelin content [35–38]. None of these studies used normalization and whole brain voxelwise morphometry for data analysis; they instead performed ROI localization and extraction on single-subject level. This could be an indication that whole brain voxelwise morphometry is inappropriate for MTanalysis.
Limitations of the study
As with most MRI studies in this field, our cohort is small and the results should be interpreted cautiously. Standardization and reproducibility of our study protocol were of high importance; we, therefore, employed standardized, voxelwise, whole brain analytical methods. Additionally, we chose our ROIs from an open-access anatomical atlas or in accordance with a previously reported statistical localization of the human olfactory cortex [43]. These two factors can to a certain extent explain the inconsistencies among previous studies, both for DTI and MT. Moreover, it is important to note that DTI can only resolve one fiber orientation within a voxel and it is more accurate when analyzing large, homogeneous fiber bundles than small tracts [24]. However, the olfactory cortex consists mainly of small neural tracts.
Conclusions
By employing ROI analysis on normalized DTI data, decreased axial and mean diffusivity was found in olfactory areas of the temporal and frontal lobes, specifically the left entorhinal cortex and the right orbitofrontal cortex. Standardized whole brain analysis showed decreased axial diffusivity in areas located inferiorly in the frontal lobe of PD patients, namely the left uncinate fasciculus and the left gyrus rectus; however, this analytical method did not reveal diffusivity changes in the olfactory cortex, which mainly consists of small neural tracts. DTI analysis did not reveal any significant alterations of the diffusivity of the white matter adjacent to the piriform cortex in PD patients. There were no significant differences regarding fractional anisotropy between PD patients and healthy controls. MT analysis was not able to show any significant differences between PD patients and healthy controls. Hence, DTI with ROI-focused analytical approach, including all four DTI scalars, appears to be more suitable in detecting disease-related microstructural changes in the white matter adjacent to central olfactory areas in PD.
Conflicts of interest
The authors have no conflict of interest to report.
ACKNOWLEDGMENTS
The authors would like to thank Johan Lundström (Karolinska Institute, Stockholm, Sweden) for technical advice regarding ROI selection, Nicolae Dandu (Linköping University Hospital, Sweden) for participating in the clinical examination of the participants and Suzanne T. Witt (Center for Medical Image Science and Visualization, Linköping, Sweden) for substantial assistance during data acquisition and analysis. This study was supported by Swedish Parkinson Foundation, Linköping University Hospital Research Fund and by ALF Grants from Region Östergötland.
REFERENCES
[1] | Doty RL , Deems DA , & Stellar S ((1988) ) Olfactory dysfunction in parkinsonism: A general deficit unrelated to neurologic signs, disease stage, or disease duration. Neurology, 38: , 1237–1244. |
[2] | Hawkes CH , Shephard BC , & Daniel SE ((1999) ) Is Parkinson’s disease a primary olfactory disorder? QJM, 92: , 473–480. |
[3] | Pont-Sunyer C , Hotter A , Gaig C , Seppi K , Compta Y , Katzenschlager R , Mas N , Hofeneder D , Brucke T , Bayes A , Wenzel K , Infante J , Zach H , Pirker W , Posada IJ , Alvarez R , Ispierto L , De Fabregues O , Callen A , Palasi A , Aguilar M , Marti MJ , Valldeoriola F , Salamero M , Poewe W , & Tolosa E ((2015) ) The onset of nonmotor symptoms in Parkinson’s disease (the ONSET PD study). Mov Disord, 30: , 229–237. |
[4] | Munhoz RP , Moro A , Silveira-Moriyama L , & Teive HA ((2015) ) Non-motor signs in Parkinson’s disease: A review. Arq Neuropsiquiatr, 73: , 454–462. |
[5] | Tissingh G , Berendse HW , Bergmans P , DeWaard R , Drukarch B , Stoof JC , & Wolters EC ((2001) ) Loss of olfaction in de novo and treated Parkinson’s disease: Possible implications for early diagnosis. Mov Disord, 16: , 41–46. |
[6] | Takeda A , Baba T , Kikuchi A , Hasegawa T , Sugeno N , Konno M , Miura E , & Mori E ((2014) ) Olfactory dysfunction and dementia in Parkinson’s disease. J Parkinsons Dis, 4: , 181–187. |
[7] | Cavaco S , Goncalves A , Mendes A , Vila-Cha N , Moreira I , Fernandes J , Damasio J , Teixeira-Pinto A , & Bastos Lima A ((2015) ) Abnormalolfaction in Parkinson’s disease is related to fasterdisease progression. Behav Neuro/, 2015: , 976589. |
[8] | Fullard ME , Tran B , Xie SX , Toledo JB , Scordia C , Linder C , Purri R , Weintraub D , Duda JE , Chahine LM , & Morley JF ((2016) ) Olfactory impairment predicts cognitive decline in early Parkinson’s disease. Parkinsonism Relat Disord, 25: , 45–51. |
[9] | Kawasaki I , Baba T , Takeda A , & Mori E ((2016) ) Loss of awareness of hyposmia is associated with mild cognitive impairment in Parkinson’s disease. Parkinsonism Relat Disord, 22: , 74–79. |
[10] | Barresi M , Ciurleo R , Giacoppo S , Foti Cuzzola V , Celi D , Bramanti P , & Marino S ((2012) ) Evaluation of olfactory dysfunction in neurodegenerative diseases. J Neurol Sci, 323: , 16–24. |
[11] | Berardelli A , Wenning GK , Antonini A , Berg D , Bloem BR , Bonifati V , Brooks D , Burn DJ , Colosimo C , Fanciulli A , Ferreira J , Gasser T , Grandas F , Kanovsky P , Kostic V , Kulisevsky J , Oertel W , Poewe W , Reese JP , Relja M , Ruzicka E , Schrag A , Seppi K , Taba P , &Vidailhet M ((2013) ) EFNS/MDS-ES/ENS [corrected] recommendations forthe diagnosis of Parkinson’s disease. Eur J Neurol, 20: , 16–34. |
[12] | van Hartevelt TJ , & Kringelbach ML ((2012) ) The olfactory system. In The human nervous system, Mai JK , Paxinos G , eds. Elsevier Academic Press, Amsterdam; Boston, pp 1219–1238. |
[13] | Gottfried JA ((2010) ) Central mechanisms of odour object perception. Nat Rev Neurosci, 11: , 628–641. |
[14] | Kadohisa M , & Wilson DA ((2006) ) Separate encoding of identity and similarity of complex familiar odors in piriform cortex. Proc Natl Acad Sci U S A, 103: , 15206–15211. |
[15] | Staubli U , Fraser D , Kessler M , & Lynch G ((1986) ) Studies on retrograde and anterograde amnesia of olfactory memory after denervation of the hippocampus by entorhinal cortex lesions. Behav Neural Biol, 46: , 432–444. |
[16] | Wilson DA , Xu W , Sadrian B , Courtiol E , Cohen Y , & Barnes DC ((2014) ) Cortical odor processing in health and disease. Prog Brain Res, 208: , 275–305. |
[17] | Jones-Gotman M , & Zatorre RJ ((1993) ) Odor recognition memory in humans: Role of right temporal and orbitofrontal regions. Brain Cogn, 22: , 182–198. |
[18] | Zatorre RJ , Jones-Gotman M , Evans AC , & Meyer E ((1992) ) Functional localization and lateralization of human olfactory cortex. Nature, 360: , 339–340. |
[19] | Plailly J , Howard JD , Gitelman DR , & Gottfried JA ((2008) ) Attention to odor modulates thalamocortical connectivity in the human brain. J Neurosci, 28: , 5257–5267. |
[20] | Otto T , & Eichenbaum H ((1992) ) Complementary roles of the orbital prefrontal cortex and the perirhinal-entorhinal cortices in an odor-guided delayed-nonmatching-to-sample task. Behav Neurosci, 106: , 762–775. |
[21] | Schoenbaum G , Chiba AA , & Gallagher M ((1999) ) Neural encoding in orbitofrontal cortex and basolateral amygdala during olfactory discrimination learning. J Neurosci, 19: , 1876–1884. |
[22] | Harding AJ , Stimson E , Henderson JM , & Halliday GM ((2002) ) Clinical correlates of selective pathology in the amygdala of patients with Parkinson’s disease. Brain, 125: , 2431–2445. |
[23] | Silveira-Moriyama L , Holton JL , Kingsbury A , Ayling H , Petrie A , Sterlacci W , Poewe W , Maier H , Lees AJ , & Revesz T ((2009) ) Regional differences in the severity of Lewy body pathology across the olfactory cortex. Neurosci Lett, 453: , 77–80. |
[24] | Alexander AL , Hurley SA , Samsonov AA , Adluru N , Hosseinbor AP , Mossahebi P , Tromp do PM , Zakszewski E , & Field AS ((2011) ) Characterization of cerebral white matter properties using quantitative magnetic resonance imaging stains. Brain Connect, 1: , 423–446. |
[25] | Feldman HM , Yeatman JD , Lee ES , Barde LH , & Gaman-Bean S ((2010) ) Diffusion tensor imaging: A review for pediatric researchers and clinicians. J Dev Behav Pediatr, 31: , 346–356. |
[26] | Tromp Do PM ((2016) ) DTI Scalars (FA, MD, AD, RD) - How do they relate to brain structure? The Winnower, 3: , e146119.94778. doi: 10.15200/winn.146119.94778 |
[27] | Song SK , Sun SW , Ramsbottom MJ , Chang C , Russell J , & Cross AH ((2002) ) Dysmyelination revealed through MRI as increased radial (but unchanged axial) diffusion of water. Neuroimage, 17: , 1429–1436. |
[28] | Sun SW , Liang HF , Le TQ , Armstrong RC , Cross AH , & Song SK ((2006) ) Differential sensitivity of in vivo and ex vivo diffusiontensor imaging to evolving optic nerve injury in mice with retinalischemia. Neuroimage, 32: , 1195–1204. |
[29] | Snook L , Plewes C , & Beaulieu C ((2007) ) Voxel based versus region of interest analysis in diffusion tensor imaging of neurodevelopment. Neuroimage, 34: , 243–252. |
[30] | Ibarretxe-Bilbao N , Junque C , Marti MJ , Valldeoriola F , Vendrell P , Bargallo N , Zarei M , & Tolosa E ((2010) ) Olfactory impairment inParkinson’s disease and white matter abnormalities in centralolfactory areas: A voxel-based diffusion tensor imaging study. Mov Disord, 25: , 1888–1894. |
[31] | Zhang K , Yu C , Zhang Y , Wu X , Zhu C , Chan P , & Li K ((2011) ) Voxel-based analysis of diffusion tensor indices in the brain in patients with Parkinson’s disease. Eur J Radiol, 77: , 269–273. |
[32] | Rolheiser TM , Fulton HG , Good KP , Fisk JD , McKelvey JR , Scherfler C , Khan NM , Leslie RA , & Robertson HA ((2011) ) Diffusion tensor imaging and olfactory identification testing in early-stage Parkinson’s disease. J Neurol, 258: , 1254–1260. |
[33] | Skorpil M , Rolheiser T , Robertson H , Sundin A , & Svenningsson P ((2011) ) Diffusion tensor fiber tractography of the olfactory tract. Magn Reson Imaging, 29: , 289–292. |
[34] | Skorpil M , Soderlund V , Sundin A , & Svenningsson P ((2012) ) MRIdiffusion in Parkinson’s disease: Using the technique’s inherentdirectional information to study the olfactory bulb and substantianigra. J Parkinsons Dis, 2: , 171–180. |
[35] | Tambasco N , Pelliccioli GP , Chiarini P , Montanari GE , Leone F , Mancini ML , Paciaroni M , & Gallai V ((2003) ) Magnetization transfer changes of grey and white matter in Parkinson’s disease. Neuroradiology, 45: , 224–230. |
[36] | Eckert T , Sailer M , Kaufmann J , Schrader C , Peschel T , Bodammer N , Heinze HJ , & Schoenfeld MA ((2004) ) Differentiation of idiopathic Parkinson’s disease, multiple system atrophy, progressive supranuclear palsy, and healthy controls using magnetization transfer imaging. Neuroimage, 21: , 229–235. |
[37] | Anik Y , Iseri P , Demirci A , Komsuoglu S , & Inan N ((2007) ) Magnetization transfer ratio in early period of Parkinson disease. Acad Radiol, 14: , 189–192. |
[38] | Tambasco N , Belcastro V , Sarchielli P , Floridi P , Pierguidi L , Menichetti C , Castrioto A , Chiarini P , Parnetti L , Eusebi P , Calabresi P , & Rossi A ((2011) ) A magnetization transfer study of mild and advanced Parkinson’s disease. Eur J Neurol, 18: , 471–477. |
[39] | Daniel SE , & Lees AJ ((1993) ) Parkinson’s Disease Society Brain Bank, London: Overview and research. J Neural Transm Suppl, 39: , 165–172. |
[40] | Helms G , Dathe H , Kallenberg K , & Dechent P ((2008) ) High-resolution maps of magnetization transfer with inherent correction for RF inhomogeneity and T1 relaxation obtained from 3D FLASH MRI. Magn Reson Med, 60: , 1396–1407. |
[41] | Smith SM , Jenkinson M , Johansen-Berg H , Rueckert D , Nichols TE , Mackay CE , Watkins KE , Ciccarelli O , Cader MZ , Matthews PM , & Behrens TE ((2006) ) Tract-based spatial statistics: Voxelwise analysis of multi-subject diffusion data. Neuroimage, 31: , 1487–1505. |
[42] | Smith SM , Johansen-Berg H , Jenkinson M , Rueckert D , Nichols TE , Miller KL , Robson MD , Jones DK , Klein JC , Bartsch AJ , & Behrens TE ((2007) ) Acquisition and voxelwise analysis of multi-subject diffusion data with tract-based spatial statistics. Nat Protoc, 2: , 499–503. |
[43] | Seubert J , Freiherr J , Djordjevic J , & Lundstrom JN ((2013) ) Statistical localization of human olfactory cortex. Neuroimage, 66: , 333–342. |
[44] | Mesholam RI , Moberg PJ , Mahr RN , & Doty RL ((1998) ) Olfaction inneurodegenerative disease: A meta-analysis of olfactoryfunctioning in Alzheimer’s and Parkinson’s diseases. Arch Neurol, 55: , 84–90. |
[45] | Alexander AL , Hasan KM , Lazar M , Tsuruda JS , & Parker DL ((2001) ) Analysis of partial volume effects in diffusion-tensor MRI. Magn Reson Med, 45: , 770–780. |
[46] | Jeurissen B , Leemans A , Tournier JD , Jones DK , & Sijbers J ((2013) ) Investigating the prevalence of complex fiber configurations in white matter tissue with diffusion magnetic resonance imaging. Hum Brain Mapp, 34: , 2747–2766. |
[47] | Von Der Heide RJ , Skipper LM , Klobusicky E , & Olson IR ((2013) ) Dissecting the uncinate fasciculus: Disorders, controversies and a hypothesis. Brain, 136: , 1692–1707. |
[48] | Rogers RD ((2011) ) The roles of dopamine and serotonin in decision making: Evidence from pharmacological experiments in humans. Neuropsychopharmacology, 36: , 114–132. |
[49] | Elderkin-Thompson V , Hellemann G , Pham D , & Kumar A ((2009) ) Prefrontal brain morphology and executive function in healthy and depressed elderly. Int J Geriatr Psychiatry, 24: , 459–468. |
[50] | Li W , Lopez L , Osher J , Howard JD , Parrish TB , & Gottfried JA ((2010) ) Right orbitofrontal cortex mediates conscious olfactory perception. Psychol Sci, 21: , 1454–1463. |
[51] | Royet JP , & Plailly J ((2004) ) Lateralization of olfactory processes. Chem Senses, 29: , 731–745. |


