
Alcohol Consumption and Parkinson’s Disease Risk: A Review of Recent Findings
Abstract
Background: The association between Parkinson’s disease and lifestyle exposures such as smoking, coffee and alcohol consumption have been the focus of research for several decades, with varying and often conflicting results.
Objective: This paper reviews the key features of observational studies investigating the relationship between alcohol drinking and PD risk, to determine potential sources of variability between the results.
Methods: Relevant literature from 2000–2014 was systematically retrieved using three databases. Primary research articles were included if they reported a measure of association between quantity and frequency of alcohol intake and PD risk, and adjusted at least for the potential confounding factors of smoking and age.
Results: Sixteen articles were identified. The seven case-control studies were more likely to report a weak protective association by level of alcohol consumption compared to the studies with prospective designs. Two studies reported the relationship between heavy (harmful to health) drinking and PD. There was weak evidence that associations varied by type of alcoholic beverage. Smoking may modify the association between alcohol intake and PD risk, however, the evidence does not support the theory that a confounder (such as an addiction-avoiding personality trait) produced the inverse associations between smoking, coffee and alcohol intake and PD risk. Methodological weaknesses of the studies, including selection and recall bias, residual confounding and lack of statistical power may in part account for their differences.
Conclusion: The weak association between alcohol drinking and PD risk was found in studies at greater risk of selection and recall bias.
INTRODUCTION
Parkinson’s disease (PD) is the second most commonly occurring neurodegenerative condition after Alzheimer’s disease [1]. Global estimates of the age-adjusted incidence rate of PD range from 7.9 to 19 per 100,000 person-years and a prevalence of 57 to 230 per 100,000 population [2]. Various risk and protective factors of PD have been extensively investigated over several decades, however the etiology remains largely unclear [3]. There is a great interest in identifying at-risk individuals early, to potentially slow down or prevent neurodegeneration [4]. While genetic and familial environmental exposures are often cited to contribute to PD risk, lifestyle exposures such as smoking, coffee/tea and alcohol consumption have been the focus of research for several decades with varying and often conflicting results.
Interest in determining the association betweenalcohol consumption and risk of PD has to some extent come about from the inverse associations between smoking, coffee consumption and risk of PD. Risk reductions have been observed for caffeine consumers and smokers [5, 6], however causality has yet to be unequivocally established. Early studies that assessed alcohol consumption and risk of PD produced equivocal results [7–9]. However more recently, several meta-analyses have reported an inverse relationship between alcohol intake and PD risk [10–12]. Whether these factors are truly biologically protective is still a matter of debate, and interestingly this inverse relationship is not consistent across studies. The objective of this systematic review was to update earlier reviews [10, 11] using a more rigorous approach and to explore potential sources of variability by critically reviewing the key methodological features of eligible studies, such as study design, control of confounding and measurement of exposure and outcome.
METHODS
Search strategy
The databases PubMed, TRIP [13] and Web of Science Core Collection were searched systematically for relevant literature. The two main constituents of the research question; ‘Parkinson’s disease’ and ‘alcohol’, were used to develop database search terms. These two terms were entered into Roget’s Thesaurus online, to identify as many synonyms as possible [14]. The final search terms used were: (alcohol * OR wine OR beer OR spirit OR sake OR liquor OR liqueur OR whisky OR rum OR ethanol) AND (Parkinson * OR paralysis agitans OR shaking palsy). In total, 2619 citations were retrieved from three databases. Where available, filters for ‘English language articles’ and ‘primary research articles’ were applied to reduce the number of non-relevant citations identified by the search. The numbers of citations remaining after the filters were applied were then screened for relevance using inclusion and exclusion criteria. Following the database searches, the reference lists of three relevant meta-analytic reviews [10–12] were hand searched. One extra citation was identified by this method (Fig. 1).
The inclusion and exclusion criteria were developed to screen the search results systematically and ensure that only relevant articles were included in the final review. Primary research articles were included if they were published in English language, in peer reviewed journals between 2000 and May 2014. To be included, studies also had to include a comparison or control group consisting of individuals without PD, report a measure of association between quantity and frequency of alcohol intake and PD risk, and adjust at least for the potential confounding factors of smoking and age. Studies which reported an association between alcoholism and PD risk were also selected for inclusion. Research which measured alcohol exposure as a binary variable only (drinker versus non-drinker), or of cross-sectional design measuring alcohol intake and PD prevalence at the same point in time, wereexcluded.
RESULTS
Sixteen articles (reporting on seventeen studies) were identified (Fig. 1), seven of which utilised a case-control study design to investigate the association between alcohol consumption and PD risk. Four articles used a nested case-control design and the remaining five articles (reporting on six studies) utilised a cohort study design. Studies were mainly conducted in the USA (seven), with two from the United Kingdom and one each from India, Italy, Finland, Japan, Serbia, Singapore and Sweden. The characteristics of the included studies are shown in Tables 1 and 2.
Case ascertainment
Studies used a variety of methods for subject and case ascertainment, however most used standardized and validated scales. Reference to the criteria is found in Tables 1 and 2. The majority of studies indicated that PD diagnosis was accepted if based on a neurologist diagnosis of several cardinal signs corroborated with clinic notes and screening instrument for cognitive impairment such as the Minimal Mental State Examination (MMSE). Research teams indicated reviewing the medical records. PD evaluation scales included one or a combination of the following: the Unified Parkinson’s Disease Rating Scale (UPDRS), UK Parkinson’s Disease Society Brain Bank Clinic Diagnostic Criteria, Queen Square Brain Bank Criteria, International Parkinson and Movement Disorder Society rating scale. Only three studies mentioned the response to anti-parkinsonian drugs eg. L-dopa. Other combinations included International Classification of Diseases codes, DNA collection, questionnaires and hospital discharge registers and death certificates. Assessment grading using the Hoehn and Yahr scale was not cited, however a number of studies screened for cognitive impairment using the Minimal Mental State Examination.
Case-control studies
In the case-control studies (Table 1), alcohol intake was summarised in a number of different ways. Studies reported quantity and frequency in drinks, units, decilitres or grams per day/week, duration of drinking in years and participants positive for an alcohol use disorder (AUD). An AUD is a harmful pattern of drinking with serious risks of physical and psychological harm. A consequence of harmful drinking is alcohol dependence, characterised by a strong desire to drink and difficulties controlling drinking according to the Diagnostic and Statistical Manual of Mental Disorders (DSM IV) [15]. Among the studies which measured quantity and frequency, the reference period over which consumption was measured also varied. Studies asked participants to recall typical consumption patterns across their lifetime [16] average alcohol intake over the previous month [17] and drinking habits during the period when their alcohol consumption was the highest [18].
The results were inconsistent in case-control studies that compared different quantities of alcohol intake in drinkers with non-drinkers: two studies showed a moderately decreased risk of PD with greater quantity consumed [17, 19], two showed no evidence of an association [16, 17], and one showed a strong increased risk of PD with higher consumption [20].
Results were also inconsistent for studies in terms of duration of drinking. A study conducted in Italy showed evidence of a decreased risk of PD with ≥46 years of wine drinking (OR 0.45; 95% CI [0.29, 0.68]) [19]. Yet in India, consuming alcohol for >20 years was not associated with PD risk (OR 1.48; 95% CI [0.82, 2.65]), and consuming alcohol for ≤20 years was nearly protective (OR 0.45; 95% CI [0.20, 1.01]) [21]. However, only 48 cases and 59 controls consumed alcohol at all so this finding may be due to a lack of power in this study [21].
Some of the studies also showed a dose-response relationship with level of alcohol exposure (quantity and/or frequency) and risk of PD, albeit in opposing directions [17, 19, 20]. Nicoletti et al. [19], found reduced risks with greater quantity of wine consumed per day, and for units consumed per week. Evans et al. [17], calculated an OR of 0.44; 95% CI [0.26, 0.75] for each category of intake, while Sipetic et al. [20], reported an increased risk for average weekly consumption in decilitres (OR 4.68; 95% CI [2.79, 7.84]).
Prospective studies
Most studies reported alcohol intake in grams per day, [22–25], however drinks per day [26, 27], or month [28], and units per week [29], were also used (Table 2).
In the prospective studies there was no convincing evidence of a decreased likelihood of PD according to different levels of total alcohol consumption [22–30], Most studies observed non-significant associations between alcohol and PD risk. A study conducted in Finland found those who consumed <5 grams of alcohol per day had an increased risk of PD compared to non-drinkers (RR 1.94; 95% CI [1.09, 3.47]) [24]. Another study from the USA found increased risks of PD among men who consumed 10 to 19.9 grams/day (RR 1.48; 95% CI [1.09, 2.01]) and women who consumed 10 to 14.9 grams/day (RR 1.67; 95% CI [1.06, 2.64]) compared to non-drinkers, however there was no clear trend of increasing risk with increasing consumption [23].
The largest study found no association between total alcohol intake and future PD risk, however beverage specific analyses revealed heavy liquor drinking (at least two drinks/day) to be associated with an increased risk (RR 1.35; 95% CI [1.02, 1.80]), and low to moderate beer drinking (less than one drink/day) with a deceased risk (RR 0.79; 95% CI [0.68, 0.92]) [26].
There was some evidence to suggest that smoking modified the association between alcohol consumption and PD risk, with greater risk reductions afforded to ‘never smokers’. Four studies performed stratified analyses to investigate whether the risk of PD due to alcohol consumption, differed between ‘ever smokers’ and ‘never smokers’ [22, 23, 25, 26]. All four observed non-significant associations between total alcohol intake and risk of PD. However, three of these studies [22, 25, 26], found that ‘never smokers’ who consumed alcohol had a greater risk reduction of PD than ‘ever smokers’. Wirdefeldt et al. [25], found a protective effect of alcohol (OR 0.56; 95% CI [0.39, 0.80]) for ‘ever’ versus ‘never’ drinkers when restricting the analysis to ‘never smokers’. Hernán et al. [22], found a marginally reduced risk among male ‘never smokers’ who drank ≥15 grams/day (RR 0.5; 95% CI [0.3, 1.0]), but not for women. Liu et al. [26], observed an inverse association between beer drinking and PD risk among ‘never smokers’, however no such association was found for liquor drinking. Conversely, Palacios et al. did not find any significant differences when conducting stratified analyses between ‘never’ and ‘ever’ smokers [23]. Further investigations would be required to confirm these findings.
DISCUSSION
Quality of studies
This review determined several possible methodological weaknesses that could explain the varying and often conflicting results of studies reporting lifestyle exposures such as smoking, coffee/tea and alcohol consumption contributing to PD risk.
Among the case-control studies there was a potential for selection bias due to selection or self-selection of controls [17, 19, 20]. One study found an increased risk of PD due to alcohol consumption, however they used hospital controls receiving treatment for chronic pancreatitis, a condition strongly associated with alcohol consumption [20]. Bias may have been introduced if these controls consumed alcohol at a different rate to the general population.
Few case-control studies used incident cases [16, 20], and this may have increased the potential for inaccurate recollection of exposure. The temporal sequence of events was particularly unclear for one case-control study, where prevalent cases were questioned about their current alcohol intake over the past month [17]. This study found a dose-dependent inverse association between alcohol intake and PD risk. Whereas a prospective cohort study reported PD cases significantly reduced their alcohol intake around the time of their diagnosis and continued to reduce their alcohol intake thereafter [23]. Thus findings from case-control studies that indicate protective effects of alcohol should be interpreted cautiously not only for their limitations and potential for selection bias but also retrospective assessment of alcohol intake, since the recall of past dietary exposures can be affected by current exposures [31].
In further support of this argument, the studies with the most certain temporal sequence of events i.e. those which used cohort and nested case-control study designs [22, 23, 26, 28, 29, 30], tended to find non-significant associations, close to unity, between total alcohol consumption and risk of PD. One nested case-control study found lower risks when alcohol consumption was reported by prevalent cases, compared to incident cases who were identified five years after alcohol exposure information was collected [28].
Two nested case-control studies may have inadvertently included prevalent cases in their baseline sample, which could potentially explain the non-significant inverse associations they observed [25, 27]. One of these studies seemingly made no attempt to exclude the 26 prevalent cases from their analyses [27].
There was no discernible pattern in the results according to the length of follow-up in the prospective studies which varied between 10 years to 20 years (Table 2). For example a nested case-control study followed participants between 1995 and 2001 [29], yet found very similar results to studies that had much longer follow-up periods [22, 23, 26]. Three studies reduced the potential for reverse causality by excluding the first 5 to 10 years of follow-up [23, 24, 26]. Two of these studies observed non-significant associations between total alcohol intake and PD [23, 26], and one study found increasing PD risk with increasing duration between exposure and outcome [24].
The cohort studies were more likely to use validated questionnaires to elicit alcohol exposure information compared to the case-control and nested case-control studies. All cohort studies asked participants about their consumption of specific beverages. These questions have been shown to produce higher estimates and improved recall of alcohol consumption compared to questions on overall consumption alone [32]. For these reasons, the cohort studies may have been more likely to produce valid results.
Overall, most studies used non-drinkers as the reference category in their analyses, which helped when comparing the results, however the definition of a ‘non-drinker’ tended to differ between studies. Apart from the study that measured ‘peak’ alcohol consumption, it was not clear whether any of the studies that measured quantity and frequency, separated lifetime abstainers from former drinkers. This can lead to misclassification if former heavy drinkers are classified as ‘non-drinkers’ [33].
Alcohol use disorders
Two studies Brighina et al. and Hernán et al. classified alcohol exposure according to clinical criteria for drinking that is harmful to health [34, 29]. Brighina et al. a case-control study, screened subjects for an alcohol use disorder with the CAGE questionnaire and also with medical records, using an alcohol-related medical problem as a proxy for alcoholism [34]. The CAGE questionnaire consists of four questions and is used as a screening tool for alcohol abuse and dependence [35]. Hernán et al. a prospective study, classified subjects as clinically-defined alcoholics, before their index date, based on a computerized diagnosis of alcoholism or alcohol-related chronic disease such as alcohol cirrhosis or alcoholic cardiopathy [29].
Brighina et al. found a statistically significant inverse association between subjects with a CAGE score of 2 or more (indicative of an alcohol use disorder) compared with participants with CAGE score <2 and PD risk: adjusted OR 0.63, 95% CI [0.43, 0.93] [34]. The CAGE questionnaire positively identified 7.2% of cases and 11% of controls (based on 779 case-control pairs) for alcohol use disorders reporting a weak but statistically significant trend of decreasing risk of PD with increasing CAGE score [34]. When the analysis was based on participants with a medical history of an alcohol-related health problem (based on 843 case-control pairs) the inverse association was weaker. The report by Hernán et al., indicated that alcoholism was not associated with the risk of PD, however, the smoking-adjusted OR of 1.09, 95% CI [0.67, 1.78] was based on eighteen cases and 174 controls (1.72% ) receiving a diagnosis of alcoholism before the index date [29]. This analysis was based on fewer subjects, and may have lacked power to detect a significant difference. Thus, the methods used to measure alcohol use and the statistical power of the analyses may explain the contrasting results of the studies.
Beverage types
Eight studies measured associations between PD risk and the beverage types; beer, wine or liquor, however no specific beverage type was consistently, significantly associated with PD risk. Of these eight studies, three found statistically significant inverse associations. Nicoletti et al. observed a moderate, dose-dependent protective effect of wine drinking, with an OR of 0.45; 95% CI [0.28, 0.74] for ≥3 glasses per day [19]. Hernán et al. and Liu et al. each found a weak, inverse association for beer drinking, however there was little evidence of a dose-dependent trend [22, 26].
Three studies noted that alcohol intake and PD vary according to different kinds of alcohol suggesting increased risks of PD with consumption of specific beverages. A case-control study by Fukushima et al. assessed daily intake separately for each type of alcohol including beer, Japanese sake, Shochu, wine and whisky. There were no significant associations with PD, except moderate to strong, dose-dependent effects of Japanese sake [18]. Additionally, Liu et al. reported an increased PD risk with ≥2 drinks of liquor per day (OR 1.35; 95% CI [1.02, 1.80]) [26]. The remaining study by Sipetic et al. indicated strong associations for brandy and beer, and very strong associations for liquor and wine [20]. However, the findings of this latter study should be interpreted with caution since the authors did not statistically control for any confounding variables when calculating beverage specific associations.
In contrast, Palacios et al. and Brighina et al. two studies which investigated the relationships between beer, wine and liquor drinking and risk of PD, found non-significant results with associations close to unity [23, 34], It would therefore appear that the studies collectively paint an inconsistent picture of the relationship between PD and different beverage types. Variance in typical beverage specific consumption patterns among the studied populations could potentially explain these inconsistencies. Cultural preferences could result in fewer participants selecting certain beverages, and thus lack of significance could reflect a lack of power. However, four studies conducted in the United States of America, observed different results for the same beverage [22, 23, 26, 34].
In studies that evaluated three different alcoholic beverage types, there was no evidence of simultaneously reduced or increased risks for all three beverages beer, wine and liquor [22, 23, 26, 34]. This could indicate that ingredients other than ethanol may be driving the beverage specific associations observed.
Confounding by personality traits
Ten studies analysed the effects of alcohol consumption alongside smoking and caffeine intake as risk factors for PD. Two of these studies found statistically significant inverse associations for all three factors [17, 19]. One of these studies also found a dose-dependent trend for the presence of at least one, two or three of smoking, coffee or wine drinking behaviours, with the greatest risk reduction for all three [19]. The other study suggested that personality traits (such as risky, sensation seeking behaviours) confounded the associations between each of the three factors and PD risk [17]. These findings suggest that a confounding variable common to all three factors may explain or partially explain their hypothetical protective effects. However, against this argument is that the remaining eight studies either did not observe significant associations for all three factors or observed significant effects but in different directions. The majority of studies did not find simultaneously protective effects for smoking, coffee drinking and alcohol consumption, suggesting that the presence of a confounding variable common to all three factors, such as an addiction-avoiding personality trait, is unlikely.
Ethnicity
Most of the selected studies examined PD risk in western countries with predominantly white populations. Two studies recruited participants of East Asian descent. One case-control study recruited participants in Japan [18], and a prospective study recruited Singaporean Chinese participants [30]. Both studies found non-significant associations between total alcohol consumption and PD risk. Fukushima et al. calculated an association close to unity (OR 0.96; 95% CI [0.50, 1.81]) for those who drank alcohol at least six days per week compared to non-drinkers, and Tan et al. found a non-significant decreased risk (RR 0.6, 95% CI [0.31, 1.16]) for at-least-weekly drinkers compared to non- or less-than-weekly drinkers [18, 30]. Fukushima et al collected data on ‘peak’ alcohol drinking rather than average consumption, and statistically controlled for a number of extra potential confounders compared to Tan et al such as body mass index, medication history, cholesterol, vitamin E, vitamin B6, iron and dietary glycemic index, which could potentially explain the differences in results [18, 30].
Summary
This study has provided a critical summary of the epidemiologic literature related to alcohol consumption and PD risk published since 2000. In general, studies with a prospective design tended to find non-significant associations between total alcohol intake and PD risk, with two studies finding an increased risk with moderate alcohol consumption. The case-control studies were more likely to find protective effects of alcohol on PD risk, however it is unclear to what extent these observations were the result of selection and recall bias.
Among the reviewed studies there was some evidence to suggest that smoking modifies the association between alcohol intake and PD risk. There was also evidence to suggest that beer may be inversely associated with PD risk, however ethanol is unlikely to be the protective ingredient. The evidence does not support the theory that a confounder, such as an addiction-avoiding personality trait, has produced the inverse associations between smoking, coffee and alcohol intake and PD risk. Studies examining the relationship between alcohol use disorders and PD have produced inconsistent results.
We note the lack of uniformity by these primary studies in the definition of drinking, the inconsistency of the units used to report quantity and frequency, and the reference period over which alcohol consumption was measured. We fully appreciate that to obtain valid estimates of alcohol consumption, researchers must utilise methods appropriate for the drinking culture [36]. However, these methodological differences make it difficult to compare results across countries with accuracy, and may explain some of the heterogeneity observed.
Standard measures such as units and drink portions can differ between countries, therefore converting these measures into grams of ethanol for analysis would be beneficial for comparison. Additionally, since the risk of PD may differ by beverage type, researchers should aim to measure beverage specific risks wherever possible. Not only will this help to improve understanding of beverage specific risks but recall may be improved compared to combined alcohol questioning. Whilst volume and duration of alcohol consumption are important to determine cause-effect associations, frequency of heavy drinking episodes may be another important consideration [37], which future research may wish to address.
The subject selection process was determined differently, and did not follow a uniform method across the studies. Assessment grading using the more current Hoehn and Yahr scale was not cited though MMSE was used. This leaves the reader to speculate that PD patients were selected on a scale where cognitive decline did not interfere with the ability to recall events, self-report exposure or complete questionnaires especially in case–control studies, a process that is prone to recall bias and could lead to false-positive associations. Alternatively, PD patients may underreport exposure leading to false-negative associations.
The strengths of our review include the large number of subjects investigated and the comprehensive picture provided. The decision to exclude studies which did not control for the potential confounding effects of smoking was important. Palacios et al. [23], found smoking to be the biggest confounder of the relationship between alcohol and PD risk, and smoking reduced the risk of PD in the majority of the reviewed studies. The conclusions of this study are therefore more likely to reflect the true relationship between alcohol and PD.
A limitation to this review was the introduction of bias. Non-published data and papers published in languages other than English were not included. Studies which measured alcohol exposure as a binary variable only were also excluded, however measuring exposure as ‘ever’ or ‘never’ drinkers would have been inadequate to determine the complexity of alcohol exposure. Despite identifying cohort studies, the review primarily involved case-control studies and the results should be interpreted cautiously due to the recall bias of case-control studies.
Conclusion and implications and directions of future research
This study highlights the need for more prospective studies investigating the relationship between alcohol and PD of adequate sample size. Improvements to reporting of studies by investigators particularly with respect to sample size and power would help others interpret the epidemiological significance of any findings. We note the lack of uniformity in reporting quantity, duration and frequency of alcohol intake. Researchers may wish to consider the comparability of their results when reporting, and the need to be explicit when presenting the data. Finally, as with any observational study, the possibility of residual confounding cannot be ruled out. Although authors controlled for a range of factors, it remains possible that other factors confound the association between alcohol and PD risk.
Interpretation of findings from case-control studies should take into account selection and recall bias. The association between ingredients in beer and PD risk, and effect modification by smoking, may be avenues for future research. The evidence is not strong enough to recommend prioritising beer over other beverages to reduce the risk of PD. From researchers’ responses, most of the studies proved to be preliminary and improving statistical power to detect joint effects was encouraged.
FINANCIAL DISCLOSURE/CONFLICTS OF INTEREST
The authors have no conflict of interest to report.
ACKNOWLEDGMENTS
We wish to thank Dr. Sue Pearson and Dr. Cecile McKeown for their valuable comments on this manuscript.
REFERENCES
1 | Nussbaum RL, Ellis CE(2003) Alzheimer’s disease and Parkinson’s diseaseN Engl J Med348: 13561364 |
2 | Muangpaisan W, Mathews A, Hori H, Seidel D(2011) A systematic review of the worldwide prevalence and incidence of Parkinson’s diseaseJ Med Assoc Thai94: 749755 |
3 | Jannetta PJ, Whiting DM, Fletcher LH, Hobbs JK, Brillman J, Quigley M, Fukui M, Williams R(2011) Parkinson’s disease: An inquiry into the etiology and treatmentNeurol Int3: 2427 |
4 | Grünblatt E(2012) Parkinson’s disease: Molecular riskfactorsParkinsonism Relat Disord18: S45S48 |
5 | Costa J, Lunet N, Santos C, Santos J, Vaz-Carneiro A(2010) Caffeine exposure and the risk of Parkinson’s disease: Asystematic review and meta-analysis of observational studiesJ Alzheimers Dis 20 Suppl1: 221238 |
6 | Kiyohara C, Kusuhara S(2010) Cigarette smoking and Parkinson’s disease: A meta-analysisFukuoka Igaku Zasshi102: 254265 |
7 | Ho SC, Woo J, Lee CM(1989) Epidemiologic study of Parkinson’s disease in Hong KongNeurology39: 13141318 |
8 | Levine RL, Jones JC, Bee N(1992) Stroke and Parkinson’s diseaseStroke23: 839842 |
9 | Mayeux R, Tang MX, Marder K, Côté LJ, Stern Y(1994) Smoking and Parkinson’s diseaseMov Disord9: 207212 |
10 | Ishihara L, Brayne C(2005) A systematic review of nutritional risk factors of Parkinson’s diseaseNutr Res Rev18: 259282 |
11 | Noyce AJ, Bestwick JP, Silveira-Moriyama L, Hawkes CH, Giovannoni G, Lees AJ, Schrag A(2012) Meta-analysis of early nonmotor features and risk factors for Parkinson diseaseAnn Neurol72: 893901 |
12 | Zhang D, Jiang H, Xie J(2014) Alcohol intake and risk of Parkinson’s disease: A meta-analysis of observational studiesMov Disord29: 819822 |
13 | TRIP Database. Turning research into practice. UK: TRIP Database, 1997. [cited May 2014]. http://www.tripdatabase.com |
14 | Roget’s Thesaurus Alphabetical Index: http://thesaurus.com/Roget-Alpha-Index.html Accessed [02/01/13]. |
15 | American Psychiatric Association. Diagnostic and Statistical Manual of Mental Disorders. fourth ed., text revision ed. APA, Washington, DC; 2000:1–943. |
16 | Checkoway H, Powers K, Smith-Weller T, Franklin G, Longstreth W, Swanson P(2002) Parkinson’s disease risksassociated with cigarette smoking, alcohol consumption, and caffeine intakeAm J Epidemiol55: 732738 |
17 | Evans A, Lawrence A, Potts J, MacGreogr L, Katzenschlager R, Shaw K, Zijlmans J, Lees AJ(2006) Relationshipbetween impulsive sensation seeking traits, smoking, alcohol and caffeine intake, and Parkinson’s diseaseJ Neurol Neurosurg Psychiatry77: 317321 |
18 | Fukushima W, Miyake Y, Tanaka K, Sasaki S, Kiyohara C, Tsuboi Y, Yamada T, Oeda T, Miki T, Kawamura N, Sakae N, Fukuyama H, Hirota Y, Nagai M(2010) Alcohol drinking and risk of Parkinson’s disease: A case-control study inJapanBMC Neurol10: 19 |
19 | Nicoletti A, Pugliese P, Nicoletti G, Arabia G, Annesi G, Mari MD, Lamberti P, Grasso L, Marconi R, Epifanio A, Morgante L, Cozzolino A, Barone P, Torchia G, Quattrone A, Zappia M(2010) Voluptuary habits and clinical subtypes of parkinson’s disease: The FRAGAMP Case-Control StudyMov Disord25: 23872394 |
20 | Sipetic SB, Vlajinac HD, Maksimovic JM, Marinkovic JM, Dzoljic ED, Isidora S, Ratkov IS, Kostic VS(2012) Cigarette smoking, coffee intake and alcohol consumption preceding Parkinson’s disease: A case–control studyActa Neuropsychiatr24: 109114 |
21 | Behari M, Srivastava AK, Das RR, Pandey RM(2001) Risk factors of Parkinson’s disease in Indian patientsJ Neurol Sci190: 4955 |
22 | Hernán MA, Chen H, Schwarzschild MA, Ascherio A(2003) Alcohol consumption and the incidence of parkinson’s diseaseAnn Neurol54: 170175 |
23 | Palacios N, Gao X, O’Reilly E, Schwarzschild M, McCullough ML, Mayo T, Gapstur SM, Ascherio AA(2012) Alcoholand risk of parkinson’s disease in a large, prospective cohort of men and womenMov Disord27: 980987 |
24 | Sääksjärvi K, Knekt P, Männistö S, Lyytinen J, Jääskeläinen T, Kanerva N, Heliövaara M(2014) Reduced risk of Parkinson’s disease associated with lowerbody mass index and heavy leisure-time physical activityEur J Epidemiol29: 285292 |
25 | Wirdefeldt K, Gatz M, Pawitan Y, Pedersen NL(2005) Risk and protective factors for Parkinson’s disease: A study in Swedish twinsAnn Neurol57: 2733 |
26 | Liu R, Guo X, Park Y, Wang J, Huang X, Hollenbeck A, Blair A, Chen H(2013) Alcohol Consumption, Types of Alcohol, and Parkinson’s DiseasePLoS ONE8: 6e66452 |
27 | Paganini-Hill A(2001) Risk factors for Parkinson’s disease: The Leisure World cohort studyNeuroepidemiology20: 118124 |
28 | Kamel F, Tanner CM, Umbach DM, Chen H, Richardson G, Barber MR, Meng C, Marras C, Korell M, Kasten M, Hoppin JA, Comyns K, Chade A, Blair A, Bhudhikanok GS, Webster Ross G, William Langston J, Sandler DP, Tanner CM(2007) Pesticide Exposure and Self-reported Parkinson’s Disease in the Agricultural HealthStudyAm J Epidemiol165: 364374 |
29 | Hernán MA, Logroscino G, Rodríguez LA(2004) A prospective study of alcoholism and the risk of Parkinson’sdiseaseJ Neurol251: VII14VII17 |
30 | Tan L, Koh W, Yuan J, Wang R, Au WL, Tan JH, Tan EK, Yu MC(2008) Differential Effects of Black versus Green Tea on Risk of Parkinson’s Disease in the Singapore Chinese Health StudyAm J Epidemiol67: 553560 |
31 | Dwyer JT, Gardner J, Halvorsen K, Krall EA, Cohen A, Valadian I(1989) Memory of food intake in the distant pastAm J Epidemiol130: 10331046 |
32 | Greenfield TK, Kerr WC(2008) Alcohol Measurement Methodology in Epidemiology: Recent Advances and OpportunitiesAddiction103: 10821099 |
33 | Dawson DA(2003) Methodological issues in measuringalcoholuseAlcohol Res Health27: 1829 |
34 | Brighina L, Schneider NK, Lesnick TG, de Andrade M, Cunningham JM, Mrazek D, Rocca WA, Maraganore DM(2009) Alpha-synuclein, alcohol use disorders, and Parkinson disease: A case-control studyParkinsonism RelatDisord15: 430434 |
35 | Dhalla S, Kopec JA(2007) The CAGE Questionnaire for Alcohol Misuse: A Review of Reliability and Validity StudiesClin Invest Med30: 3341 |
36 | Bloomfield K, Stockwell T, Gmel G, Rehn N(2003) International comparisons of alcohol consumptionAlcohol Res Health27: 95109 |
37 | Room R(2000) Measuring drinking patterns: The experience of the last half centuryJ Subst Abuse12: 2331 |
Figures and Tables
Fig.1
Flow Diagram showing the selection process and results during the study screening process.
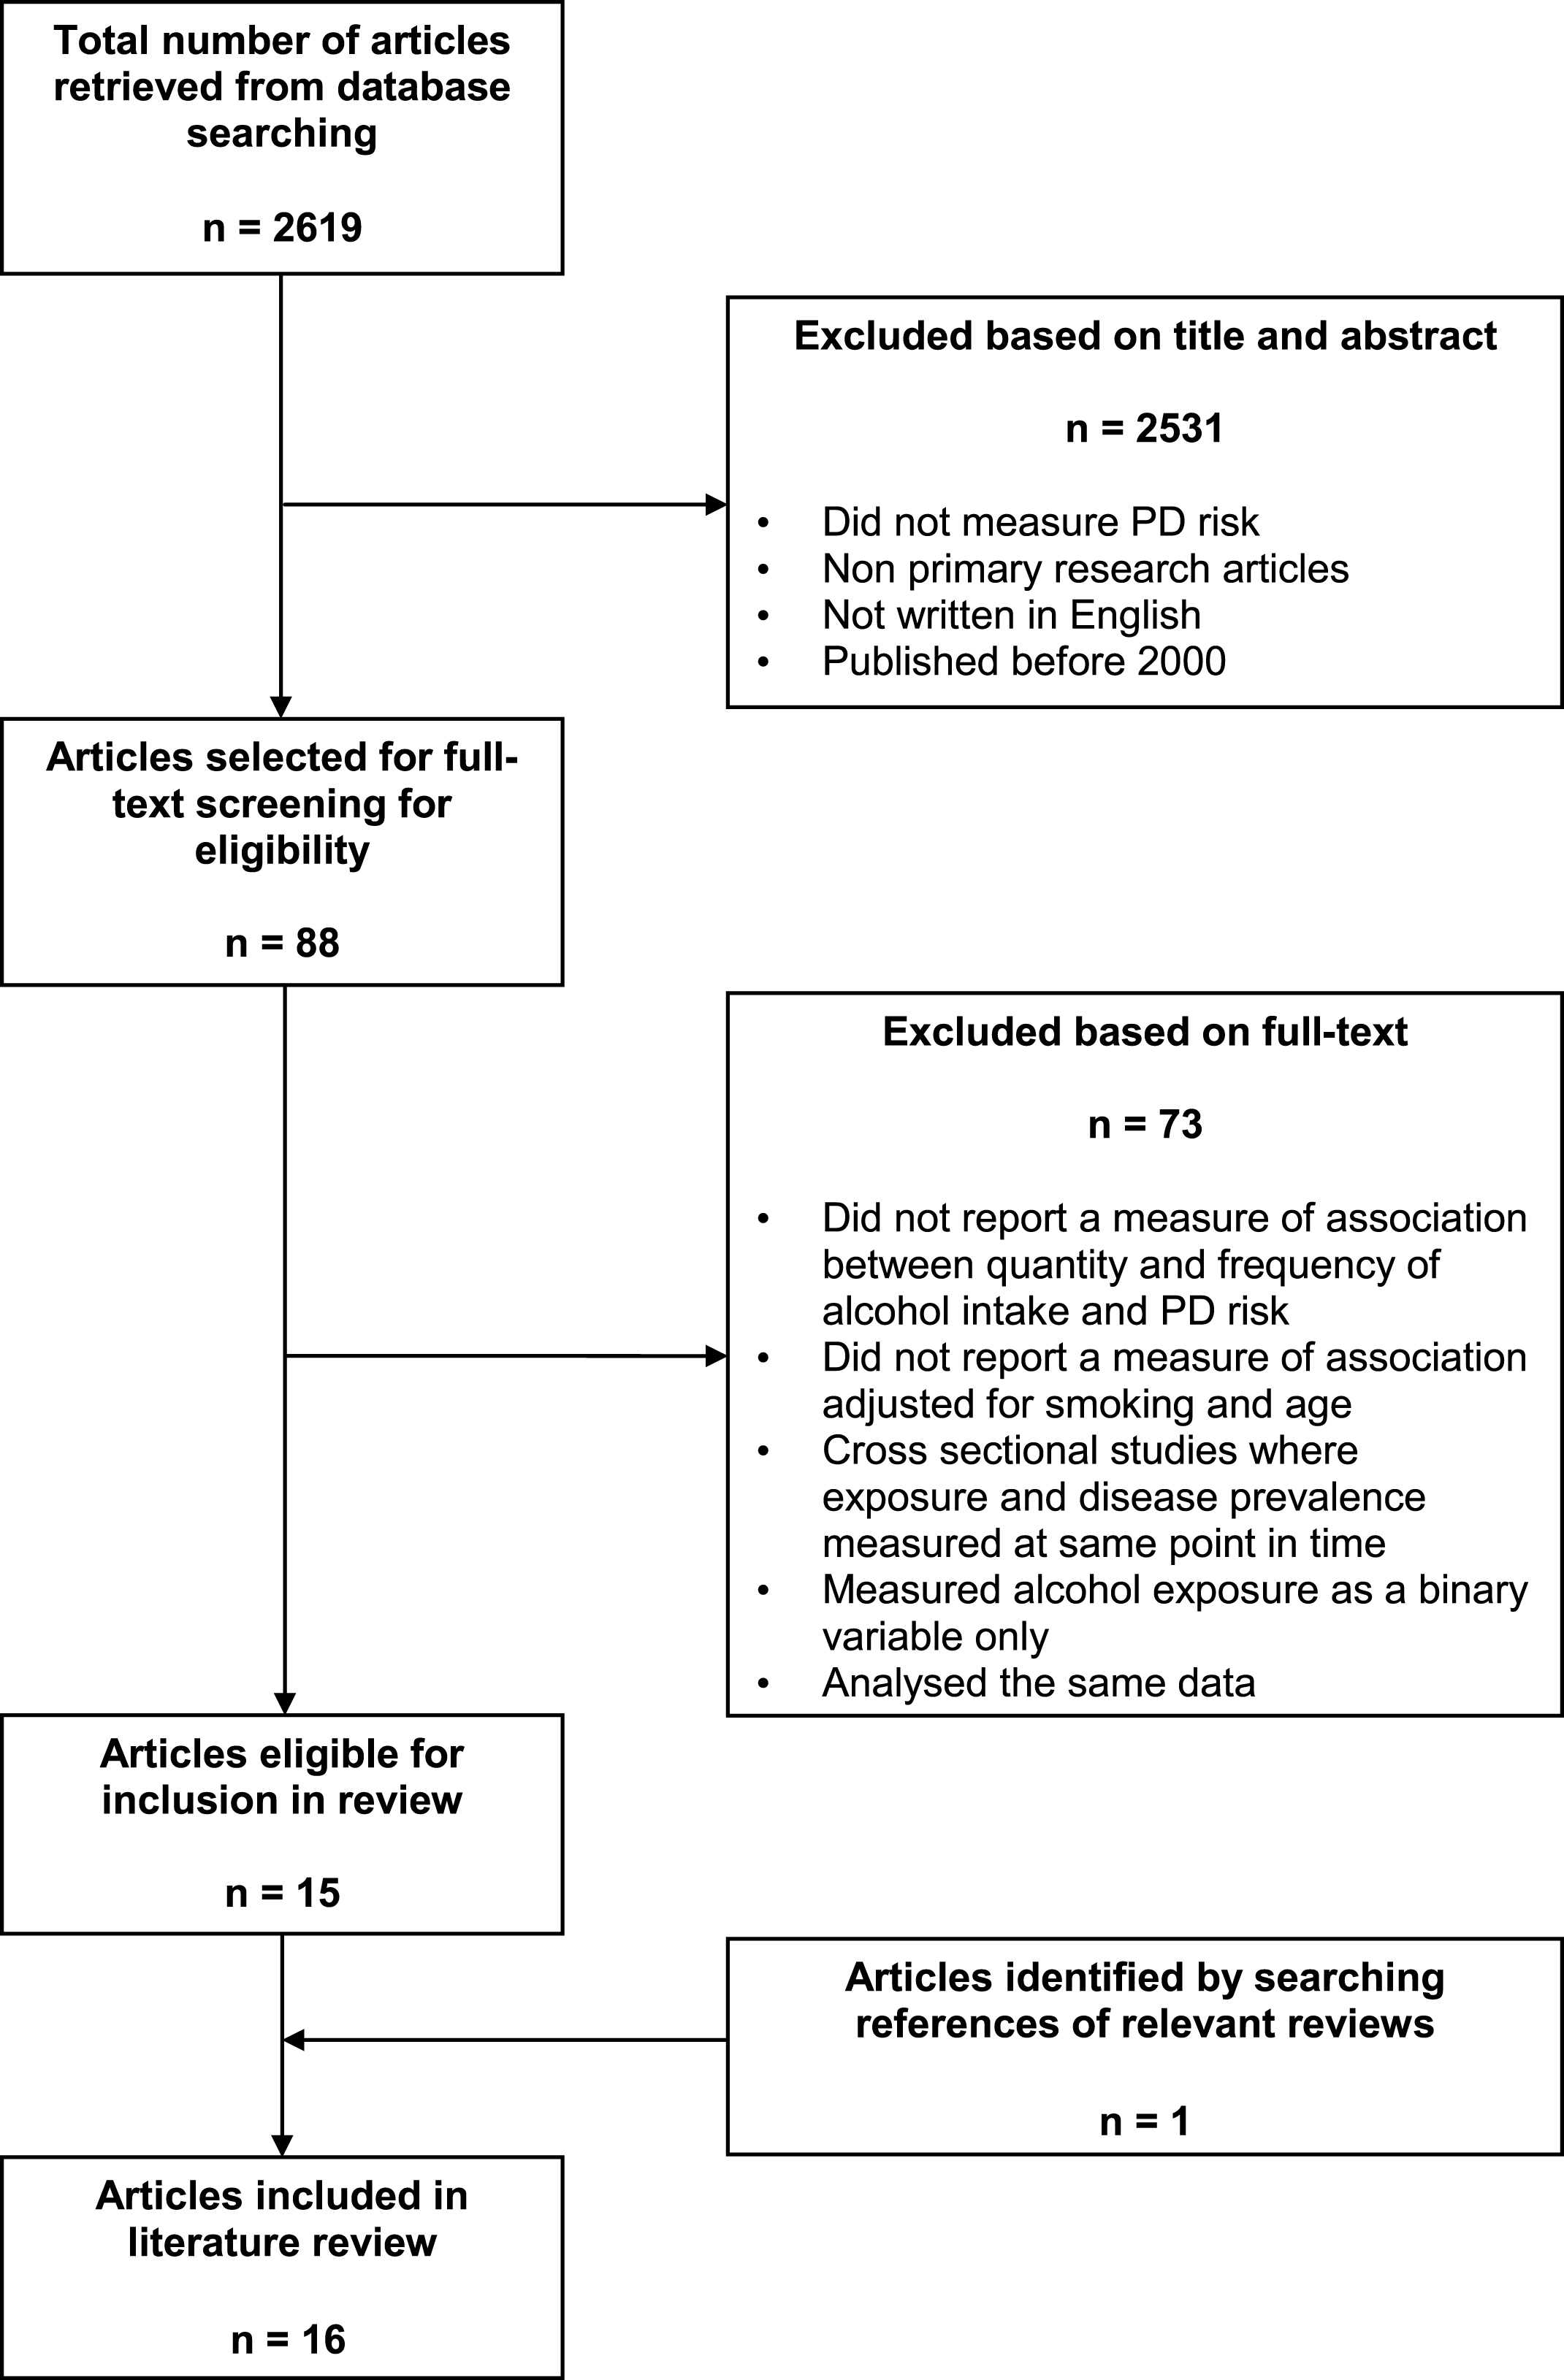
Table 1
Case-Control studies reporting associations between alcohol intake and PD risk
| Case-control studies | Location & inception | Cases | Controls | Measurement of exposure | Confounders adjusted for | Results OR (95% CI) |
| Checkoway et al. 2002 [16] | USA 1992–2000 | 210 incident PD cases. PD diagnosis by neurologist based on cardinal signs plus response to L-DOPA. Notes reviewed by authors, exclusion criteria included use of certain medications 12 months before diagnosis. 131 men and 79 women. Median age 70 (range 37–88) years. | 347 controls matched for age and gender, without progressive neurologic disorders, all eligible in HMO selected. 225 men and 122 women. Median age 71 (range 44–85) years. | Structured, in-person questionnaire by trained research staff. Typical consumption patterns during most of adult life. Alcohol drinks per week. | Age, ethnicity, education, gender, smoking, coffee | Alcohol (drinks/week) (reference = 0) 1–2 1.1 (0.7, 1.8) 3–9 1.1 (0.6, 1.7) ≥10 0.8 (0.4, 1.4) |
| Evans et al. 2006 [17] | UK Dates NR | 106 consecutive Caucasian PD outpatients meeting Queen Square Brain Bank criteria for PD and MMSE >26. the unified Parkinson’s disease rating scale (UPDRS) and daily L-dopa equivalent unit (LEU) dose. 65 men and 41 women. Mean age 65.3 years (range 38–81). Disease duration 11.1 (no units given). | 106 age and sex matched healthy controls, partners or friends of cases without PD or dementia, outpatients with minimally disabling dystonia or hemifacial spasm, remaining randomly selected from MRC Cognition and Brain Sciences unit healthy volunteer panel. Mean age 65.3 years (range 39–82). | Validated FFQ self-completed. Participants asked how often on average over past month they had consumed standard beverage specific portions. Alcohol units (8g) per week. | Sensation seeking, smoking, caffeine | Alcohol intake units */week 0 3.00 (0.34, 0.98) 0.1–14 0.89 (0.62, 1.31) >14 0.58 (0.34, 0.98) (0, 0.1–14, >14) 0.44 (0.26, 0.75) for each category of intake |
| Fukushima et al. 2010 [18] | Japan April 1, 2006 to March 31, 2008 | 214 cases recruited within 6 years of PD onset from 11 hospitals, diagnoses based on UK PD Society Brain Bank clinical diagnostic criteria by neurologists. 73 men and 141 women. Mean age 67.9 (SD 8.5) years. | 327 hospital-based controls selected from in- or out-patients without neurodegenerative disease. 114 men and 213 women. Mean age 66.4 (SD 8.6) years. | Self-administered questionnaire, questionnaire, missing data obtained by telephone or direct interview by research assistant. Peak frequency and quantity alcohol consumed during participant’s lifetime, beverage specific. | Sex, age, region of residence, smoking, years of education, body mass index, alcohol flushing status, medication histories and several dietary factors including caffeine | All categories (reference = non-drinker) Drinking on <6 days per week 1.29 (0.78, 2.13) ≥6 days per week 0.96 (0.50, 1.81) Amount ethanol (g) per day 0.1–65.9 1.07 (0.64, 1.80) ≥66.0 1.46 (0.79, 2.71) Amount ethanol (g) per week 0.1–219.3 0.98 (0.58, 1.65) ≥219.4 1.79 (0.95, 3.39) Beverage types (g) per day Beer 0.1–65.9 0.99 (0.61, 1.59) ≥66 2.13 (0.80, 5.82) Japanese sake 0.1–65.9 2.27 (1.34, 3.89) ≥66 3.39 (1.10, 11.0) Shochu 0.1–65.9 1.01 (0.50, 1.98) ≥66 1.29 (0.59, 2.78) Wine 0.1–65.9 1.06 (0.57, 1.95) ≥66 6.11 (0.67, 134) Whisky 0.1–65.9 1.60 (0.88, 2.93) ≥66 2.25 (0.67, 7.83) |
| Nicoletti et al. 2010 [19] | Italy January to December 2005 | 492 cases with possible and probable PD according to Gelb’s criteria. Participants with MMSE <24 excluded. 292 men and 200 women. Mean age 66 (SD 9.8). Mean disease duration 6.7 (SD 5.3) years. | 459 controls (274 spouse controls and 185 generic controls) Spouse controls lived in same geographic area with no PD or other neurological disorders. Generic controls were unrelated healthy people accompanying non-PD patients for hospital checkups. matched for age and area of residence. Participants with MMSE <24 excluded. 160 men and 299 women. Mean age 63.4 (SD 10.1). | Face-to-face interview using structured questionnaire by trained neurologists. Alcohol consumption (wine) reported as duration and quantity per day. | Family history, sex, age, place of residence, smoking, coffee consumption | Wine consumption Glasses per day (reference = none) 1-2 0.68 (0.47, 0.97) ≥3 0.45 (0.28, 0.74) Years of wine drinking (reference = none) 1–45 years 0.83 (0.55, 1.23) ≥46 years 0.45 (0.29, 0.68) |
| Sipetic et al. 2012 [20] | Serbia January 2001 to November 2005 | 110 incident PD cases. Diagnosis by neurologist based on presence of at least 2 cardinal signs plus response to L-DOPA and the unified Parkinson’s disease rating scale(UPDRS) 63 men and 47 women. Mean age 60.75 (SD 8.64). | 220 hospital controls were patients with degenerative joint or GI disease matched by sex, age and place of residence (urban/rural). 126 men and 94 women. Mean age 60.57 (8.78). | Face-to-face interview by physicians using structured questionnaire. Quantity and frequency of alcohol consumption and beverage type. | Smoking, coffee | Alcohol consumption Average weekly consumption (dl) 0, 0.1–3.49, 3.5+ 4.68 (2.79, 7.84) |
| Behari et al. 2001 [21] | India January 1994 to December 1998 | 377 incident and prevalent PD patients attending Movement Disorders Clinic in New Delhi. Diagnosis based on a) presence of > 2 out of bradykinesia, rigidity and rest tremor, b) chronic progressive course, c) good response to L-DOPA, d) no history of possible causes of parkinsonism, e) exclusion of atypical features suggesting forms of parkinsonism. 301 men and 76 women. Mean age 56.78 (range 24-86 years). Mean age of onset of symptoms 52.33 ± 11.63 years. | 377 hospital-based controls matched for age (±3 years) with other neurological diseases attending out-patient clinic of Neurology department New Delhi. 271 men and 106 women. Mean age 56.62 (range 23–83years). | Face-to-face interview by trained investigator using a standard structured questionnaire. Duration of alcohol intake. Alcohol considered positive if subjects consumed 30ml of alcohol per day for at least a year. | Gender, family history of PD, smoking, well water drinking, pets exposure, prior depression | Alcohol consumption (reference = none) ≤ 20 years 0.45 (0.20, 1.01) >20 years 1.48 (0.82, 2.65) |
| Brighina et al. 2009 [34] | USA 1996–2006 | 893 PD patients from 5 states of USA referred to Mayo Clinic, Rochester MN Neurological diagnosis using previously reported criteria. Minimal Mental State examination (MMSE) and screening with The Modified Telephone Interview for Cognitive Status (TICS-M). 557 men and 336 women. Median age 67.9 (range 32.8–91.4) years. Median age at onset of PD 62.1 (range 23.3–88) years. | 514 controls PD negative/unaffected siblings of cases and 379 unrelated population controls screened for PD by telephone. Screen positives underwent clinical assessment. 490 men and 403 women. Median age 67.2 (range 32–92.8) years. | Telephone interview using structured questionnaire. Alcohol Use Disorders using CAGE defined as score >2, drinking patterns quantity frequency measures. Subjects also asked whether they had ever received medical treatment, had liver problems or been hospitalised because of their alcohol use. | Age, sex, education, coffee and smoking | Alcohol use disorders CAGE score 0.63 (0.43, 0.93) Medical history 0.52 (0.25, 1.08) |
Abbreviations: CAGE = Cut-down, Annoyed, Guilty, Eye-Opener; DL = decilitre; FFQ = Food Frequency Questionnaire; G = grams; GI = gastrointestinal; HMO = Health Management Organisation; MMSE = Mini-Mental_State_ Exam; MN = Minnesota; MRC = Medical Research Council; NR = not reported; OR = odds ratio; PD = Parkinson’s disease; SD = standard deviation; *unit = 8 grams.
Table 2
Prospective studies reporting associations between alcohol intake and PD risk
| Cohort studies | Location &study start | Participants Participants | Measurement of exposure | Measurement of outcome | Confounders adjusted for | RR (95% CI) | |
| Hernán et al. 2003 [22] Nurses’ Health Study | USA 1976 | Female nurses, aged 30-55 years. 88,722 eligible and followed-up over 18 years. Diagnosis was confirmed by the treating neurologist, review of medical records and by treating internist 167 PD cases identified. Mean age at PD onset 63.5. | At baseline (1980) and every 2–4 years using a validated semi-quantitative FFQ. How often, on average, participants had consumed beer, wine, and liquor during the past year. | PD self-reported on follow-up questionnaires sent every 2 years until May 1998. Confirmed with treating neurologists or medical records. Cases confirmed if medical record included a diagnosis by a neurologist, or presence of 2 out of 3 cardinal signs and absence of features suggesting other diagnoses. Those with PD symptoms before study inception excluded. | Age, sex, caffeine, smoking. Alcoholic beverages also adjusted for other beverage types. | Alcohol intake (gm/day) (reference = 0) | |
| >0 to <5 0.9 (0.6, 1.3) 518,822 person/years f/up | |||||||
| 5 to <15 1.0 (0.6, 1.5) 344,588 person/years f/up | |||||||
| 15 to <30 1.5 (0.8, 2.6) 105,867 person/years f/up | |||||||
| ≥30 1.0 (0.4, 2.2) 76,285 person/years f/up | |||||||
| Number of drinks (reference = <1/month) | |||||||
| Beer | |||||||
| 1–3/month 0.8 (0.5, 1.5) 142,994 person/years f/up | |||||||
| ≥1/week 0.7 (0.4, 1.2) 173,102 person/years f/up | |||||||
| Wine | |||||||
| 1–3/month 1.0 (0.7, 1.6) 357,385 person/years f/up | |||||||
| 1–4/week 1.0 (0.6, 1.6) 327,970 person/years f/up | |||||||
| ≥5/week 1.4 (0.8, 2.3) 133,783 person/years f/up | |||||||
| Liquor | |||||||
| 1–3/month 0.8 (0.5, 1.3) 279,724 person/years f/up | |||||||
| 1–4/week 1.0 (0.6, 1.6) 245,273 person/years f/up | |||||||
| ≥5/week 1.3 (0.7, 2.1) 105,031 person/years f/up | |||||||
| Hernán | USA | Male health | At baseline | PD self-reported on follow-up | Age, sex, | Alcohol intake (gm/day) (reference = 0) | |
| et al. | 1986 | professionals, aged | (1986) and | questionnaires sent every 2 years | caffeine, | >0 to <5 1.0 (0.7, 1.5) 147,674 person/years | |
| 2003 [22] | 40–75 years. 47,367 | every 2–4 years | until January 2000. Confirmed | smoking. | f/up | ||
| Health | eligible and followed- | using a | with treating neurologists or | Alcoholic | 5 to <15 1.1 (0.8, 1.5) 167,216 person/years | ||
| Professionals’ | up over 14years. | validated semi- | medical records. Cases | beverages also | f/up | ||
| Follow-up | 248 PD cases | quantitative | confirmed if medical record | adjusted for | 15 to <30 0.9 (0.6, 1.4) 76,956 person/years f/up | ||
| Study | identified. Mean age | FFQ. How often, | included a diagnosis by a | other beverage | ≥30 0.6 (0.4, 1.1) 70,087 person/years | ||
| at PD onset 69.5. | on average, | neurologist, or presence of 2 out | types | f/up | |||
| participants | of 3 cardinal signs and absence | ||||||
| had consumed | of features suggesting other | Number of drinks (reference = <1/month) | |||||
| beer, wine, and | diagnoses. Those with PD | Beer | |||||
| liquor during | symptoms before study | 1–3/month 0.6 (0.4, 0.9) 107,852 person/years | |||||
| the past year. | inception excluded. | f/up | |||||
| 1–4/week 0.7 (0.5, 1.0) 155,369 person/years | |||||||
| f/up | |||||||
| ≥5/week 0.8 (0.5, 1.2) 74,637 person/years | |||||||
| f/up | |||||||
| Wine | |||||||
| 1–3/month 1.4 (1.0, 1.9) 153,089 person/years | |||||||
| f/up | |||||||
| 1–4/week 1.2 (0.8, 1.8) 162,555 person/years | |||||||
| f/up | |||||||
| ≥5/week 0.8 (0.4, 1.5) 47,129 person/years | |||||||
| f/up | |||||||
| Liquor | |||||||
| 1–3/month 1.2 (0.8, 1.9) 96,397 person/years | |||||||
| f/up | |||||||
| 1–4/week 1.6 (1.0, 2.1) 125,552 person/years | |||||||
| f/up | |||||||
| ≥5/week 1.0 (0.7, 1.6) 94,687 person/years | |||||||
| f/up | |||||||
| Palacios | USA | 132,403 recruited from | Alcohol | PD self-reported on 2001, 2003 or | Age, smoking, | Alcohol intake (gm/day) (reference = 0) | |
| et al. | 1992 | 21 US states with | consumption in | 2005 follow-up questionnaires. | coffee | Men | |
| cancer registries, | previous year | Confirmed by diagnostic | >9.9 1.36 (1.06, 1.74) 239,705 person/years | ||||
| Cardinal criteria, | at baseline | questionnaire completed by | f/up | ||||
| diagnostic | (1992-1993) | treating neurologist and medical | 10-19.9 1.48 (1.09, 2.01) 110,309 person/years | ||||
| questionnaire/ | and assessed | record review for diagnosis by | f/up | ||||
| medical records/ | again in 1999. | neurologist or presence of at | 20-29.9 1.15 (0.69, 1.9) 37,078 person/years | ||||
| finite diagnosis | Self-completed, | least 2 out of 4 cardinal signs | f/up | ||||
| confirmed by | validated Block | (one being rest tremor or | ≥30 1.29 (0.9, 1.86) 85,072 person/years | ||||
| neurologist. | FFQ, quantity | bradykinesia), progressive course, | f/up | ||||
| Mean age at baseline | and frequency | response to dopaminergic | |||||
| 63.5 (men) and 61.8 | alcohol | treatment and absence of | Women | ||||
| years (women). 605 | consumed | features suggesting alternative | <4.9 0.95 (0.68, 1.31) 252,206 person/years | ||||
| PD cases identified | recorded for | diagnosis. Those with PD | f/up | ||||
| (389 men and 216 | separate | symptoms before study inception | 5-9.9 0.95 (0.57, 1.6) 83,315 person/years | ||||
| women). Mean age | beverages. | excluded. | f/up | ||||
| at PD diagnosis 72.6 | 10-14.9 1.67 (1.06, 2.64) 65,984 person/years | ||||||
| (men) and 72.2 years | f/up | ||||||
| (women). | ≥ 15 0.77 (0.41, 1.45) 77,163 person/years | ||||||
| Follow -up from 13 | f/up | ||||||
| years preceding | |||||||
| diagnosis to 6 years | |||||||
| after diagnosis. | |||||||
| Saaksjarvi | Finland | 6,715 participants in | At baseline self- | PD cases (ICD-10 code G20) | Age, sex, | Alcohol intake gm/day (reference = 0) | |
| et al. 2014 [24] | 1973– | survey aged 50–79 | administered | ascertained through national | education, | <5 1.94 (1.09, 3.47) | |
| Finnish | 1976 | years. | health | registry of Social Insurance | community | ≥ 5 1.12 (0.47, 2.69) | |
| Mobile | Health Examination | Ten questions | independent neurologist by | urban), | |||
| Clinic Health | Survey and | on amount, | medical record review, using | occupation, | |||
| Examination | Parkinson’s disease | frequency and | NINDS diagnostic criteria for PD. | coffee | |||
| Survey | cases (ICD-10 code | beverage type. | First 10 years follow-up excluded. | consumption, | |||
| G20). Reports and | Short-term | smoking, BMI | |||||
| selected hospital | repeatability | and leisure time | |||||
| records reviewed. No | assessed. | physical activity | |||||
| neuropathologic data | |||||||
| available 101 cases | |||||||
| PD identified. follow- | |||||||
| up of,22 years; | |||||||
| average follow-up | |||||||
| time 15.3 years. | |||||||
| Liu et al. | USA | 306, 895 participants | Baseline survey | Self-reported lifetime diagnosis of | Age, sex, race, | Alcohol intake ( *drinks/day) (reference = 0) | |
| 2013 [26] | 1995– | included (180,235 | on diet and | PD of survivors in 2004-2006. | education, | <1 0.91 (0.78, 1.06) | |
| NIH-AARP | 1996 | male and 126, 660 | lifestyle in 1995– | Cases reported from 2000 to | marital status, | 1–1.99 0.82 (0.66, 1.02) | |
| Diet and | female), ages 50–71 | 1996. | present included in analysis. Self- | smoking, | 2–2.99 1.13 (0.84, 1.53) | ||
| Health Study | years at baseline. | Past year | report validated against treating | caffeine intake, | 3–3.99 1.15 (0.81, 1.65) | ||
| 1,113 PD cases; | alcohol | physicians completed diagnostic | physical | 4–4.99 1.06 (0.65, 1.72) | |||
| 305,782 without PD. | consumption | questionnaire and medical | activity, self- | ≥5 0.92 (0.66, 1.28) | |||
| Validated diagnosis | using validated | record review for diagnosis by | evaluated | P for trend = 0.63 | |||
| with DNA collection | self- | neurologist or presence of 2 or | health status. | Beer | |||
| as well as | administered | more cardinal signs (one being | OR for specific | <1 0.79 (0.68, 0.92) | |||
| Physician/neurologist | 124 item FFQ. | rest tremor or bradykinesia), | alcoholic | 1-1.99 0.73 (0.50, 1.07) | |||
| questionnaire | Quantity, | progressive course, response to | beverages also | ≥2 0.86 (0.60, 1.21) | |||
| Follow-up approx.10 | frequency | dopaminergic treatment and | adjusted for | P for trend = 0.78 | |||
| years | recorded for | absence of features suggesting | other beverage | Wine | |||
| separate | alternative diagnosis. | types | <1 1.07 (0.92, 1.25) | ||||
| beverages. | 1–1.99 0.74 (0.53, 1.02) | ||||||
| ≥2 1.31 (0.89, 1.94) | |||||||
| P for trend = 0.82 | |||||||
| Liquor | |||||||
| <1 1.06 (0.91, 1.23) | |||||||
| 1–1.99 1.22 (0.94, 1.58) | |||||||
| ≥2 1.35 (1.02, 1.80) | |||||||
| P for trend = 0.03 | |||||||
| Tan et al. | Singapore | 63,218 Chinese men | Face to face | PD self-reported at follow-up | Age, year of | At least weekly consumption vs none or <weekly | |
| 2008 [30] | 1993– | and women, aged | interview by | interviews on average 7 years | interview, | RR 0.6 (0.31, 1.16) 594,086 person/years f/up | |
| Singapore | 1998 | 45–74 years. 157 PD | trained | after enrolment, or from hospital | gender, | ||
| Chinese | cases identified. Most | interviewers at | registries. Confirmed by medical | ethnicity, | |||
| Health Study | cases initially | baseline, using | record review by movement | education | |||
| evaluated by either | validated FFQ. | disorder specialist using NINDS | level, smoking, | ||||
| movement disorder | Quantity, | diagnostic criteria. PD before | caffeine, black | ||||
| specialists or | frequency | study inception excluded. | tea | ||||
| neurologists. All | recorded for | Average time between baseline | |||||
| medical records | separate | and PD diagnosis 5.5 (SD 2.9) | |||||
| reviewed by | beverages. | years. | |||||
| movement disorder | |||||||
| specialist using criteria | |||||||
| defined by the | |||||||
| Advisory Council of | |||||||
| the US National | |||||||
| Institute of | |||||||
| Neurological Disorders | |||||||
| and Stroke | |||||||
| Mean age at | |||||||
| diagnosis 67.3 (SD 7.3) | |||||||
| years. | |||||||
| Follow up years | |||||||
| unclear, | |||||||
| Wirdefeldt | Sweden | Swedish Twin | 476 PD cases: twins with | Two control groups: | Validated questionnaire | Smoking, | Alcohol intake gm/day |
| et al. | 1961 | Registry. Same-sex | PD identified using ICD | 1. External unrelated to | self-administered. Alcoho | coffee, | (reference=0) |
| 2005 [25] | and | twins who | criteria recorded in the | cases selected at | consumption categorised | education | External controls |
| 1973 | responded to a | Swedish IDR or the CDR, | random from cohort | into never and ever | 0–5 0.72 (0.52, 0.99) | ||
| questionnaire in | after exposure information | matched for sex and | drinkers and total alcohol | 6–15 1.05 (0.74, 1.50) | |||
| 1961 (for those born | collected. 230 men and | age (±5 years) (n = | intake in grams per day, | 16–30 0.94 (0.52, 1.71) | |||
| between 1886 and | 246 women. Only 330 | 2,380). | from beer, wine, or spirits. | >30 0.66 (0.34, 1.29) | |||
| 1925) and 1973 (for | cases included in | 2. Same-sex co-twins of | |||||
| those born | multivariate analysis due | cases discordant for PD | Co-twin controls | ||||
| between 1926 and | to missing data (244 in co- | (n = 244). | 0–5 0.61 (0.34, 1.11) | ||||
| 1958). | twin analysis). | All controls were | 6–15 0.83 (0.44, 1.57) | ||||
| required to be ≥66 | 16–30 0.58 (0.21, 1.57) | ||||||
| years of age. | >30 0.72 (0.19, 2.65) | ||||||
| PaganiniHill | USA | Leisure World | 395 PD cases identified by | 2,320 controls | Self-completion health | Smoking, | Alcohol, drinks/day |
| 2001 [27] | 1981– | Cohort. | review of hospital | individually matched | survey. Consumption of | blood | ≤1 1.03 (0.76, 1.38) |
| 1985 | Homeowners in | discharge records, death | to cases on sex, birth | alcoholic beverages on | pressure | 2+ 0.77 (0.58, 1.03) | |
| retirement | certificates and 1992 | date, vital status and if | average weekday asked | medication, | |||
| community who | follow-up questionnaire. | dead, death date (±1 | separately for wine, beer | no. | |||
| returned a | 26 cases appeared to | year). (2,243 controls | and hard liquor, | children, | |||
| questionnaire in | have PD at baseline. (373 | included in analysis | combined to form overall | coffee, | |||
| 1981–1985. | cases included in | due to missing values). | amount of alcohol | dietary | |||
| Predominantly | multivariate analysis due | consumed. | vitamin C, | ||||
| white, well | to missing values). | vitamin A | |||||
| educated. | |||||||
| Kamel | USA | Agricultural Health | 78 cases (22 were | 55,931 controls who did | Questionnaire self- | Age at | Drinks per month |
| et al. | 1993– | Study cohort. | spouses). Self-reports of | not self-report a | administered or by | enrolment, | (reference = non-drinker) |
| 2007 [28] | 1997 | Licensed pesticide | physician-diagnosed PD | diagnosis of PD at | telephone. Number of | state, type | 1–10 1.1 (0.7, 2.0) |
| applicators (mostly | at follow-up telephone | follow-up telephone | alcoholic drinks per month | of | 11–30 0.8 (0.3, 2.2) | ||
| farmers) and their | interview, 5 years after | interview. (52,945 | during year preceding | participant | ≥31 1.3 (0.5, 3.3) | ||
| spouses, from 2 | enrolment. Prevalent | controls included in | enrolment. | (applicator | |||
| states, enrolled in | cases at enrolment were | analysis due to missing | or spouse), | ||||
| 1993–1997. 68% | excluded. (71 cases | data). | smoking | ||||
| followed-up. | included in analysis due to | ||||||
| missing data). | |||||||
| Hernán | UK | Individuals with at | 1,019 PD cases identified. | 10,123 randomly | Diagnosis of alcoholism, or | Smoking | Clinical alcoholism |
| et al. | January | least three years of | Cases had computerised | selected controls, | alcohol-related chronic | 1.09 (0.67, 1.78) | |
| 2004 [29] | 1995– | continuous medical | diagnosis of PD and ≥2 | matched on age (±1 | disease (for cases before | ||
| 2000 | history recorded in | prescriptions for PD drugs. | year), sex and start | date of PD symptoms, | Units **/week | ||
| the GPRD between | 7% PD cases validated by | date. | diagnosis or prescription | (reference =0) | |||
| 1995–2000. Those | physicians. Presence of at | for PD-related drug) which | 0–5 1.10 (0.91, 1.33) | ||||
| with PD or | least 2 of 4 cardinal signs | was not subsequently | >5–15 1.10 (0.89, 1.36) | ||||
| prescribed PD- | in medical records. | withdrawn. Alcohol units | >15–30 1.27 (0.96, 1.68) | ||||
| related drugs at | per week self-reported to | >30–50 0.57 (0.28, 1.18) | |||||
| start of follow-up | GPs. | >50 1.46 (0.69, 3.01) |
Abbreviations: CDR = Cause of Death Register; FFQ = food frequency questionnaire; F/UP = follow-up; GM = grams; GPRD = General Practice Research Database; GPs = general practitioners; ICD = International Classification of Disease; IDR = Inpatient Discharge Register; NIH-AARP = National Institute of Health - American Association of Retired Persons; NINDS = National Institute of Neurological Disorders and Stroke; OR = odds ratio; PD = Parkinson’s disease; RR = relative risk; * drink = 13 grams alcohol; ** unit = 10ml pure ethanol.


