
Growing solid deuterium for UCN production
Abstract
We have experimentally studied growing a large (about 1 liter) ortho-deuterium crystal in a real UCN source cryostat and recorded the growing process optically using a camera. The best quality was observed when growing the crystal directly from a vapor phase. The crystal was grown at different mass flows of deuterium and annealed at different temperatures. Optimum conditions were found for both, obtaining an optically transparent crystal and cooling it down with minimal damage. We found that the quality, final shape and changes during annealing of the crystal are very much dependent on the temperature profile of the cryostat walls.
1.Introduction
Deuterium is one of the best slow-neutron source materials due to its effective moderating properties and low absorption cross section [23]. It is intensively used for the production of cold neutrons (CN) [1,7,9] and ultra-cold neutrons (UCN) [4,11,12,25,31] and is proposed to be used for very cold neutron (VCN) sources as well [2]. Nevertheless, there is a distinctive difference between CN and UCN sources: the former use liquid deuterium, while latter benefit tremendously from increased UCN production cross section of solid deuterium [24]. The caveat is that the internal structure of solid deuterium crystal can affect significantly the neutron yield by decreasing it below theoretically predicted value.
In general, this is related to the fact that the lower the neutron energy, the higher probability of losses and shorter the absorption length. Indeed, the absorption length,
Another difference between CN and UCN sources is their figures of merit: for cold neutrons it is usually integral neutron flux or brightness, while for UCN sources in most cases it is the neutron density
To estimate the UCN density in the experiment,
2.Solid deuterium properties related to ultra-cold neutron production
In this section we will review several properties, important for understanding our results on growing a solid deuterium crystal (
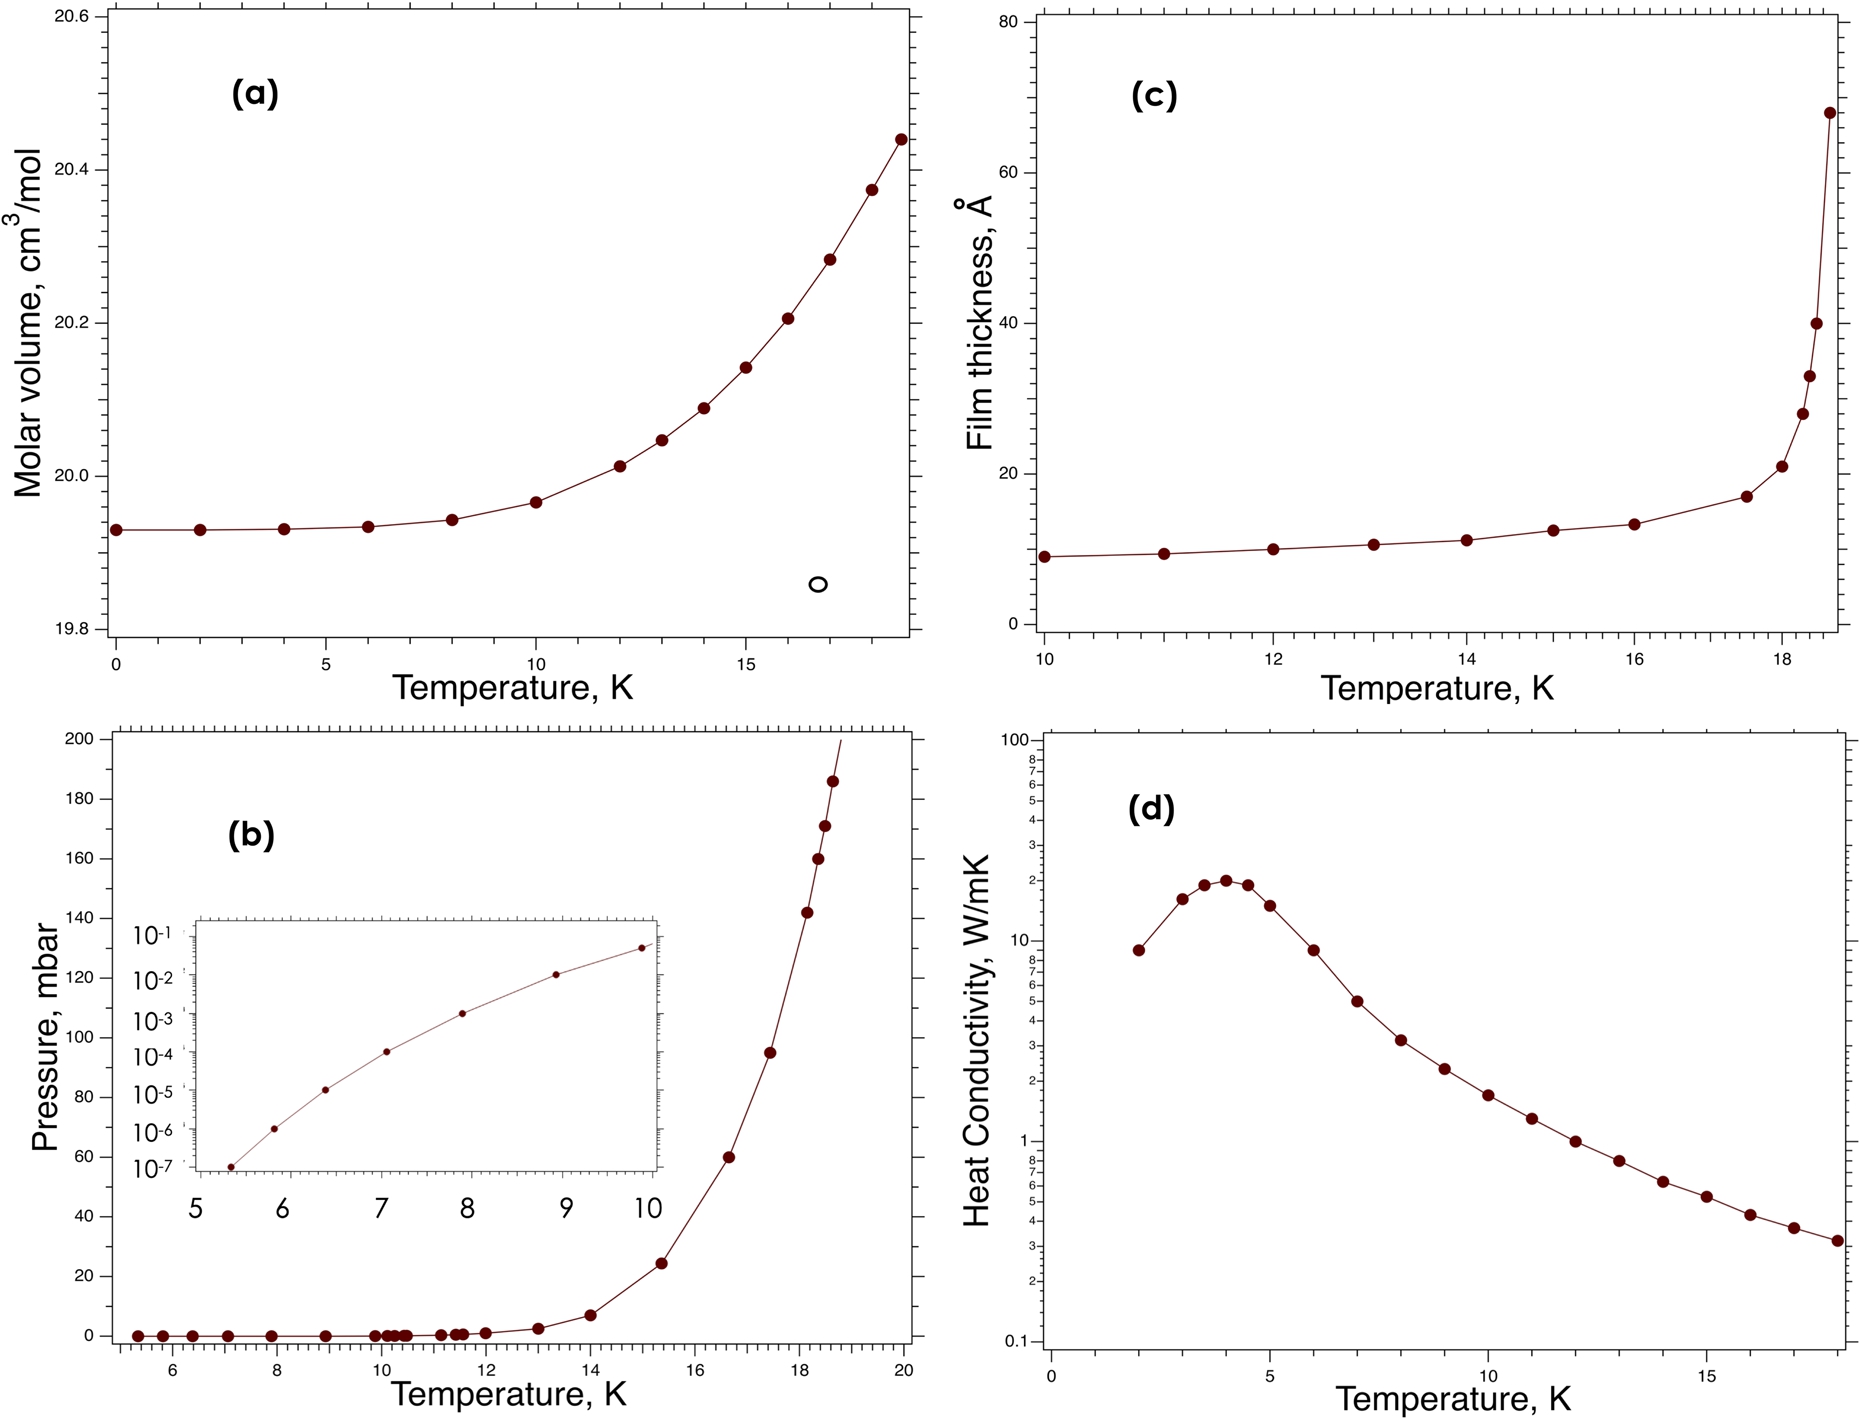
Fig. 1.
Temperature dependent properties of solid deuterium below the triple point: (a) – molar volume; (b) – saturated pressure; the insert shows it (also in mbar) below 10 K on a logarithmic scale; (c) – film thickness; (d) – heat conductivity.
In connection with UCN production, we also need to mention that only the ortho-deuterium spin species must be used to avoid additional losses. Indeed, ultra-cold neutrons are produced not by the moderation process, which results in thermal equilibrium of neutrons with the moderator. UCN in
Important thermodynamic properties of
Fig. 2.
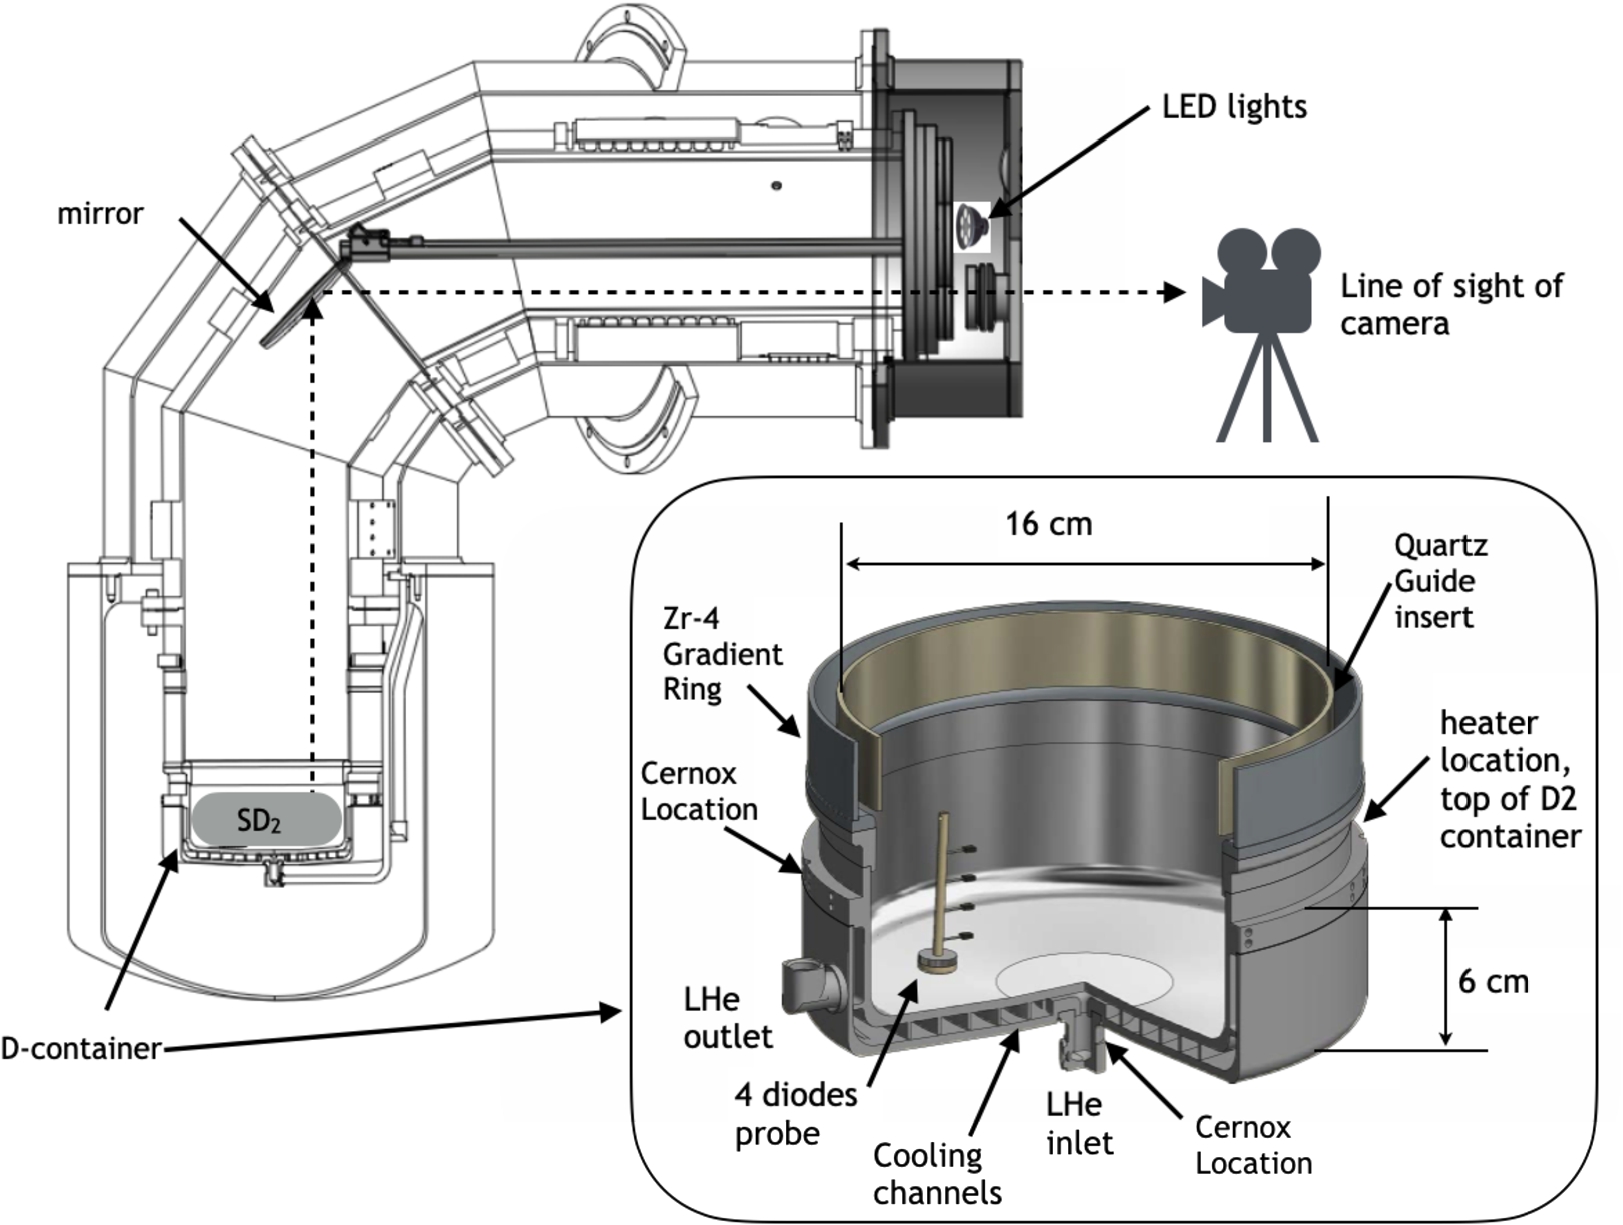
Cross-sectional view of the experimental set-up: the camera was located outside the vacuum jacket; a warm optical window was mounted on the vacuum jacket, another one on the cold cryostat flange; LED light source was mounted inside the vacuum jacket; a mirror with an adjustable angle was located inside the inner vacuum. Deuterium was solidified in the D-container at the bottom part of the cryostat. The insert shows a 3D-rendering of the D-container including locations of the instrumentation: a heater made of NiCr wire; two Cernox temperature sensors, one located at the LHe inlet, another just below the heater on the outer wall of the container; a holder made of PEEK with 4 calibrated diodes ( lakeshore, DT-670-SD ) separated vertically by 1 cm and positioned inside the container to probe temperatures directly inside the
3.Experimental setup overview
For optical Raman studies small single hydrogen crystals of several
The overall design of the PULSTAR UCN source is described in [15]. The source is designed to be installed inside the former thermal column of the reactor. Nevertheless, flexibility of the helium transfer lines allowed us to assemble the source cryostat outside the biological shield and test the growing of
To monitor temperatures, there were three Cernox sensors located at the inlet (one sensor) and at the top of the container just below the gradient ring (two sensors). The temperature of the exhaust helium was measured by a diode located in the LHe transfer line about 3 meters away. In addition, specially for the present test a plastic holder with four calibrated diodes (Lakeshore, DT-670-SD) was positioned inside the D-container to probe temperatures directly inside the deuterium. The diodes were separated vertically by 1 cm and are labeled by their distance from the bottom of the container as 1 cm, 2 cm, 3 cm and 4 cm. These diodes were providing temperatures in the bulk, while surface temperature (when not condensing) was characterized by gas independent pressure gauges. To control the cryostat temperature and to facilitate melting and evaporation, a heater made from NiCr wire was placed in the groove just below the gradient Zr-4 ring.
4.Growing solid deuterium at different temperatures
We have studied
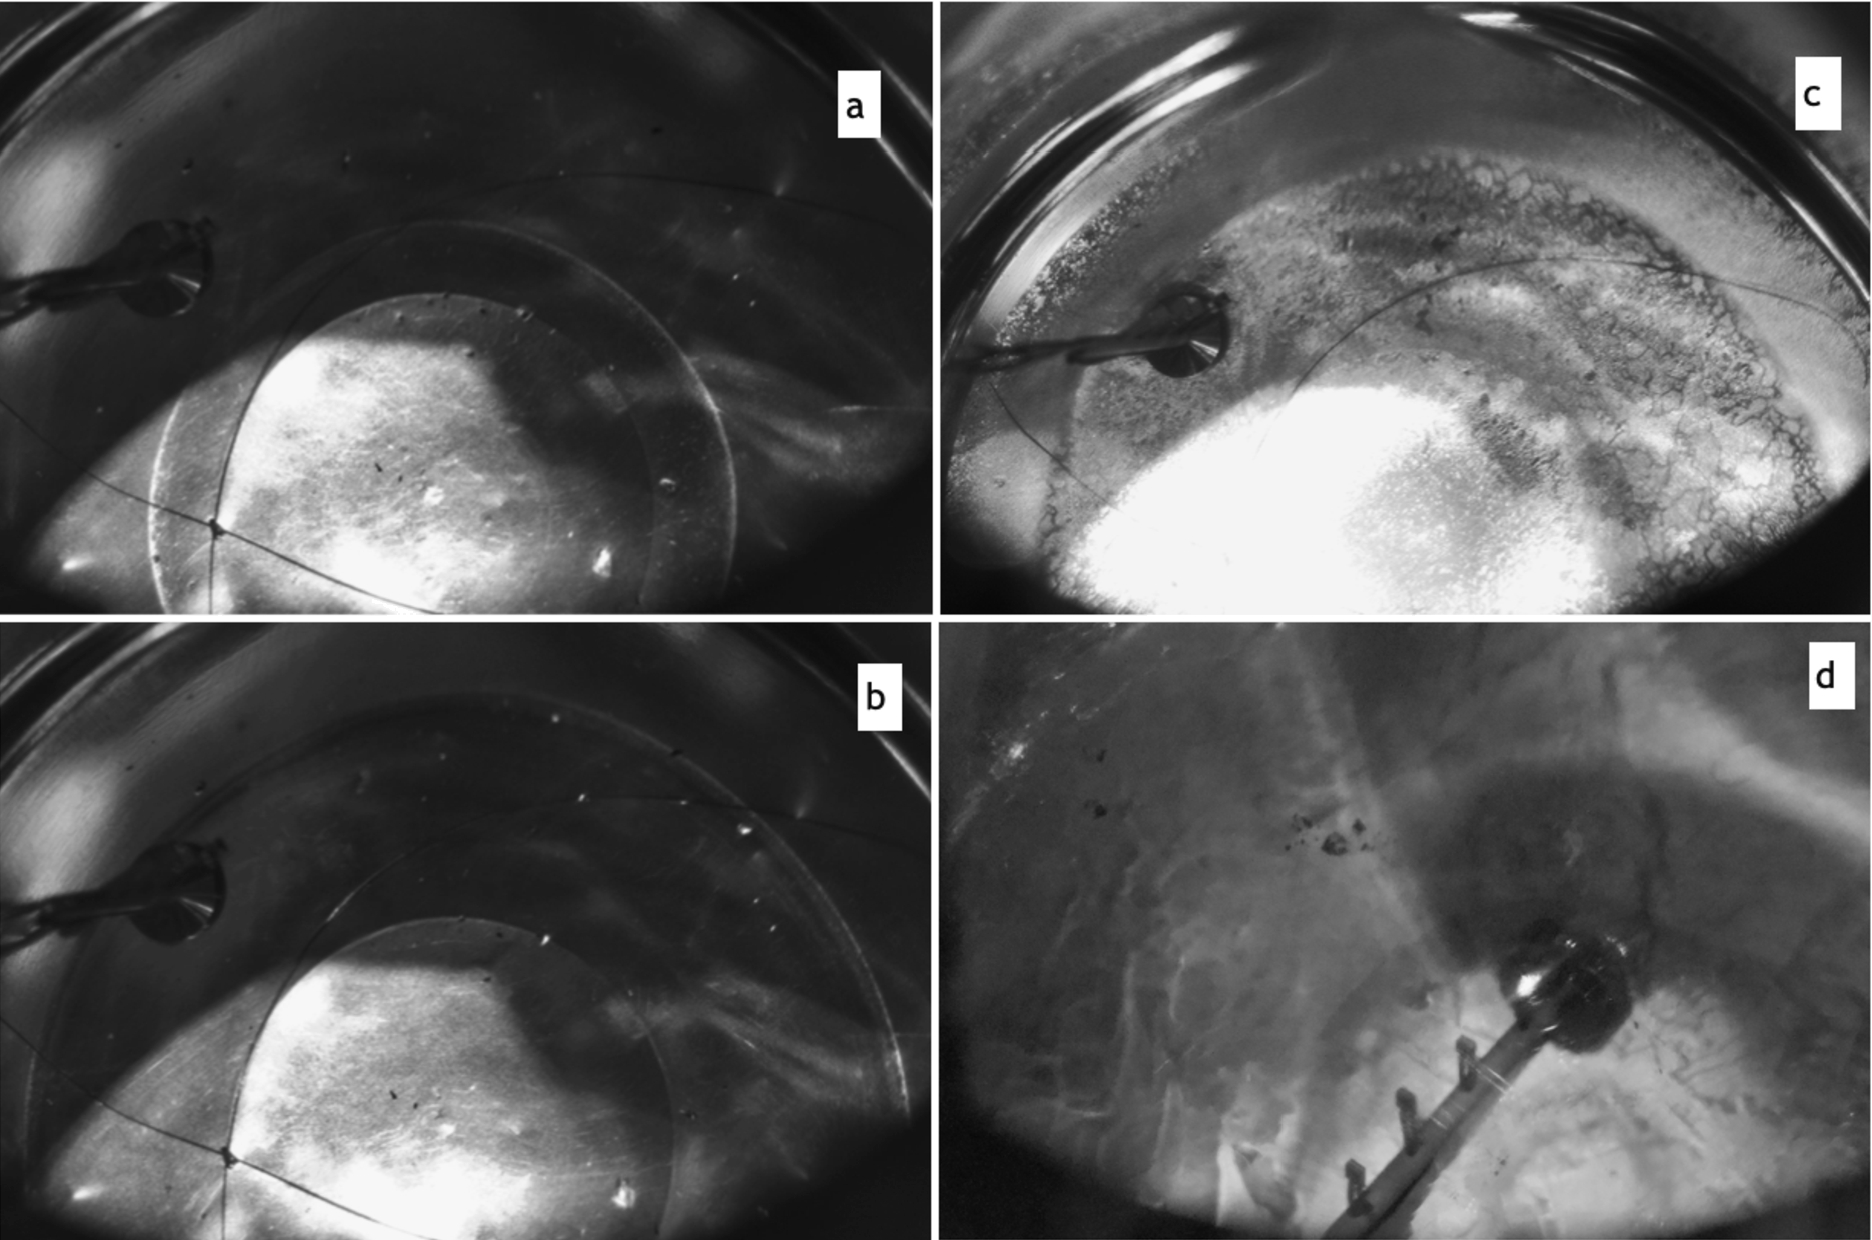
Fig. 3.
Crystal growth in the low-temperature range. (a) – and (b) – different stages of condensation at deuterium flow of 0.3 l/min, (c) – after accidental

4.1.Low temperature range
The low-temperature deuterium deposition was motivated by the Mainz UCN source mode of operation [27]. This facility has a horizontal geometry of the cryostat and can deposit deuterium only from vapor at an operational temperature of the source around 7 K. The Mainz team had tested different deuterium flow modes, verifying crystal quality by the observed UCN yield but without optical control [18]. The best results were obtained with a “slow deposition” rate of about < 3 mm/h at a flow rate of about 0.3 stl/min. In our setup, the goal was to verify the optical crystal quality at similar conditions. The first deposition was made at a
After deposition, the crystal was annealed using heaters at 12 K (top of D-container) overnight, which resulted in the merging of hoarfrost into a bulk of a few mm sized, rather transparent than opaque crystallites. The embedded diodes were showing 8.75 K (1 cm), 9.5 K (2 cm) and 10 K (3 cm) right after the heater was switched on and slowly cooling and approaching each other throughout the annealing process. After 15 hours of annealing the readings were 7.25 K (1 cm), 7.75 K (2 cm) and 8.75 K (3 cm), which is the result of improved thermal conductivity due to formation of larger grains. After this intermediate annealing we tested the deposition at increased flow rates, using 0.1 l/min step increments. At a flow rate of about 0.8 l/min the newly deposited layer became transparent and at 1.2 l/min the surface became very shiny (see Fig. 3(d)). The conclusion is that such flows facilitate the increase of
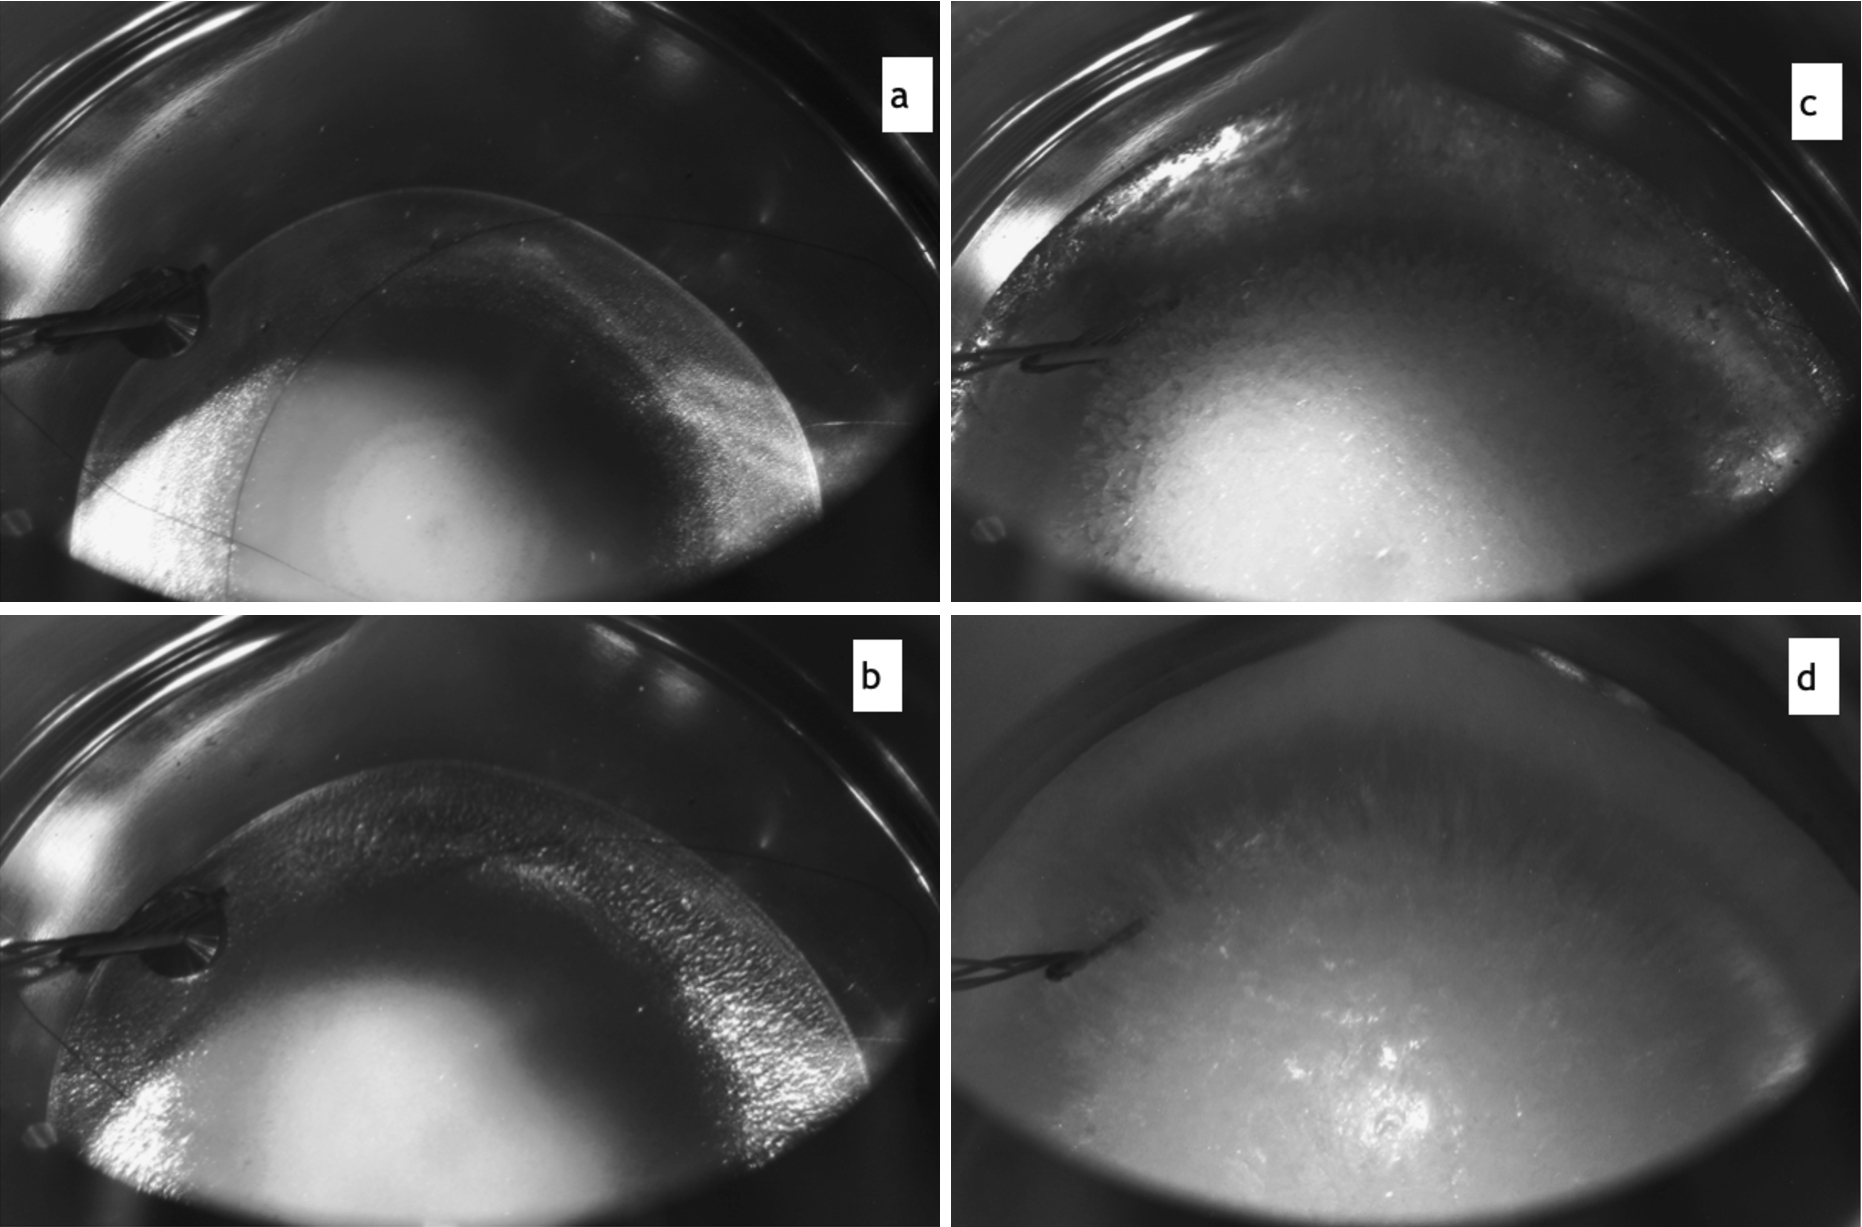
Fig. 4.
Deuterium condensation at high temperature range: (a) and (b) – transparent crystal growing at
4.2.High temperature range
Our temperature reconstruction shows that the optimum temperature range to produce transparent crystals corresponds to the coldest cryostat spot temperature,
Later we improved our technique of successful high-temperature runs. An example of condensation of an about
Fig. 5.
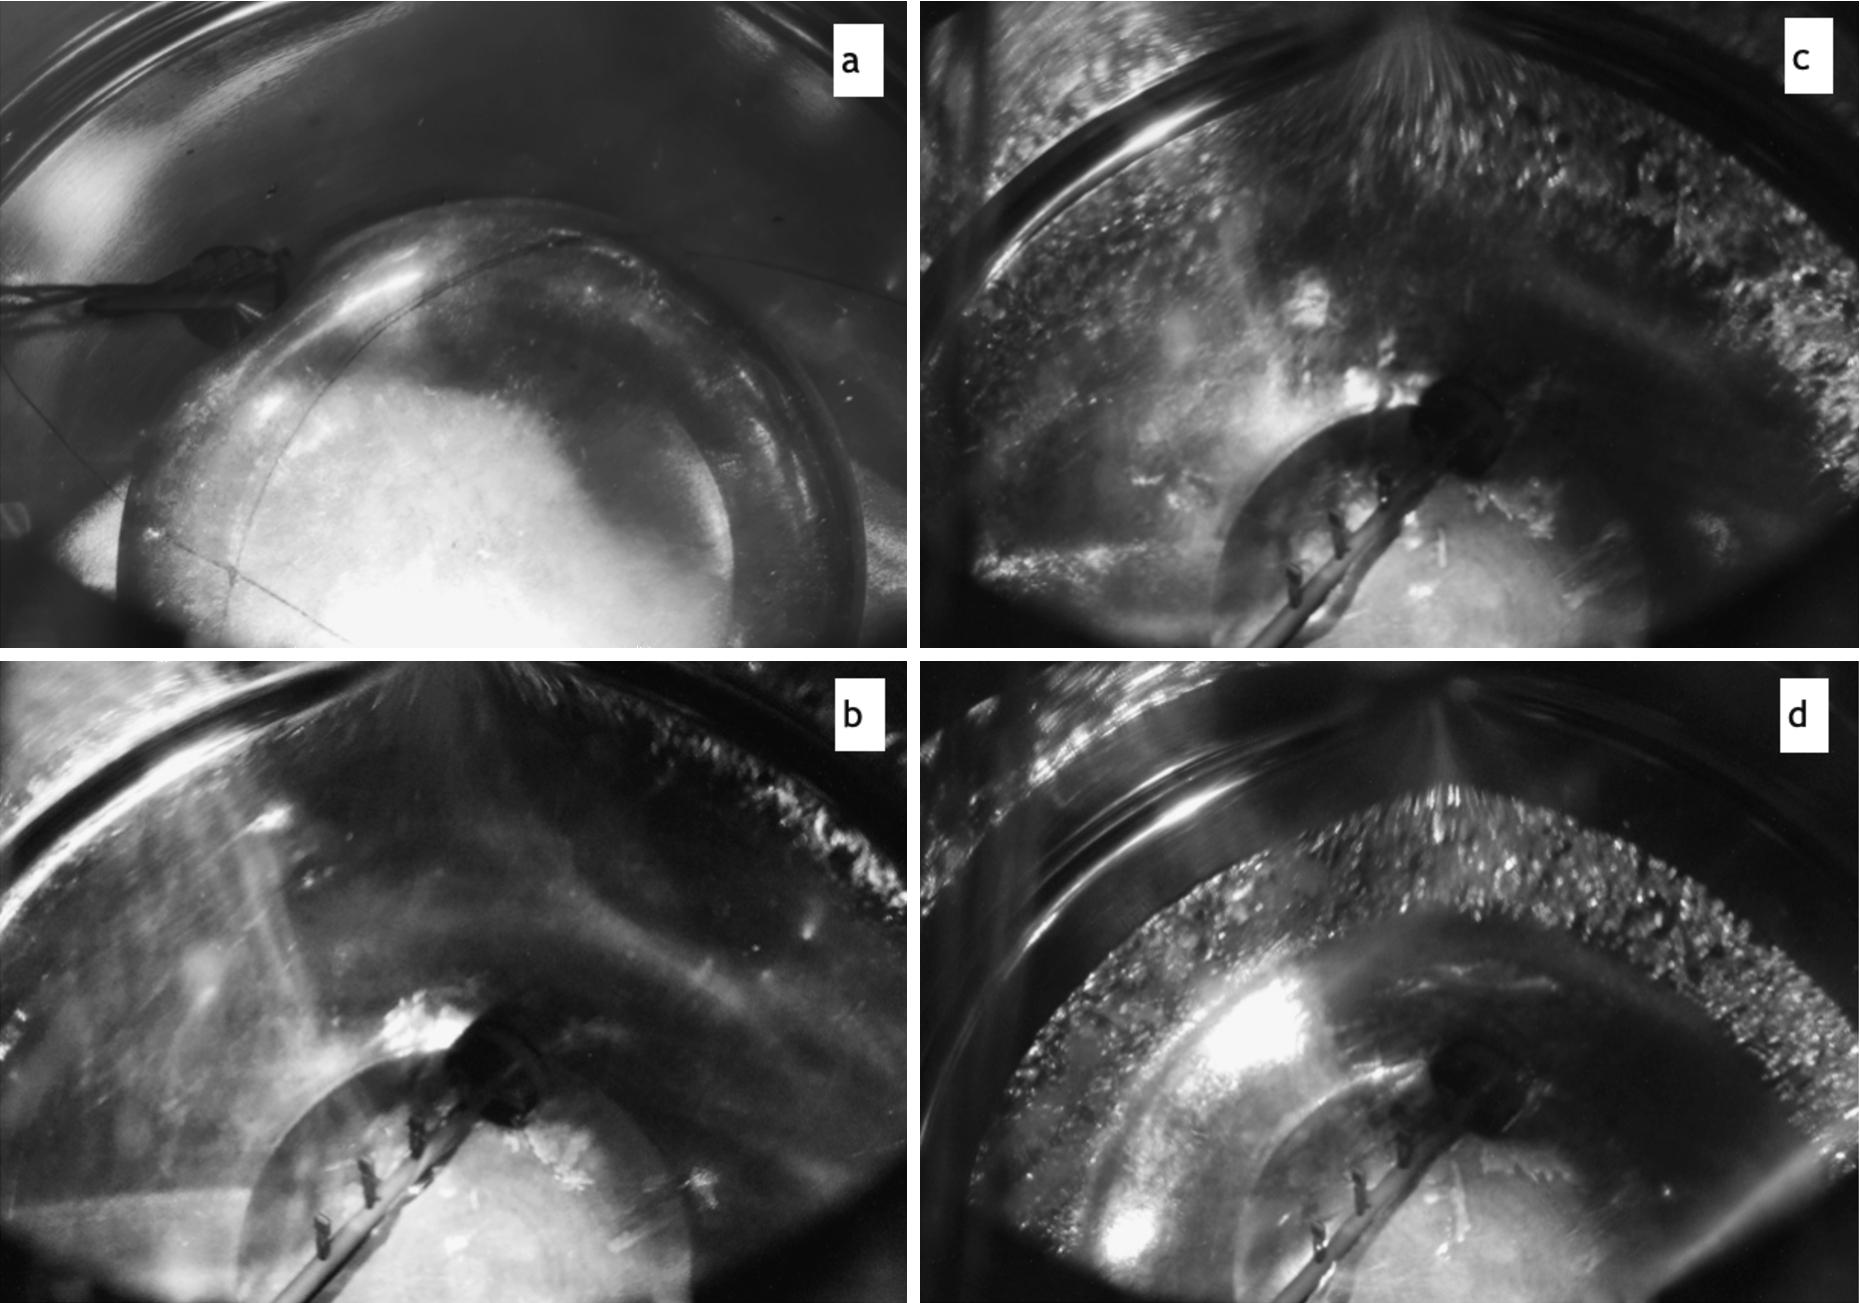
Deuterium condensation at intermediate temperature range: (a) and (b) – 5 min and 50 min after the start of condensation; (c) –
4.3.Intermediate temperature range
Condensation in the intermediate temperature range was done using a combination of a high cooling flow and a high power of D-container heaters in an attempt to warm up the walls of the container to the conditions similar to the run shown in Fig. 4(a) and (b). The top of the container was at 16 K,
The crystal grown in the intermediate temperature range looks different from those obtained in the low- and high-temperature runs. In the middle, the crystal looks semi-transparent at the beginning (Fig. 5(a)). Then the center transforms to small crystallite-like bulk (surrounded by a semitransparent halo) (Fig. 5(b)), with grains gradually growing in size, as visible through Fig. 5(c) toward Fig. 5(d). The structure of the latter looks similar to the annealed version of the low-temperature crystal shown in Fig. 3(d). A peculiarity of this run is the fact that even an
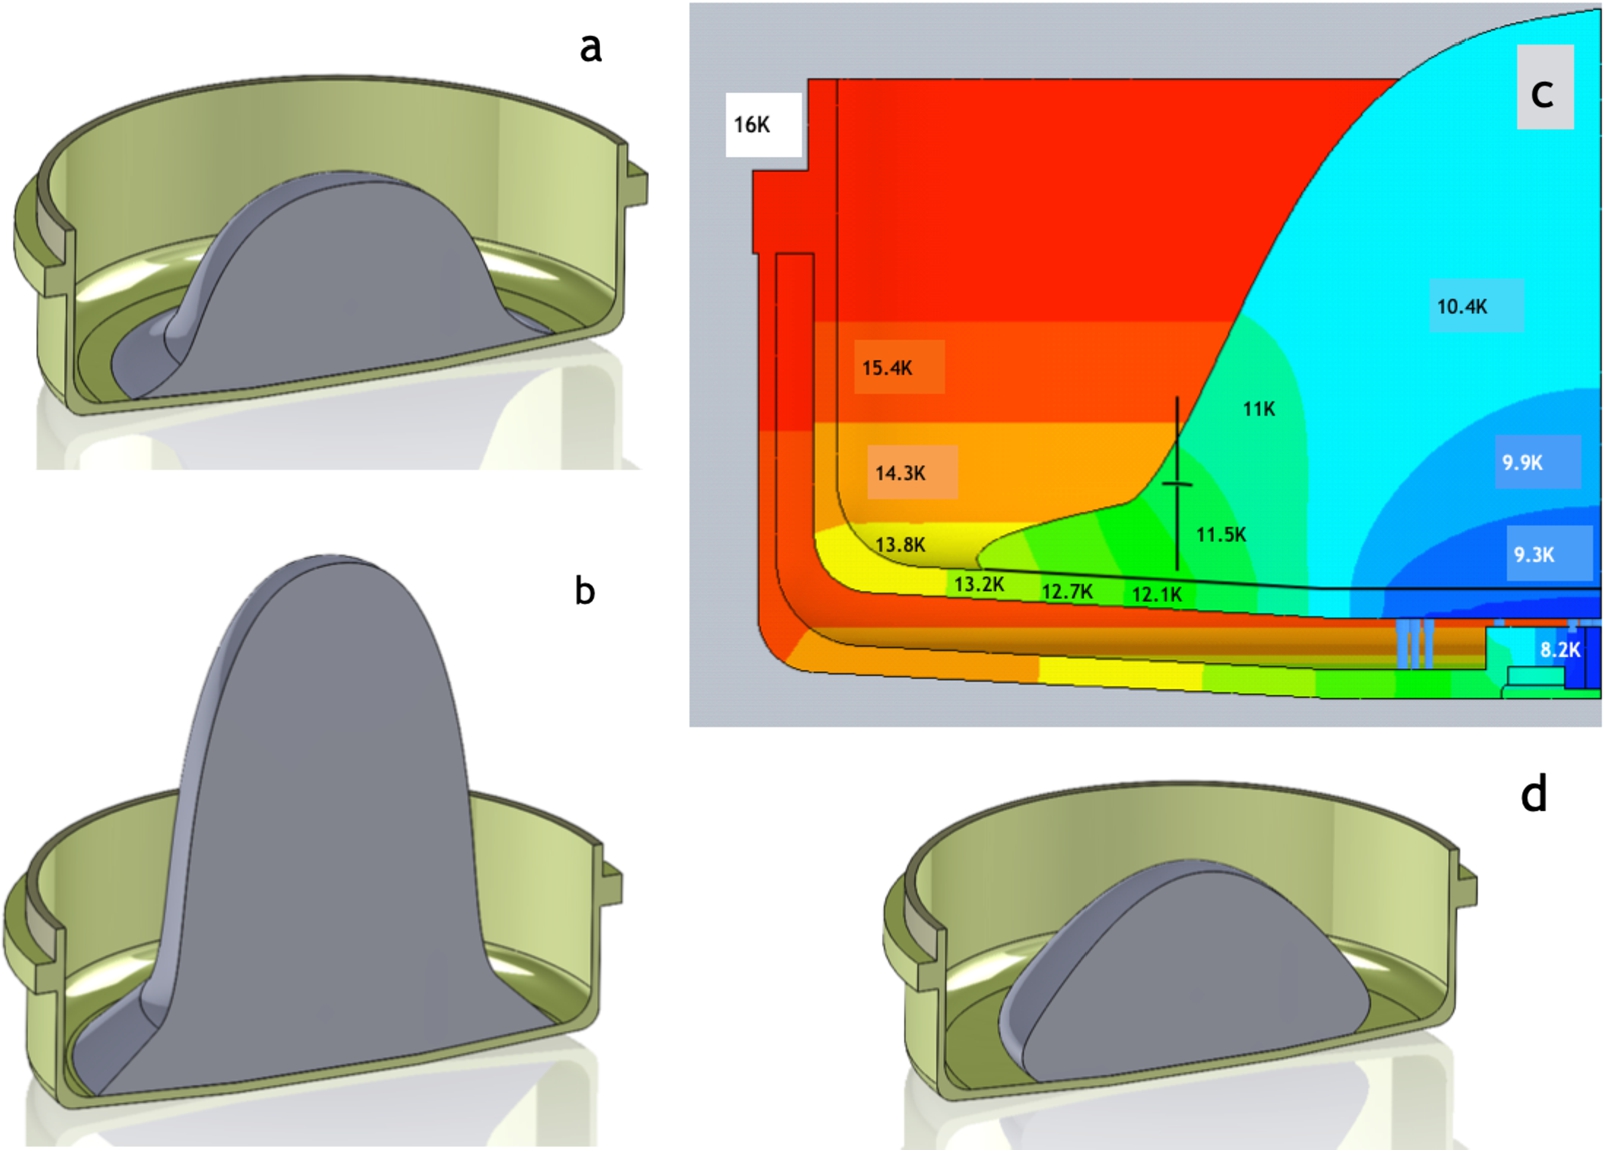
Fig. 6.
Effect of temperature gradient on the shape of the crystal: (a) and (c) – shape and temperature reconstruction of
5.Effect of temperature gradients on crystal shapes
A temperature gradient along the walls of the cryostat can affect the crystal, especially in geometries with a large free surface. As was described in the Section 2, solid-deuterium properties are strongly temperature dependent above 10 K. The consequences are somewhat different for deuterium condensation, depending on whether
The cold gradient was present in the condensation at intermediate temperature, described above in Section 4.3. Based on our temperature reconstruction during condensation (Fig. 6(c)), the
The first observation of a warm-gradient effect was accidental, due to the schedule of the PULSTAR reactor, which operates only during the working office hours of the university, usually from 7 o’clock till 16:30. As a result, our first condensation runs were done in separate steps throughout several days. When the crystal condensation shown in Fig. 4(c) was stopped at
Fig. 7.
Effect of temperature gradient on the shape of the crystal: (a) – crystal shape after overnight annealing at 12.1 K,
Later we repeated such overnight annealing and recorded a movie, which can be seen here [14]. Three images from the movie are shown in Fig. 7(b), (c) and (d). Image (b) was taken near the end of condensation, when the crystal covered the entire bottom. Image (c) was taken only 3 hours later, but the thinning of edges was already quite visible. Image (d) was taken 11 hours later, when most of the deuterium had already moved to the middle. The last image in Fig. 7 looks similar to Fig. 5(b), with the thin film halo surrounding the blob in the middle, only the bulk quality of the middle is different – milky or transparent. Our shape reconstruction of the
In any case, both warm and cold gradients need to be avoided to keep the crystal as flat as possible. Crystal deformations can affect the angular distribution of extracted UCN and potentially reduce the UCN yield of the source. Indeed, in the ideal case of a flat crystal, the emitted UCN trajectories are preferentially parallel to the guide surface due to the kinetic energy gain along the normal to the crystal surface. Such focusing increases the extraction of high energy neutrons, while if the shape is more spherical, the effect of focusing disappears. Such a change of crystal shape might have caused the decrease of the slow VCN part of the spectrum at Mainz after annealing, described in [18]. In the extreme case of a columnar shape (as occurring in the cold gradient condensation), neutrons are accelerated towards the walls, which is the worst case.
Fig. 8.
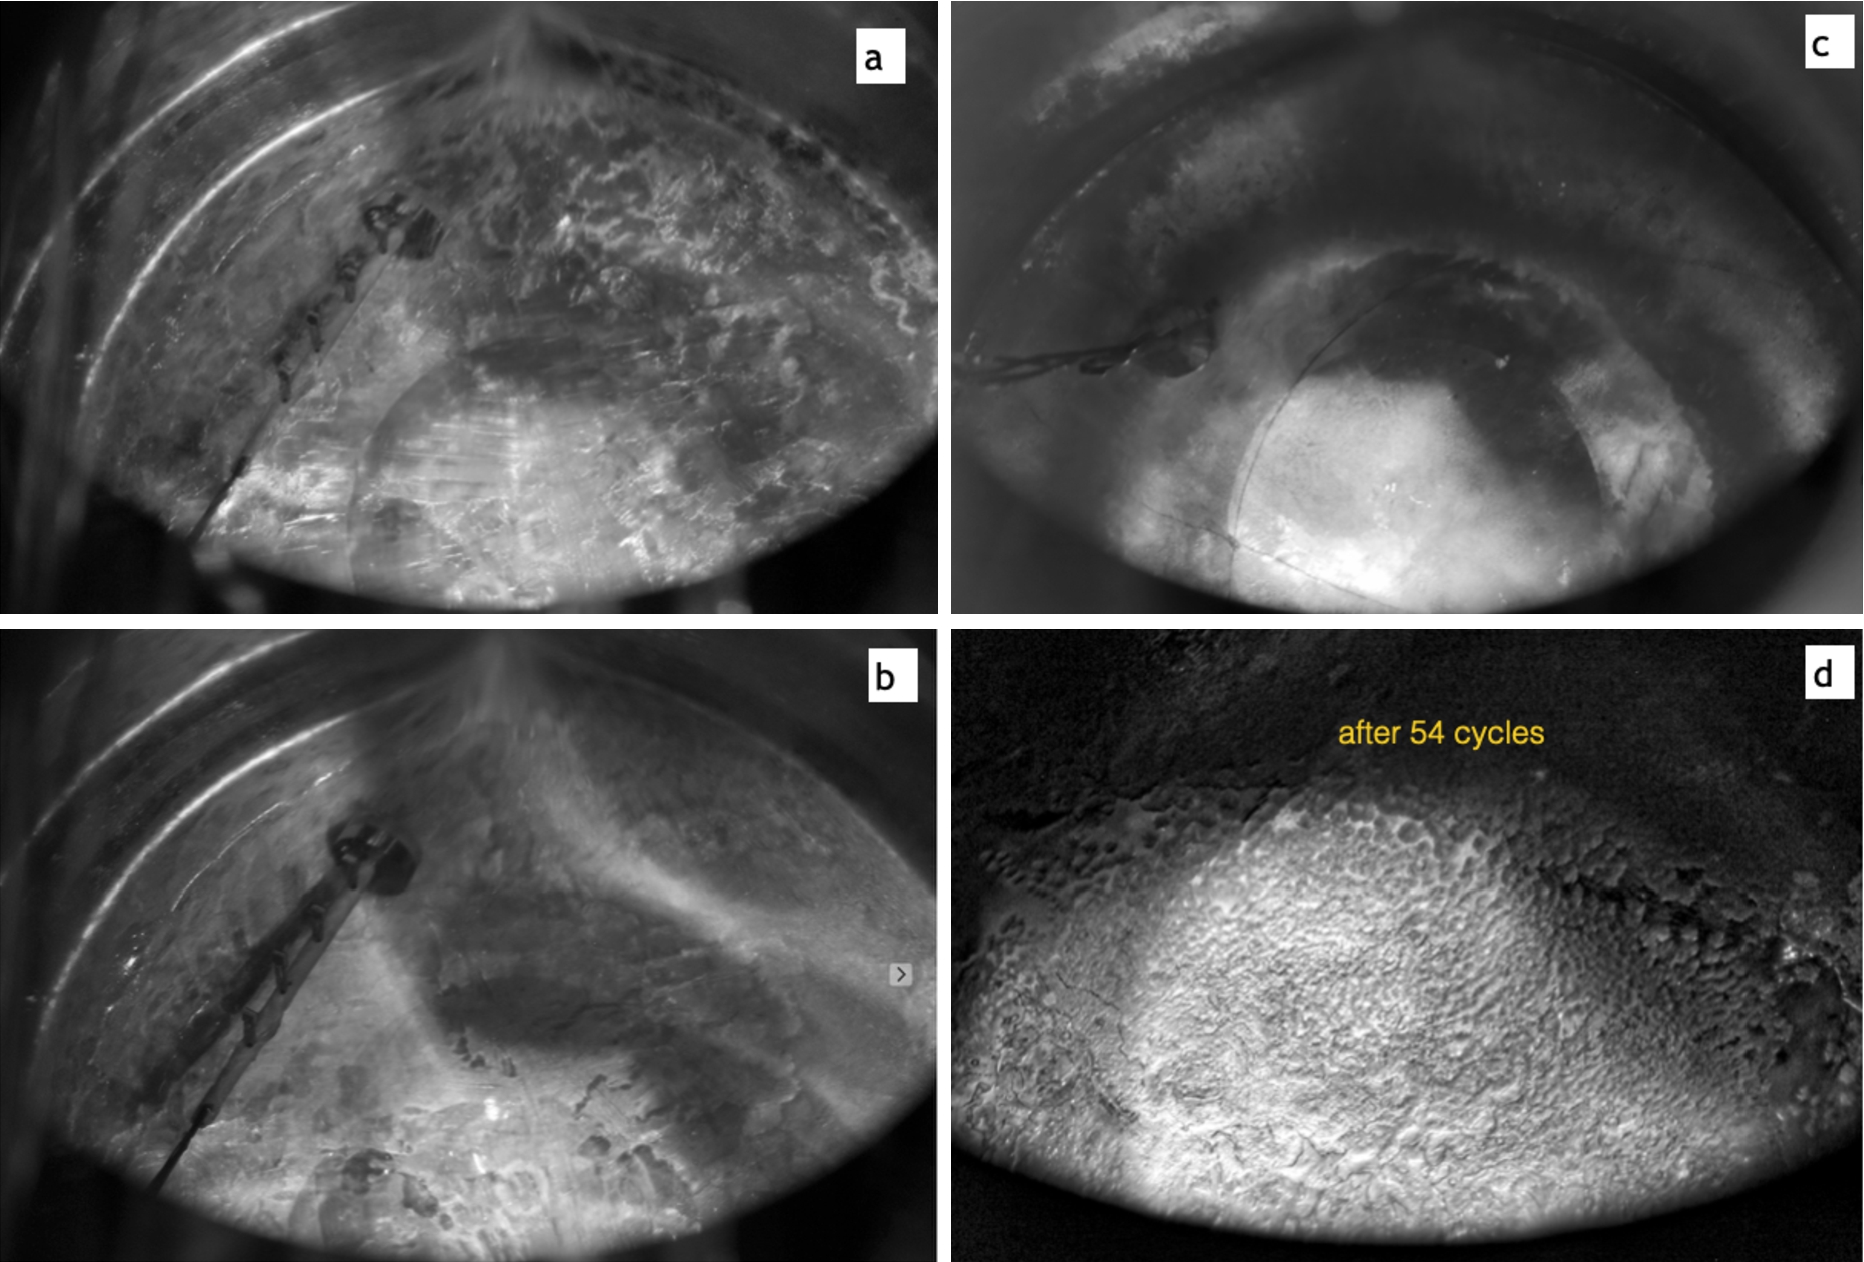
Surface frost and facet formation: (a) – facets/frost formed during cool-down, when crystal temperature drops below 11 K; (b) – surface annealed by a 20 min temperature rise to at maximum 14 K due to a bubble in the LHe flow: (c) – surface dusted with a frost after LHe flow instability, crystal temperature was slowly oscillating 4 times between 9.5 K and 14 K during 2 hours; (d) – after 54 intentional heat pulses, crystal temperature was oscillating between 8.5 K and 9.7 K.
6.Cooling down to operational temperature and the surface frost problem
In the section above it was described how to grow a transparent bulk crystal and avoid crystal shape deformations to facilitate good UCN transmission. Another effect, which strongly affects UCN yield even from a perfect crystal, is the quality of the crystal surface. The main culprit is a surface frost, which dramatically increases the probability of a neutron to be reflected back into the bulk of deuterium. In the present study the surface frost/facets formation of different degrees was observed during each cool-down when crystal temperature was approaching 11 K (see Fig. 8(a)). The faster it cooled down, the more facet/frost formation was visible. In the extreme case of very rapid cooling from
Only frost formation (no facets) was observed during accidental LHe flow instabilities and intentional “heat pulsing”. The result of an accidental slow LHe flow oscillation is visible as a dusty surface on the image in Fig. 8(c). In this case there were four warming-cooling cycles of approximately 30 min between crystal temperatures of 9.5 K and 14 K. The frost here is not well visible, which is in contrast with the image in Fig. 8(d), where results of our following intentional pulsing are shown. In this run the temperature of the crystal was oscillating between the base 8.5 K and a maximum of 9.7 K. This first run of intentional pulsing is described in [3], where a problem of continuous slow decline of UCN yield at pulsed UCN sources was discussed in great detail, including simulations of the UCN yield versus frost thickness.
The crystal shown on Fig. 8(a) was also treated with the heat pulsing, but at lower temperatures. The base temperature was 7 K and the maximum was 8.4 K. No visible frost formation was observed in this case. The only effect was an accidental annealing of the surface by a 20 min temperature rise to the maximum 14 K due to a bubble in the LHe flow shown in Fig. 8(b). Later we were able to reproduce such annealing again, intentionally interrupting the LHe flow for a moment.
7.Conclusions and recommendation for design of solid-deuterium UCN sources at ESS
The main conclusion is that it is possible to grow a
The goal of the present study was to investigate and optimize growing of deuterium for the sources utilizing rather large
Acknowledgements
The authors are grateful to the staff of the PULSTAR reactor, especially A. Cook, for the technical support. This work was supported in part by the US Department of Energy under grant number DE-FG02-97ER41042.
References
[1] | P. Ageron, P. De Beaucourt, H.D. Harig, A. Lacaze and M. Livolant, Experimental and theoretical study of cold neutron sources of liquid hydrogen and liquid deuterium, Cryogenics 9: ((1969) ), 42–50. doi:10.1016/0011-2275(69)90257-4. |
[2] | A. Aleksenskii, M. Bleuel, A. Bosak, A. Dideikin, M. Dubois, E. Korobkina, E. Lychagin, A. Muzychka, G. Nekhaev, N. Nesvizhevsky, A. Nezvanov, R. Schweins, A. Strelkov, K. Turlybekuly, A. Vul’ and K. Zhernenkov, Development of the very cold neutron source prototype, in: 28th International Seminar on Interaction of Neutrons with Nuclei, May 24–28, (2021) , http://isinn.jinr.ru/past-isinns/isinn-28/presentations/26/Nezvanov.pdf. |
[3] | A. Anghel, T.L. Bailey, G. Bison, B. Blau, L.J. Broussard, S.M. Clayton, C. Cude-Woods, M. Daum, A. Hawari, N. Hild, P. Huffman, T.M. Ito, K. Kirch, E. Korobkina, B. Lauss, K. Leung, E.M. Lutz, M. Makela, G. Medlin, C.L. Morris, R.W. Pattie, D. Ries, A. Saunders, P. Schmidt-Wellenburg, V. Talanov, A.R. Young, B. Wehring, C. White, M. Wohlmuther and G. Zsigmond, Solid deuterium surface degradation at ultracold neutron sources, Eur. Phys. J. A 54: ((2018) ), 1–15. doi:10.1140/epja/i2018-12594-2. |
[4] | A. Anghel, G. Bison, B. Blau, M. Daum, N. Hild, K. Kirch, B. Lauss, D. Ries, P. Schmidt-Wellenburg, V. Talanov, M. Wohlmuther and G. Zsigmond, The ultracold neutron source at the Paul Scherrer Institute-performance and status, J. Neutron Research 20: ((2018) ), 83–86. doi:10.3233/JNR-180086. |
[5] | K. Bodek, B. van den Brandt, T. Bryś, M. Daum, P. Fierlinger, P. Geltenbort, M. Giersche, P. Hautle, R. Henneck, M. Kasprzak, K. Kirch, J.A. Konter, G. Kühne, M. Kuźniak, K. Mishima, A. Pichlmaier, D. Rätz, A. Serebrov and J. Zmeskal, An apparatus for the investigation of solid D2 with respect to ultra-cold neutron sources, Nuc. Instr. Meth. Phys. Res. A 533: ((2004) ), 491–504. doi:10.1016/j.nima.2004.06.157. |
[6] | F.G. Brickwedde and R.B. Scott, The difference in vapor pressures of ortho and para deuterium, J. Chem. Phys. 3: ((1935) ), 653. doi:10.1063/1.1749571. |
[7] | J.C. Cook, J.G. Barker, J.M. Rowe, R.E. Williams, C. Gagnon, R.M. Lindstrom, R.M. Ibberson and D.A. Neumann, Experimental characterization of the advanced liquid hydrogen cold neutron source spectrum of the NBSR reactor at the NIST center for neutron research, Nuc. Instr. Meth. Phys. Res. A 792: ((2015) ), 15–27. doi:10.1016/j.nima.2015.04.037. |
[8] | S. Döge and J. Hingerl, A hydrogen leak-tight, transparent cryogenic sample container for ultra-cold neutron transmission measurements, Rev. Sci. Instr. 89: ((2018) ), 033903. doi:10.1063/1.4996296. |
[9] | W. Gaubatz and K. Gobrecht, The FRM-II cold neutron source, Physica B: Cond. Mat. 276: ((2000) ), 104–105. doi:10.1016/S0921-4526(99)01260-0. |
[10] | B.Y. Gorodilov, I.N. Krupskii, V.G. Manzhelii and O.A. Korolyuk, Thermal conductivity of ortho-para solutions of solid deuterium, Fizika Nizkikh Temperatur 7: ((1981) ), 424–428, http://fnt.ilt.kharkov.ua/main.php?page=10. |
[11] | T.M. Ito, E.R. Adamek, N.B. Callahan, J.H. Choi, S.M. Clayton, C. Cude-Woods, S. Currie, X. Ding, D.E. Fellers, P. Geltenbort, S.K. Lamoreaux, C.-Y. Liu, S. MacDonald, M. Makela, C.L. Morris, R.W. Pattie Jr., J.C. Ramsey, D.J. Salvat, A. Saunders, E.I. Sharapov, S. Sjue, A.P. Sprow, Z. Tang, H.L. Weaver, W. Wei and A.R. Young, Performance of the upgraded ultracold neutron source at Los Alamos National Laboratory and its implication for a possible neutron electric dipole moment experiment, Phys. Rev. C 97: ((2018) ), 012501. doi:10.1103/PhysRevC.97.012501. |
[12] | J. Karch, Y. Sobolev, M. Beck, K. Eberhardt, G. Hampel, W. Heil, R. Kieser, T. Reich, N. Trautmann and M. Ziegner, Performance of the solid deuterium ultra-cold neutron source at the pulsed reactor TRIGA Mainz, European Phys. J. A 50: ((2014) ), 1–11. doi:10.1140/epja/i2014-14078-9. |
[13] | M. Kasprzak, Thermal up-scattering of very cold and ultra-cold neutrons in solid deuterium, 2004, arXiv preprint, arXiv:nucl-ex/0407022. |
[14] | E. Korobkina, Solid deuterium annealing, YouTube, 2018, https://www.youtube.com/watch?v=LILgNyEeGjo. |
[15] | E. Korobkina, G. Medlin, B. Wehring, A.I. Hawari, P.R. Huffman, A.R. Young, B. Beaumont and G. Palmquist, Ultracold neutron source at the PULSTAR reactor: Engineering design and cryogenic testing, Nuc. Instr. Meth. Phys. Res. A 767: ((2014) ), 169–175. doi:10.1016/j.nima.2014.08.016. |
[16] | O.A. Korolyuk, B.Y. Gorodilov, A.I. Krivchikov and V.V. Dudkin, The role of normal processes in the thermal conductivity of solid deuterium, Low Temp. Phys. 26: ((2000) ), 235. doi:10.1063/1.593891. |
[17] | I.N. Krupskij, A.I. Prokhvatilov and G.N. Shcherbakov, Lattice parameters and thermal expansion of solid ortho-deuterium, Fizika Nizkikh Temperatur 10: ((1984) ), 5–12, http://fnt.ilt.kharkov.ua/main.php?page=10. |
[18] | T. Lauer, Investigation of a superthermal ultracold neutron source based on a solid deuterium converter for the TRIGA Mainz reactor, Dissertation, 2010. |
[19] | C.-Y. Liu, A.R. Young and S.K. Lamoreaux, Ultracold neutron upscattering rates in a molecular deuterium crystal, Phys. Rev. B 62: ((2000) ), R3581. doi:10.1103/PhysRevB.62.R3581. |
[20] | G. Medlin, PhD thesis, https://repository.lib.ncsu.edu/handle/1840.20/33644. |
[21] | A.R. Mueller, Characterization of solid deuterium as a source material for ultracold neutrons (UCN) and development of a detector concept for the detection of protons from neutron decay, Dissertation, TU Muenchen (2008). |
[22] | Y.N. Pokotilovski, UCN transport simulation in solid deuterium crystals, Nuc. Instr. Meth. Phys. Res. A 675: ((2012) ), 29–33. doi:10.1016/j.nima.2012.01.070. |
[23] | V.F. Sears, Neutron scattering lengths and cross sections, Neutron News 3: ((1992) ), 26–37. doi:10.1080/10448639208218770. |
[24] | A. Serebrov, V. Mityukhlyaev, A. Zakharov, A. Kharitonov, V. Shustov, V. Kuz’minov, M. Lasakov, R. Tal’daev, A. Aldushchenkov, V. Varlamov, A. Vasil’ev, M. Sazhin, G. Greene, T. Bowles, R. Hill, S. Seestrom and P. Geltenbort, Studies of a solid-deuterium source for ultra-cold neutrons, Nuc. Instr. Meth. Phys. Res. A 440: ((2000) ), 658–665. doi:10.1016/S0168-9002(99)01058-X. |
[25] | A.P. Serebrov, Fundamental interactions involving neutrons and neutrinos: reactor-based studies led by Petersburg Nuclear Physics Institute (National Research Centre ‘Kurchatov Institute’) [PNPI (NRC KI)], Phys.-Usp. 58: ((2015) ), 1074. doi:10.3367/UFNe.0185.201511c.1179. |
[26] | I.F. Silvera, The solid molecular hydrogens in the condensed phase: Fundamentals and static properties, Rev. Mod. Phys. 52: ((1980) ), 393. doi:10.1103/RevModPhys.52.393. |
[27] | Y. Sobolev, Status of the UCN sources at the TRIGA Mainz reactor, 8th UCN workshop, PNPI, 2011, http://cns.pnpi.spb.ru/ucn/articles/Sobolev.pdf. |
[28] | M. Sohaili, J. Klier and P. Leiderer, Triple-point wetting of molecular hydrogen isotopes, J. Phys.: Cond. Mat. 17: ((2005) ), S415. doi:10.1088/0953-8984/17/9/009. |
[29] | P.C. Souers, C.K. Briggs, J.W. Pyper and R.T. Tsugawa, Hydrogen vapor pressures from 4 to 30 K: A review, DOE Report, California Univ., Livermore (USA). Lawrence Livermore Lab., USA, 1977. doi:10.2172/7110677. |
[30] | F. Weinhaus, H. Meyer, S.M. Myers and A.B. Harris, Nuclear-spin relaxation in the rotating frame in solid D2, Phys. Rev. B 7: ((1973) ), 2960. doi:10.1103/PhysRevB.7.2960. |
[31] | S. Wlokka et al., The ultra-cold neutron laboratory at the FRM II, Technical report, Verhandlungen der Deutschen Physikalischen Gesellschaft, 2015. |
[32] | Z.-C. Yu, S.S. Malik and R. Golub, A thin film source of ultra-cold neutrons, Zeitschrift für Physik B Cond. Mat. 62: ((1986) ), 137–142. doi:10.1007/BF01323423. |


