
Brain Alteration Patterns in Children with Duchenne Muscular Dystrophy: A Machine Learning Approach to Magnetic Resonance Imaging
Abstract
Background:
Duchenne Muscular Dystrophy (DMD) is a genetic disease in which lack of the dystrophin protein causes progressive muscular weakness, cardiomyopathy and respiratory insufficiency. DMD is often associated with other cognitive and behavioral impairments, however the correlation of abnormal dystrophin expression in the central nervous system with brain structure and functioning remains still unclear.
Objective:
To investigate brain involvement in patients with DMD through a multimodal and multivariate approach accounting for potential comorbidities.
Methods:
We acquired T1-weighted and Diffusion Tensor Imaging data from 18 patients with DMD and 18 age- and sex-matched controls with similar cognitive and behavioral profiles. Cortical thickness, structure volume, fractional anisotropy and mean diffusivity measures were used in a multivariate analysis performed using a Support Vector Machine classifier accounting for potential comorbidities in patients and controls.
Results:
the classification experiment significantly discriminates between the two populations (97.2% accuracy) and the forward model weights showed that DMD mostly affects the microstructural integrity of long fiber bundles, in particular in the cerebellar peduncles (bilaterally), in the posterior thalamic radiation (bilaterally), in the fornix and in the medial lemniscus (bilaterally). We also reported a reduced cortical thickness, mainly in the motor cortex, cingulate cortex, hippocampal area and insula.
Conclusions:
Our study identified a small pattern of alterations in the CNS likely associated with the DMD diagnosis.
1INTRODUCTION
DMD is an X-linked genetic multifactorial condition in which the lack of the protein dystrophin causes progressive muscular weakness, cardiomyopathy and respiratory insufficiency.
DMD is caused by mutations in the dystrophin gene, which is the largest gene in the human genome and it is composed of 79 exons; its expression is regulated by different promoters with distinct tissue specificity. It contains 3 promoter regions encoding full-length isoforms (Dp427) and at least 4 internal promoter regions encoding the shorter isoforms (Dp260, Dp140, Dp116 and Dp71/Dp40). Outside of the muscular tissue, full length Dp427 isoforms are primarily expressed in the cortical/cerebral structures (Dp427c) and in the cerebellar Purkinje cells (Dp427p). By contrast, shorter isoforms are transcribed in the central nervous system (CNS) but not in muscle [1]. More precisely, the Dp260 is mainly expressed in the retina, the Dp140 and Dp71 are widely expressed in the CNS, the Dp116 is expressed in the peripheral-nerve Schwann cells and the Dp40 has been detected in central neuronal synapses [2–5].
DMD individuals typically present with intragenic loss of function mutations of the dystrophin [6, 7]. Several studies identified a greater vulnerability to brain comorbidities in DMD patients with mutations in the 3’ end of the dystrophin gene, affecting specifically the Dp140 and Dp71 isoforms [8–12].
A cognitive and behavioral phenotype characterized by Autism Spectrum Disorder (ASD), Attention Deficit Hyperactivity Disorders (ADHD) and obsessive-compulsive behavior [9, 13, 14], has been widely described even with different frequency in DMD patients. Slight cerebral atrophy, mild ventricular dilatation and cortical atrophy in a sample of 30 subjects with DMD (10/30 with Intelligence Quotient (IQ)<70) have been described since early reports and confirmed in more recent studies [15], with a reduction in the total brain and gray matter (GM) volumes as well as an alteration in the white matter (WM) microstructure [16]. Further studies with Positron Emission Tomography (PET) showed a reduced glucose metabolism in both cerebellar hemispheres with a consistent pattern of hypometabolism in the left frontal and parietal associative cortices and, bilaterally, in the temporal and occipital cortex [17, 18]. More recently, a reduced brain perfusion was observed in DMD patients using the Arterial Spin Labeling technique [19], as well as functional alterations associated with DMD through resting-state functional MRI [20].
Abnormal dendrite development, myelin damage or altered structural/functional connectivity are assumed to play a role in altered brain development in subjects with DMD [21]. To the best of our knowledge, most studies on brain alterations in DMD focus on the correlation between brain abnormalities and clinical phenotype [22] and compare subgroups of patients based on mutation site and expression of Dp140 isoforms [16, 23]. However, genotype-phenotype correlations only partially explain cognitive and behavioral differences in DMD, as they are observed more frequently in male subjects with DMD carrying deletions in the distal portion of the dystrophin gene (downstream to exon 44) [9, 10, 24, 25].
So far, a number of clinical/neurological/behavioral alterations have been associated with DMD diagnosis. Preethish-Kumar and colleagues compared Diffusion Tensor Imaging (DTI) data to investigate differences in WM between 60 patients with DMD and 40 healthy controls [23]. They found a widespread reduction in Fractional Anisotropy (FA) and increase in Mean Diffusivity (MD) and Radial Diffusivity (RD). A reduction in FA was observed in the splenium of the corpus callosum in another study using DTI and comparing 12 subjects with DMD with 14 age-matched healthy controls [26]. In another study, DTI data were combined with structural T1-weighted (T1 W) images to compare 29 subjects with DMD and 22 age-matched healthy controls: a reduction in GM volume in the left insula and in the occipital cortex, as well as a widespread alteration in WM with reduced FA and increased MD and RD, were observed in the DMD group [16]. Most previous studies focused on the brain of DMD patients compared to healthy controls and did not account for possible comorbidities such as cognitive impairment and/or neurodevelopmental disorders.
Our aim is to apply a multivariate approach to investigate DMD-related effects in the CNS potentially accounting for comorbidities in order to identify a pattern of brain structural alterations uniquely associated with DMD. A whole-brain multimodal analysis implemented through a machine learning approach was adopted to identify a set of brain abnormalities which could enable us to differentiate between DMD patients and controls with comparable demographic and clinical profiles. While conventional univariate statistical analysis targets single regions and measures which are significantly affected by the condition, the multivariate approach allows for a comprehensive brain analysis without any a-priori assumptions regarding the role of key brain regions or measures. We assume that this will enable us to identify a sparse set of brain alterations in which dystrophin could play a relevant role.
2MATERIALS AND METHODS
2.1Participants
A clinical population of more than 130 males with DMD (aged from 2.8 to 32 years) is referred each year to the Rare Disease Unit of the Scientific Institute IRCCS Eugenio Medea for periodic clinical evaluation, as indicated by international guidelines [27]. Among these, 20 boys were recruited for the present study as they met the following inclusion criteria:
–
– diagnosis of DMD according to international standard criteria such as progressive muscular weakness, increased muscle plasma enzymes, muscular biopsy and/or a defined mutation in the dystrophin gene [27];
– age range 4-17 years;
– no contraindication to MR, such as claustrophobia, MR incompatible implants or severe musculoskeletal deformities and contractures not compatible with the MR session.
We included the following evaluations according to specific guidelines [27]:
–
– Motor Function: ambulant patients were tested using the 6-Minute Walk Test (6MWT), following standardized procedures [28]; non-ambulant patients were tested using the Motor Function Measure (MFM) scale [29];
– Respiratory Function: the wakeful respiratory function was measured through the spirometer in sitting position (FVC % expected). Respiratory dysfunction was considered mild when forced vital capacity was ranging between 60% and 70% of predicted and moderate when FVC is lower than 60%;
– Cardiac function: measures of Left Ventricular Ejection Fraction (LVEF) were derived from cardiac ultrasound. LVEF is considered normal when greater than 60%, mildly impaired in the range 50% –60% .
Eighteen male subjects enrolled in other research protocols aimed to assess structural and functional brain correlates in other clinical populations (e.g., ASD, developmental dyslexia) were included as a control group. The control group was matched for age, sex, cognitive and behavioral data, therefore it included healthy subjects (N = 7), subjects with an ASD diagnosis (N = 5) and subjects with an Intelligence Quotient (IQ) lower than 75 (N = 10). The similarity between the DMD patient and the control groups were tested including all subjects, using the T-test for the continuous variables (i.e., Age, IQ) and the Pearson Chi-square test for the categorical ones (i.e., ASD diagnosis). Moreover, patients with an ASD diagnosis underwent a genetic panel testing for ASD and no alterations in the DMD gene were observed. Finally, the control group included only subjects with a normal appearing brain morphology and no cardiac or respiratory issues.
The study was approved by the Scientific Review Board and the Ethical Committee of Scientific Institute IRCCS Eugenio Medea. Signed informed consent/assent was collected from parents/legal guardians and patients.
2.2Cognitive assessment
IQ level was determined using the appropriate Wechsler Intelligence Scale (WPPSI-III, or WISC-IV) [30, 31] or Griffiths scale [32]. A full IQ (IQ) lower than 70 was defined as intellectual disability.
All the recruited subjects received a thorough psychiatric and neurologic assessment to exclude major neurological and psychiatric diagnoses other than DMD and ASD. The Autism Diagnostic Observation Schedule–Second Edition (ADOS-2) [33] assessment was administered, if needed, to confirm ASD diagnosis. The ADOS-2 is a standardized, semi-structured observational rating scale used to evaluate communication, reciprocal social interaction, imagination/creativity, and stereotyped behaviors and restricted interests to inform the diagnosis of ASD; it consists of five modules based on the individual’s chronological age and expressive language level, ranging from preverbal to verbally fluent.
All the evaluations were performed by the same team at the Scientific Institute Eugenio Medea: neurologists and child neurologists, psychologists, physiotherapists, pulmonologists and cardiologists.
2.3MRI acquisition protocol
MRI data were acquired on a 3T Philips Achieva d-Stream scanner (Best, The Netherlands) with a 32-channel head coil.
The MRI protocol included two anatomical T1 W and T2 W sequences and a DTI sequence.
T1 W data were acquired with a 3D Turbo Field Echo sequence with Field Of View (FOV)=256x256x175 mm3, voxel size = 1x1x1 mm3, Time of Repetition (TR)=shortest ( 8.1 ms), Time of Echo (TE)=shortest ( 3.7 ms) and Flip Angle = 8.
T2 W data were acquired with a 2D fast spin echo sequence with FOV = 240x240 mm2, voxel size = 1.5x1.5 mm2, slice thickness = 1.5 mm (no gap), 100 slices, TR = 3000 ms and TE = 100 ms.
DWI data were acquired with a two-shell sequence with 4 b0 volumes, 8 directions at b = 300 s/mm2, 32 directions at b = 1100 s/mm2 (voxel size = 2×2 mm2, slice thickness = 2 mm (no gap), TR = 12 s, TE = 80 ms).
The whole acquisition protocol lasted about 35 minutes and was successfully completed by all participants. Acquired images were visually inspected by a trained radiologist technician and sequences with excessive motion artifacts were repeated. Non-collaborative subjects (N = 16) were sedated during the MRI acquisition.
2.4Image data analysis
T1 W images were corrected for bias field intensity artifacts using the N4 algorithm [34] and subsequently processed using the FreeSurfer image analysis suite following the recon-all processing pipeline (http://surfer.nmr.mgh.harvard.edu/, version 7.0). The only change to the default implementation of the FreeSurfer processing pipeline is the introduction of the HCP-MMP1 atlas [35] parcellation of the fsaverage template. The HCP-MMP1 atlas [35] partitions both cortex hemispheres into 180 regions on the basis of multi-modal MRI data acquired on 210 healthy subjects, thus providing a more precise definition of structurally and functionally homogeneous regions of the cortical gray matter. After the processing, deep gray matter and subcortical structures, such as hippocampus, amygdala, caudate, putamen, ventricles, brain stem [36] were characterized by their volume, while cortical thickness was derived for the cortical gray matter regions [37].
DTI data were processed using TORTOISE software V3.0 [38, 39] to obtain MD and FA maps. Raw data were corrected for motion and distortion artifacts (e.g. eddy current, B0 susceptibility, echo-planar imaging distortion) using the T2 W structural image as reference [40]. Subsequently, data were visually inspected to detect any remaining artifacts and discard corrupted volumes (less than 1 volume was discarded per subject on average, with a maximum amount of 6 in one case). Finally, the DTI tensor was computed using a non-linear least square estimator [39] and the final parametric maps were derived. Subject tensors were registered [41] to a DWI population atlas built from 971 subjects of the HCP dataset included in TORTOISE [42]. The DWI population atlas included JHU-inspired Regions Of Interest (ROIs) placed in the center of the main fiber bundles that were used to sample the FA and MD maps.
In summary, the following measures were extracted for each subject from MR images to characterize the whole brain: thickness of 360 cortical regions, volume of 40 brain structures, FA and MD values of 48 regions in the middle of the main fiber bundles.
2.5Multivariate analysis
The large number of features we extracted from the MRI data is essentially multivariate as all the different brain structures are structurally and/or functionally connected. As a consequence, in a classic univariate approach a stringent correction for multiple comparisons must be employed to account for the intrinsic correlation among the different measures, resulting in a reduction of the statistical power [43], most of all in the scenario of a weak diffuse impact of the pathology [44]. We decided to implement a multivariate analysis to overcome this problem and performed a machine learning-based analysis to investigate whether DMD patients and controls can be distinguished based on their MRI-derived measures. This enabled us to verify if DMD is uniquely associated with a pattern of altered brain integrity which is independent of potential comorbidities.
MRI-derived features were corrected for age, IQ and ASD diagnosis using a linear regression model to reduce the within group error variance, thus improving the statistical power [45]. Subsequently, candidate features were selected using a two-tail T-test with a selection threshold of p < 0.05 [46]. Since the T-test was performed only to select the most relevant features, the significance threshold was not corrected for multiple comparisons. Finally, the selected features were concatenated to be used as input in the classification experiment.
The classification experiment was performed using a Support Vector Machine (SVM) with a linear kernel [47] and a penalty parameter C set to 1. SVM methods map samples into a high dimensional space where the two groups are linearly separable and identify the hyperplane that maximizes the margin between the training set samples and the classification hyperplane. We used a balanced leave-one-out cross validation procedure in the feature preparation/training/testing stages, i.e. in each cross-validation round two subjects, one DMD patient and one control subject, were randomly and independently selected and used as testing set to avoid the anticorrelation effect with the training set [48]. Classifier performances were evaluated using classification accuracy, sensitivity, specificity and the Area Under the ROC Curve (AUC). The p-value associated to each performance index was computed using a permutation test with 10,000 permutations of subject labels.
We also performed a feature analysis to investigate which MRI-derived measures are mostly involved in DMD. In linear kernel SVM classifiers, the classification hyperplane coefficients can be interpreted as feature weights, thus assessing the importance of each feature for the classification task [49]. However, classifier weights do not have a direct neurophysiological interpretation and do not indicate a direct relationship with DMD. Therefore, we transformed the linear classifier “backward model” (i.e., the trained SVM classifier) into the corresponding “forward model” (i.e. a generative model), where the weight associated with each feature could be interpreted as a measure of the impact of DMD [49].
2.6Correlation analysis
We tested the Pearson linear correlation between the features selected in the multivariate analysis and several clinical scores (i.e., the 6MWT score, the MFM scores D1, D2, D3 and total) to investigate the possible relationship between the brain alterations and one of the main clinical outcomes of DMD. Each correlation analysis was performed independently from the others and we set the significant threshold to p < 0.05.
3RESULTS
Twenty male subjects with a diagnosis of DMD were recruited, but 2 of them were excluded after the MR session owing to excessive motion artifacts. Clinical and demographic data are reported in Table 1. The clinical sample and the control did not significantly differ in terms of age, IQ and frequency of ASD diagnosis (N = 5 in both groups). In the DMD population, 5 subjects had a comorbid ASD diagnosis (4 out of 5 with IQ < 70), 7 subjects an IQ score ranging from 59 to 67 and 6 subjects an IQ score ranging from 82 to 109. Seven out of the eleven patients with an IQ score < 70 carried a mutation in the distal portion of the DMD gene. Ten out of 18 DMD patients were ambulant when the MR was performed, their “6MWT” scores are reported in Table 1. Four out of the 18 patients showed moderate respiratory dysfunction (i.e., a FVC lower than 60%), while 2 patients showed cardiac dysfunctions (i.e. a LVEF lower than 60%). The whole description of the cardiac and respiratory indexes for the patients with DMD are reported in the supplementary materials. As for therapies, 10 patients, defined as “on going”, were under steroid treatment at the time of evaluation (either prednisone 0,75 mg/kg/a day or deflazacort 09 mg/kg/a day); 4 patients, defined as “past”, had been previously treated with steroids for two or more years, but had been off therapy for at least one year at the time of evaluation; 4 patients, defined as “naïve”, never took steroids. All the DMD patients were supplemented with vitamin D.
Table 1
Descriptive statistics of demographic and neuropsychological variables. Acronym legend: Prox - mutation in the proximal portion of the DMD gene (upstream to exon 44); Dist - mutation in the distal portion of the DMD gene (downstream to exon 44); Steroid therapy: ongoing - patients under steroid treatment at the time of evaluation; past treatment - patients treated with steroid for more than two years, who stopped treatment at least one year before this study; Naïve - patients never treated with steroid
| DMD group | Control group | Group comparison | |||
| N# | 18 | 18 | |||
| N# of ASD diagnosis | 5 | 5 | χ 2 = 1 | ||
| Mutation in the DMD gene (prox/dist) | 10/8 | ||||
| N# of ambulant patients | 10 | 18 | |||
| Steroid therapy | 10 _ ongoing 4 –past treatment 4 –naïve | 0 | |||
| min –max | mean (SD) | min –max | mean (SD) | t-test | |
| Age (years) | 5.1 –17.1 | 11.0 (3.6) | 4.6 –16.2 | 9.5 (4.1) | p = 0.232 |
| IQ | 55 –109 | 72.3 (16.6) | 40 –108 | 72.1 (22.3) | p = 0.980 |
| 6MWT (N = 10) | 200 –437 | 326 (81) | |||
In the multivariate analysis 56 out of the 448 features were selected in the preliminary selection procedure. In particular, 22 T1W-derived measures (one volume and 21 thickness measures) and 34 DTI-derived measures (29 FA and 5 MD measures) were used in the classification experiment.
In the classification experiment, the linear classifier discriminates between DMD patients and control subjects with good performance indices (accuracy = 97.2%, p = 0.0001; AUC = 99.1%, p < 0.001; sensitivity = 94.4%, p = 0.0004; specificity = 100.0%, p < 0.0001). For each index, the permutation test showed that the scores thus obtained are significantly better than those obtained from a random classifier. Overall, these results suggest that the selected features were able to discriminate between subjects with DMD and controls significantly (Table 2).
Table 2
Classifier performance indices
| Index | Performance | p-Value* |
| Accuracy | 97.2% | p = 0.0001 |
| AUC | 99.1% | p < 0.0001 |
| Sensitivity | 94.4% | p = 0.0004 |
| Specificity | 100.0% | p < 0.0001 |
*p-Values assessed with a 10’000 label permutation test.
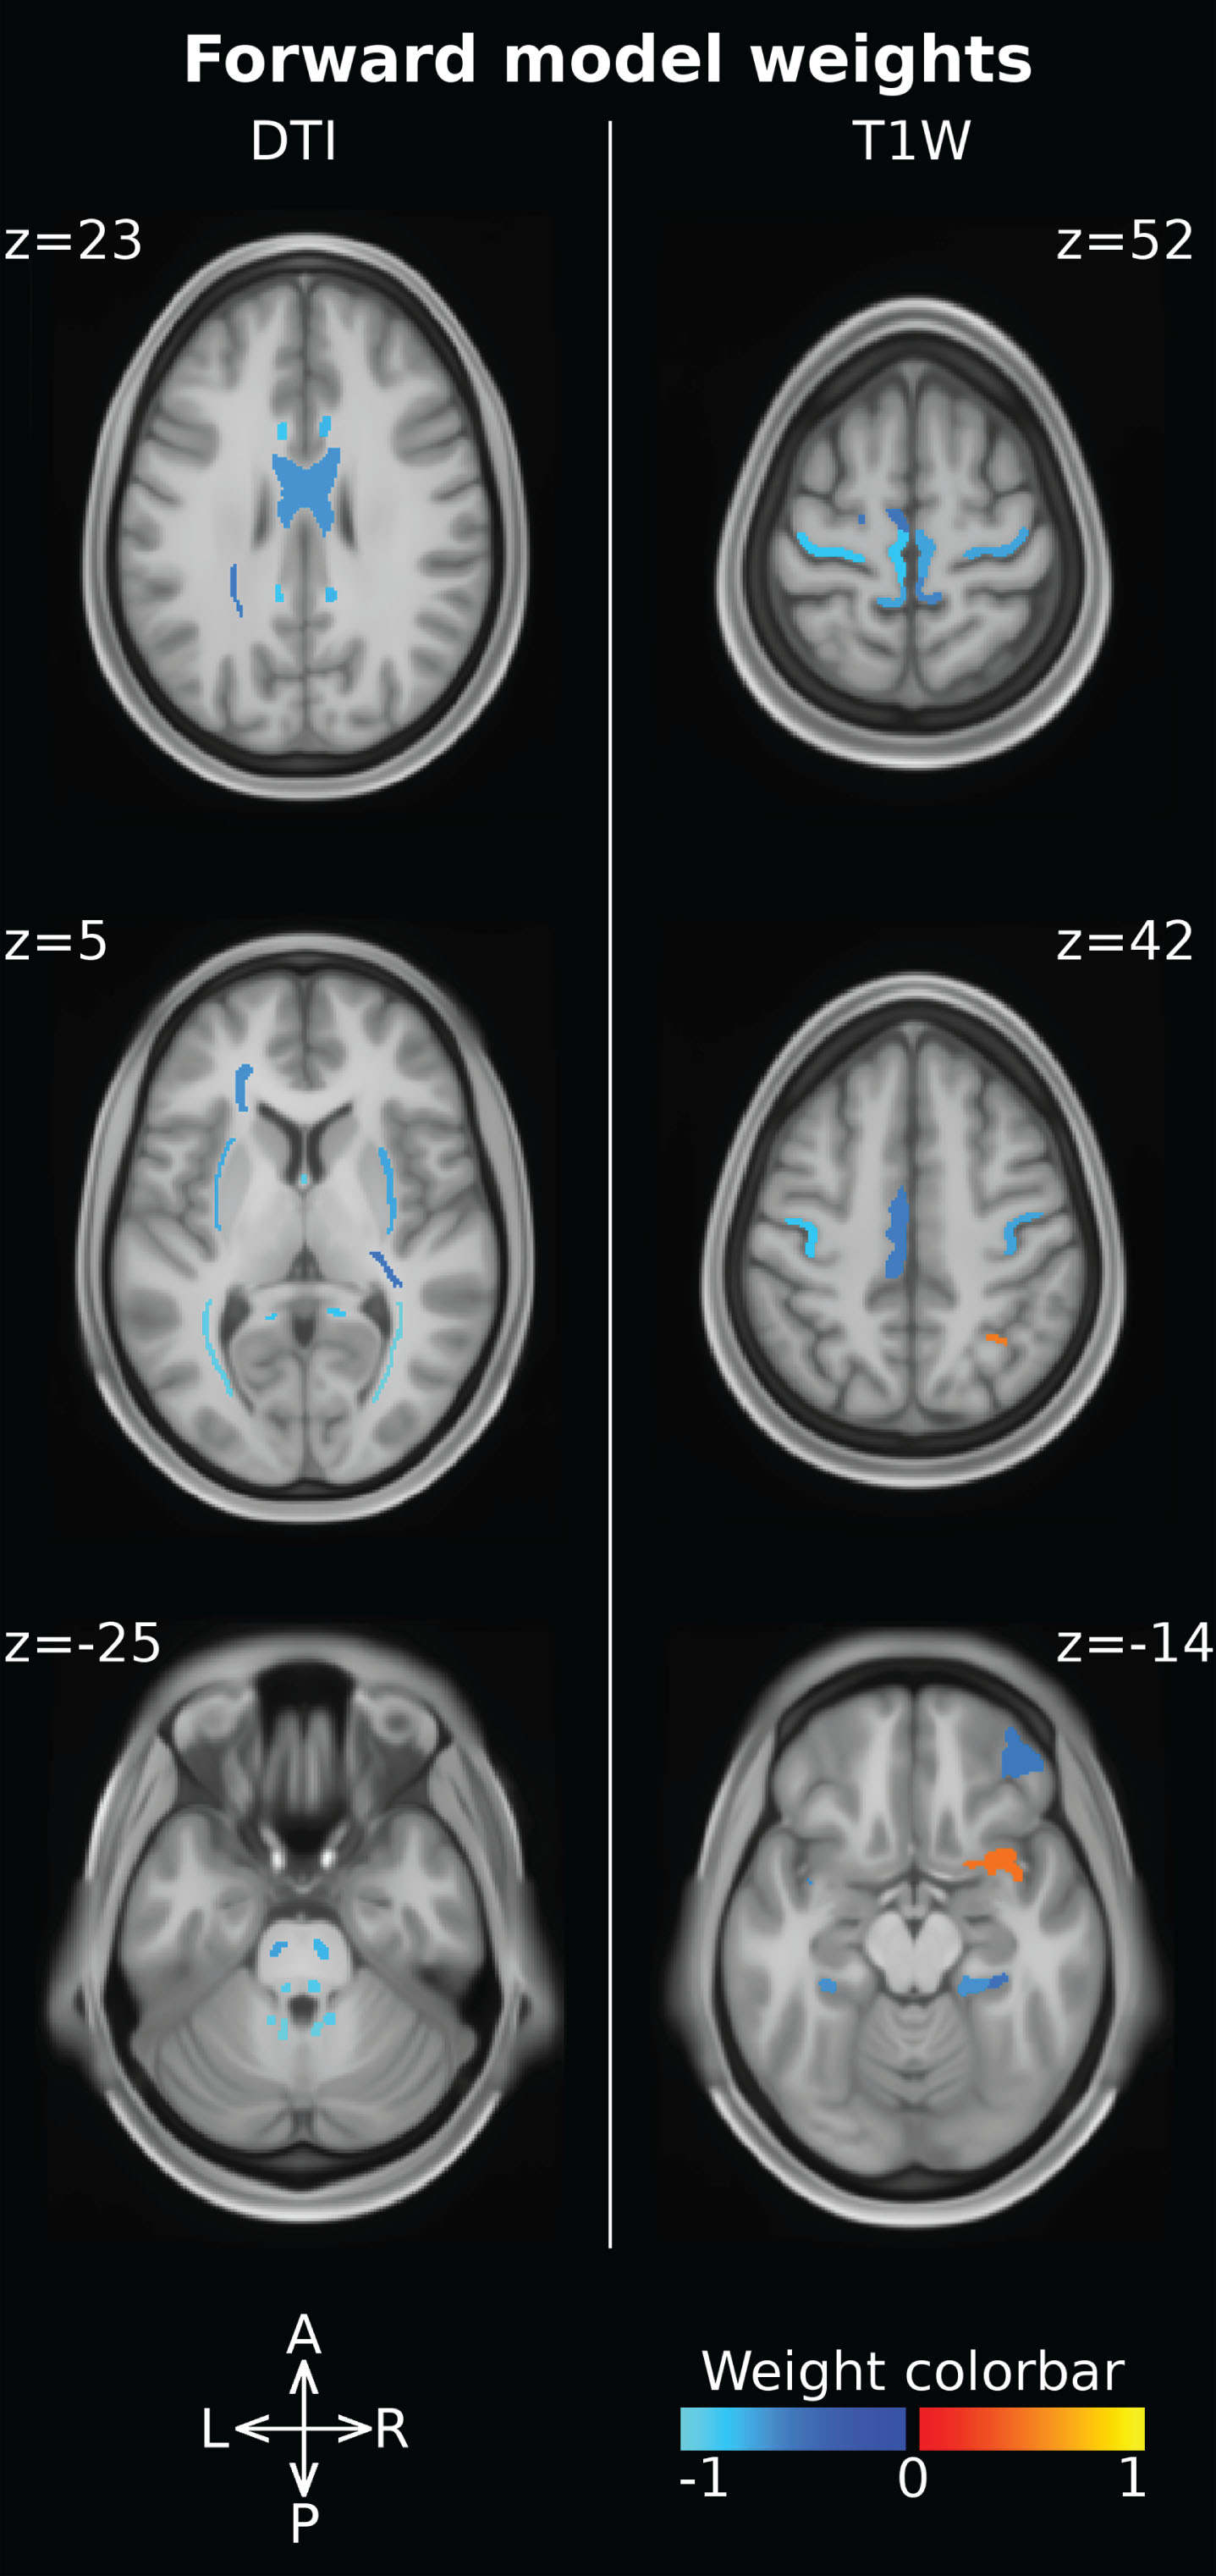
“Forward model” weights were computed to assess the impact of DMD diagnosis of on each single feature. Feature weights can be examined both comparing the magnitude and checking the sign. Larger absolute magnitudes are associated with more spoiled features, while negative weights indicate a reduction in feature values in subjects with DMD vs controls (Table 3). The ROI associated with the ten largest magnitude weights are all DTI-derived features characterizing the structural integrity of the WM. In particular, these features are located in the posterior thalamic radiation (bilaterally), in the cerebellar peduncle (bilaterally superior and inferior), in the fornix and in the medial lemniscus (bilaterally) (Fig. 1). Moreover, DTI-derived features showed larger weights than T1W-derived ones, indicating that DMD diagnosis has a larger impact upon DTI-derived measures compared to T1W-derived features. Furthermore, all FA measures are characterized by negative weights and MD measures are characterized by positive weights (all but one), indicating that effects of DMD diagnosis upon WM result in reduced FA and increased MD and, therefore, in axonal damage. Focusing on the T1W-derived features, 19 out of 21 thickness measures are associated with negative weights, indicating a cortical thickness reduction in DMD patients vs controls.
Table 3
Forward model weights computed for the classification features. Model weights can be used to assess the impact of DMD on the different MRI derived measures. Larger weight magnitudes are associated with larger pathology effects, while negative signs indicate a reduction in DMD patients with respect to controls
| IDX | ROI Name (HCP macro ROI) | Hemisphere | Measure | Source | Feature |
| image | weight | ||||
| 1 | Posterior thalamic radiation include optic radiation | Right | FA | DTI | –1,05 |
| 2 | Superior cerebellar peduncle | Left | FA | DTI | –1,02 |
| 3 | Superior cerebellar peduncle | Right | FA | DTI | –0,97 |
| 4 | Inferior cerebellar peduncle | Left | FA | DTI | –0,93 |
| 5 | Posterior thalamic radiation include optic radiation | Left | FA | DTI | –0,92 |
| 6 | Fornix | FA | DTI | –0,91 | |
| 7 | Inferior cerebellar peduncle | Right | FA | DTI | –0,89 |
| 8 | Fornix | TR | DTI | 0,89 | |
| 9 | Medial lemniscus | Left | FA | DTI | –0,89 |
| 10 | Superior cerebellar peduncle | Left | TR | DTI | 0,88 |
| 11 | Medial lemniscus | Right | FA | DTI | –0,87 |
| 12 | Fornix cres Stria terminalis | Left | FA | DTI | –0,86 |
| 13 | Superior Cerebellar Peduncle | Right | TR | DTI | 0,85 |
| 14 | Superior fronto occipital fasciculus | Right | FA | DTI | –0,84 |
| 15 | Cingulum cingulate gyrus | Left | FA | DTI | –0,82 |
| 16 | Cingulum hippocampus | Right | FA | DTI | –0,80 |
| 17 | Primary Motor Cortex (Somatosensory and Motor Cortex) | Left | Thickness | T1W | –0,80 |
| 18 | Cingulum hippocampus | Left | FA | DTI | –0,79 |
| 19 | Fornix cres Stria terminalis | Right | FA | DTI | –0,77 |
| 20 | Superior fronto occipital fasciculus | Left | FA | DTI | –0,74 |
| 21 | Cingulum cingulate gyrus | Right | FA | DTI | –0,73 |
| 22 | Corticospinal tract | Right | FA | DTI | –0,73 |
| 23 | Cerebral peduncle | Right | FA | DTI | –0,70 |
| 24 | External capsule | Left | FA | DTI | –0,69 |
| 25 | External capsule | Right | FA | DTI | –0,68 |
| 26 | Area 5-m (Paracentral Lobular and Mid Cingulate Cortex) | Left | Thickness | T1W | –0,67 |
| 27 | Primary Motor Cortex (Somatosensory and Motor Cortex) | Right | Thickness | T1W | –0,67 |
| 28 | Corticospinal tract | Left | FA | DTI | –0,66 |
| 29 | Cerebral peduncle | Right | TR | DTI | 0,64 |
| 30 | Cerebral peduncle | Left | FA | DTI | –0,62 |
| 31 | Body of corpus callosum | FA | DTI | –0,61 | |
| 32 | Area 7 m (Posterior Cingulate Cortex) | Left | Thickness | T1W | –0,61 |
| 33 | Middle cerebellar peduncle | FA | DTI | –0,61 | |
| 34 | Sagittal stratum | Right | FA | DTI | –0,60 |
| 35 | Anterior corona radiata | Left | FA | DTI | –0,60 |
| 36 | ParaHippocampal Area 2 (Medial Temporal Cortex) | Left | Thickness | T1W | –0,60 |
| 37 | ParaHippocampal Area 1 (Medial Temporal Cortex) | Right | Thickness | T1W | –0,60 |
| 38 | Central part of corpus callosum | Volume | T1W | –0,59 | |
| 39 | Ventral Area 6 (Premotor Cortex) | Right | Thickness | T1W | –0,59 |
| 40 | Posterior Insular Area 2 (Insular and Frontal Opercular Cortex) | Left | Thickness | T1W | –0,57 |
| 41 | Area 5-m (Paracentral Lobular and Mid Cingulate Cortex) | Right | Thickness | T1W | –0,56 |
| 42 | Insular Granular Complex (Insular and Frontal Opercular Cortex) | Left | Thickness | T1W | –0,56 |
| 43 | Dorsal Area 24d (Paracentral Lobular and Mid Cingulate Cortex) | Left | Thickness | T1W | –0,52 |
| 44 | Posterior corona radiata | Left | FA | DTI | –0,52 |
| 45 | Area Posterior 24 prime (Anterior Cingulate and Medial Prefrontal Cortex) | Right | Thickness | T1W | –0,51 |
| 46 | Area 4anterior 47r (Orbital and Polar Frontal Cortex) | Right | Thickness | T1W | –0,51 |
| 47 | Anterior 24 prime (Anterior Cingulate and Medial Prefrontal Cortex) | Left | Thickness | T1W | –0,50 |
| 48 | Area 31a (Posterior Cingulate Cortex) | Left | Thickness | T1W | –0,49 |
| 49 | Area 6 m posterior (Paracentral Lobular and Mid Cingulate Cortex) | Left | Thickness | T1W | –0,49 |
| 50 | Area posterior 24 (Anterior Cingulate and Medial Prefrontal Cortex) | Right | Thickness | T1W | –0,48 |
| 51 | Area 23d (Posterior Cingulate Cortex) | Left | Thickness | T1W | –0,48 |
| 52 | Area Lateral IntraParietal dorsal (Superior Parietal Cortex) | Right | Thickness | T1W | 0,48 |
| 53 | Retrolenticular part of internal capsule | Right | FA | DTI | –0,48 |
| 54 | Piriform Cortex (Insular and Frontal Opercular Cortex) | Right | Thickness | T1W | 0,48 |
| 55 | ParaHippocampal Area 2 (Medial Temporal Cortex) | Right | Thickness | T1W | –0,47 |
| 56 | Sagittal stratum | Left | TR | DTI | –0,45 |
Fig. 1
Forward model weights associated with the ROI measures. DTI-derived features (i.e. FA, MD) are reported on the left, while T1W-derived ones (i.e. cortical thickness, volume) are reported on the right. The ROI intensity and color-code are used to report the weight magnitude and sign, respectively.
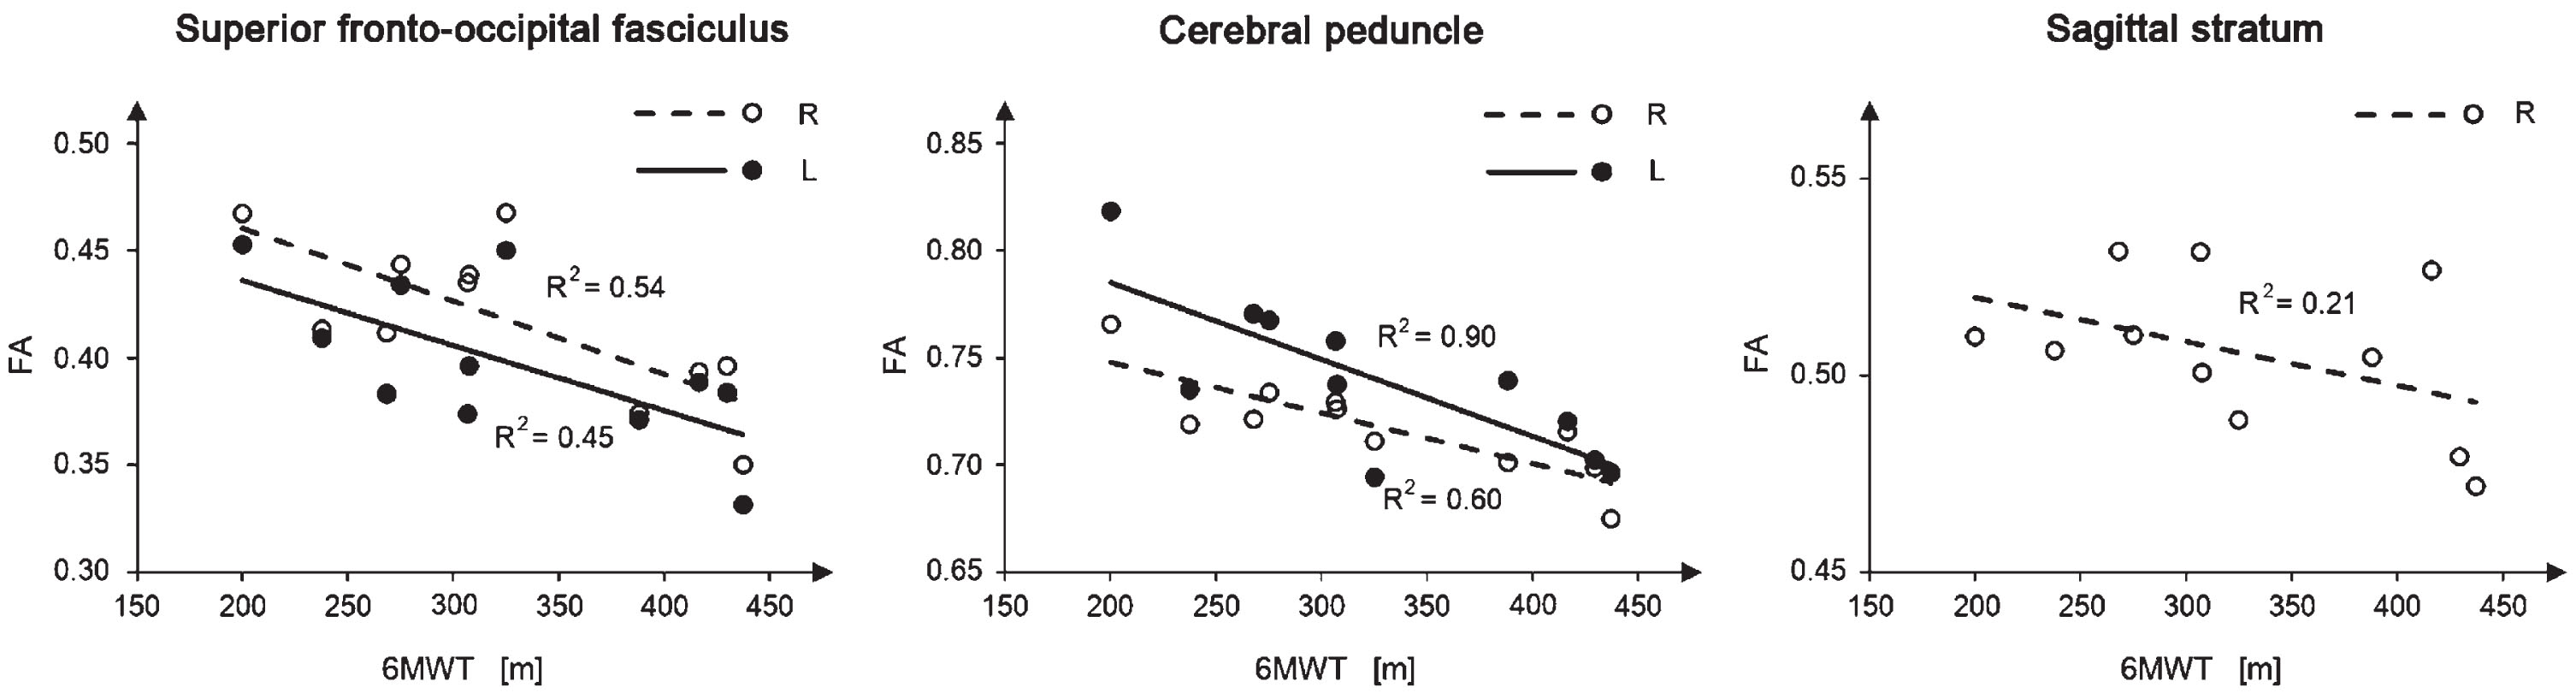
Five out of the 56 features used in the classification experiment showed a significant correlation with the 6MWT score and are reported in Fig. 2. All of them report a negative correlation between the 6MWT score and the FA measured in the superior fronto-occipital fasciculus (bilaterally), in the cerebral peduncle (bilaterally), and in the right sagittal stratum. The strongest correlations are observed in the cerebral peduncle, with a R2 of 0.9 and 0.6 in the left and in the right regions, respectively. The other correlation analyses with the clinical variables were not significant.
4DISCUSSION
To the best of our knowledge, this is the first study applying a machine learning-based method to perform an integrated multimodal analysis of the impact of DMD on the CNS. We explored the possible presence of brain abnormalities specifically associated with DMD, accounting for the presence of comorbid conditions, such as intellectual disability or ASD diagnosis.
Our study population is composed by male subjects with DMD, cognitive and behavioral difficulties (mean IQ level 72.3±16.6, 5 subjects with ASD) and is comparable to DMD groups described by several authors in terms of number of DMD subjects and heterogeneous clinical profile [9, 16, 22, 23, 26, 50]. Most previous studies focused on genotype and cognitive/behavioral phenotype relationship, underlying the correlation between deletion in the distal portion (downstream to exon 45) of the dystrophin gene and cognitive impairment [8, 24]. Attempts to clarify the role played by dystrophin in the brain have so far started from the evaluation of patients with cognitive or behavioral difficulties, or from comparisons between patients with vs without cognitive impairment, but these approaches did not allow (us) to understand its direct role in the brain. Our control population does not only include healthy subjects but also patients with cognitive impairments and/or diagnosis of ASD (mean IQ level 72.1±22.3; 5 patients with ASD). Thus, the clinical and control groups are comparable in terms of cognitive and behavioral profiles. Our approach was not limited to a comparison of cognitive and behavioral profiles, but also included comorbidities as confounding factors in the analysis to better isolate differences directly related to the DMD diagnosis.
Fig. 2
Linear regression of the ROI measures that significantly correlate with the 6MWT score. White/black circles represent the single subject samples, while the continuous/dashed lines represent the linear regression line. Only ambulant patients with DMD were used in this analysis. Significant bilateral correlations were reported in the same panel for visualization purposes, even if they were computed independently from each other.
The classification accuracy in our experiment was significantly larger than those associated from a random classifier, which suggests a direct relationship between the DMD diagnosis, thus the lack of dystrophin, and the pattern of altered measures identified in the patients’ CNS. As similar confounding factors and comorbidities are present in both groups (i.e., DMD vs controls), we can speculate that the identified alterations are specifically associated to DMD diagnosis.
Similarly to our study, [16] combined both structural T1 W and DTI images and reported significant alterations in the GM and WM of subjects with DMD vs controls. Differently from our study, Doorenweed and colleagues performed independent analyses and did not investigate any relationship between DTI and T1 W images. Our single integrated analysis and post-hoc weight analysis suggests a greater involvement of WM vs cortical GM in the lack of dystrophin.
Our analysis of the feature weights highlighted a significant axonal damage in several WM fiber bundles (posterior thalamic radiation, cerebellar peduncles, fornix, medial lemniscus), characterized mainly by reduced FA and increased MD. Other studies reported similar results [15, 22], even though they showed a more widespread impact of the condition on the WM. This may be due to differences in the control groups and analysis methods. Inclusion of ASD and lower IQ subjects in the control group increases measure variability and their overlap with those derived from DMD patients, thus reducing the probability of finding significant differences. Moreover, the machine learning approach aimed to identify few alterations representing a signature of DMD rather than a comprehensive inventory of all differences between the two groups. Among the WM fibers identified in our analysis, those related to the cerebellum (i.e., the peduncles) showed high weights, suggesting a large DMD-related alteration. Cerebellum involvement in DMD was suggested also in previous studies based on clinical phenotype rather than on imaging techniques [51–53], even when only DMD patients without cognitive impairment were considered [53].
Consistently with other studies, we also reported reduced cortical thickness, mainly in the motor cortex, cingulate cortex, hippocampal area and insula. In the first studies with TC, imaging data revealed slight cerebral and cortical atrophy in subjects with DMD and low IQ and in the subjects with DMD and normal IQ [15, 54]. Lower total brain and gray matter volumes in subjects with DMD compared to age-matched healthy controls were also reported in [16].
We only focused on structural alterations associated with DMD, however previous studies demonstrated an involvement of metabolic and/or functional alterations, too [17–19]. These studies show an interesting overlap with our results, suggesting that regions involved in the DMD cerebral phenotype are characterized not only by structural, but also by metabolic and/or functional alterations. Behavioral disturbances have been also identified among the side effects of daily treatment either with prednisone or with deflazacort [55]; several researches underline the risk of cognitive and behavioral disturbances [56–58], also associated with structural alterations in children and teenagers treated with steroids [59, 60]. A detailed analysis of 196 of the young DMD steroid naive patients (mean age 5.8 years), just before the recruitment in the study from Guglieri [55] showed the presence of speech delay, learning difficulties, inattentive overactive and oppositional defiant behavior, autism spectrum disorders and psychosocial adjustment challenges [61]. In consideration of the neurodevelopment problems emerging from our study (ASD and MR), these should not be influenced from the steroid therapy that is anyhow equally distributed between patients treated with steroid at the time of evaluation (10 patients) and those treated in the past or steroid-naive (8 patients). Furthermore, we performed a post-hoc analysis on the relevant features selected for the classification experiment finding no significant impact of the steroid therapy on our data (see supplementary material).
Our study presents with some limitations. Despite it being similar to other studies [9, 16, 22, 23, 26, 50], our sample size is still relatively small and may have affected classification performances and model generalizability [62]. To mitigate this and avoid overfitting, we used a simple classification model, i.e. a linear kernel SVM without tuning the penalty parameter C. The feature selection procedure can also affect both classification performances and the subsequent forward model weight analysis, as some features may have been excluded even if somehow affected. Our database and analysis methods were however good enough to identify some MRI-derived markers of structural brain abnormalities associated with DMD, even if replication studies are necessary to confirm our findings. Finally, we considered only a small set of DMD comorbidity factors, i.e., mental retardation and ASD, with a small number of subjects. Both mental retardation and ASD are heterogeneous conditions that cannot be fully characterized with such small numbers. However, it is worth mentioning that we did not claim to investigate mental retardation and/or ASD, our aim was to provide a tool to account for their presence while investigating the main effect of DMD. It is reasonable to expect that a larger sample size would allow describing further comorbidities and/or significant clinical factors, as well as increasing the sensitivity and specificity of the analysis.
In conclusion, we suggest that the multivariate analysis and inclusion of comorbidities both in the control group and in the analysis allow the identification of a small pattern of alterations in the CNS likely associated with the DMD diagnosis. In particular, dystrophin deficiency seems to directly affect the microstructural integrity of long fiber bundles that can be caused by an abnormal expression of dystrophin. In our opinion, our findings support the advantages of the proposed approach in identifying DMD outcomes and providing a shortlist of regions and measures for deeper consideration to further investigate the role of dystrophin in the brain.
ACKNOWLEDGMENTS
This work was partially supported by grants from the Italian Ministry of Health to Denis Peruzzo (“Ricerca corrente” grant)
CONFLICT OF INTEREST
The authors have no conflict of interest to report.
DATA AVAILABILITY
The data supporting the findings of this study are available on request to the corresponding author.
SUPPLEMENTARY MATERIAL
[1] The supplementary material is available in the electronic version of this article: https://dx.doi.org/10.3233/JND-230075.
REFERENCES
[1] | Waite P , McManus F , Shafran R Cognitive behaviour therapy for low self-esteem: a preliminary randomized controlled trial in a primary care setting.J Behav Ther Exp Psychiatry. (2012) ;43: (4):1049–57.doi: 10.1016/j.jbte2012.04.006.Epub 2012 May 14. PMID: 22683442. |
[2] | Fujimoto T , Itoh K , Yaoi T , Fushiki S Somatodendritic and excitatory postsynaptic distribution of neuron-type dystrophin isoform, Dp40, in hippocampal neurons.Biochem Biophys Res Commun. (2014) ;452: (1):79–84.doi: 10.1016/j.bbrc.2014.08.064. Epub 2014 Aug 21. PMID: 25152393 |
[3] | Doorenweerd N , Mahfouz A , van Putten M , Kaliyaperumal R , T’ Hoen PAC , Hendriksen JGM , Aartsma-Rus AM , Verschuuren JJGM , Niks EH , Reinders MJT , Kan HE , Lelieveldt BPF Timing and localization of human dystrophin isoform expression provide insights into the cognitive phenotype of Duchenne muscular dystrophy.Sci Re. (2017) ;7: (1):12575.doi: 10.1038/s41598-017-12981-5. Erratum in: Sci Re2018 Mar 1;8(1):4058. PMID: 28974727; PMCID: PMC5626779 |
[4] | García-Cruz C , Merino-Jiménez C , Aragón J , Ceja V , González-Assad B , Reyes-Grajeda JP , Montanez C Overexpressionof the dystrophins Dp40 and Dp40L170P modifies neurite outgrowth andthe protein expression profile of PC12 cells.Sci Re. (2022) ;12: (1):1410.doi: 10.1038/s41598-022-05271-2..PMID: 35082358;PMCID: PMC8791958. |
[5] | García-Cruz C , Aragón J , Lourdel S , Annan A , Roger JE , Montanez C , Vaillend C Tissue- and cell-specific whole-transcriptome meta-analysis from brain and retina reveals differential expression of dystrophin complexes and new dystrophin spliced isoforms.Hum Mol Genet. (2023) ;32: (4):659–676.doi: 10.1093/hmg/ddac236. PMID: 36130212; PMCID: PMC9896479 |
[6] | Aartsma-Rus A , Ginjaar IB , Bushby K The importance of genetic diagnosis for Duchenne muscular dystrophy.J Med Genet. (2016) ;53: (3):145–51.doi: 10.1136/jmedgenet-2015-103387. Epub 2016 Jan 11. PMID: 26754139; PMCID: PMC4789806 |
[7] | Juan-Mateu J , Gonzalez-Quereda L , Rodriguez MJ , Baena M , Verdura E , Nascimento A , Ortez C , Baiget M , Gallano P DMD Mutations in 576 Dystrophinopathy Families: A Step Forward in Genotype-Phenotype Correlations.PLoS One. (2015) ;10: (8):e0135189.doi: 10.1371/journal.pone.0135189. PMID: 26284620; PMCID: PMC4540588 |
[8] | D’Angelo MG , Lorusso ML , Civati F , Comi GP , Magri F , Del Bo R , Guglieri M , Molteni M , Turconi AC , Bresolin N Neurocognitive profiles in Duchenne muscular dystrophy and gene mutation site.Pediatr Neurol. (2011) ;45: (5):292–9.doi: 10.1016/j.pediatrneurol.2011.08.003.PMID: 22000308; PMCID: PMC3200430 |
[9] | Pane M , Lombardo ME , Alfieri P , D’Amico A , Bianco F , Vasco G , Piccini G , Mallardi M , Romeo DM , Ricotti V , Ferlini A , Gualandi F , Vicari S , Bertini E , Berardinelli A , Mercuri E Attention deficit hyperactivity disorder and cognitive function in Duchenne muscular dystrophy: phenotype-genotype correlation.J Pediatr. (2012) ;161: (4):705–9.e1.doi: 10.1016/j.jpeds.2012.03.020.Epub 2012 May 5. PMID: 22560791 |
[10] | Ricotti V , Mandy WPL , Scoto M , Pane M , Deconinck N , Messina S , et al Neurodevelopmental, emotional, and behavioural problems in duchenne muscular dystrophy in relation to underlying dystrophin gene mutations.Dev Med Child Neuro. (2016) ;58: l77–84https://doi.org/10.1111/dmcn.12922. |
[11] | Helleringer R , Le Verger D , Li X , Izabelle C , Chaussenot R , Belmaati-Cherkaoui M , Dammak R , Decottignies P , Daniel H , Galante M , Vaillend C Cerebellar synapse properties and cerebellum-dependent motor and non-motor performance in Dp71-null mice.Dis Model Mech. (2018) ;11: (7):dmm033258.doi: 10.1242/dmm.033258.PMID: 29895670; PMCID: PMC6078407 |
[12] | Hoogland G , Hendriksen RGF , Slegers RJ , Hendriks MPH , Schijns OEMG , Aalbers MW , Vles JSH The expression of the distal dystrophin isoforms Dp140 and Dp71 in the human epileptic hippocampus in relation to cognitive functioning.Hippocampus. (2019) ;29: (2):102–110.doi: 10.1002/hipo.23015.Epub 2018 Dec 6. PMID: 30069964 |
[13] | Cotton S , Voudouris NJ , Greenwood KM Intelligence and Duchenne muscular dystrophy: full-scale, verbal, and performance intelligence quotients.Dev Med Child Neurol. (2001) ;43: (7):497–501.doi: 10.1017/s0012162201000913.PMID: 11463183 |
[14] | Hendriksen JG , Vles JS Neuropsychiatric disorders in males with duchenne muscular dystrophy: frequency rate of attention-deficit hyperactivity disorder (ADHD), autism spectrum disorder, and obsessive–compulsive disorder.J Child Neurol. (2008) ;23: (5):477–81.doi: 10.1177/0883073807309775.Epub 2008 Mar 19. PMID: 18354150 |
[15] | Yoshioka M , Okuno T , Honda Y , Nakano Y Central nervous system involvement in progressive muscular dystrophy.Arch Dis Child. (1980) ;55: (8):589–94.doi: 10.1136/adc.55.8.589.PMID: 7436514; PMCID: PMC1627064 |
[16] | Doorenweerd N , Straathof CS , Dumas EM , Spitali P , Ginjaar IB , Wokke BH , Schrans DG , van den Bergen JC , van Zwet EW , Webb A , van Buchem MA , Verschuuren JJ , Hendriksen JG , Niks EH , Kan HE Reduced cerebral gray matter and altered white matter in boys with Duchenne muscular dystrophy.Ann Neurol. (2014) ;76: (3):403–11.doi: 10.1002/ana.24222.Epub 2014 Jul 24. PMID: 25043804 |
[17] | Bresolin N , Castelli E , Comi GP , Felisari G , Bardoni A , Perani D , et al Cognitive impairment in Duchenne muscular dystrophy.Neuromuscul Disord. (1994) ;4: :359–69. |
[18] | Lee JS , Pfund Z , Juhász C , Behen ME , Muzik O , Chugani DC , et al Altered regional brain glucose metabolism in duchenne musculardystrophy: A pet study.Muscle Nerve. (2002) ;26: 506–12https://doi.org/10.1002/mus.10238. |
[19] | Doorenweerd N , Dumas EM , Ghariq E , Schmid S , Straathof CSM , Roest A AW , et al Decreased cerebral perfusion in duchenne muscular dystrophy patients. Neuromuscul Disord. 2016.https://doi.org/10.1016/j.nmd.2016.10.005. |
[20] | Doorenweerd N , de Rover M , Marini-Bettolo C , Hollingsworth KG , Niks EH , Hendriksen JGM , Kan HE , Straub V Resting-state functional MRI shows altered default-mode network functional connectivity in Duchenne muscular dystrophy patients.Brain Imaging Behav. (2021) ;15: (5):2297–2307.doi: 10.1007/s11682-020-00422-3.Epub 2021 Jan 3 |
[21] | Doorenweerd N Combining genetics, neuropsychology and neuroimaging to improve understanding of brain involvement in Duchenne muscular dystrophy –a narrative review.Neuromuscular Disorders. (2020) ;30: 437–442.doi: 10.1016/j.nmd.2020.05.001. |
[22] | Tyagi R , Aggarwal P , Mohanty M , Dutt V , Anand A Computational cognitive modeling and validation of Dp140 induced alteration of working memory in Duchenne Muscular Dystrophy.Sci Re. (2020) ;10: (1):11989.doi: 10.1038/s41598-020-68381-9.PMID: 32686699; PMCID: PMC7371893 |
[23] | Preethish-Kumar V , Shah A , Kumar M , Ingalhalikar M , Polavarapu K , Afsar M , Rajeswaran J , Vengalil S , Nashi S , Thomas PT , Sadasivan A , Warrier M , Nalini A , Saini J In Vivo Evaluation of White Matter Abnormalities in Children with Duchenne Muscular Dystrophy Using DTI.AJNR Am J Neuroradiol.-. (2020) ;41: (7):1271–1278.doi: 10.3174/ajnr.A6604.Epub 2020 Jul 2. PMID: 32616576; PMCID: PMC7357653 |
[24] | Lorusso ML , Civati F , Molteni M , Turconi AC , Bresolin N , D’Angelo MG Specific profiles of neurocognitive and reading functions in a sample of 42 Italian boys with Duchenne Muscular Dystrophy.Child Neuropsychol.. (2013) ;19: (4):350–69.doi: 10.1080/09297049.2012.660912. Epub 2012 Mar 5. PMID: 22385039 |
[25] | Colombo P , Nobile M , Tesei A , Civati F , Gandossini S , Mani E , Molteni M , Bresolin N , D’Angelo G Assessing mental health in boys with Duchenne muscular dystrophy: Emotional, behavioural and neurodevelopmental profile in an Italian clinical sample.Eur J Paediatr Neurol. (2017) ;21: (4):639–647.doi: 10.1016/j.ejpn.2017.02.007.Epub 2017 Mar 24. PMID: 28392227 |
[26] | Fu Y , Dong Y , Zhang C , Sun Y , Zhang S , Mu X , Wang H , Xu W , Wu S Diffusion tensor imaging study in Duchenne muscular dystrophy.Ann Transl Med. (2016) ;4: (6):109.doi: 10.21037/atm.2016.03.19.PMID: 27127762; PMCID: PMC4828747 |
[27] | Birnkrant DJ , Bushby K , Bann CM , Apkon SD , Blackwell A , Colvin MK , Cripe L , Herron AR , Kennedy A , Kinnett K , Naprawa J , Noritz G , Poysky J , Street N , Trout CJ , Weber DR , Ward LM; DMD Care Considerations Working Group Diagnosis and management of Duchenne muscular dystrophy, part 3: primary care, emergency management, psychosocial care, and transitions of care across the lifespan..Lancet Neurol. (2018) ;17: (5):445–455.doi: 10.1016/S1474-4422(18)30026-7. Epub 2018 Feb 2.PMID: 29398641 |
[28] | McDonald CM , Henricson EK , Han JJ , Abresch RT , Nicorici A , et al 6MWT as a new outcome measure in Duchenne muscular dystrophy.Muscle Nerve. (2010) ;41: :500–510. |
[29] | Bérard C , Payan C , Hodgkinson I , Fermanian J; MFM Collaborative Study Group. A motor function measure for neuromuscular diseases. Construction and validation study.Neuromuscul Disord. (2005) ;15: (7):463–70.doi: 10.1016/j.nmd.2005.03.004.PMID: 16106528 |
[30] | Gordon B , Test Review: Wechsler, D. The Wechsler Preschool and Primary Scale of Intelligence, Third Edition (WPPSI-III). San Antonio, TX: The Psychological Corporation.Canadian Journal of School Psychology. (2004) ;19: (1-2):205–220.doi: 10.1177/082957350401900111. |
[31] | Orsini A , Pezzuti L , Wechsler D WISC-IV :Wechsler intelligence scale for children / David Wechsler; adattamento italiano a cura di Arturo Orsini e Lina Pezzuti. Quarta edizione. Giunti O.S. Organizzazioni Speciali, 2012. |
[32] | Griffiths R The abilities of young children: A comprehensive system of mental measurement for the first eight years of life. London: Child Development Research Centre. 1970. |
[33] | Lord C , Rutter M , DiLavore PC , Risi S , Gotham K Autism diagnostic observation schedule, volumeADOS-2(2nd ed.). Western Psychological Services. 2012. |
[34] | Tustison NJ , Avants BB , Cook PA , Zheng Y , Egan A , Yushkevich PA , Gee JC N4ITK: Improved N3 Bias Correction.IEEE Trans. Med. Imaging. (2010) ;29: :1310–1320. |
[35] | Glasser MF , Coalson TS , Robinson EC , Hacker CD , Harwell J , Yacoub E , Ugurbil EYK , Andersson J , Beckmann CF , Jenkinson M , et al A multi-modal parcellation of human cerebral cortex.Nat. Cell Biol. (2016) ;536: :171–178. |
[36] | Fischl B , Salat DH , van der Kouwe AJ , Makris N , Segonne F , Quinn BT , Dale AM Sequence-independent segmentation of magnetic resonance images.Neuroimage. (2004) ;23: (Suppl 1), S69–84. |
[37] | Fischl B , Dale AM Measuring the thickness of the human cerebral cortex from magnetic resonance images.Proc Natl Acad Sci U S A. (2000) ;97: :11050–11055. |
[38] | Pierpaoli C , Walker L , Irfanoglu MO et al.,Tortoise: an integrated software package for processing of diffusion MRI data. In: Proceedings of the annual meeting of the International Society for Magnetic Resonance in Medicine (ISMRM 2010), 1-7 May 2010. Stockholm, Sweden, 2010, p. 1597 |
[39] | Irfanoglu MO , Nayak A , Jenkins J , Pierpaoli C TORTOISEv3: Improvements and New Features of the NIH Diffusion MRI Processing Pipeline. In: Proceedings of the annual meeting of the International Society for Magnetic Resonance in Medicine (ISMRM 2017) 25th annual meeting, Honolulu, HI, abstract #3540. |
[40] | Rohde GK , Barnett AS , Basser PJ , et al., Comprehensive approach for correction of motion and distortion in diffusion-weighted MRI.Magn Reson Med. (2004) ;51: 103–114.https://doi.org/10.1002/mrm.10677 |
[41] | Irfanoglu MO , Nayak A , Jenkins J , Hutchinson EB , Sadeghi N , Thomas CP , Pierpaoli C DR-TAMAS: Diffeomorphic Registration for Tensor Accurate Alignment of Anatomical Structures.Neuroimage.. (2016) ;132: 439–454.doi: 10.1016/j.neuroimage.2016.02.066.Epub 2016 Feb 28 |
[42] | Irfanoglu MO , Beyh A , Catani M , Dell’Acqua F , Pierpaoli C ReImagining theYoung Adult Human Connectome Project (HCP) Diffusion MRI Dataset. In: Proceeding of 31st Annual Meeting of ISMRM. London, 2022. |
[43] | Habeck CG Basics of multivariate analysis in neuroimaging data.J Vis Ex (2010) (41):1988.doi: 10.3791/1988. PMID: 20689509; PMCID: PMC3074457 |
[44] | Cremers HR , Wager TD , Yarkoni T The relation between statistical power and inference in fMRI.PLoS One. (2017) ;12: (11):e0184923.doi: 10.1371/journal.pone.0184923. PMID: 29155843; PMCID: PMC5695788 |
[45] | Tabachnick BG , Fidell LS Using Multivariate Statistics (5th ed.). Boston: Pearson Education 2007. |
[46] | Saeys Y , Inza I , Larrañaga P A review of feature selectiontechniques in bioinformatics.Bioinformatics. (2007) ;23: (19):2507–17.doi: 10.1093/bioinformatics/btm344.Epub 2007 Aug 24. PMID:17720704 |
[47] | Vapnik VN Statistical learning theory. Wiley, New York 1998. |
[48] | Poldrack RA , Huckins G , Varoquaux G Establishment of best practices for evidence for prediction, a review.JAMA Psychiatry. (2019) )87: 534–540. |
[49] | Haufe S , Meinecke F , Görgen K , Dähne S , Haynes J-D , Blankertz B , Bießmann F On the interpretation of weight vectors of linear models in multivariate neuroimaging.NeuroImage. (2014) ;87: :96–110. |
[50] | Ricotti V , Jagle H , Theodorou M , Moore AT , Muntoni F , Thompson DA Ocular and neurodevelopmental featuresof Duchenne muscular dystrophy: a signature of dystrophin function in the central nervous system. Eur J Hum Genet. 2015.https://doi.org/ejhg2015135[pii];[doi].doi:10.1038/ejhg.2015.1350. |
[51] | Cyrulnik SE , Hinton VJ Duchenne muscular dystrophy: a cerebellar disorder?.Neurosci Biobehav Rev. (2008) ;32: (3):486–96.doi: 10.1016/j.neubiorev.2007.09.001.Epub 2007 Oct 4. PMID: 18022230 |
[52] | Schara U , Busse M , Timmann D , Gerwig M Cerebellar-dependent associative learning is preserved in Duchenne muscular dystrophy: a study using delay eyeblink conditioning.PLoS One. (2015) ;10: (5):e0126528.doi: 10.1371/journal.pone.0126528.PMID: 25973604; PMCID: PMC4431835 |
[53] | Vicari S , Piccini G , Mercuri E , Battini R , Chieffo D , Bulgheroni S , Pecini C , Lucibello S , Lenzi S , Moriconi F , Pane M , D’Amico A , Astrea G , Baranello G , Riva D , Cioni G , Alfieri P Implicit learning deficit in children with Duchenne muscular dystrophy: Evidence for a cerebellar cognitive impairment?. PLoS One. (2018) ;13: (1):e0191164.doi: 10.1371/journal.pone.0191164. PMID: 29338029; PMCID: PMC5770044 |
[54] | Al-Qudah AA , Kobayashi J , Chuang S , Dennis M , Ray P Etiology of intellectual impairment in duchenne muscular dystrophy.Pediatr Neurol. (1990) ;6: 57–9https://doi.org/10.1016/0887-8994(90)90081-B. |
[55] | Guglieri M , Bushby K , McDermott MP , Hart KA , Tawil R , Martens WB , Herr BE , McColl E , Speed C , Wilkinson J , Kirschner J , King WM , Eagle M , Brown MW , Willis T , Griggs RC , FOR-DMD Investigators of the Muscle Study Group; Straub V , van Ruiten H , Childs AM , Ciafaloni E , Shieh PB , Spinty S , Maggi L , Baranello G , Butterfield RJ , Horrocks IA , Roper H , Alhaswani Z , Flanigan KM , Kuntz NL , Manzur A , Darras BT , Kang PB , Morrison L , Krzesniak-Swinarska M , Mah JK , Mongini TE , Ricci F , von der Hagen M , Finkel RS , O’Reardon K , Wicklund M , Kumar A , McDonald CM , Han JJ , Joyce N , Henricson EK , Schara-Schmidt U , Gangfuss A , Wilichowski E , Barohn RJ , Statland JM , Campbell C , Vita G , Vita GL , Howard JF Jr , Hughes I , McMillan HJ , Pegoraro E , Bello L , Burnette WB , Thangarajh M , Chang T Effect of Different Corticosteroid Dosing Regimens on Clinical Outcomes in Boys With Duchenne Muscular Dystrophy: A Randomized Clinical Trial.JAMA. (2022) ;327: (15):1456–1468.doi: 10.1001/jama.2022.4315.PMID: 35381069; PMCID:PMC8984930. |
[56] | Judd LL , Schettler PJ , Brown ES , Wolkowitz OM , Sternberg EM , Bender BG , Bulloch K , Cidlowski JA , de Kloet ER , Fardet L , Joëls M , Leung DY , McEwen BS , Roozendaal B , Van Rossum EF , Ahn J , Brown DW , Plitt A , Singh G Adverse consequences of glucocorticoid medication:psychological, cognitive, and behavioral effects.Am J Psychiatry. (2014) ;171: (10):1045–51.doi: 10.1176/appi.aj2014.13091264.Erratumin: Am J Psychiatry. 2014;171(11):1224. PMID: 25272344 |
[57] | Matthews E , Brassington R , Kuntzer T , Jichi F , Manzur AY Corticosteroids for the treatment of Duchenne muscular dystrophy.Cochrane Database Syst Rev. (2016) )2016: (5):CD003725.doi: 10.1002/14651858.CD003725.pub4.PMID: 27149418; PMCID: PMC8580515 |
[58] | Holm SK , Vestergaard M , Madsen KS , Baaré WF , Hammer TB , Born AP , Siebner HR , Paulson OB , Uldall PV Children and adolescentspreviously treated with glucocorticoids display lower verbalintellectual abilities.Acta Paediatr. (2015) ;104: (8):784–91.doi: 10.1111/apa.13010. Epub 2015 Apr 23. PMID: 25801849 |
[59] | Holm SK , Madsen KS , Vestergaard M , Paulson OB , Uldall P , Siebner HR , Born AP , Baaré WFC Total brain, cortical, and white mattervolumes in children previously treated with glucocorticoids.PediatrRes. (2018) ;83: (4):804–812.doi: 10.1038/pr.2017.312. Epub 2018 Jan 10.PMID: 29252981 |
[60] | Holm SK , Madsen KS , Vestergaard M , Born AP , Paulson OB , Siebner HR , Uldall P , Baaré WFC Previous glucocorticoid treatment inchildhood and adolescence is associated with long-term differencesin subcortical grey matter volume and microstructure.NeuroimageClin. (2019) ;23: 101825.doi: 10.1016/j.nicl.2019.101825. Epub 2019 Apr11. PMID: 31004915; PMCID: PMC6475768 |
[61] | Thangarajh M , Hendriksen J , McDermott MP , Martens W , Hart KA , Griggs RC , Muscle Study Group and Relationships between DMD mutations and neurodevelopment in dystrophinopathy.Neurology. (2019) ;93: (17):e1597–e1604.doi: 10.1212/WNL.0000000000008363. Epub 2019 Oct 8. PMID: 31594858; PMCID: PMC6946466 |
[62] | Varoquaux G Cross-validation failure: Small sample sizes lead to large error bars.Neuroimage. (2018) ;180: (Pt A):68–77.doi: 10.1016/j.neuroimage.2017.06.061. Epub 2017 Jun 24. PMID: 28655633 |


