
Dyslipidemia in Muscular Dystrophy: A Systematic Review and Meta-Analysis
Abstract
Background:
Muscular dystrophies (MDs) are characterized by chronic muscle wasting but also poorly understood metabolic co-morbidities. We have recently shown that Duchenne MD (DMD) patients, dogs and asymptomatic carriers are affected by a new form of dyslipidemia that may exacerbate muscle damage.
Objective:
We aimed to perform a systematic review and meta-analysis for evidence that other types of MDs are associated with dyslipidemia compared to healthy controls.
Methods:
Search was conducted using MEDLINE, EMBASE, Cochrane Central Register of Controlled Trials for reports that compare plasma/serum lipids from MD patients and controls, and meta-analysis of cross-sectional studies quantifying total cholesterol, high-density lipoprotein, low density lipoprotein and triglycerides was performed.
Results:
Out of 749 studies, 17 met our inclusion criteria for meta-analysis. 14 of the 17 studies (82%) included investigated myotonic dystrophy (DM); other studies were on pseudohypertrophic MD (PMD) or DMD. As a whole, MD individuals had significantly higher levels of circulating total cholesterol (Hedges’ g with 95% confidence interval [CI], 0.80 [0.03 – 1.56]; p = 0.04) and triglycerides (Hedges’ g with 95% confidence interval [CI], 2.28[0.63 – 3.92]; p = 0.01) compared to controls. Meta-regression analysis showed the percentage of male gender was significantly associated with the difference in total cholesterol (beta = 0.05; 95% CI, – 0.02 to 0.11; p = 0.043) and high-density lipoprotein (beta = – 9.38; 95% CI, – 16.26 to – 2.50; p = 0.028).
Conclusions:
MD is associated with significantly higher circulating levels of total cholesterol and triglycerides. However, caution on the interpretation of these findings is warranted and future longitudinal research is required to better understand this relationship.
ABBREVIATIONS
MD | Muscular dystrophy |
DMD | Duchenne muscular dystrophy |
BMD | Becker muscular dystrophy |
DM | myotonic dystrophy |
DM1 | myotonic dystrophy type 1 |
DM2 | myotonic dystrophy type 2 |
PMD | pseudohypertrophic muscular dystrophy |
FSHD | fascioscapularhumeral muscular dystrophy |
LGMD2B | limb-girdle muscular dystrophy type 2B |
LGMD1C | limb-girdle muscular dystrophy type 1C |
TC | total cholesterol |
HDL | high-density lipoprotein |
LDL | low-density lipoprotein |
VLDL | very low-density lipoprotein |
TG | triglycerides |
ApoB | apolipoprotein B |
CK | creatine kinase |
NOS | Newcastle-Ottawa Scale |
INTRODUCTION
Muscular dystrophies (MDs) are a heterogenous group of neuromuscular disorders caused by mutations to more than 40 different genes that code for proteins involved in a range of cellular functions that include sarcolemma maintenance, extracellular matrix attachment and gene transcription. MDs are classified in 7 subtypes, Duchenne (DMD), Becker (BMD), limb-girdle (LGMD), myotonic (DM), oculopharygeal, fascioscapularhumeral (FSHD) and congenital MD. The global prevalence of MD is unknown due to variability in manifestation and method of diagnosis but has been estimated at approximately 16 cases per 100,00 individuals [1, 2] and is higher in males. Progressive weakness and degeneration of muscle tissues [3] are hallmarks of MD, which may result in loss of ambulation and even death from cardiopulmonary dysfunction in more severe cases [4]. Steroid therapy is credited for prolonging the life of DMD patients, however MD patients are also treated for a range of metabolic abnormalities, such as delayed puberty, abnormal bone growth, obesity, and insulin resistance, amongst many others test [5–7]. While some of these abnormalities may be secondary to steroids, MDs are increasingly considered whole body metabolic diseases that primarily affect the muscles [8, 9]. Whether targeting these metabolic co-morbidities can help preserve muscle function in patients is unknown.
We have recently provided evidence that DMD, BMD and LGMD2B patients are afflicted by new forms of genetic dyslipidemia that affect normal lipoprotein-associated cholesterol and triglycerides (TG) levels [9, 10]. This chronic dyslipidemic state is likely not secondary to muscle wasting or treatment as unmedicated, unaffected carrier females with only one dystrophin allele mutation and normal CK levels also showed elevated total cholesterol (TC) and low-density lipoprotein (LDL)-associated cholesterol, indicating a more primary dyslipidemic state intricately linked to abnormal dystrophin expression [9]. Dyslipidemia is well-documented to cause a range of conditions such as atherosclerosis in the case of high LDL or low HDL cholesterol [11] in addition to pancreatitis for hypertriglyceridemia [12] but also pathological changes to skeletal muscle tissues, including loss of muscle mass, density, strength, and fibre type switching [13–15]. Moreover, disruption of lipoprotein homeostasis is related to sarcopenia, cachexia, and diabetes [16–19] whereas low-fat diets were shown to improve insulin resistance in overweight adults and were associated with reductions in intramyocellular fat [20]. In vitro studies in primary human myotubes have revealed that cholesterol-induced insulin resistance could be rescued by co-treatment with HDL particles [21], which illustrates the complex interplay between documented regulators of whole-body metabolism and muscle homeostasis. While it is unknown whether MD-associated lipoprotein abnormalities play a causal role in muscle wasting typically observed in patients, reports documenting intra-myofiber free cholesterol accumulation in rodent and human DMD and LGMD2B biopsies [10, 22] along with disease exacerbation in MD animals with blunted apolipoprotein E expression are supportive of this novel concept [23, 24]. From a therapeutic perspective, treatment of severe DMD and LGMD2B mice with cholesterol absorption blocker ezetimibe drastically reduced muscle damage and prevented loss of ambulation, which combined with previous study of plasma miRNA in DMD patients, provided critical evidence of the significance of targeting cholesterol and lipoprotein metabolism as a cost-effective therapeutic option for patients [22, 25]. Since dyslipidemia may be linked to the poorly-understood muscle wasting and regeneration process and even serve as a biomarker of MD responsiveness to cholesterol metabolism-targeting approaches, we conducted a systematic review and meta-analysis of studies that compared circulating lipid levels of MD patients to that of normal controls.
MATERIALS AND METHODS
This systematic review was performed according to the recommendations in the Preferred Reporting Items for Systematic Reviews and Meta-Analyses (PRISMA) statement [26]. The protocol has been registered in Prospero database (registration ID: CRD42022357518).
Data sources and searches
A comprehensive search of three databases: 1. MEDLINE (Ovid) and Epub Ahead of Print, In-Process, In-Data-Review & Other Non-Indexed Citations, Daily and Versions 1946 to July 8, 2022; 2. EMBASE (Ovid) 1974 to July 8, 2022; 3. EBM Reviews - Cochrane Central Register of Controlled Trials (Ovid) June 2022, was conducted from date of inception to July 8th, 2022, by two individual reviewers. Combination of the following free text terms and major medical subject headings adapted to the requirements of each database were used: “muscular dystrophy,” “cholesterol,” “lipoprotein,” “triglyceride,” “dyslipidemia.” Boolean Logical Operators AND, OR were used. Detailed search strategy was listed in Supplementary Table S1. Reference lists of retrieved papers and review articles were hand-searched for additional relevant citations.
Study selection
The records obtained using the search strategy were assessed for eligibility by screening titles and abstracts, independently and parallelly by two reviewers. Potentially relevant studies were subsequently screened by full text reading, with any possible conflicts resolved by discussion and reaching a consensus. Studies included in the systematic review met the following inclusion criteria: a) Diagnosis of MD based on guidelines for genetic testing of muscle and neuromuscular junction disorders [27], or any other definition claimed by original studies’ authors; b) At least one of the following plasma/serum levels of lipids was reported: triglycerides (TG), total cholesterol (TC), high-density lipoprotein (HDL), low-density lipoprotein (LDL); c) Same data in non-muscular dystrophic population were reported; d) English only. Studies were excluded if: a) No clear diagnosis of MD was reported; b) Animal or in vitro studies; c) No report or measures of plasma/serum levels of lipids was reported; d) Absence of non-MD ‘healthy’ control lipid values, which is a requirement for meta-analysis.
Data extraction and quality assessment
Data collection was conducted independently by two reviewers. For data not clearly stated in the article but with statistical possibility, attempts were made to contact the original researcher to obtain the original values. For studies included in this analysis, the following variables were extracted if applicable: first author’s name, year of publication, total numbers of participants, study design, mean±SD or median (IQR) age of individuals, male vs female distribution (%), race (continent), mean±SD or median (IQR) Body Mass Index (BMI), applied definition(s) of MD, method used for MD identification, mean±SD or median (IQR) of muscle mass and physical performance in MD and non-MD cohorts, mean±SD or median (IQR) of plasma/serum TG, TC, LDL cholesterol and HDL cholesterol. Risk of bias of the included studies was assessed using the Newcastle-Ottawa Scale (NOS) [28] adapted for cross-sectional studies. A system of points was given to the eligible categories: (I) selection of the study population, (II) comparability, and (III) description of the outcome. The scale scores varied depending on the study design. For cross-sectional studies, it ranged from 0 to 10 points with ≥6 points considered as good quality.
Statistical analysis
Analyses were performed using STATA SE 17. Plasma/serum lipid level was meta-analyzed when at least one study contributed data in subgroups of different MD types. Considering different sample sizes among included studies, Hedges’ g was used for standardized mean differences calculation. Hedges’ correction factor was applied for studies with <50 subjects to avoid small-size studies biases. Calculations of mean and standard deviation (SD) for different groups were performed according to Cochrane Handbook for Systematic Reviews of Interventions. Estimation of mean and SD was calculated from sample size, median and inter quartile range (IQR) if necessary [29]. Study heterogeneity was measured using the chi2 and I2 statistics [30]. I2 values greater than 25% were considered to reflect low heterogeneity, 50% moderate, and 75% high heterogeneity. A random statistical analysis model was used. Given significant heterogeneity, a meta-regression analysis was performed using differences in MD subtype, mean age, percentage of male population as moderators. Subgroup meta-analysis was conducted based on MD subtypes. Forest plots were used to visualize the results. Funnel plots were used initially to evaluate visually publication bias while Egger’s regression test and Begg’s test were used to inferentially evaluate publication bias [31].
RESULTS
Search results
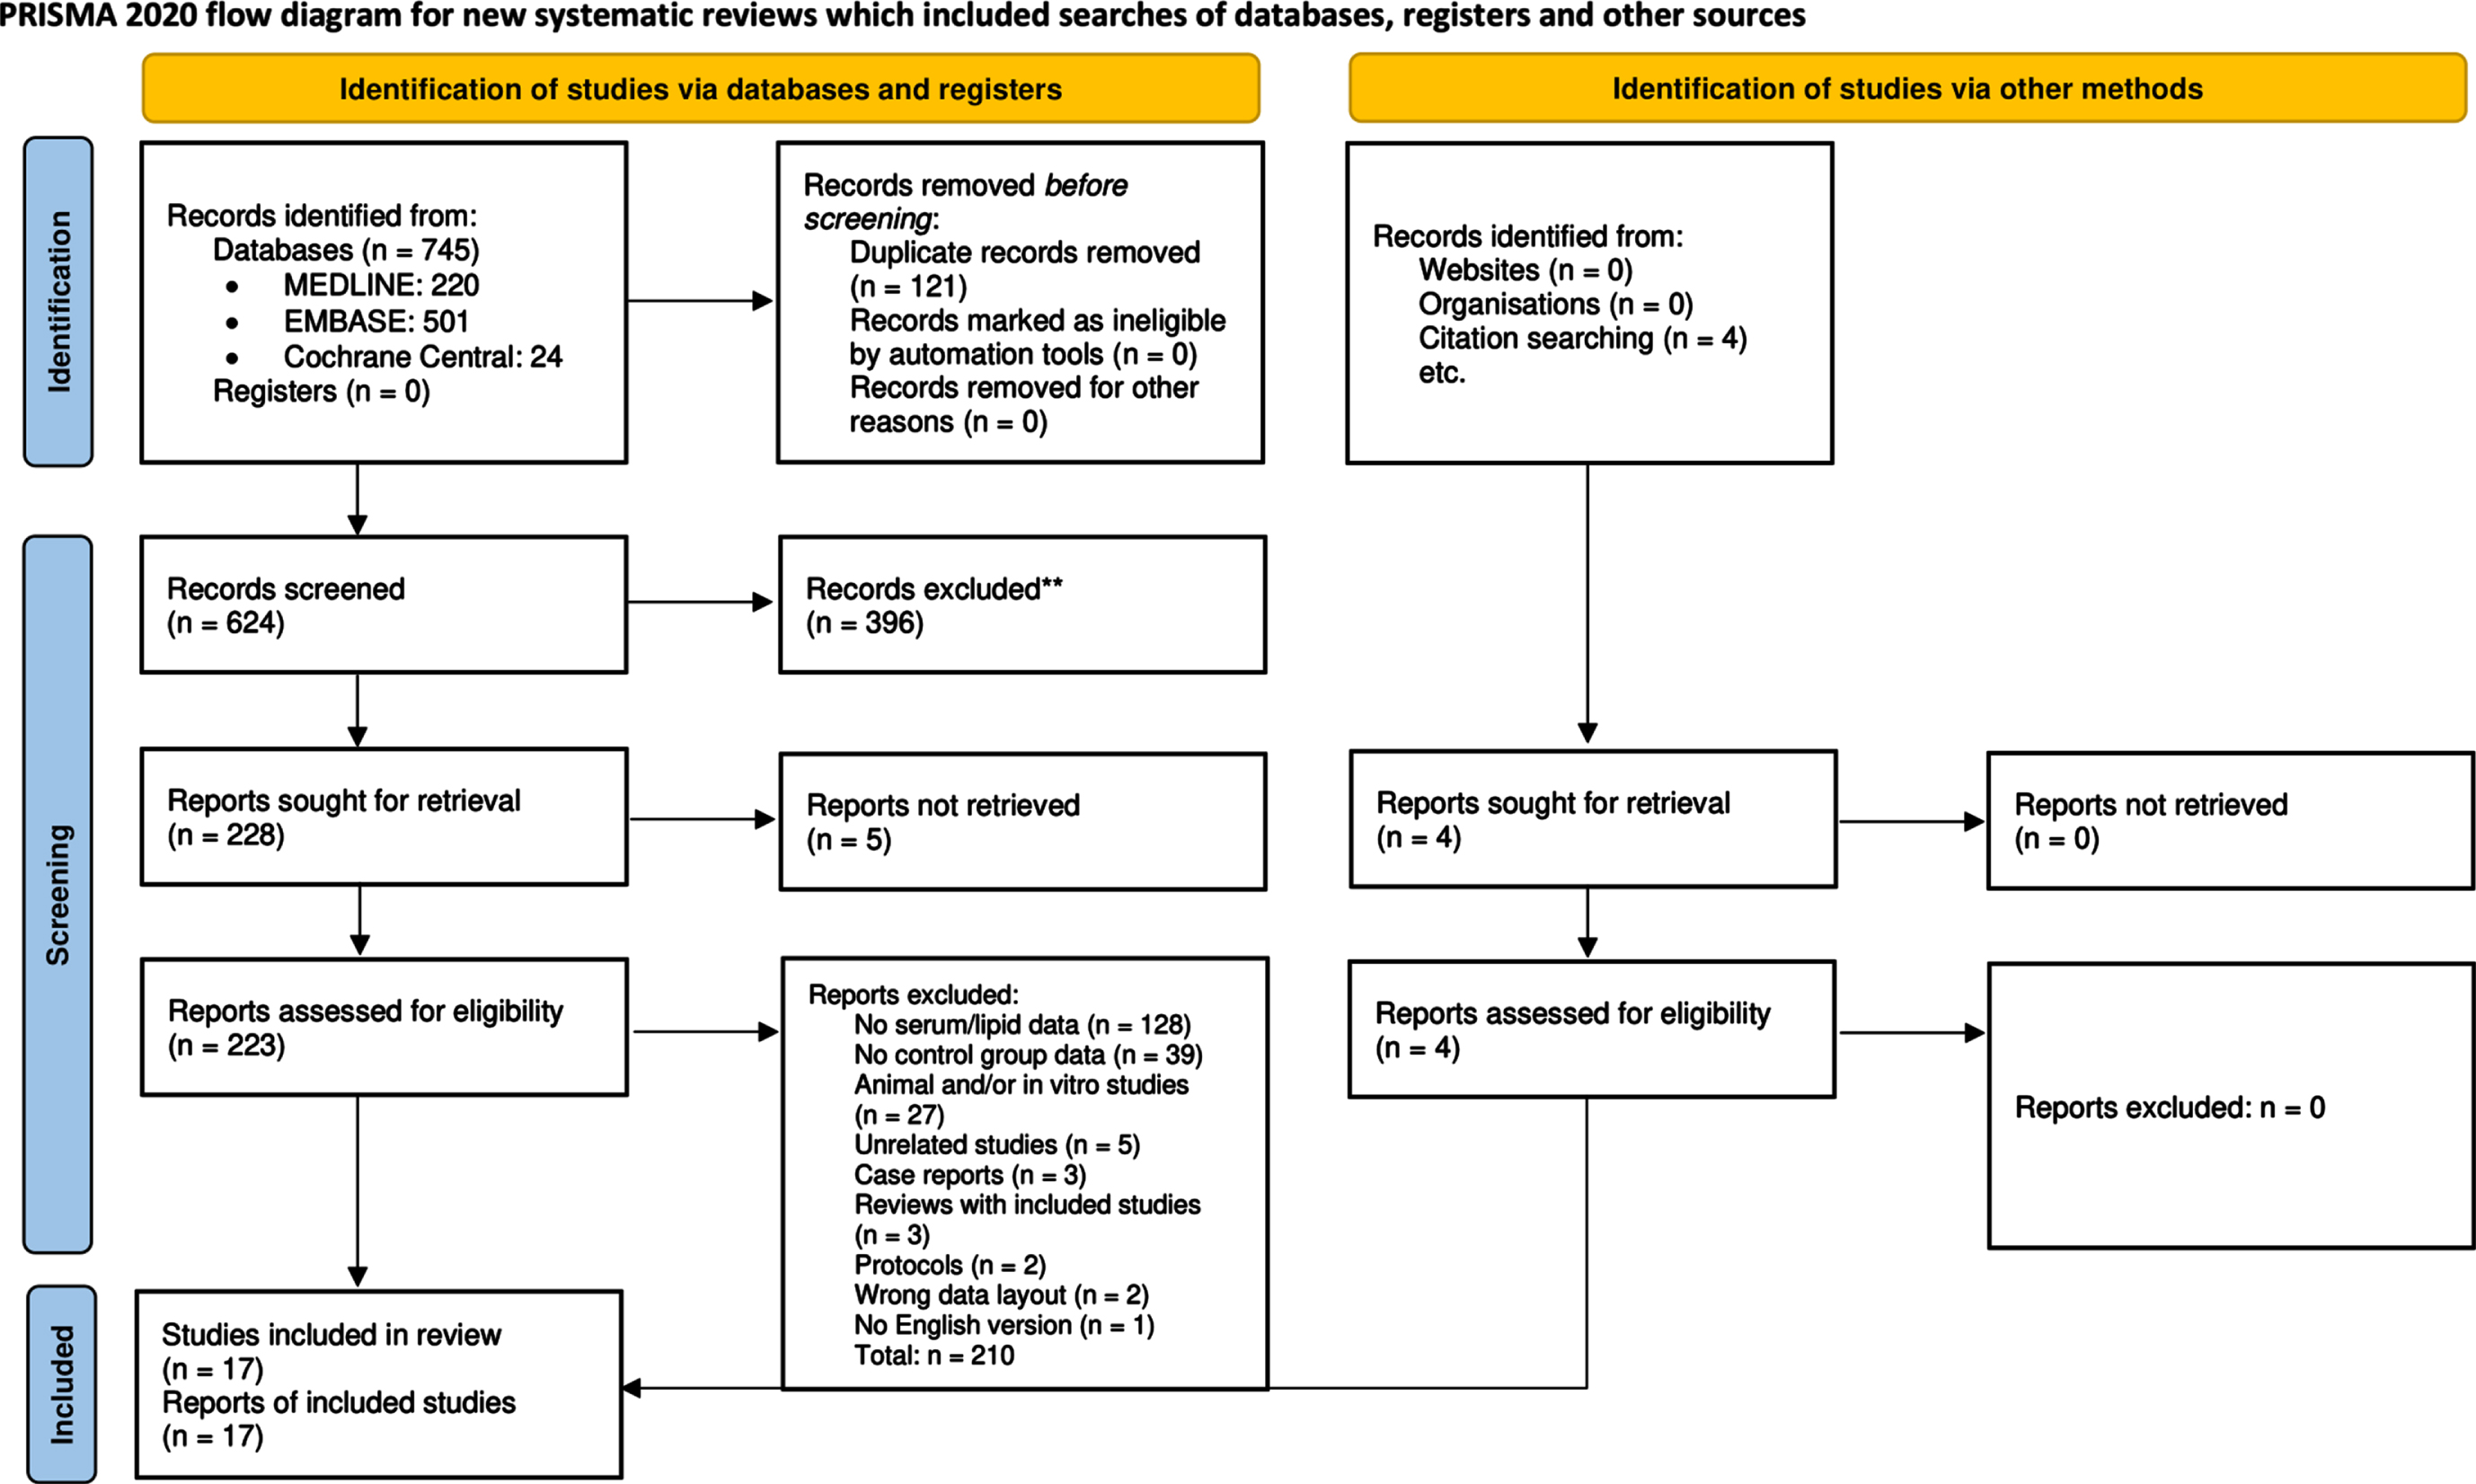
The PRISMA 2020 flow-chart and search results were showed in Fig. 1. A total of 745 initial studies were retrieved through electronic databases and cross-references searches. After removal of duplicates, 624 studies were identified for title and abstract screening (Supplemental Table S2). Review of the titles and abstracts yielded 228 relevant studies for full text screening. From these, 128 studies did not report quantitative expression of plasma/serum lipid level, 39 studies did not have control group values, 27 studies were conducted on animal or in vitro models, full-text could not be retrieved for 5 studies, and other 16 studies were excluded due to other reasons listed in Fig. 1. 4 additional studies were found and included in meta-analysis based on citation searching in review papers. Finally, 17 studies were included in meta-analysis.
Fig.1
PRISMA 2020 flow diagram for study selection.
Study characteristics
Study characteristics are described in Table 1. A total of 1,865 individuals afflicted by different types of MDs were included, and sample size ranged from 15 to 829 individuals [32–48]. All included studies were cross-sectional. Six studies reported plasma lipid values from myotonic dystrophy type 1 (DM1) patient cohorts; three studies reported plasma lipid values from myotonic dystrophy type 2 (DM2) cohorts; seven studies report plasma lipid values from non-specified myotonic dystrophy (DM) cohorts; three studies reported plasma lipid data from Duchenne muscular dystrophy (DMD) patient cohorts. One study reports plasma lipid values from pseudohypertrophic muscular dystrophy (PMD) patients. Thirteen studies included at least one type of diagnosis for MD patients. Sixteen studies included data for TC, whereas seven studies included HDL cholesterol values and six studies included LDL cholesterol values. Thirteen studies included TG values.
Table 1
Main characteristics of cross-sectional studies included in meta-analysis
| First Author and Year | MD Type | Population | Diagnosis | Lipid Subtype | Main Findings |
| Oppenheimer 1959 [46] | PMD/DM | n = 28 Controls: 8 PMD: 17 DM: 3 | N/A | TC | Serum TC did not vary significantly between MD patients and controls (Student’s t-test). |
| Wakamatsu 1972 [35] | DM | n = 45 Controls: 36 DM: 9 | Clinical presentation and electro-myography | TC, TG | DM patients had significantly higher TC and TG compared to controls (F-test or t-test). |
| Björntorp 1973 [34] | DM | n = 52 Controls: 35 DM: 17 | Clinical findings and electromyography | TC, TG | Female DM patients had significantly higher TG and TC compared to female controls, while male DM patients did not show significantly higher TG or TC than male controls (Student’s t-test). |
| Poffenbarger 1976 [47] | DM | n = 15 Controls: 7 DM: 8 | N/A | TC, TG | No significant differences were found in plasma lipids between DM subjects and control subjects (Student’s t-test). |
| Tanaka 1982 [33] | DM | n = 29 Controls: 22 DM: 7 | N/A | TC | Serum TC in DM patients was significantly lower than that of controls (no method of significance test mentioned). |
| Tanaka 1983 [42] | DMD | n = 37 Controls: 22 DMD: 15 | Clinical findings, family history, CK, electromyography and muscle biopsies. | TC, HDL | DMD patients’ HDL, free (unesterified) and TC levels were not significantly different from controls (no method of significance test mentioned). |
| Moorjani 1989 [41] | DM | n = 151 Controls: 81 DM: 70 | Clinical findings and family history | TC, HDL, LDL, TG | Plasma TG and VLDL were significantly higher in DM than controls. LDL was significantly lower in DM than controls. No significant differences in TC and HDL between DM and controls (unpaired two-tailed Student’s t-test). |
| Nishio 1990 [37] | DMD | n = 48 Controls: 12 DMD: 36 | Clinical findings, transaminases, LDH CK electro-myography, muscle biopsies. | TG | DMD plasma TG levels were not significantly different from that of controls (t-test). |
| Fernández-Real 1999 [48] | DM | n = 46 Controls: 24 DM: 22 | Clinical findings and genetic analysis | TC, LDL, TG | Plasma TC and TG were significantly increased in DM patient compared to controls (Fisher’s test). |
| Perseghin 2004 [44] | DM1 | n = 20 Controls: 10 DM1:10 | N/A | TC, HDL, LDL, TG | Minimal changes in TC and TG in DM1 patients compared to controls (Student’s un-paired t-test and Bonferroni correction). |
| Matsumura 2009 [32] | DM1 | n = 829 Controls: 734 DM1:95 | Clinical findings, family history, genetical analysis done in 40 patients. | TC, HDL, TG | DM1 patients had significantly increased TG and TC, with significantly decreased HDL compared to controls (Student’s t-test). |
| Srivastava 2010 [39] | DMD | n = 63 Controls: 22 DMD: 41 | Clinical findings, electromyography, CK | TC, TG | TG, free cholesterol, cholesterol esters and TC were significantly higher in DMD patients as compared to healthy subjects (Mann– Whitney U-test). |
| Daniele 2011 [36] | DM1 | n = 103 Controls: 82 DM1:21 | Clinical findings and genetic analysis | TC, TG | DM1 patients had significantly higher TG compared to controls (Mann– Whitney U-test and Spearman rank coefficient). |
| Passeri 2015 [38] | DM1/DM2 | n = 74 Controls: 32 DM1:31 DM2:13 | Clinical findings, muscle biopsy, and genetic analysis (DM1); in situ hybridization (DM2) | TC, HDL, LDL, TG | DM1 combined with DM2 cohort had significant increased TG, body and visceral fat compared to healthy controls, while TC, HDL, and LDL were not significantly different (Mann– Whitney U-test). |
| Renna 2017 [45] | DM1/DM2 | n = 21 Controls: 8 DM1:8 DM2:5 | Clinical findings and genetic analysis (DM1); in situ hybridization (DM2) | TC | No finding regarding TC was concluded (Student’s t-test). |
| Vujnic 2018 [43] | DM2 | n = 141 Controls: 94 DM2:47 | Clinical findings, electromyography, genetic analysis | TC, HDL, LDL, TG | There were significant increases in HDL, LDL, and TC in DM2 compared to controls (chi-square test, Mann-Whitney U-test, and Student’s t-test). |
| Spaziani 2020 [40] | DM1 | n = 163 Controls: 100 DM1:63 | Genetic analysis (CTG repeats in DMPK) | TC, HDL, LDL, TG | Significant increases of TC, LDL, TG and decrease of HDL were found in male DM1 compared to controls. Female DM1 showed significant increased TC and TG, while no significant changes in HDL and LDL (Student’s t-test and Mann– Whitney U-test). |
MD, muscular dystrophy; DM1, myotonic dystrophy type 1; DM2, myotonic dystrophy type 2; DM, myotonic dystrophy; DMD, Duchenne muscular dystrophy; TC, total cholesterol; HDL, high-density lipoprotein; LDL, low-density lipoprotein; VLDL, very low-density lipoprotein; TG, total triglycerides.
Plasma/serum lipid profiles and meta-analysis findings
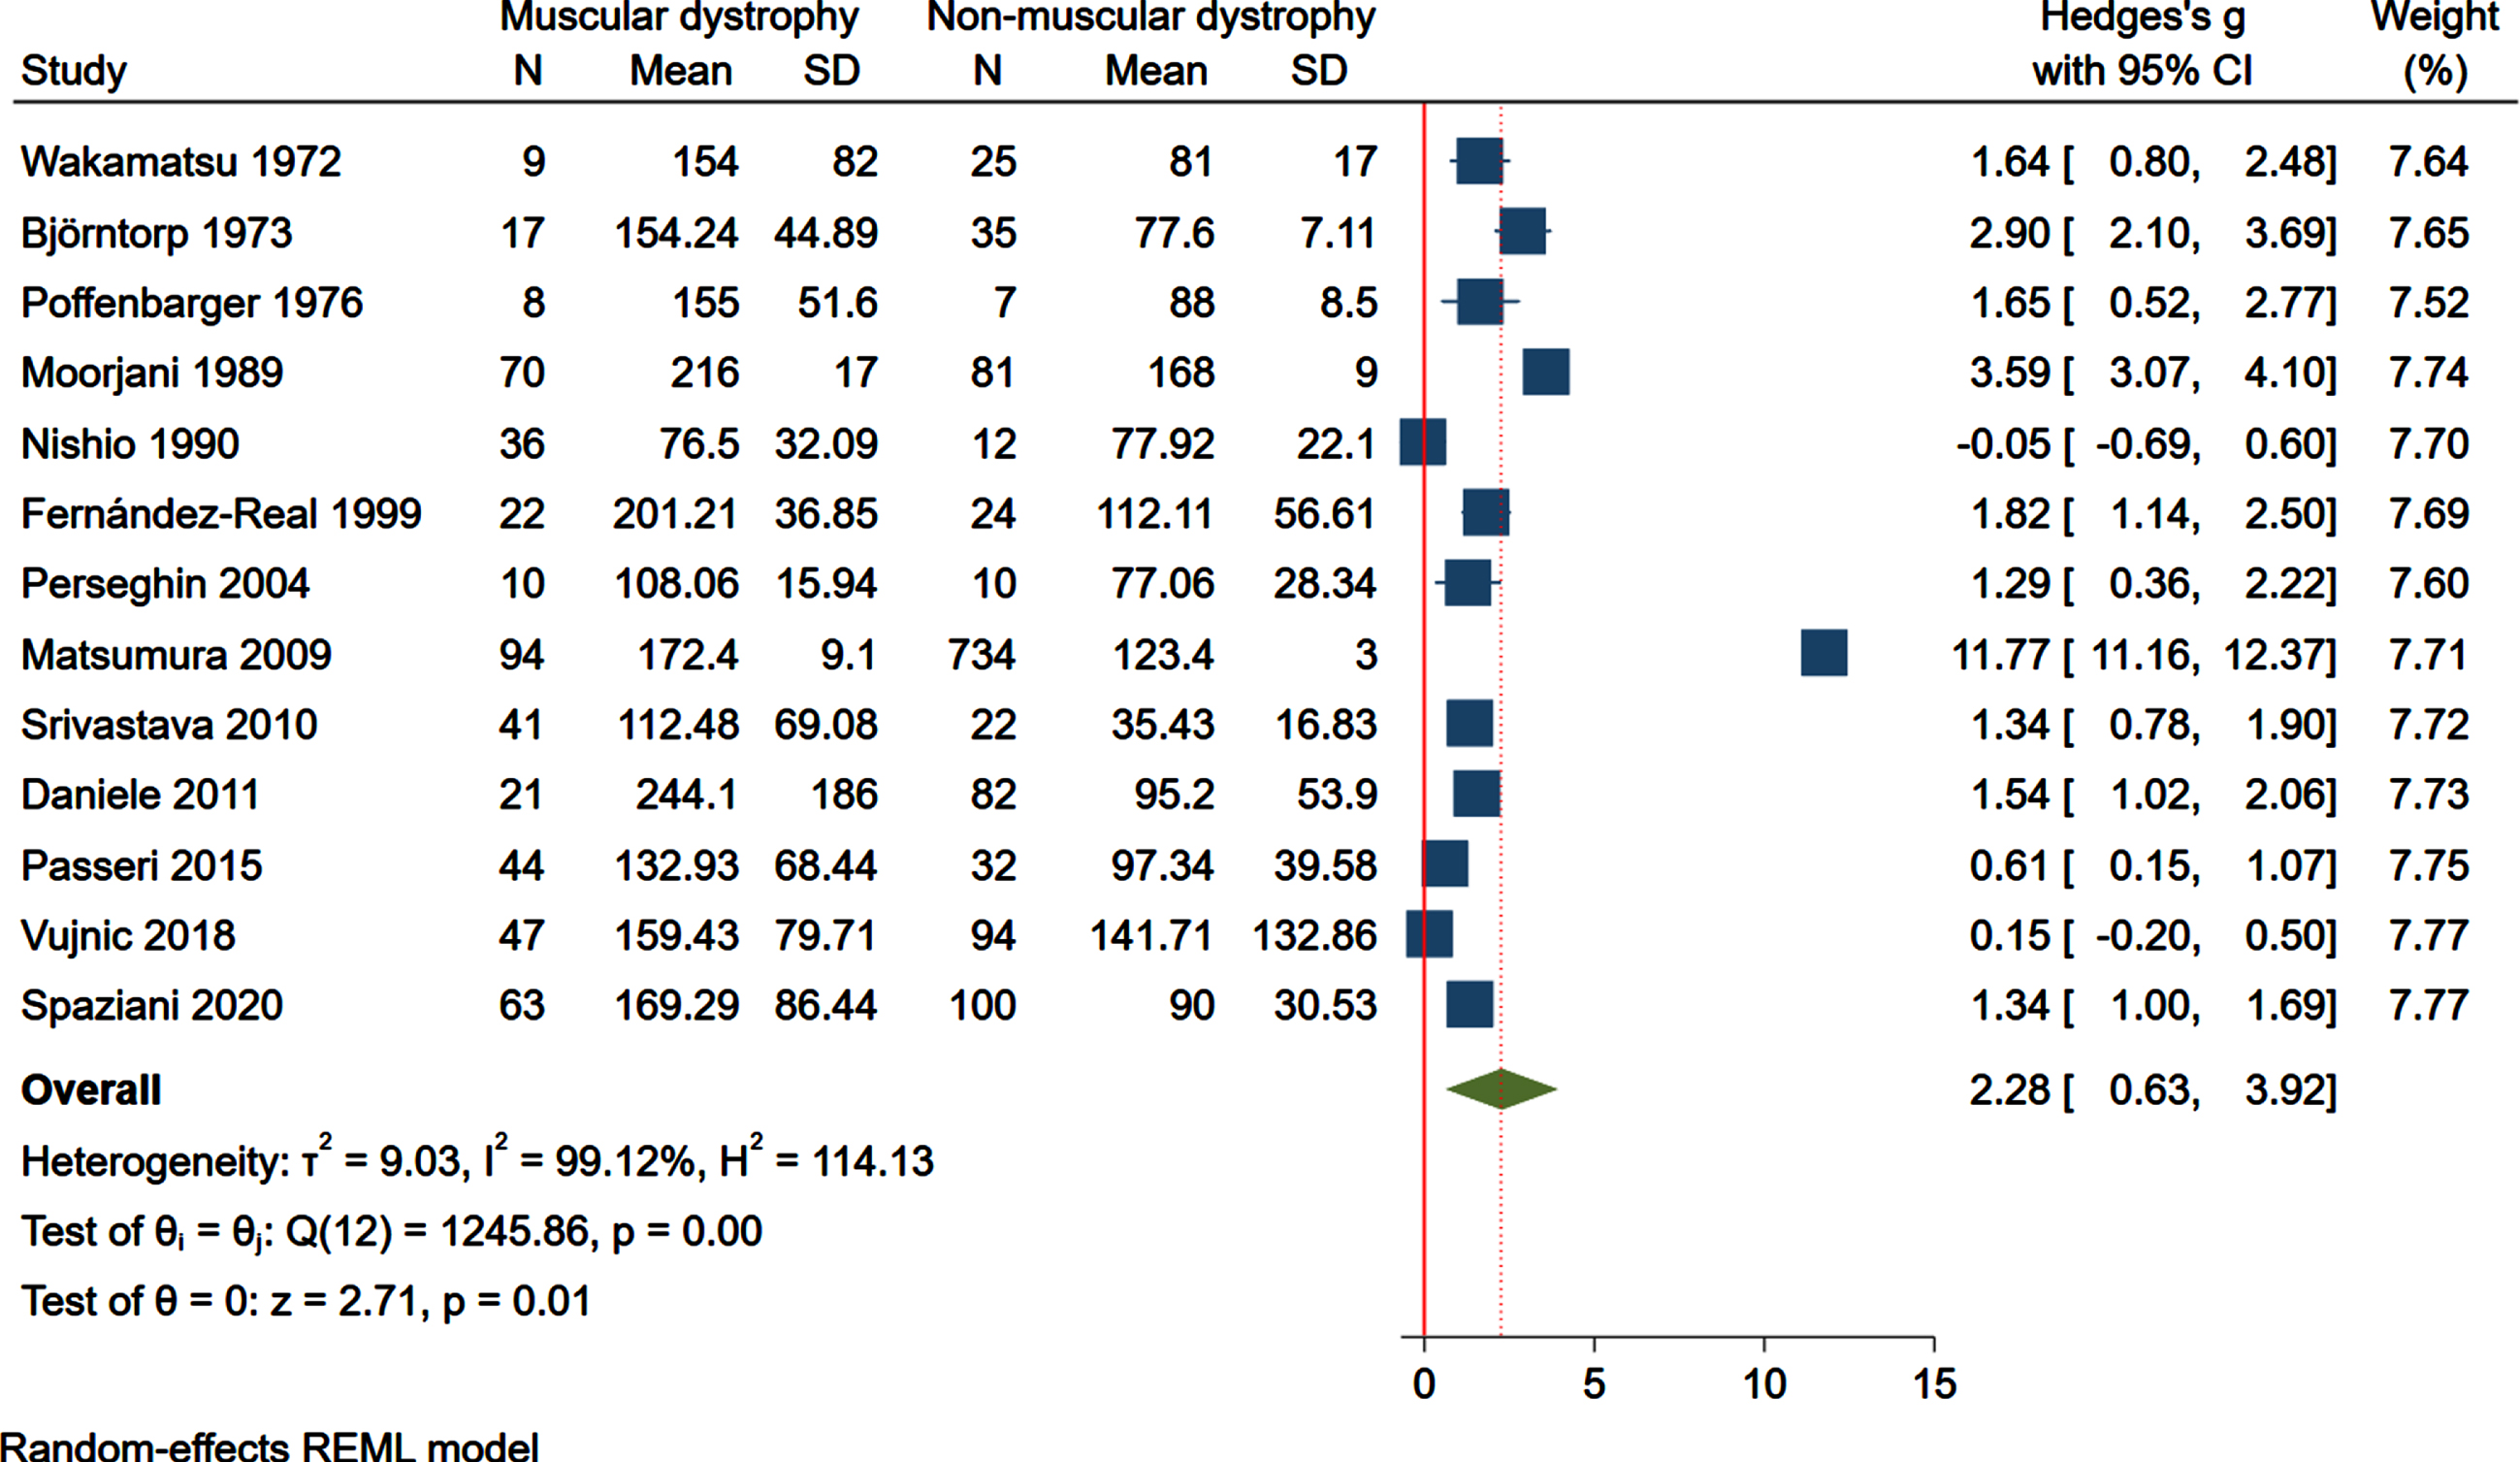
Meta-analysis of sixteen included studies revealed that individuals with MD (n = 501) had significantly higher TC levels (Hedges’ g with 95% confidence interval [CI], 0.80 [0.03– 1.56]; p = 0.04) compared to non-MD individuals (n = 1,317). The studies were characterized by high heterogeneity (I2 = 97.03% , p < 0.0001) (Fig. 2). For HDL cholesterol values, meta-analysis of seven studies showed that MD patients (n = 316) did not have significantly different HDL levels compared to non-MD controls (n = 1,073) (Hedges’ g with 95% confidence interval [CI], – 0.27 [– 2.17– 1.63]; p = 0.78) (Fig. 3). Similarly, for LDL levels, MD was not associated with a significant increase in LDL cholesterol (n = 256), compared to non-MD controls (n = 341) (Hedges’ g with 95% confidence interval [CI], 0.11 [– 1.08– 1.30]; p = 0.86) (Fig. 4). Finally, MD patients (n = 482) showed significant increase in TG compared to non-MD controls (n = 1,258; Hedges’ g with 95% confidence interval [CI], 2.28[0.63– 3.92]; p = 0.01) (Fig. 5). Results of subgroup meta-analyses based on MD subtypes are reported in Supplementary Figures S1– S4, which showed respective effect size of different MDs.
Fig.2
Forest plot of plasma/serum total cholesterol (TC) levels and summary measure (dotted line) favoring higher TC in muscular dystrophic patients vs. non-muscular dystrophic control subjects. SD, standard deviation; CI, confidence interval.
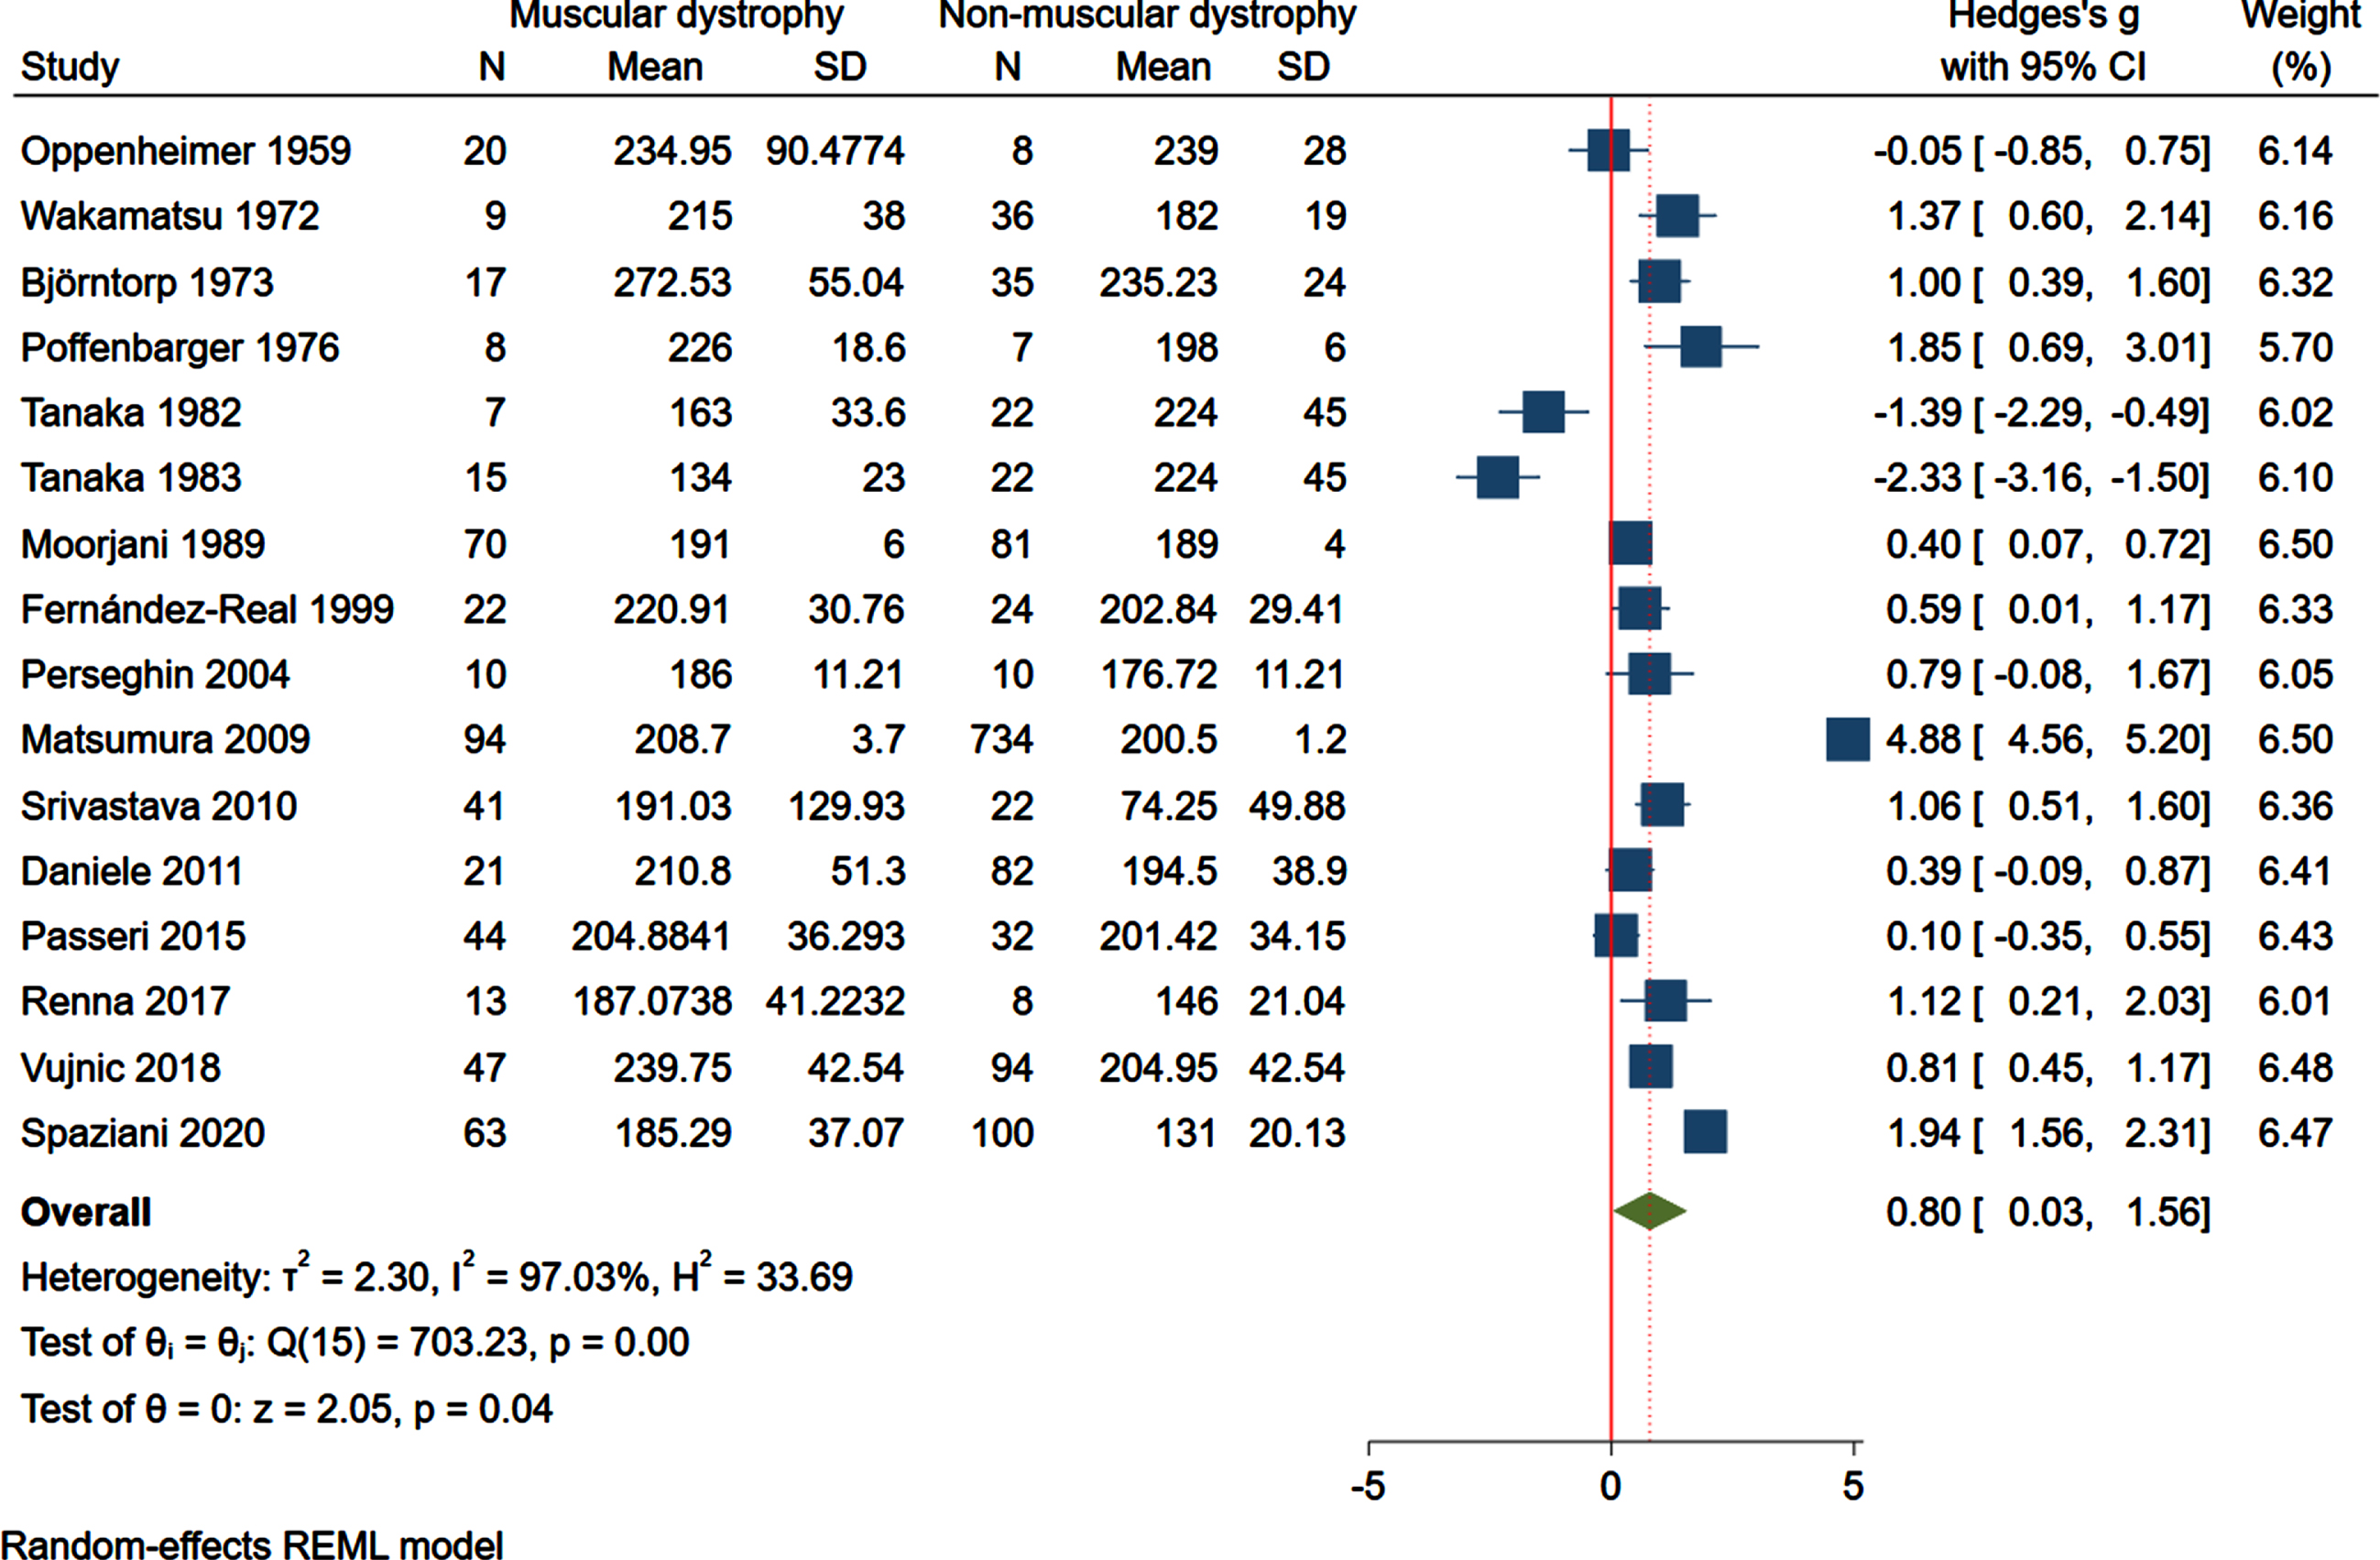
Fig.3
Forest plot of plasma/serum high-density lipoprotein (HDL) cholesterol levels and summary measure (dotted line) favoring lower HDL cholesterol in muscular dystrophic patients vs. non-muscular dystrophic control subjects. SD, standard deviation; CI, confidence interval.
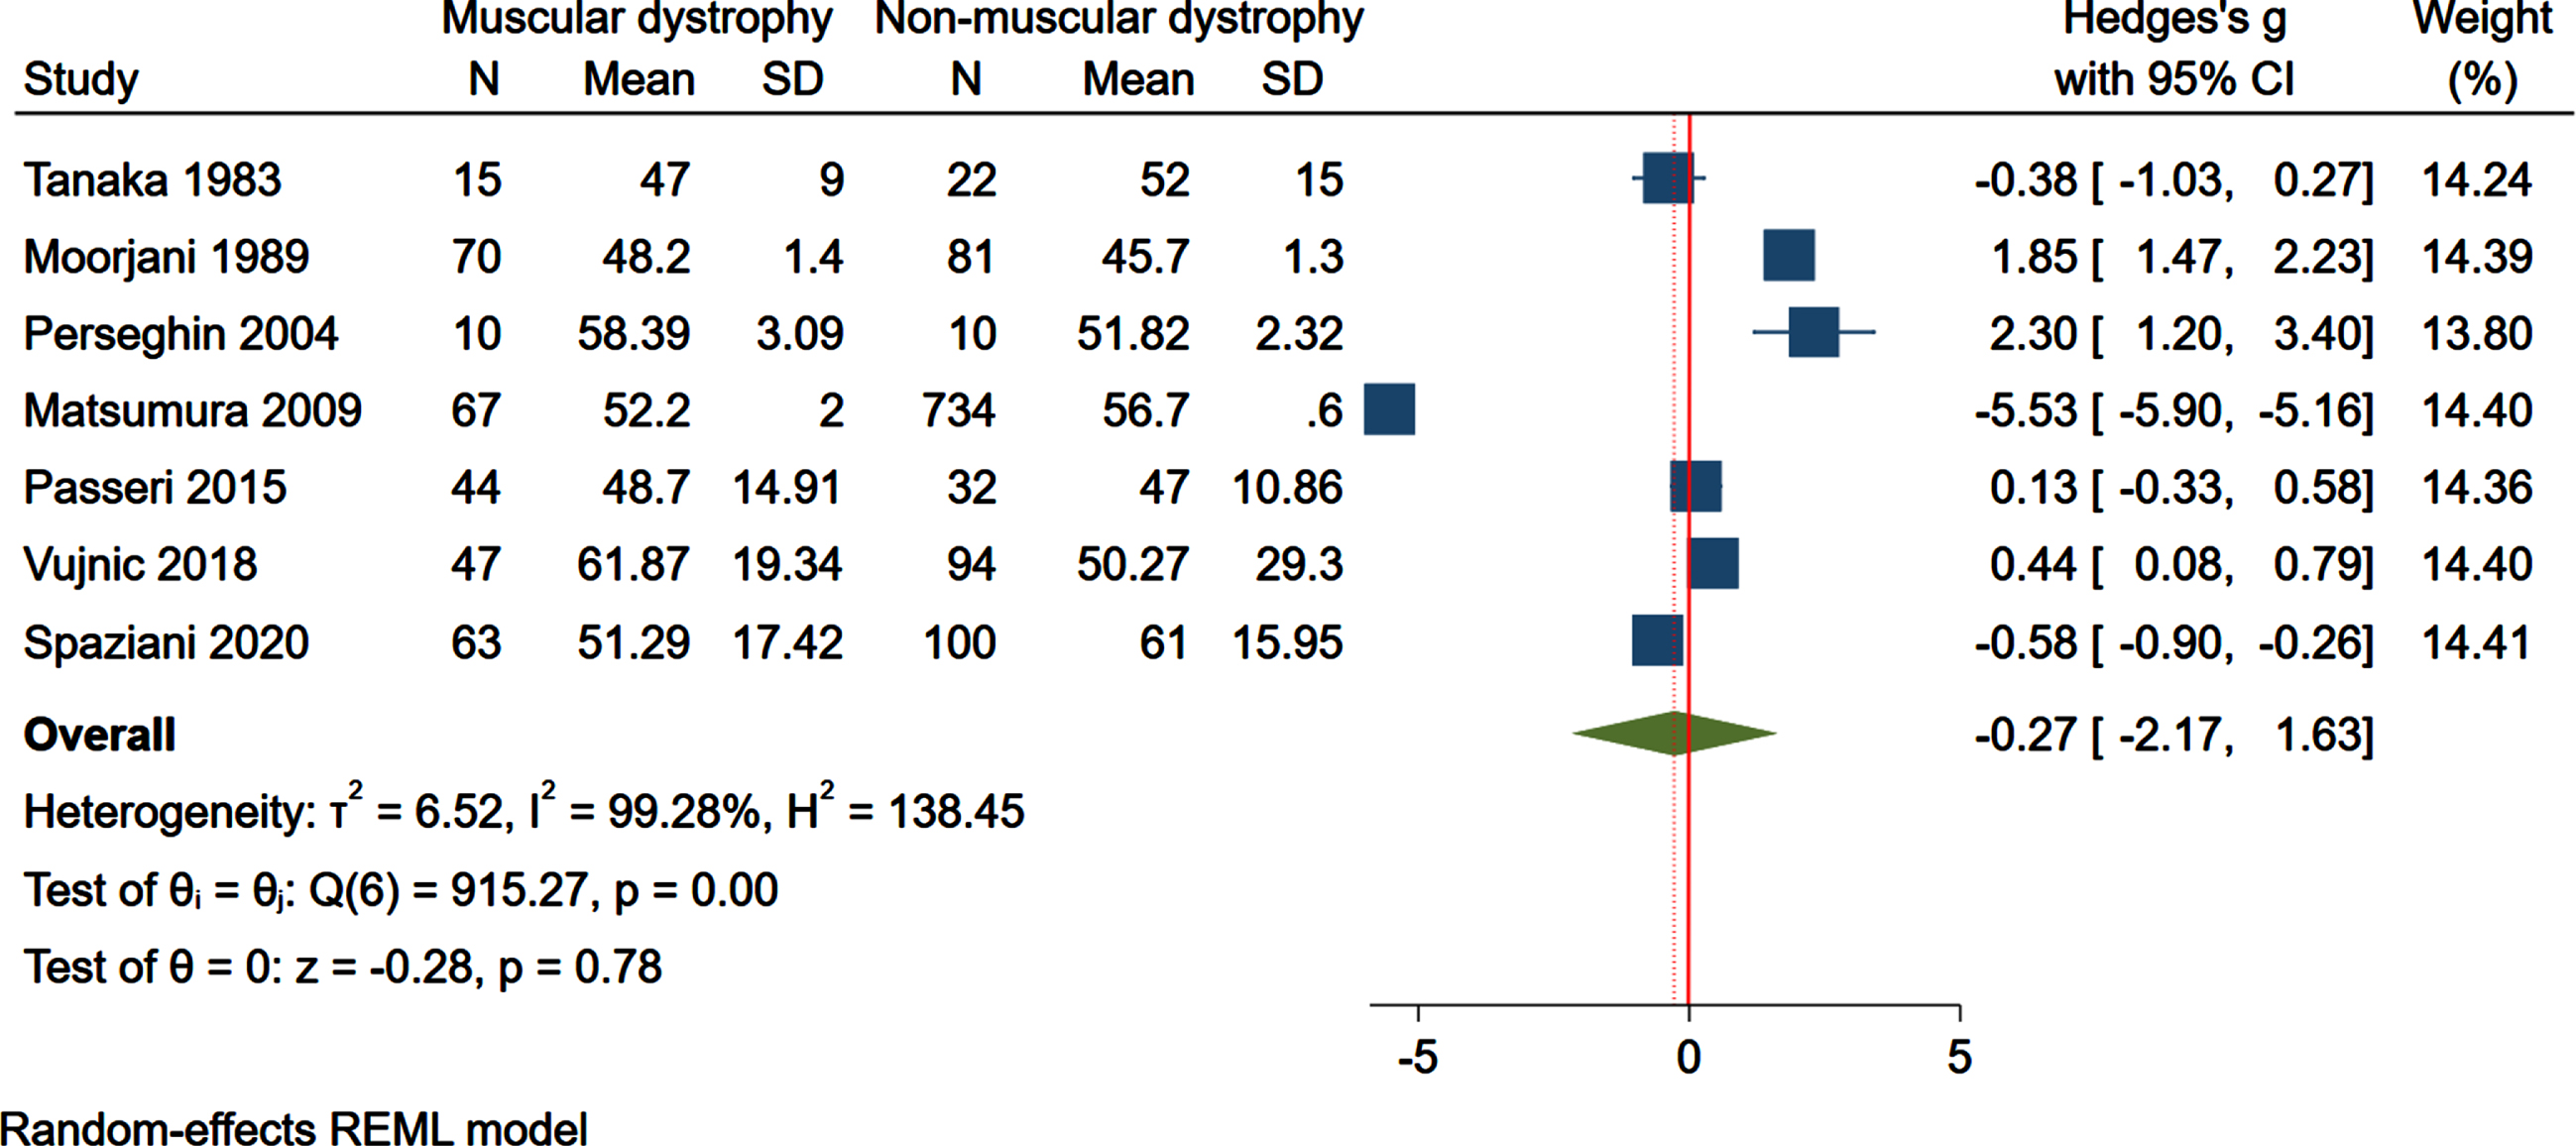
Fig.4
Forest plot of plasma/serum low-density lipoprotein (LDL) cholesterol levels and summary measure (dotted line) favoring higher LDL cholesterol in muscular dystrophic patients vs. non-muscular dystrophic control subjects. SD, standard deviation; CI, confidence interval.
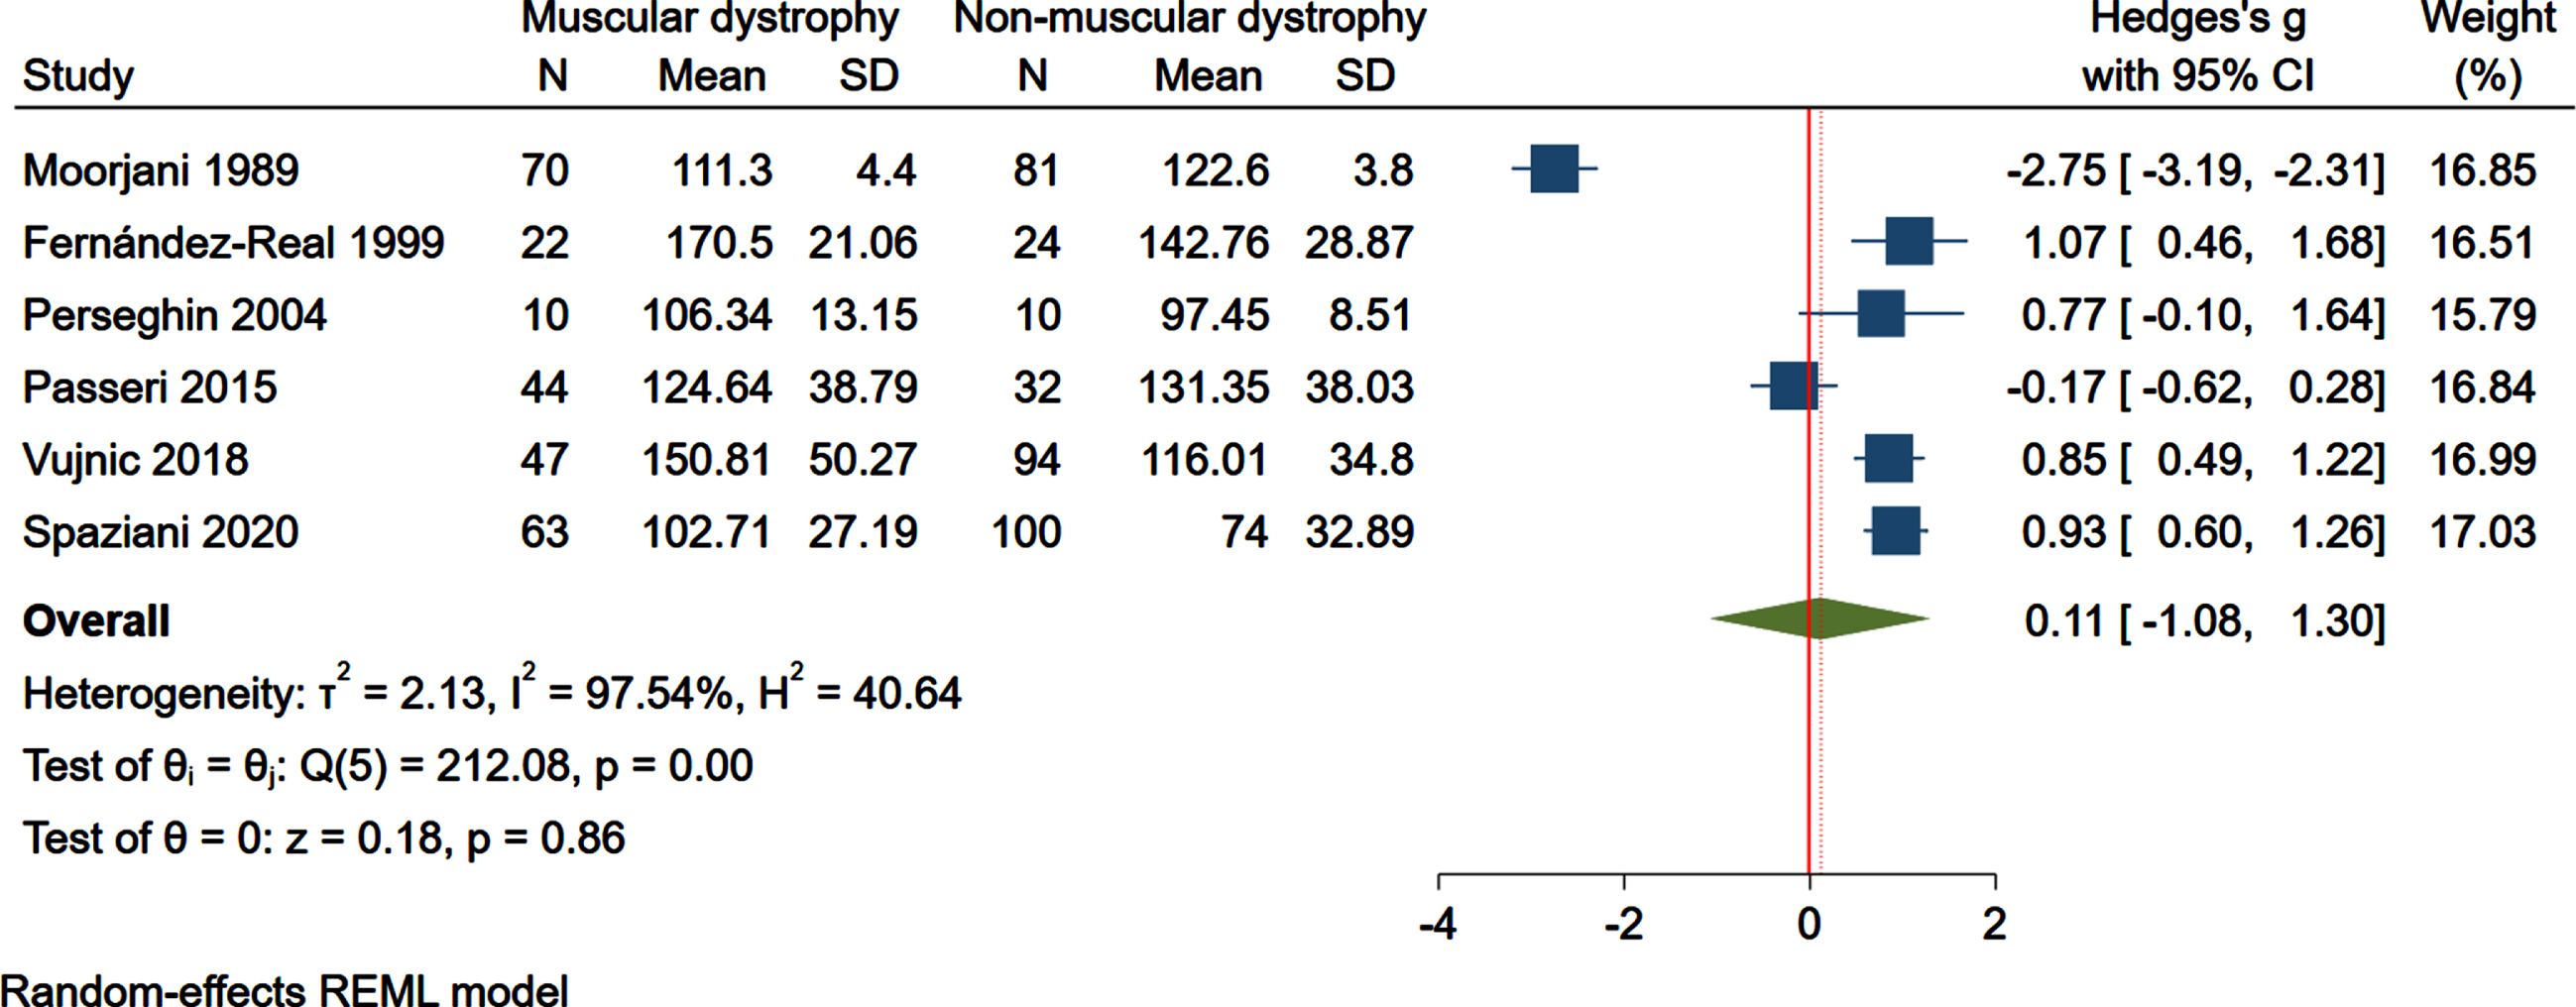
Fig.5
Forest plot of plasma/serum triglycerides (TG) levels and summary measure (dotted line) favoring higher TG in muscular dystrophic patients vs. non-muscular dystrophic control subjects. SD, standard deviation; CI, confidence interval.
Meta-regression analysis
Since the variability in lipoprotein-associated lipid levels between MD and non-MD population were characterized by a high degree of heterogeneity (I2≥50% , p < 0.05), a meta-regression analysis was performed to seek potential moderators, such as MD subtype, mean age, and percentage of male population (Supplementary Table S3). For TC, MD subtype and age did not affect the findings (beta = – 0.47; 95% CI, – 1.14 to 0.20; p = 0.147; beta = 0.04; 95% CI, – 0.02 to 1.11; p = 0.156), respectively, male percentage was found to moderate the results (beta = 0.05; 95% CI, – 0.02 to 0.11; p = 0.043). Similar results were found for HDL, in which MD subtype and age showed minor effects on the differences (beta = 1.02; 95% CI, – 0.87 to 2.92, p = 0.146; beta = – 0.16; 95% CI, – 0.37 to 0.04; p = 0.077), while gender had impact on the findings (beta = – 9.38; 95% CI, – 16.26 to – 2.50; p = 0.028). However, for LDL and TG, all three moderators (MD subtype, mean age, male percentage) reported no effects on the results (LDL, beta = – 0.73; 95% CI, – 5.11 to 3.65; p = 0.549; beta = 0.05; 95% CI, – 0.56 to 0.65; p = 0.776; beta = 2.25; 95% CI, – 20.21 to 24.71; p = 0.709; TG, beta = – 0.93; 95% CI, – 3.11 to 1.24; p = 0.344; beta = 0.11; 95% CI, – 0.08 to 0.30; p = 0.231; beta = 5.66; 95% CI, – 4.45 to 15.77; p = 0.227).
Study quality and publication bias
The general quality of studies evaluated by NOS was good (6.24). Results of the NOS quality assessment of the included studies are reported in Supplementary Table S4. Asymmetry was observed by visual inspection of funnel plots (Supplemental Figures S5– S8). However, Egger’s regression test and Begg’s test results for TC (p = 0.1793; p = 0.8926), for HDL (p = 0.2811; p = 0.7639), for LDL (p = 0.7122; p = 0.4524), and for TG (p = 0.9226; p = 0.2001) indicated no significant publication bias among the studies included in this meta-analysis (Supplementary Table S5).
DISCUSSION
After a meta-analysis that included 1,818 individuals, 501 patients with MD and 1,317 controls, we conclude that MD is associated with high TC (hypercholesterolemia) and high TG (hypertriglyceridemia), two major metabolic co-morbidities, whilst no significant differences in HDL cholesterol or LDL cholesterol were observed compared to controls. To our knowledge, this is the first meta-analysis that investigates the possible relationship between MD and circulating lipids. The differences in the percentage of males in MD and non-MD cohorts acted as a significant moderator and may explain the high heterogeneity found in our results.
Of note, the majority of the retained studies included values from patients with DM (6 studies on DM1, 3 on DM2, and 7 on unclassified DM) whereas 3 included values for DMD individuals and healthy controls. DM is the most common MD in adults, showing high clinical variability, both within and between families. DMD is more severe and common that DM, with a prevalence of 1 in 3,600 male live-born infants and has therefore been more studied than any other type of MD. In contrast, DM prevalence is about 9 cases per 100,000 for DM1 and 2 cases per 100,000 for DM2 [49]. The disproportionality of studies composition may be derived from the fact that DM normally shows a pattern of co-occurrence with the metabolic syndrome [50, 51], with documented endocrine dysfunction, leading to high risk of insulin resistance that results in diabetes [52]. Meanwhile based on our results, metabolic investigations of other types of MD have been lacking. Interestingly, a previous study has revealed no significant difference in circulating lipids between DM1 and DM2 cohorts [53]. Insulin resistance and diabetes are key clinical features in DM, as they contribute to muscle weakening, heart disease and cognitive decline [52]. In DM1, the risk for diabetes is 2- to 4-fold while the prevalence of insulin resistance has been estimated to range from 20 to 80% [54]. The basis of DM-associated insulin resistance was found to be attributable to aberrant alternative splicing of the insulin receptor in skeletal muscle [55]. Of note, with respect to the correlation between circulating lipids and insulin metabolism in our included studies, Matsumura et al. reported co-occurrence of dyslipidemia and insulin resistance in a DM1 cohort [32]. Similar results were found by Daniele et al. [36], Fernández-Real et al. [48], and Renna et al. [45]. However, Björntorp et al. [34]. Perseghin et al. [44] observed that there was no obvious sign of insulin resistance in a DM cohort. More longitudinal studies are warranted to investigate both insulin and lipid metabolism under MD conditions.
While the studies retained had to include values from control, non-MD subjects, many excluded studies have analyzed lipids levels in MD patients without analyzing non-MD controls lipids in parallel, instead relying on clinical reference values for the diagnosis of dyslipidemia. For instance, we have compared human DMD and BMD plasma lipid values to that of normal values using clinic-approved approaches [9]. However, in the case of canine DMD and unaffected carriers, direct comparisons with normal samples confirmed a primary state of dyslipidemia in both DMD and carrier dogs. Limb-girdle muscular dystrophy type 1C (LGMD1C), which is caused by caveolin-3 gene mutations, was also linked to hypercholesterolemia with high LDL and low HDL cholesterol [56] despite absence of LDL receptor or ApoB mutations, an observation reproduced by others [57]. Hence, it is likely that many other types of MD may be associated with dyslipidemia and even respond favorably to cholesterol lowering approaches in the event that cholesterol abnormalities accelerate MD-associated muscle wasting as suggested by pre-clinical studies in animal models of MD [25, 58, 59]. High TG can causes pancreatitis, whereas increased TC and LDL cholesterol cause inflammation and increase the risk of cardiovascular disease [60]. In MD mice, we have shown exacerbated disease severity with the ApoE-null background, which causes TC and nonHDL cholesterol elevations amongst many other metabolic abnormalities [23, 24]. We also reported major improvements in ambulation of severe mdx mice with early ezetimibe treatment, which targets cholesterol absorption and lowers TC [25]. Simvastatin, regardless of rare myotoxicity side effects [61], not only improved muscle health and force, but also reduced muscle inflammation, oxidative stress in a mouse model of DMD [58]. Fenofibrate was reported beneficial in alleviating muscle pathology in mdx mice by increasing the degradation of myostatin [59]. A stabilization of muscle force with cholesterol absorption blockers ezetimibe and cholestyramine was reported in LGMD1C [56].
It must be noted that lipid level discrepancies in the current literature within a particular type of MD may result from the expected rise in circulating lipids with age or the degree of muscle degeneration and disease stage. However, in our meta-regression analysis, age differences between MD and non-MD controls were not a significant moderator of the results. In some included studies, population was heterogenous in terms of biological sex [40], and meta-regression analysis found that the difference in male sex distribution between MD and non-MD groups was a significant moderator, which in turn may partially explain the high heterogeneity we observed. The fact that all symptomatic DMD patients were males may also contribute to the importance of biological sex in this meta-analysis. This finding is pertinent with the current literature suggesting that males have higher plasma TC levels than females [62] whereas DM1 males had higher plasma TG levels than DM1 females [50]. Future investigation of dyslipidemia in MD should analyze how race, BMI, CK levels or more functional makers such as the North Star Ambulatory Assessment correlate or cause dyslipidemia.
LIMITATIONS
One of the limitations of our study is the low number of MD subtypes retained due to our inclusion and exclusion criteria that require lipid values from both MD patients and control subjects in the same study for our meta-analysis. Since performing this systematic review and meta-analysis, we have published on dyslipidemia in LGMD2B patients compared to healthy subject values [10], although this study was not included herein. In addition, we have identified 40 studies that also reported dyslipidemia in various types of MD but without analyzing control samples, instead using reference values for diagnosis of dyslipidemia, and these did not meet our inclusion criteria. Greater accessibility of individual circulating lipid values from the studies included for both MD patients and controls may improve the strength of our current conclusion. Another limitation is the high heterogeneity in the outcomes included. Although we were able to partially rationalize the heterogeneity affecting the differences in lipid levels between MD and non-MD subjects, other confounders may also be considered, such as treatment and management. We could not include other potential moderators such as race, BMI, muscle mass, and steroid usage in our meta-regression analysis due to lack of information. Future investigation may analyze how these parameters correlate or even cause dyslipidemia in MD patients. Finally, we did not assess intramuscular lipid levels that may or may not be related to circulating lipid levels.
CONCLUSIONS
In conclusion, our meta-analysis found evidence that MD is associated with higher circulating TC and TG levels. However, caution on the interpretation of these findings is warranted and future longitudinal research is required to better understand this relationship.
STATEMENTS AND DECLARATIONS
Author contributions
Conceptualization, PB. Methodology, ZS. Investigation, ZS and XW. Data curation, ZS and XW. Writing and reviewing manuscript, ZS, ZW, CD, and FM. Supervision, PB. All authors contributed to the article and approved the submitted version.
ACKNOWLEDGMENTS
The authors wish to thank the Canadian Institutes for Health Research and China Graduate Scholarships for funding this work.
CONFLICT OF INTEREST
The authors have no conflict of interest to report.
DATA AVAILABILITY
The data supporting the findings of this study are available within the article and/or its supplementary material.
SUPPLEMENTARY MATERIAL
[1] The supplementary material is available in the electronic version of this article: https://dx.doi.org/10.3233/JND-230064.
REFERENCES
[1] | Mah JK , Korngut L , Fiest KM , Dykeman J , Day LJ , Pringsheim T , et al. A systematic review and meta-analysis on the epidemiology of the muscular dystrophies. Can J Neurological Sci J Can Des Sci Neurologiques. (2016) ;43: (1):163–77. |
[2] | Liu W , Pajusalu S , Lake NJ , Zhou G , Ioannidis N , Mittal P , et al. Estimating prevalence for limb-girdle muscular dystrophy based on public sequencing databases. Genet Med. (2019) ;21: (11):2512–20. |
[3] | Mercuri E , Bönnemann CG , Muntoni F Muscular dystrophies. Lancet. (2019) ;3943: (10213):2025–38. |
[4] | Datta N , Ghosh PS Update on muscular dystrophies with focus on novel treatments and biomarkers. Curr Neurol Neurosci. (2020) ;20: (6):14. |
[5] | Rodríguez-Cruz M , Sanchez R , Escobar RE , Cruz-Guzmán O del R , López-Alarcón M , García MB , et al. Evidence of insulin resistance and other metabolic alterations in boys with duchenne or becker muscular dystrophy. Int J Endocrinol ((2015) )867273. |
[6] | Lee SL-K , Lim A , Munns C , Simm PJ , Zacharin M Effect of testosterone treatment for delayed puberty in duchenne muscular dystrophy. Horm Res Paediat. (2020) ;93: (2):108–18. |
[7] | Quattrocelli M , Zelikovich AS , Salamone IM , Fischer JA , McNally EM Mechanisms and clinical applications of glucocorticoid steroids in muscular dystrophy. J Neuromuscul Dis. (2020) ;8: (1):39–52. |
[8] | Schneider SM , Sridhar V , Bettis AK , Heath-Barnett H , Balog-Alvarez CJ , Guo L-J , et al. Glucose metabolism as a pre-clinical biomarker for the golden retriever model of duchenne muscular dystrophy. Mol Imaging Biol. (2018) ;20: (5):780–8. |
[9] | White Z , Hakim CH , Theret M , Yang NN , Rossi F , Cox D , et al. High prevalence of plasma lipid abnormalities in human and canine Duchenne and Becker muscular dystrophies depicts a new type of primary genetic dyslipidemia. J Clin Lipidol.459-69.e. (2020) ;14: (4):459–69.e0. |
[10] | White Z , Sun Z , Sauge E , Cox D , Donen G , Pechkovsky D , et al. Limb-girdle muscular dystrophy type 2B causes HDL-C abnormalities in patients and statin-resistant muscle wasting in dysferlin-deficient mice. Skelet Muscle. (2022) ;12: (1):25. |
[11] | Soppert J , Lehrke M , Marx N , Jankowski J , Noels H Lipoproteins and lipids in cardiovascular disease: From mechanistic insights to therapeutic targeting. Adv Drug Deliver Rev. (2020) ;159: :4–33. |
[12] | Simha V Management of hypertriglyceridemia. Bmj (2020) ;371: :m3109. |
[13] | Lu Y , Wang X-H , Li J , Wang W , Zhang S , Huang Y , et al. Association between skeletal muscle mass and cardiovascular risk factors in occupational sedentary population: A cross-sectional study. J Occup Environ Medicine. (2022) ; Publish Ahead of Print. |
[14] | Ferreira J , Carneiro AL , Vila I , Cunha C , Silva C ristina , Longatto-Filho A , et al. Association of skeletal muscle and cardiovascular risk factors in patients with lower extremity arterial disease. Ann Vasc Surg. (2022) ;80: :223–34. |
[15] | Andersen K , Lind L , Ingelsson E , Ärnlöv J , Byberg L , Michaëlsson K , et al. Skeletal muscle morphology and risk of cardiovascular disease in elderly men. Eur J Prev Cardiol. (2013) ;22: (2):231–9. |
[16] | Gong H , Liu Y , Lyu X , Dong L , Zhang X Lipoprotein subfractions in patients with sarcopenia and their relevance to skeletal muscle mass and function. Exp Gerontol. (2022) ;159: :111668. |
[17] | Kane JP , Pullinger CR , Goldfine ID , Malloy MJ Dyslipidemia and diabetes mellitus: Role of lipoprotein species and interrelated pathways of lipid metabolism in diabetes mellitus. Curr Opin Pharmacol. (2021) ;61: :21–7. |
[18] | Pin F , Barreto R , Couch ME , Bonetto A , O’Connell TM Cachexia induced by cancer and chemotherapy yield distinct perturbations to energy metabolism. J Cachexia Sarcopenia Muscle. (2019) ;10: (1):140–54. |
[19] | Wang N , Chen M , Fang D Relationship between serum triglyceride to high-density lipoprotein cholesterol ratio and sarcopenia occurrence rate in community-dwelling Chinese adults. Lipids Health Dis. (2020) ;19: (1):248. |
[20] | Kahleova H , Petersen KF , Shulman GI , Alwarith J , Rembert E , Tura A , et al. Effect of a low-fat vegan diet on body weight, insulin sensitivity, postprandial metabolism, and intramyocellular and hepatocellular lipid levels in overweight adults. Jama Netw Open. (2020) ;3: (11):e2025454. |
[21] | Carey AL , Siebel AL , Reddy-Luthmoodoo M , Natoli AK , D’Souza W , Meikle PJ , et al. Skeletal muscle insulin resistance associated with cholesterol-induced activation of macrophages is prevented by high density lipoprotein. Plos One. (2013) ;8: (2):e56601. |
[22] | Amor F , Hong AV , Corre G , Sanson M , Suel L , Blaie S , et al. Cholesterol metabolism is a potential therapeutic target in Duchenne muscular dystrophy. J Cachexia Sarcopenia Muscle. (2021) ;12: (3):677–93. |
[23] | Milad N , White Z , Tehrani AY , Sellers S , Rossi FMV , Bernatchez P Increased plasma lipid levels exacerbate muscle pathology in the mdx mouse model of Duchenne muscular dystrophy. Skelet Muscle. (2017) ;7: (1):19. |
[24] | Sellers SL , Milad N , White Z , Pascoe C , Chan R , Payne GW , et al. Increased nonHDL cholesterol levels cause muscle wasting and ambulatory dysfunction in the mouse model of LGMD2B. J Lipid Res. (2018) ;59: (2):261–72. |
[25] | White Z , Theret M , Milad N , Tung LW , Chen WW , Sirois MG , et al. Cholesterol absorption blocker ezetimibe prevents muscle wasting in severe dysferlin-deficient and mdx mice. J Cachexia Sarcopenia Muscle. (2022) ;13: (1):544–60. |
[26] | Page MJ , McKenzie JE , Bossuyt PM , Boutron I , Hoffmann TC , Mulrow CD , et al. The PRISMA statement: An updated guideline for reporting systematic reviews. Bmj. (2021) ;372: :n71. |
[27] | Nicolau S , Milone M , Liewluck T Guidelines for genetic testing of muscle and neuromuscular junction disorders. Muscle Nerve. (2021) ;64: (3):255–69. |
[28] | Lo CK-L , Mertz D , Loeb M Newcastle-Ottawa Scale: Comparing reviewers’ to authors’ assessments. Bmc Med Res Methodol. (2014) ;14: (1):45. |
[29] | Hozo SP , Djulbegovic B , Hozo I Estimating the mean and variance from the median, range, and the size of a sample. Bmc Med Res Methodol. (2005) ;5: (1):13–13. |
[30] | Higgins JPT , Thompson SG , Deeks JJ , Altman DG Measuring inconsistency in meta-analyses. Bmj. (2003) ;327: (7414):557. |
[31] | Egger M , Smith GD , Schneider M , Minder C Bias in meta-analysis detected by a simple, graphical test. Bmj. (1997) ;315: (7109):629. |
[32] | Matsumura T , Iwahashi H , Funahashi T , Takahashi MP , Saito T , Yasui K , et al. A cross-sectional study for glucose intolerance of myotonic dystrophy. J Neurol Sci ((2009) ) 276: (1–2), 60–5. |
[33] | Tanaka K , Takeshita K , Takita M Abnormalities of bile acids in serum and bile from patients with myotonic muscular dystrophy. Clin Sci. (1982) ;62: (6):627–42. |
[34] | Björntorp P , Schröder G , Orndahl G Carbohydrate and lipid metabolism in relation to body composition in myotonic dystrophy. Diabetes. (1973) ;22: (4):238–42. |
[35] | Wakamatsu H , Nakamura H , Ito K , Anazawa W , Okajima S , Shigeno K , et al. Concentration and fatty acid composition of serum lipids in myotonia dystrophica. Horm Metab Res. (1972) ;4: (06):458–62. |
[36] | Daniele A , Rosa AD , Cristofaro MD , Monaco ML , Masullo M , Porcile C , et al. Decreased concentration of adiponectin together with a selective reduction of its high molecular weight oligomers is involved in metabolic complications of myotonic dystrophy type 1. Eur J Endocrinol. (2011) ;165: (6):969–75. |
[37] | Nishio H , Wada H , Matsuo T , Horikawa H , Takahashi K , Nakajima T , et al. Glucose, free fatty acid and ketone body metabolism in duchenne muscular dystrophy. Brain Dev. (1990) ;12: (4):390–402. |
[38] | Passeri E , Bugiardini E , Sansone VA , Pizzocaro A , Fulceri C , Valaperta R , et al. Gonadal failure is associated with visceral adiposity in myotonic dystrophies. Eur J Clin Invest. (2015) ;45: (7):702–10. |
[39] | Srivastava NK , Pradhan S , Mittal B , Gowda GAN High resolution NMR based analysis of serum lipids in Duchenne muscular dystrophy patients and its possible diagnostic significance. Nmr Biomed. (2010) ;23: (1):13–22. |
[40] | Spaziani M , Semeraro A , Bucci E , Rossi F , Garibaldi M , Papassifachis MA , et al. Hormonal and metabolic gender differences in a cohort of myotonic dystrophy type 1 subjects: A retrospective, case– control study. J Endocrinol Invest. (2020) ;43: (5):663–75. |
[41] | Moorjani S , Gaudet D , Laberge C , Thibault MC , Mathieu J , Morissette J , et al. Hypertriglyceridemia and lower LDL cholesterol concentration in relation to apolipoprotein E phenotypes in myotonic dystrophy. Can J Neurological Sci J Can Des Sci Neurologiques. (1989) ;16: (1):129–33. |
[42] | Tanaka K , Takeshita K , Suganuma I , Kasagi S Low serum cholic acid concentration of Duchenne muscular dystrophy. Brain Dev. (1983) ;5: (5):511–3. |
[43] | Vujnic M , Peric S , Calic Z , Benovic N , Nisic T , Pesovic J , et al. Metabolic impairments in patients with myotonic dystrophy type 2. Acta Myologica Myopathies Cardiomyopathies Official J Mediterr Soc Myology. (2018) ;37: (4):252–6. |
[44] | Perseghin G , Comola M , Scifo P , Benedini S , Cobelli FD , Lanzi R , et al. Postabsorptive and insulin-stimulated energy and protein metabolism in patients with myotonic dystrophy type 1. Am J Clin Nutrition. (2004) ;80: (2):357–64. |
[45] | Renna LV , Bosè F , Iachettini S , Fossati B , Saraceno L , Milani V , et al. Receptor and post-receptor abnormalities contribute to insulin resistance in myotonic dystrophy type 1 and type 2 skeletal muscle. Plos One. (2017) ;12: (9):e0184987. |
[46] | Oppenheimer H , Shulman S , Roberts S , Milhorat AT Serum proteins, lipoproteins and glycoproteins. II. Muscular dystrophy and related diseases in patients.* P Soc Exp Biol Med. (1959) ;100: (3):564–7. |
[47] | Poffenbarger PL , Bozefsky T , Soeldner JS The direct relationship of proinsulin-insulin hypersecretion to basal serum levels of cholesterol and triglyceride in myotonic dystrophy. J Laboratory Clin Medicine. (1976) ;87: (3):384–96. |
[48] | Fernandez-Real JM , Molina A , Broch M , Ricart W , Gutierrez C , Casamitjana R , et al. Tumor necrosis factor system activity is associated with insulin resistance and dyslipidemia in myotonic dystrophy. Diabetes. (1999) ;48: (5):1108–12. |
[49] | Liao Q , Zhang Y , He J , Huang K Global prevalence of myotonic dystrophy: An updated systematic review and meta-analysis. Neuroepidemiology. (2022) ;56: (3):163–73. |
[50] | Stojanovic VR , Peric S , Lavrnic D , Popovic S , Ille T , Stevic Z , et al. Leptin and the metabolic syndrome in patients with myotonic dystrophy type 1. Acta Neurol Scand. (2010) ;121: (2):94–8. |
[51] | Vujnic M , Peric S , Popovic S , Raseta N , Ralic V , Dobricic V , et al. Metabolic syndrome in patients with myotonic dystrophy type 1. Muscle Nerve. (2015) ;52: (2):273–7. |
[52] | Winters SJ Endocrine dysfunction in patients with myotonic dystrophy. J Clin Endocrinol Metabolism. (2021) ;106: (10):2819–27. |
[53] | Dozio E , Passeri E , Cardani R , Benedini S , Aresta C , Valaperta R , et al. Circulating irisin is reduced in male patients with type 1 and type 2 myotonic dystrophies. Front Endocrinol. (2017) ;8: :320. |
[54] | Meola G Clinical and genetic heterogeneity in myotonic dystrophies. Muscle Nerve. (2000) ;23: (12):1789–99. |
[55] | Savkur RS , Philips AV , Cooper TA Aberrant regulation of insulin receptor alternative splicing is associated with insulin resistance in myotonic dystrophy. Nat Genet. (2001) ;29: (1):40–7. |
[56] | Ibarretxe D , Pellejà J , Ortiz N , Masana L Caveolin 3 deficiency myopathy associated with dyslipidemia: Treatment challenges and possible pathophysiological association. J Clin Lipidol. (2017) ;11: (5):1280–3. |
[57] | Bruno G , Puoti G , Oliva M , Colavito D , Allegorico L , Napolitano F , et al. A novel missense mutation in CAV3 gene in an Italian family with persistent hyperCKemia, myalgia and hypercholesterolemia: Double-trouble. Clin Neurol Neurosur. (2020) ;191: :105687. |
[58] | Whitehead NP , Kim MJ , Bible KL , Adams ME , Froehner SC A new therapeutic effect of simvastatin revealed by functional improvement in muscular dystrophy. Proc National Acad Sci. (2015) ;112: (41):12864–9. |
[59] | Sun Z , Xu D , Zhao L , Li X , Li S , Huang X , et al. A new therapeutic effect of fenofibrate in Duchenne muscular dystrophy: The promotion of myostatin degradation. Brit J Pharmacol. 2021. |
[60] | Jeong S , Choi S , Kim K , Kim SM , Lee G , Park SY , et al. Effect of change in total cholesterol levels on cardiovascular disease among young adults. J Am Heart Assoc. (2018) ;7: (12):e008819. |
[61] | Avis HJ , Vissers MN , Stein EA , Wijburg FA , Trip MD , Kastelein JJP , et al. A systematic review and meta-analysis of statin therapy in children with familial hypercholesterolemia. Arteriosclerosis Thrombosis Vasc Biology. (2007) ;27: (8):1803–10. |
[62] | Anagnostis P , Stevenson JC , Crook D , Johnston DG , Godsland IF Effects of menopause, gender and age on lipids and high-density lipoprotein cholesterol subfractions. Maturitas. (2015) ;81: (1):62–8. |


