
Modeling Early Heterogeneous Rates of Progression in Boys with Duchenne Muscular Dystrophy
Abstract
Background:
Duchenne muscular dystrophy (DMD) exhibits substantial variability in rates of disease progression and response to treatment. This has hindered treatment development and complicated interpretation of drug effects in clinical trials.
Objective:
We hypothesized that a multivariate combination of early-age clinical outcome measurements can explain differential disease progression.
Methods:
Data on boys with DMD (ages 4–<10 years), both treated with steroidal anti-inflammatories and untreated, were obtained from CINRG Duchenne Natural History Study (n = 209) and vamorolone VBP15-002/003/LTE (n = 46) studies. Velocities from three timed function tests (TFTs; stand from supine, run/walk 10 meters, and climb 4 stairs) were simultaneously modeled in a longitudinal latent class analysis.
Results:
Three classes of differentially progressing early age DMD motor trajectories were identified. Quicker decline/progression was associated with lower baseline TFT velocities, earlier loss of ability to finish a TFT, and lower predicted velocities. Earlier substantial steroid exposure was associated with greater TFT velocities while the moderate progression class was observed to have the largest difference in performance between boys treated early with steroids vs. not. Sample size calculations with the class showing the largest treatment response showed a large reduction in required sample size as compared to using summaries from all participants. Gene mutations were also investigated in post-hoc analyses, with mutations near the beginning of the DMD gene (Dp427 absent and Dp140/Dp71 present) found to be enriched in the slowest progressing class.
Conclusions:
This study provides insight into the variation in DMD progression through a latent class analysis. Our findings show class-related trajectories of motor outcomes and pharmacological response to corticosteroids, and suggest that enrichment strategies and/or subgroup analyses could be considered further in design of therapeutic interventions in DMD.
INTRODUCTION
Duchenne muscular dystrophy (DMD; OMIM #310200) is an X-linked severe disorder caused by loss-of-function mutations in the DMD gene that encodes for the dystrophin protein [1]. DMD leads to progressive muscle weakness and wasting, fibrotic replacement of skeletal muscle tissue, and early death [2]. DMD patients are known to show heterogeneity in terms of clinical onset, disease progression, and treatment response [3, 4]. Currently, apart from some mutation-specific treatments that were recently made available, the standard of care is chronic treatment with steroidal anti-inflammatories. While DMD is a monogenic disease, data from both natural history studies and clinical trials in DMD have repeatedly shown substantial variability in rates of disease progression and response to treatment [5, 6]. This has hindered treatment development and complicated interpretation of drug effects in clinical trials due to inability to distinguish between an ineffective intervention and patient disease severity regardless of drug effect.
Multiple factors are known to be associated with clinical variability in DMD, including specific ‘leaky’ out-of-frame gene mutations (e.g., exon 44 skip amenable, splice site, 5’ mutations), location of mutation in the gene (differential involvement of dystrophin protein isoforms), genetic modifiers, and socioeconomic factors. Published reviews have provided an overview [4, 7], with both socioeconomic factors and genetic modifiers associated with a one-to-two-year change in loss of ambulation while low level dystrophin (exon 44 skip amenable, 5’ end alternative AUG) associated with greater than 3 years increase in loss of ambulation. DMD gene mutations have been previously established as associated with clinical prognosis [8], as have genetic modifiers (polymorphisms; often centered on TGFβ fibrosis and inflammation cascades) [9–13] and biomarkers (proteins, microRNAs) [14]. However, polymorphisms and mutations extensively stratify a DMD population, and tend to explain a relatively small part of observed variability.
Functional measures of motor outcomes are also known to be predictive of prognosis. A recent manuscript published based on 440 DMD ambulant and non-ambulant patients from the largest prospective DMD cohort study to date, CINRG Duchenne Natural History Study (DNHS; ClinicalTrials.gov: NCT00468832) established clinically meaningful milestones of progression; these are predictive of future trajectories of functional decline and showed that early positive benefits of steroidal treatment extrapolates to slower disease progression through the lifespan [15]. Monitoring clinical trajectories using longitudinal motor measurements can help track disease progress and some efforts have been previously published on identifying classes/groups of trajectories using distance walked in the six-minute walk test (6MWT) [16] and North Star Ambulatory Assessment (NSAA) [17].
We aimed to better characterize clinical outcome trajectories of young boys with DMD, starting at an early age through unsupervised clustering of trajectories of commonly used clinical outcomes. These outcome measures for DMD are known to be moderately to strongly correlated at a young age [18] but measure different aspects of disease progression as the FDA [19] recognizes, e.g., time to stand (TTSTAND) and time to climb (TTCLIMB) capture proximal strength, time to run/walk 10 m (TTRW) captures agility and acceleration, 6MWT captures endurance, and NSAA, a 17-item rating scale, captures functional/motor status. In addition, decrements in velocity of the timed function tests (TFTs) occur sequentially in a predictable order with TTSTAND velocity decrements occurring earliest and TTRW occurring latest. Our hypothesis is that a multivariate combination of early-age clinical outcome measurements and modeling the underlying latent function will yield subgroups of clinical trajectories that better reflect differential rates of disease progression in DMD. Inferring distinct trajectories over time as compared to one common trajectory and understanding differences between classes based on differences in distributions, e.g., of steroid exposure and type (deflazacort, prednisone or prednisolone, and vamorolone) will better allow us to investigate the interaction between pharmacological response and natural history.
Published studies found four clusters/classes of boys with DMD when modeling longitudinal trajectories, i.e., representing four different rates of disease progression [16, 17]. One study focused on 6-minute walk test, a measure of endurance [16], and the other focused on NSAA, 17-item rating scale that is used to measure functional motor abilities in ambulant individuals [17]. Note that in the latter paper, they showed clustering on two timed function test measurements (TFTs) as well; however, the recorded times were not used directly to define clusters, which were developed based solely on the summed NSAA scores (using only the grades of 0, 1, and 2 for the standing from supine and the running/walking functions that are measured in NSAA). A large proportion of participants also had missing data for glucocorticoid regimen (type) [17]. For DMD, muscle wasting is the central process which is only indirectly measured by clinically meaningful outcome measures that quantify gross motor functions. Focusing on one outcome measure alone while determining classes may discard valuable information from other outcomes important to disease prognosis. Different clinical outcomes also have varied progression-related difficulty and compliance for boys with DMD, e.g., ability to do TTSTAND is often the first to be lost with TTRW the last among the TFTs, and so, TTSTAND performance could be considered to be a better early prognostic endpoint. In our pooled CINRG DNHS subset and VBP15-002/003/LTE data, there are 52 timepoints from 48 participants including some repeated timepoints 1 year apart, where one ability had already been lost (e.g., TTSTAND) but not yet for at least one of the others (e.g., for TTCLIMB and TTRW). Hence, we used longitudinal outcome data from three timed function tests simultaneously: TTSTAND, TTCLIMB, and TTRW for clustering trajectories, i.e., using prognostic information from these outcomes simultaneously. This allowed us to model the variance in performance on different outcomes. The FDA has provided guidance that early-age treatment may have the greatest effect on long-term disease progression in DMD with treatment as early as possible resulting in the greatest benefit to preservation of muscle function and health. Hence, we focused on a narrower age range (4–10 years at entry) of interest to many clinical trials for muscle function improvement or managing muscle function decline. Both treated and untreated participants were included, i.e., steroid-naïve (or total lifetime exposure <6 months), or on steroids (prednisone/prednisolone/deflazacort/vamorolone) to better characterize differentially progressing DMD classes. We used data from the CINRG DNHS as well as a rigorously run sequence of open label clinical trials in vamorolone (46 boys from VBP15-002/003/LTE; ClinicalTrials.gov: NCT03038399) [20–23].
METHODS
Participant selection and outcome measurements
The Cooperative International Neuromuscular Research Group (CINRG) Duchenne Natural History Study (DNHS) obtained data on 440 boys aged 2–28 years with DMD. These data include measurements on participants who were a) treated with steroids (prednisone/prednisolone or deflazacort; daily or intermittent regimens) before enrollment, b) initiated treatment with steroids after enrollment, or c) never treated with steroids. In the CINRG DNHS, collection of 6MWT and NSAA data was added later and, therefore, contribute less data than the other TFTs. This natural history data set has been extensively reported in other manuscripts [12, 15] and as a real-world data set, there was some non-regular follow-up and attrition.
The vamorolone program through the VBP15-002/003/LTE study collected data on 46 boys with DMD (between 4 and 7 years at initial enrollment) on open label, daily vamorolone, a novel dissociative steroidal anti-inflammatory over up to 30 months. The initial VBP15-002/003 were first-in-patient and dose-finding studies (ranging from 0.25 to 6.0 mg/kg/day), with more effective doses found to be ≥2.0 mg/kg/day). The long-term extension (LTE) study saw all boys at ≥2.0 mg/kg/day vamorolone doses. Vamorolone has demonstrated efficacy compared to placebo in a double-blind, placebo-controlled clinical trial [24]. Clinical evaluators who collected outcome data were trained according to operating procedures standardized among the vamorolone and CINRG DNHS studies. The reliability of these motor outcome measurements has been published previously [18].
In recent studies, vamorolone has demonstrated similar efficacy to prednisone [24] while prednisone has demonstrated similar efficacy to deflazacort [25]. For this study, we pooled 219 ambulant participants from the CINRG DNHS (steroid-naïve, prednisone-, or deflazacort-treated) and 46 participants from the vamorolone program for a total of 265 participants with outcome measurements taken in age range 4–<10 years. Data pre-processing (see Supplemental Text) reduced the number of participants to 255 with 1388 time points contributing 4084 test measurements of TTSTAND, TTCLIMB, and TTRW over time. Given that participants could lose the ability to do these tests in the age range studied, we worked with velocities where confirmed inability to carry out a specific motor assessment was entered as velocity = 0. Note that both CINRG DNHS and the vamorolone trial protocols differentiated between patient non-compliance for an assessment, versus confirmed inability to carry out an assessment due to disease progression. Only those assessments that were confirmed as inability to do a test due to disease progression were given a velocity = 0, where future assessments also showed inability to do the test. Participants from the VBP15-LTE cohort had a mean follow-up of 2.5 years, while participants from the DNHS cohort had a mean follow-up of 2.0 years (maximum 5.1 years).
Both the CINRG DNHS and the vamorolone studies had ethics approvals. Analyses of these de-identified data were cleared by the Binghamton University Institutional Review Board, as well as the Carleton University Research Ethics Board.
Statistical analysis
All informative longitudinal data was utilized from all subjects studied (see Supplemental Text). The CINRG DNHS study, as a real-world natural history data set, included non-regular follow up and attrition, but no additional imputation of data was done (obtained data included confirmed loss of ability coded as a zero velocity).
We investigated if the observed heterogenous longitudinal trajectories of the three velocities can be adequately modeled by a mixture of two or more homogenous classes with each class representing a unique disease progression rate [16, 17]. Steroidal treatment can help slow DMD disease progression [15, 22, 26, 27]. Early exposure of steroids is felt to be of the greatest benefit to outcomes and disease progression [28]. Therefore, we differentiated between early vs late substantial (lifetime exposure ≥6 months) steroid exposure based on a combination of age and the length of exposure. Patients were categorized into three levels accordingly: steroid naïve (never exposed to steroids, or the total exposure is for <6 months), early exposure (greater than six months of exposure before age of 6 years), and late exposure (greater than six months of exposure after age of 6 years). All 46 participants from the vamorolone program dataset were on vamorolone for more than 6 months.
The underlying latent process of muscle function measured by multiple clinical responses (TTSTAND, TTCLIMB, and TTRW velocities) over time was modeled via a latent class latent process mixed model for multivariate markers while accounting for age and performance at enrollment (using TTRW velocity which is available over the widest age range among the 3 TFTs). This approach models the underlying latent muscle function behind these 3 outcome measures and clusters that latent variable. Within each latent class, periods of both improvement (or stabilization) and deterioration in function (the three TFT velocities are used as proxies for function) were allowed through a quadratic function of age of the participants due to age-related growth and development, and reversing of gains due to disease progression, consistent with previous reports [16, 17]. In addition, a nonlinear link function between the observed outcomes and the underlying latent process was utilized and estimated from the family of beta cumulative distribution functions. We also adjusted the steroid exposure categories as described above. Class membership was modeled via a multinomial logistic model with time-independent concomitant variables: steroid exposure category, age at first visit, TTRW velocity at first visit, and the interaction between age and TTRW velocity at first visit.
Models with mixtures of 1 through 4 latent classes were all fitted and compared as there was no prior knowledge on how many clusters would be adequate in this age range and for these outcomes simultaneously. Model fits were evaluated using the Bayesian Information Criterion (BIC) [29] to select a model with the number of classes that balances best between model fit and complexity. To form clusters, participants were assigned to the cluster to which they were most likely to belong (with maximum posterior probability of membership ranging from 0 to 1) based on model estimates. Steroid-type was not adjusted for directly, rather, associations with identified clusters were examined post-hoc. No imputation was done for missing data. Distributions of steroid drug, lifetime duration on steroid, and outcome measures at first visit were summarized per class and compared via chi-square tests or ANOVA as appropriate. No multiple testing correction was carried out.
The post-hoc table also provides distribution of mutations expected to yield a mild vs non-mild phenotype. This was done in two different ways based first on possible residual dystrophin (in-frame, 5’ mutation [exons 1 to 8], exon 44 skip amenable, or splice site mutation), and second on dystrophin isoforms. In-frame, 5’ mutation [exons 1 to 8], exon 44 skip amenable, and splice site mutations have been observed to be associated with (low level) residual/non-null dystrophin expression previously [4]. Regarding isoform categorization, two recent investigations studied association of dystrophin isoforms (Group 1: Dp427 absent only; Group 2: Dp427+Dp140 absent; Group 3: Dp427+Dp140+Dp116 absent; Group 4: Dp427+Dp140+Dp116+Dp71 absent) with growth patterns [30] and motor outcomes [31]. Gene mutations in the first half of the gene can affect dystrophin expression driven from the promoters driving full length, primary muscle dystrophin isoform (Dp427) and not affect expression of downstream promoters (Dp71, Dp116, Dp140). Here, mutations were classified to group 1 (Dp427 negative; Dp116/Dp140/Dp71 positive) if involving region upstream of exon 44, to group 2 (Dp427/Dp140 negative, Dp116/Dp71 present) if involving exon 45 or the region downstream to exon 56 inclusive, to group 3 (Dp427/Dp140/Dp116 negative, Dp71 present) if involving the region downstream to exon 62 inclusive, to group 4 (all isoforms absent) if involving the region downstream of exon 63. Group 3 and 4 had low observed counts (n = 6 and 3, respectively) and were merged for our analyses, resulting in three groups (Dp427 absent only, Dp 427/Dp140 absent, and Dp 427/Dp140/Dp71 absent). Note that the genetic result for some participants may not have been available as one means of meeting genetic eligibility for CINRG DNHS was by absence of dystrophin protein on muscle biopsy.
Finally, a sensitivity analysis was carried out. We performed 10-fold training-test splits on the 255 participants. Specifically, we randomly split the overall dataset on 255 participants 10 times into an 80:20 training-testing split, with each time the random split being stratified by the two types of data (natural history from CINRG DNHS and clinical trial from vamorolone program) as well as by steroid exposure categories (naïve, early exposure, or late exposure). For each of the 10 training datasets, we fitted the same model as for the primary analysis and controlled for the same variables. All analyses were implemented using the lcmm package [32] and all plots were generated using the ggplot2 [33] package in R [34]. Measurements were restricted to under 10 years of age in general (last visit for vamorolone treated boys was ∼9.5 years) as there were many more zero velocities across outcomes around this age and residual analysis indicated satisfactory fit prior to this age. However, when available, natural history beyond age 10 was also used in post-hoc analysis.
RESULTS
Participant characteristics
Table 1 summarizes the baseline characteristics including demographics, steroid exposure, steroid type, and baseline outcome values. Age at first assessment ranged from 4.01 to 9.74 years with a mean of 6.39 and standard deviation (SD) of 1.52 years for the 255 participants. Follow-up ranged from 0.23 to 5.12 years with a mean of 2.06 and SD of 1.15 years. Most participants were treated with a steroid, either glucocorticoid or vamorolone. Over the age range and follow-up studied, 8.24% of the participants were never exposed to steroids or had a total exposure length less than 6 months. 66.67% had steroid exposure for more than 6 months after the age of 6 years (substantial later exposure) while the remaining 25.09% had substantial early exposure (for more than 6 months of exposure before age of 6 years) of steroids. The mean velocities at first visit on the TTSTAND, TTCLIMB, and TTRW tests were 0.21 m/s, 0.26 m/s, and 1.75 m/s, respectively. In this section, we provide cluster-specific comparisons and p-values from the latent process mixed model for multivariate outcomes. In addition, unadjusted p-values from ANOVA and Fisher’s exact tests based on counts across fitted trajectory classes are provided in Table 1.
Table 1
Participant Characteristics and post-hoc comparisons of fitted trajectory classes
| Progression (fastest to slowest) | |||||
 | |||||
| All (n = 255) | Class 1 (n = 25) | Class 2 (n = 111) | Class 3 (n = 119) | p-valuea | |
| Demographics | Mean (sd) | Mean (sd) | Mean (sd) | Mean (sd) | |
| Age at baseline | 6.39 (1.52) | 6.34 (1.29) | 6.65 (1.67) | 6.16 (1.39) | 0.049 |
| Years of follow up | 2.06 (1.15) | 1.56 (0.94) | 1.95 (1.18) | 2.27 (1.12) | 0.008 |
| Steroid Exposure | n (%) | n (%) | n (%) | n (%) | 0.63 |
| Steroid Naïveb | 21 (8.24) | 3 (12) | 8 (7.21) | 10 (8.4) | |
| Substantial early exposure | 64 (25.1) | 4 (16) | 30 (27.03) | 30 (25.21) | |
| Substantial late exposure | 170 (66.67) | 18 (72) | 73 (65.77) | 79 (66.39) | |
| Steroid Type | n (%) | n (%) | n (%) | n (%) | 0.72 |
| Naïve or unknownc | 22 (8.63) | 3 (12) | 9 (8.11) | 10 (8.4) | |
| Prednisone/Prednisolone | 78 (30.59) | 5 (20) | 40 (36.04) | 33 (27.73) | |
| Deflazacort | 75 (29.41) | 8 (32) | 28 (25.23) | 39 (32.77) | |
| Both Prednisone and Deflazacort | 34 (13.33) | 5 (20) | 14 (12.61) | 15 (12.61) | |
| Vamorolone | 46 (18.04) | 4 (16) | 20 (18.02) | 22 (18.49) | |
| Dystrophin isoforms (n = 190)d | n (%) | n (%) | n (%) | n (%) | |
| Dp427 absent, Dp140/Dp71 present | 62 (32.6) | 10 (16.1) | 17 (27.4) | 35 (56.5) | Reference |
| Dp427/Dp140 absent, Dp71 present | 119 (62.6) | 11 (9.2) | 55 (46.2) | 53 (44.5) | 0.04 |
| Dp427/Dp140/Dp71 absent | 9 (4.8) | 0 (0) | 7 (77.8) | 2 (22.2) | 0.02 |
| Residual dystrophin (n = 190)d | n (%) | n (%) | n (%) | n (%) | 0.21 |
| Likely null | 148 (77.9) | 17 (11.5) | 66 (44.6) | 65 (43.9) | |
| Possible non-null (5’ [exons 1–8], exon 44 skip, in-frame, splice site) | 42 (22.1) | 4 (9.5) | 13 (31) | 25 (59.5) | |
| Residual dystrophin and Dystrophin isoform (n = 190)d | n (%) | n (%) | n (%) | n (%) | 0.045 |
| Neither (or only one of) Dp427 absent, Dp140/Dp71 present nor (or) possible non-null | 165 (86.8) | 17 (10.3) | 74 (44.8) | 74 (44.8) | |
| Both Dp427 absent, Dp140/Dp71 present AND possible non-null (5’ [exons 1–8], exon 44 skip, in-frame, splice site) | 25 (13.2) | 4 (16) | 5 (29) | 16 (64) | |
| Baseline Measurements | Mean (sd) | Mean (sd) | Mean (sd) | Mean (sd) | |
| Run/Walk 10m velocities | 1.75 (0.58) | 0.96 (0.33) | 1.43 (0.27) | 2.22 (0.42) | <0.0001 |
| Climb velocities | 0.26 (0.14) | 0.12 (0.08) | 0.19 (0.08) | 0.36 (0.12) | <0.0001 |
| Stand up velocities | 0.21 (0.1) | 0.1 (0.08) | 0.15 (0.06) | 0.28 (0.08) | <0.0001 |
| Loss of ability (0 velocities) at age 10e | Count (%) | Count (%) | Count (%) | Count (%) | |
| Run/Walk 10m velocities | 21 (8.24) | 15 (60) | 4 (3.6) | 2 (1.68) | <0.0001 |
| Climb velocities | 30 (11.76) | 16 (64) | 12 (10.81) | 2 (1.68) | <0.0001 |
| Stand up velocities | 56 (21.96) | 21 (84) | 26 (23.42) | 9 (7.56) | <0.0001 |
| Loss of ability (0 velocities) at end of follow-up | Count (%) | Count (%) | Count (%) | Count (%) | |
| Run/Walk 10m velocities | 68 (26.67) | 17 (68) | 37 (33.33) | 14 (11.76) | <0.0001 |
| Climb velocities | 82 (32.16) | 18 (72) | 44 (39.64) | 20 (16.81) | <0.0001 |
| Stand up velocities | 102 (40) | 21 (84) | 54 (48.65) | 27 (22.69) | <0.0001 |
| Predicted TTRW velocities at age 8f | m/s | m/s | m/s | ||
| Steroid naïve | – | 0.89 | 1.48 | 2.12 | – |
| 6-mon-after-6-years | – | 0.87 | 1.55 | 2.26 | – |
| 6-mon-before-6-years | – | 0.56 | 2.01 | 2.56 | – |
| Predicted TTCLIMB velocities at age 8 | tasks/s | tasks/s | tasks/s | ||
| Steroid naïve | – | 0.08 | 0.20 | 0.36 | – |
| 6-mon-after-6-years | – | 0.08 | 0.21 | 0.41 | – |
| 6-mon-before-6-years | – | 0.04 | 0.33 | 0.48 | – |
| Predicted TTSTAND velocities at age 8 | rises/s | rises/s | rises/s | ||
| Steroid naïve | – | 0.05 | 0.15 | 0.27 | – |
| 6-mon-after-6-years | – | 0.05 | 0.16 | 0.30 | – |
| 6-mon-before-6-years | – | 0.01 | 0.25 | 0.34 | – |
| Posterior Probabilities of belonging to each cluster | Median (range) | Median (range) | Median (range) | ||
| Overall model | 0.97 (0.61, 1.00) | 0.98 (0.51, 1.00) | 1.00 (0.51, 1.00) | – | |
| Median across <10 training datasets | 0.94 (0.38, 1.00) | 1.00 (0.27, 1.00) | 0.98 (0.61, 1.00) | – | |
| Median across <10 testing datasets | 0.98 (0.00, 1.00) | 1.00 (0.36, 1.00) | 0.64 (0.00, 1.00) | – | |
ap-values are from ANOVA and Fisher’s exact tests based on counts across fitted trajectory classes. The main text includes cluster-specific comparisons and p-values from the latent process mixed model for multivariate outcomes. bThere were 19 participants never exposed to any type of glucocorticoid. There were 2 participants who were exposed to deflazacort but for less than 6 months; these were included in the “Steroid Naïve” category for the “Steroid Exposure” variable. cThere were 3 participants who were exposed to an unknown type of glucocorticoid for more than 6 months. dFor the three mutation-based subgroups, row-based proportions are also provided. eLongitudinal data before the age of 10 years was used for modeling and analysis in the current study. fInferred mean class-specific velocities for fixed mean baseline age and TTRW velocity.
Classification of progression of disease
Fitted clusters
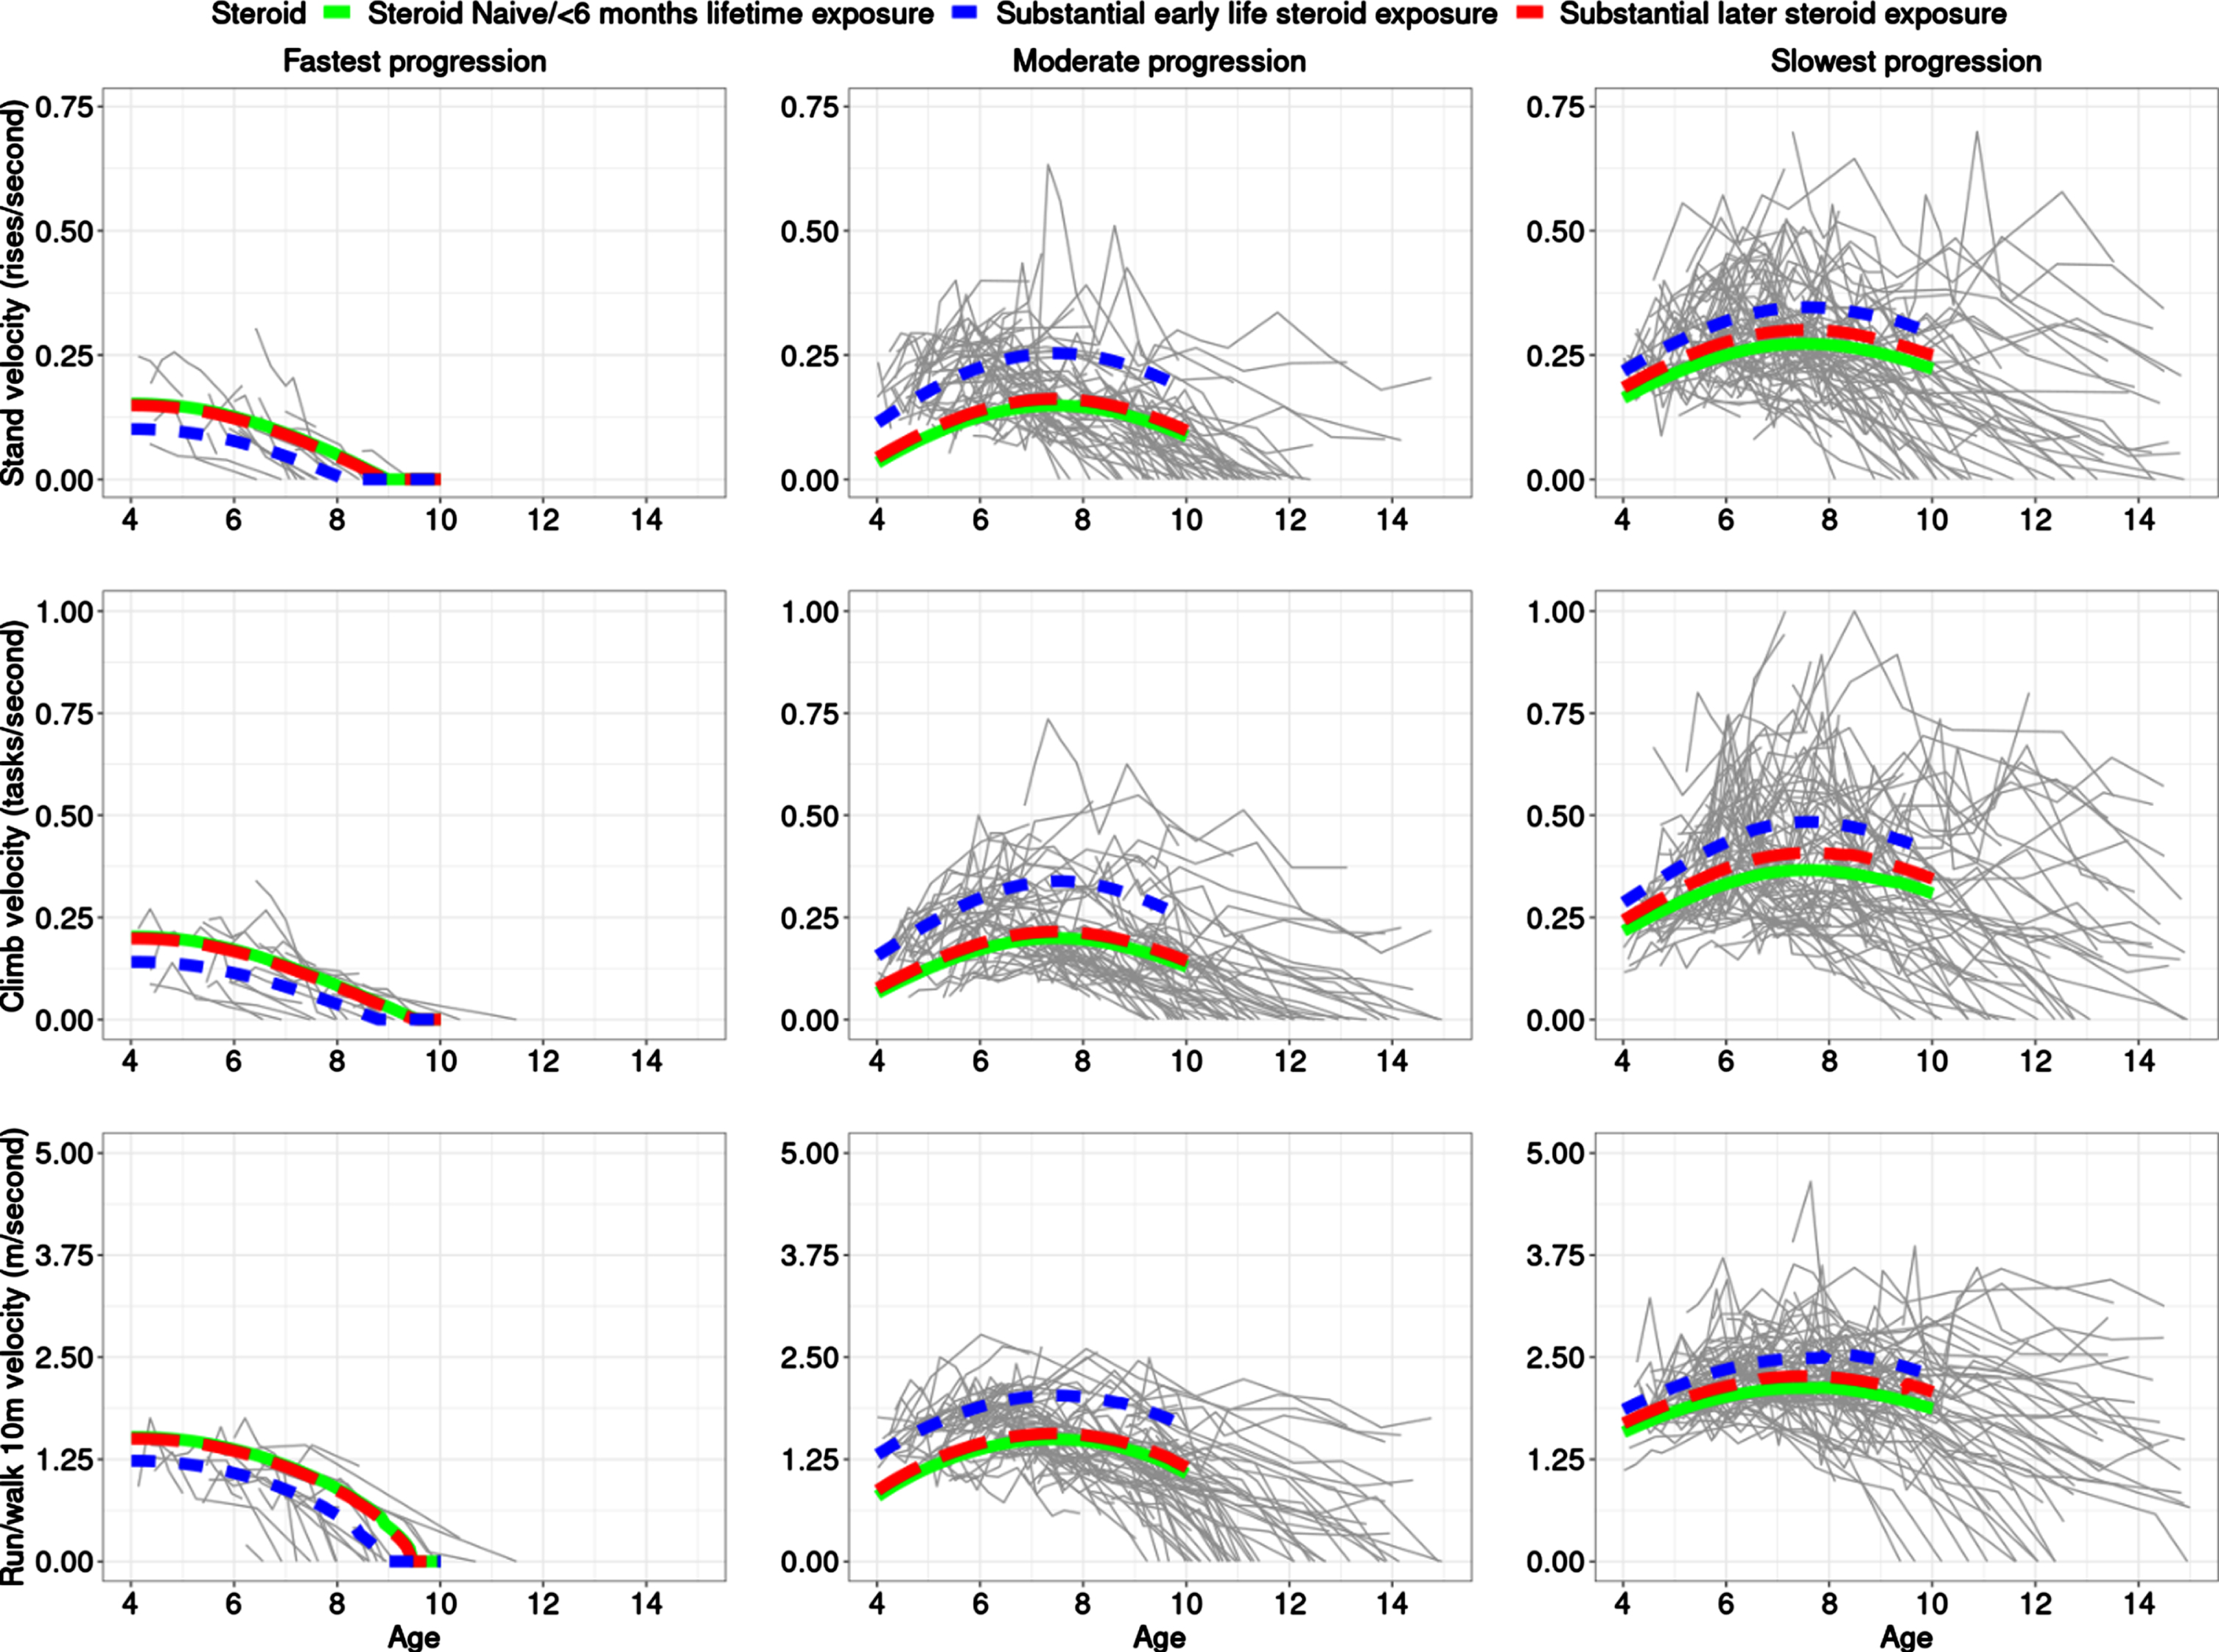
We conducted an unsupervised analysis and fit different models for a number of classes and used BIC to pick the best fitting number of clusters. Three clusters/classes over time of similarly progressing boys with DMD best fit the data (Fig. 1, Table 1). More details are provided in Supplemental Text. In the preferred (by BIC) model with three latent classes, participants were grouped based on severity of progression as follows: 10% (n = 25) participants were in Class 1, which was the most severe class characterized by a fast progression/decline, with a majority of the participants in this class having low velocities and losing the ability to accomplish the three tests by end of follow-up (10 years of age); 44% (n = 111) participants were in Class 2, the moderate progression class, where many participants lost the TTSTAND velocity between ages 9 and 12 years and had velocities of the other two tests decline to zero between age of 10–15 years; and 46% (n = 119) in Class 3 where many participants did not lose the ability to perform TTSTAND, TTCLIMB or TTRW by end of follow-up. The median (range) probability of belonging to clusters 1, 2, and 3 for the observations mapped to those clusters was 0.97 (0.61, 1.00), 0.98 (0.51, 1.00), and 1.00 (0.51, 1.00). For the clusters themselves, while there were differences in mean age at first visit between the classes, there was no trend in association with progression. Figure 1 provides the predicted trajectories for the 3 TFTs using the estimated 3-class model with fixed baseline age and baseline TTRW velocity and different steroid exposure status, superimposed on the observed participant trajectories, including measures taken after age of 10 years.
Fig. 1
The best fitting model estimates three distinct clusters of boys with DMD. The top, middle, and bottom rows are for TTSTAND, TTCLIMB, and TTRW velocities, respectively. Subpanels from left to right are for Cluster 1: fastest progressing DMD with a more rapid decline of motor outcomes, then Cluster 2 with a more moderate progression, followed by Cluster 3 with the slowest progression. Overall inferred mean class-specific trajectories until age 10 (end of follow-up for analysis) are overlaid for fixed mean baseline age and TTRW on top of the observed trajectories. The legend shows the three-levels of the steroid status with the following levels: naïve throughout (solid; green), greater than 6 months exposure to steroids after 6 years (dashed; red), and greater than 6 months exposure to steroids prior to 6 years (dotted; blue). The x-axis is truncated at 15 years. Only data until age 10 was included for model-based clustering purposes but trajectories are plotted until end of follow-up as available in CINRG DNHS. Abbreviations: DMD: Duchenne muscular dystrophy; TTSTAND: time to stand from supine; TTCLIMB: time to climb four steps; TTRW: time to run/walk 10m; CINRG DNHS: Cooperative International Neuromuscular Research Group Duchenne Natural History Study
Shape of trajectories
For the fastest progressing class (Class 1), there is slight curvature but no clear improvement/stabilization period (the quadratic age term had p = 0.023), however, such a period is clearly visible in the two slower progression classes (cf. quadratic curvature in Fig. 1) with velocities stable or mildly increasing around the 6 to 8 years of age period before declining (Class 2 and 3; p = 0.00013 for Class 2, p = 0.00061 for Class 3).
Impact of steroid exposure
For the moderate and slowest progression classes, boys who had substantial early steroid exposure had superior outcomes as compared to those with later steroid exposure followed by those who remained steroid-naïve or had limited lifetime steroid exposure. The small number (21/255 = 8.24%)of steroid-naïve participants throughout is important to note when comparing to participants with steroid exposure. However, substantial early exposure was associated with better performance as compared to being steroid-naïve in the moderate (p = 0.0045) and slowest progression classes (p = 0.010) in the fitted model. Late steroidal exposure was not statistically significantly different from steroid-naïve participants in any class although the largest effect size was seen in the slowest progression class. It is interesting to note that Class 2 with moderate progression showed the largest difference between trajectories of participants who were exposed to substantial early vs late steroid exposure (or none). Class 2 (moderate progression) had a larger relative percentage improvement between naïve and early exposure subclasses, vs. Class 3 (slowest progression) based on predicted TFT velocities at age 8 years (Table 1); the ratio of these relative percentage improvements in Class 2 vs Class 3 were 1.73, 1.95, and 2.57 for TTRW, TTCLIMB, and TTSTAND, respectively. This suggests that the moderate progressing class might be best for clinical trials to assess treatment response in a shorter duration trial.
The proportion of participants with substantial early exposure in Classes 1 through 3 (fastest to slowest progression class) was 16%, 27%, and 25%, respectively. There were clear differences in TFT velocities between the class-specific predicted trajectories for velocities at 8 years. Predicted velocities at age 8 years had concordant signal, with participants with substantial early steroid exposure performing the best on all TFTs. Table 1 provides predicted velocities of participants across different classes and different steroid exposure status for TTSTAND, TTCLIMB and TTRW tests at age of 8 years.
Performance at enrolment
Performance at enrollment on TFTs was highly informative, with a trend of highest TFT velocity (milder phenotype) in the slowest progression class (p < 1e-32 for all 3 TFTs). Note that neither of the two cohorts included had an inclusion criteria cutoff for TFT performance. Between the two moderate progressing classes, Class 2 and 3, the age of first assessment (p = 0.01), the baseline TTRW velocity (p = 0.04), and the interaction between TTRW velocity and age at first assessment in the cohort were significant to the class membership component of the model fit.
Loss of TFT abilities
Table 1 also includes post-hoc class summaries/breakdowns of steroid exposure, steroid type, baseline performance, loss of ability to do TFTs, and predicted velocities at age 8 years. The proportion of participants who had loss of ability to do TFTs by age 10 years due to disease progression in the three classes followed an expected pattern: ability to perform TTSTAND lost most often followed by TTCLIMB and then TTRW. The class with the fastest progression had much more overlap between loss of ability to perform TFTs. Time to lose these abilities was much closer for the class with the fastest progression compared to the other two classes. While we focused on a younger age range (<10 years) that is most relevant to clinical treatment trials in DMD and an age range where the TFTs would be most informative, longer-term follow-up was available from DNHS and Fig. 1 plots all data available for participants that were included in the study. The trend in abilities lost by age of 10 years is preserved over longer follow-up as well.
Steroid type
The prednisone/prednisolone and vamorolone treated participants seemed to be split evy among the moderate and slowest progression classes. In the fastest progression class, there was a higher proportion of deflazacort treated participants (8/25) as compared to the similarly sized prednisone/prednisolone subsample. However, this was also true for the slowest progressing class (39/119).
Outcomes modeled by latent factor
With the best-fitting 3-class model, conditional on the covariates, about 27.0% for TTSTAND velocity, 28.3% for TTCLIMB velocity, and 24.0% for the TTRW velocity residual variation, respectively, was captured at the start of the study by the underlying latent factor. The variation captured near the middle of the study for each of the TTSTAND, TTCLIMB and TTRW velocities were 53.3%, 54.5%, and 49.3%, respectively. Near the end of the analysis follow-up, 90.6% of the residual variation for TTSTAND velocity was explained by the latent class model; 91.1% for TTCLIMB velocity and 89.2% for TTRW velocity were captured as well. This suggest that as the participants progress over time, there is more variability from the outcomes being explained by the latent factor being clustered, i.e., we could have participants who perform much better on one outcome than another near the beginning of the study but near the end this is less likely to happen due to deterioration in overall strength and function. This is expected as our model explains the common latent underlying factor of weakness and progression, progressively capturing more of the variation behind the three TFTs moving forward through time. This is important because if we had relied only on one outcome, we would have not captured the common muscle strength variable but would have captured information more specific to that one outcome (e.g., proximal strength or acceleration).
Mutation stratification
Two mutation-based categorizations and association with longitudinal class were investigated post-hoc. The first was based on dystrophin isoform categorizations, when available (missing for 65 out of 255 participants): in increasing order of severity expected: Dp427 absent and Dp140/Dp71 present (Group 1); Dp427/Dp140 absent and Dp71 present (Group 2); and Dp427/Dp140/Dp71 absent (Group 3). The last categorization (Dp427/Dp140/Dp71) was observed for only 9 boys. Dystrophin isoform groupings and clustering of longitudinal trajectories were associated based on Fisher’s exact tests comparing Group 1 to Group 2 (p = 0.04) and comparing Group 1 to Group 3 (p = 0.02) across fitted clusters (Table 1). The second categorization was based on the possibility of residual dystrophin due to mutation, i.e., in-frame, 5’ mutations, exon44 skip, or splice site mutations. There were 9 participants for whom it could not be determined in the CINRG DNHS subset whether the mutation was in-frame or not. These participants were excluded. No clear patterns were noted here (Table 1). Finally, combining residual dystrophin groups (in-frame, 5’ mutations, exon 44 skip amenable, or splice site mutations) with dystrophin isoform Group 1, 25 expected mild mutations out of 190 were identified. Compared to its complement, these mild mutations were found to be enriched in the slowest progression class (p = 0.045).
Sample size calculations
As noted previously, the moderate progression showed the largest difference between trajectories of participants who were exposed to substantial early vs late steroid exposure (or none). To evaluate how many participants would need to be enrolled to detect the same treatment effect size, we ran sample size calculations using the moderate progression class vs all participants using observed and interpolated data at age 7. Given the smaller proportion of steroid-naïve participants as well as the observation that many later exposure participants would have comparatively less steroid-exposure at age 7, the steroid-naïve participants were pooled together with later exposure participants for summary statistics (mean, standard deviation at age 7) and compared to early steroid-exposure participants. The effect size was taken as the largest treatment response effect size, seen in the moderate progression class, while the standard deviations were obtained from interpolated data. For TTSTAND, TTCLIMB and TTRW velocities, using data from all participants (power = 0.95, alpha = 0.05) resulted in a required sample size of 162, 378, and 88 participants, respectively. On the other hand, enrolling the moderate progression class participants only would have cut this down to 50, 124, and 30 participants, respectively (yielding ratios of 0.31, 0.33, and 0.34 to all participants) due to the increase in power (because of the reduction in variance). This is consistent with a previous effort, which also showed an increase in power/reduction in sample size by considering clustered trajectories of DMD participants.
Sensitivity analyses
Overfitting can be a concern in analyses without known truth, in our study knowing which classes these participants fall into (which we are inferring here). We did training-testing splits as sensitivity analyses, followed by fitting the same model as in the primary analysis and controlling for the same covariates. In essence, the model was fit on a random subset of 80% participants and tested on the remaining 20% participants; this was done 10 times. Five out of the ten times, the model selection criterion BIC preferred a 3-class model. For the other 5 times, BIC preferred a 2-class model; however, among these training-testing splits, BICs for the 2-component models and the 3-component models were close.
Each time a 3-class model was selected, the identified three classes were characterized similarly as in the main analysis with similar weights of the latent classes (approximately 48% participants in the slowest progression class, 42% in the moderate progression class, and 10% in the fastest progression class). Four out of the five times that the 3-class model was selected by BIC, early steroid exposure status and the quadratic term (curvature of trajectory characterizing an improving followed by a deteriorating phase) of the age for the moderate and mild progression clusters came out as significant (p < 0.05). We also computed the median posterior probability for each observation getting classified into a certain class, from the training data, and from the testing data, across splits. Calculating a median (range) of these computed median posterior probabilities for observations from the training data across the splits yields 0.99 (0.38, 1.00) for the fastest progression class, 1.00 (0.27, 1.00) for the moderate progression class, and 0.98 (0.61, 1.00) for the mild progression class. The median (range) of median posterior probabilities for observations from the test data across the splits are 0.98 (0.00, 1.00), 1.00 (0.36, 1.00), and 0.64 (0.00, 1.00) for the three progression classes, showing a high degree of confidence and relatively stability in class assignments. More details are provided in Supplemental Text.
DISCUSSION
There have been impressive strides in modeling the overall disease trajectory of DMD by analyzing large groups of patients in collaborative studies [35]. However, there is considerable patient-patient variability seen in such studies, and our goal was to cluster individual longitudinal patient trajectories at a young age. Having robust individualized predictions of future trajectory of boys with DMD based on early-age data could aid in differentiating a participant experiencing severe clinical decline from lack of drug response in a clinical trial setting. Here, a model for clusters of clinical trajectories of the DMD natural history was defined. Muscle strength and function can be indirectly measured by the proxies of TFTs, but different TFTs capture different dimensions of progression. While direct measures of strength can be captured via myometry, the use of TFTs is more common as primary/secondary clinical outcome measures in DMD. Using multiple outcome measures simultaneously and modeling the latent factor of underlying muscle strength and function was important to yield subgroups of clinical trajectories that better capture differential disease progression as compared to progression in any one outcome.
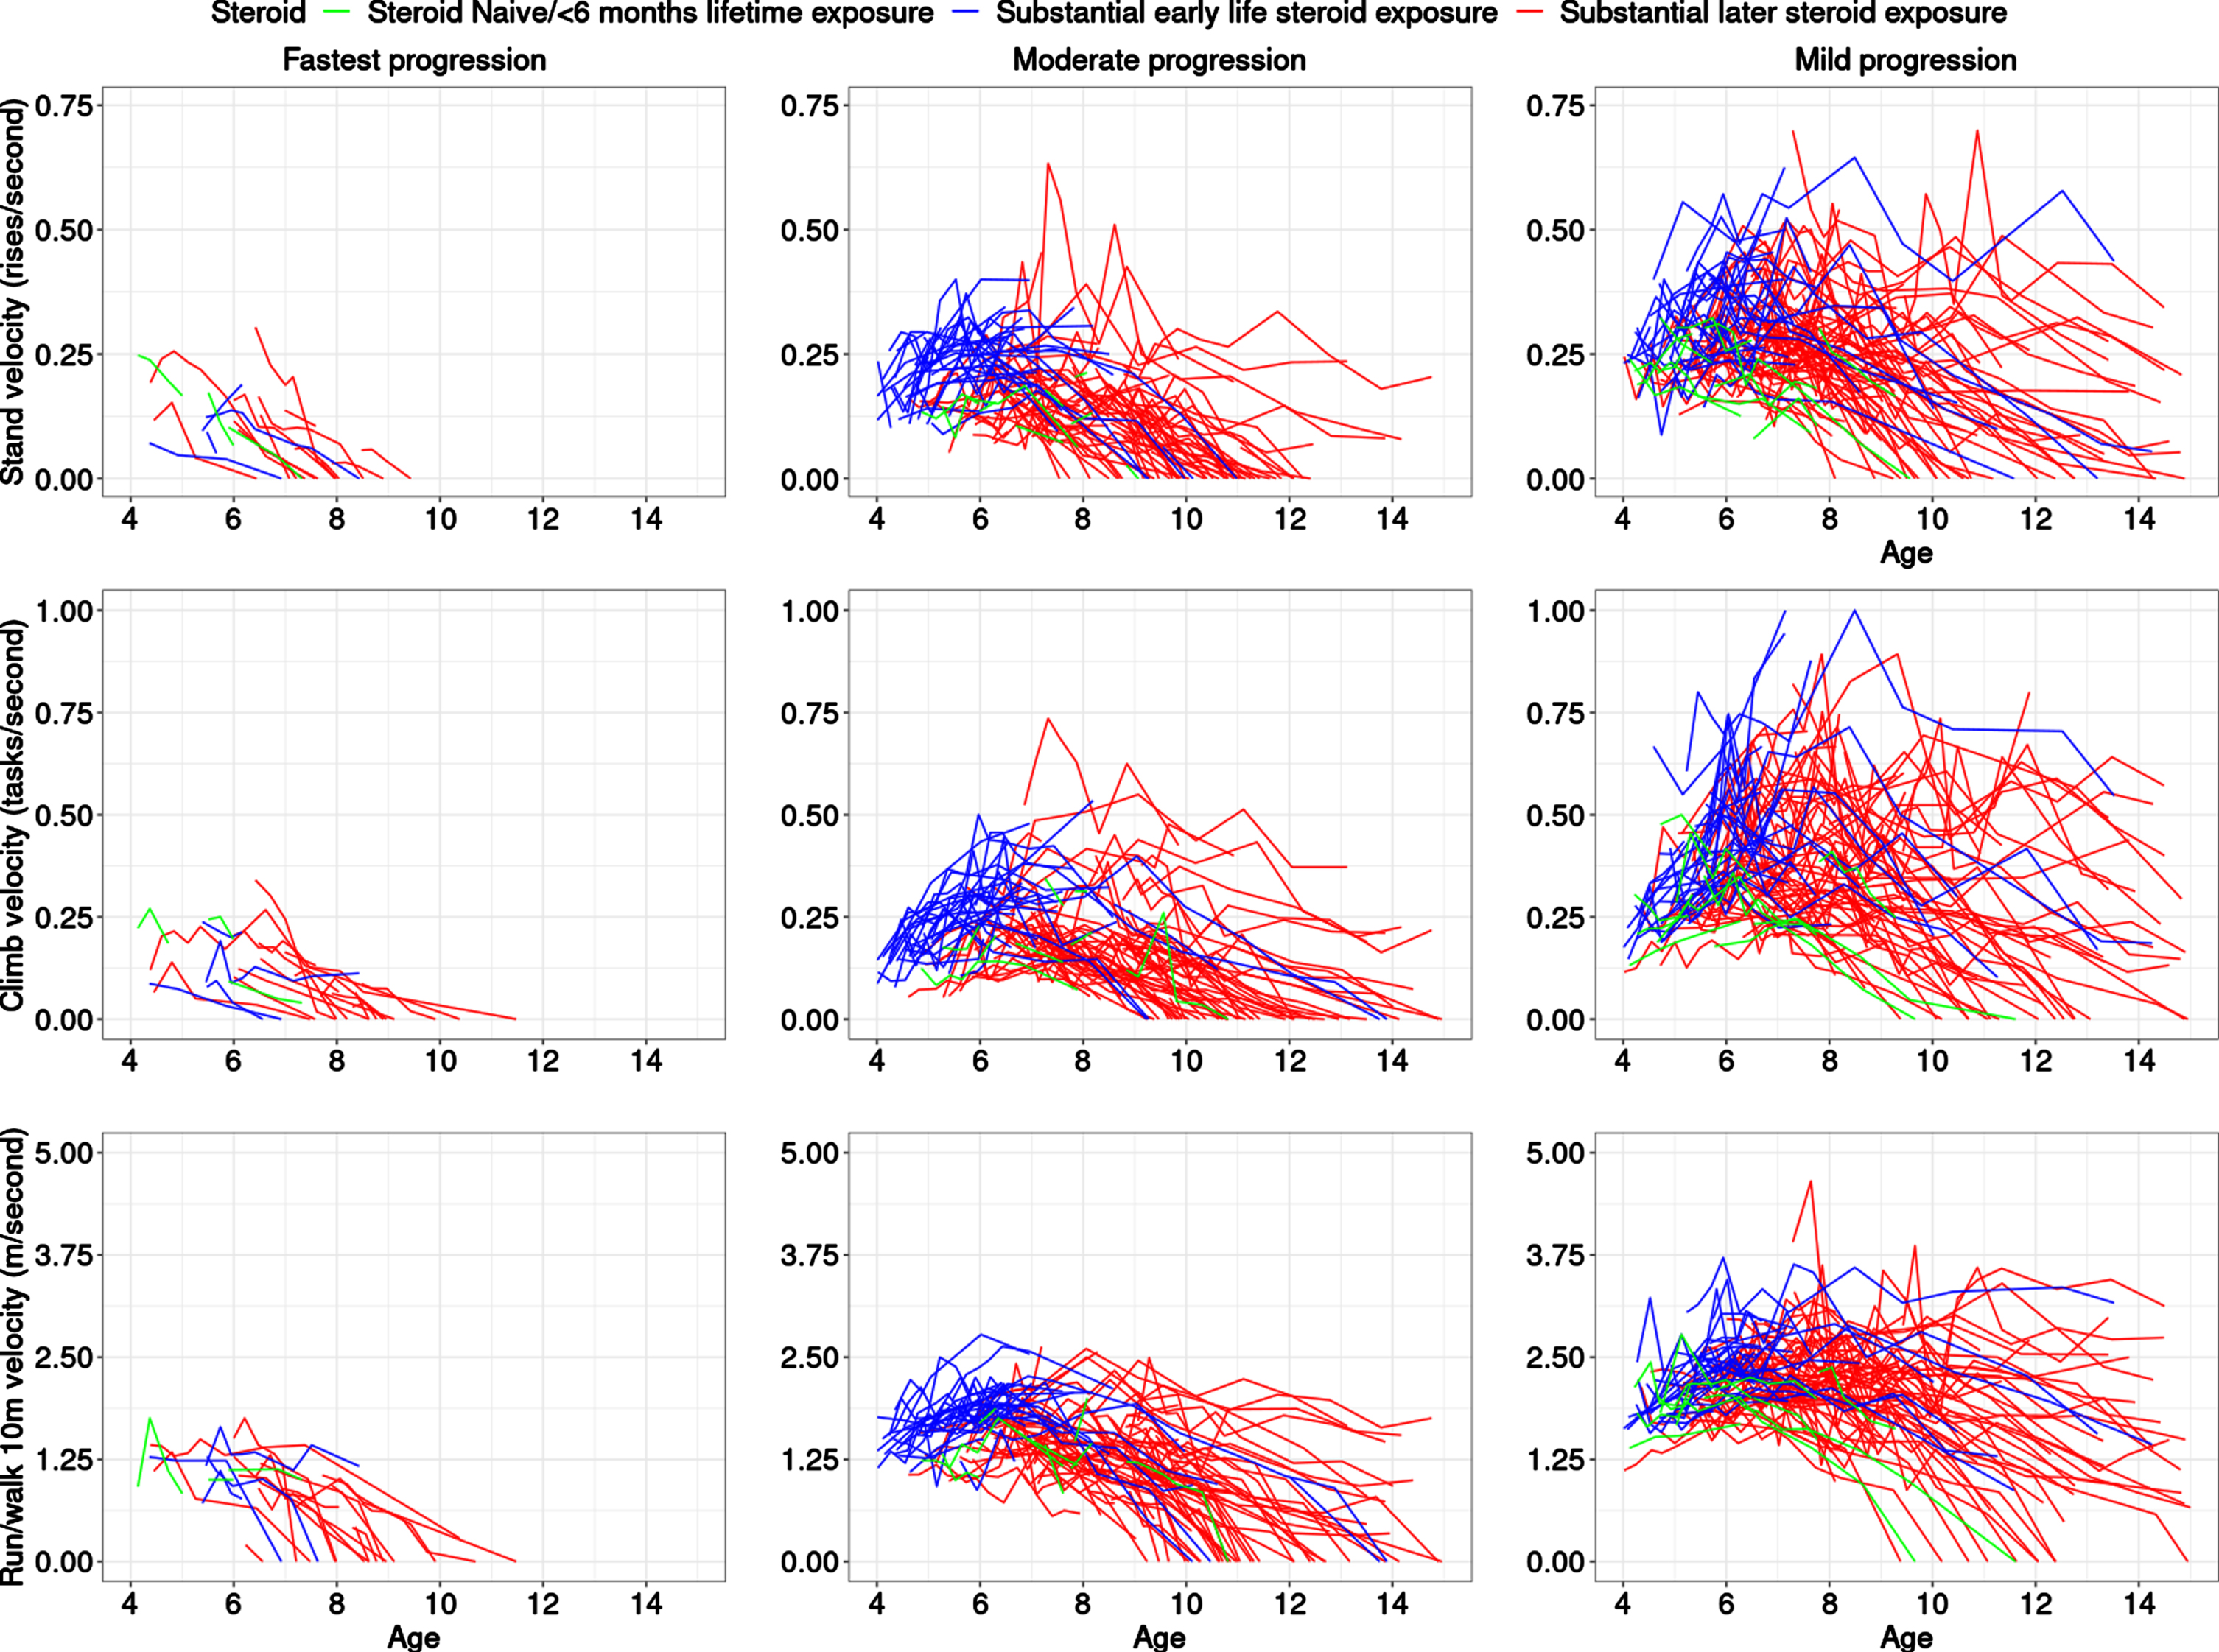
We modeled functional tests of participants with DMD who were steroid naïve or on glucocorticoids (with an all-comers approach including daily and intermittent regimes, down-titrated doses, etc.) in the CINRG DNHS as well as on controlled usage in a long-term extension trial of a dissociative steroid, vamorolone. Our work increases understanding of variable disease progression rates, identification of common clinical trajectories at an early age, and their association with baseline measurements. Understanding differences between subgroups on the basis of differences in distributions, e.g., of steroid type (deflazacort, prednisone or prednisolone, and vamorolone) can allow for better insight into the interaction between pharmacological response and natural history. As expected, boys with DMD who had substantial early steroid exposure (prior to 6 years) did better than those who had later steroid exposure (after 6 years) and much better than those who were steroid-naïve or had limited lifetime steroid exposure. Interestingly, some who remained steroid naïve long-term were also clustered in the moderate and slowest progression classes (Table 1, Fig. 2), i.e., they were similar to milder participants at baseline, but then showed a more severe trajectory, in general, than steroid-treated participants in those classes. As compared to previous efforts on clustering based on 6MWT [16], and NSAA [17], which each found four clusters of like-progressing boys with DMD, our study found that three classes best fit the data in this younger age range (previous efforts had mean age range of 8.3±2.1 years [16] and 7.1±2.6 years [17] at enrollment) when clustering the latent muscle function variable behind the three TFTs. While our study is not directly comparable to prior latent class studies due to the different outcomes that were modeled and the younger age range, it is possible that the number of like-progressing classes may increase when the analysis is performed over a larger age range. These previous works had some similarities to our findings, for example, the fast-declining participants did not show a substantial period of early maturational improvement, but rather showed a very small stable period followed by decline and hence very little curvature in the fitted trajectory. In contrast, the other extreme of slowly progressing participants experienced a prolonged improvement followed by a stabilization period. Our study found a small class of fast-declining participants over a smaller age range (∼10%)consistent with the 6MWT clustering study finding [16] (∼8%)but smaller than the NSAA study finding [17] (∼26%). Similarly, the class of slowest-declining participants was more similar between this study (∼48%)and the 6MWT clustering study [16] (∼46%). This may be due to the nature of NSAA, which is a composite measure of ordinal outcomes and cannot differentiate between severity of participants in a continuous fashion. On the other hand, NSAA is useful over a wider age range than individual TFTs. Our studies confirmed the findings of previous studies [16, 17] in the general observation that faster declining classes have worse baseline measures compared to slower progressing classes. Note that even within the three clusters identified as best fit to our data, there was heterogeneity between participant outcome performance based on nature of outcome and muscles involved, and participant ability for that outcome at a specific age.
Fig. 2
Trajectories highlighted in colors representing steroid status. The top, middle, and bottom rows are for TTSTAND, TTCLIMB, and TTRW velocities, respectively. Subpanels from left to right are for Cluster 1: fastest progressing DMD with a more rapid decline of motor outcomes, then Cluster 2 with a more moderate progression, followed by Cluster 3 with the slowest progression. The legend shows the three-levels of the steroid status with the following levels: naïve throughout (green), greater than 6 months exposure to steroids after 6 years (red), and greater than 6 months exposure to steroids prior to 6 years (blue). The x-axis is truncated at 15 years. Abbreviations: DMD: Duchenne muscular dystrophy; TTSTAND: time to stand from supine; TTCLIMB: time to climb four steps; TTRW: time to run/walk 10m.
Our observation of a three-cluster model is likely further evidence of the challenge inherent in the prediction of longitudinal trajectories for DMD from an early age, due to the heterogeneity of disease progression. We consider the three clusters found as further evidence of heterogeneity in early age longitudinal trajectories, not the final word on the number of clusters in the general DMD population at a young age as severity falls on a continuum.
We envision using enrichment strategies [36] and/or planned subgroups [37–39] to integrate our findings into future clinical trial design. First, there is potential for purpose of selective enrolment in clinical trials, e.g., by enriching for certain phenotypes for eligibility. By restricting recruitment of participants, heterogeneity in disease progression is reduced, and power for detecting a drug effect is increased. This may facilitate detection of small significant drug effects by enriching for certain phenotypes or expected treatment-response. A disadvantage of this approach is that it could restrict the drug labeling upon drug approval, thus limiting patient access to the approved drug. A partial (stratified) enrichment strategy which includes “all comers” (non-restrictive inclusion criteria) but has a large proportion of enrolled participants predicted to be expected responders via a prognostic model at baseline may be a better strategy. Another approach would be to use planned subgroup analyses. This could allow for including ‘all comers’ in a trial, using the expected responders (as predicted by a model at baseline) for primary analyses, and building analyses of other subgroups into statistical analysis plans as subgroup analyses. With this approach, drug effect on different subgroups could be studied as subgroup analyses supporting the primary and secondary outcomes of a clinical trial. Sample size calculations show the possible impact of being able to enroll and/or pre-specify analyses for sub-groups of participants most likely to show treatment response. Our finding that the treatment response was most apparent in the moderate progression class is a meaningful step forward. Future studies will explore building prognostic models using baseline/early age characteristics. Other efforts are required to validate our findings in larger cohorts.
The study’s strengths include the focus on early age and multiple timed function testing endpoints, as well as pooling of data from studies with harmonized muscle outcome testing protocols. We also conducted sensitivity analyses via training-test splits. Furthermore, a visual sensitivity analysis was also carried out to test for overfitting. Clustering trajectories based on early age were prognostic of outcomes in later years not used in the modeling (for the CINRG DNHS subset where such measurements were available after 10 years of age) based on the proportion of confirmed loss of abilities, progression of outcomes in the three defined classes. Using multivariate outcomes and modeling the common latent process behind these manifest variables may also alleviate the impact of measurement error in one outcome at a timepoint.
The study’s limitations include the relatively small number of steroid naïve participants and the disproportionate emphasis of follow-up restricted to the first few years for the younger participants (at baseline) in the vamorolone cohort and the attrition and non-regular follow-up seen in CINRG DNHS for some participants. We adjusted for lifetime steroid exposure at baseline to keep complexity of the model low rather than treating this as time dependent. We used a cross-sectional approach to calculate sample sizes as much of our cohort (the CINRG DNHS subset) was not steroid-naïve at first assessment. We did not test association with treatment regimen (daily vs intermittent), dose (standard of care dosage level or down-titrated), or known polymorphisms like SPP1 [9] or LTBP4 [10] here in this early age range.
This study provides insight into the variation in DMD progression and the response of defined subgroups to specific pharmacological therapeutic regimens (glucocorticoids and vamorolone), as well as support for careful evaluation of clinical trial eligibility criteria. The impact of this study will be as an aid to 1) inclusion criteria refinement and enrichment strategies for clinical trials, 2) population stratification for pre-specified subgroup analyses in statistical analysis plans, and 3) individualized monitoring of clinical progression for patients with DMD.
ACKNOWLEDGMENTS
This work was funded by a Foundation to Eradicate Duchenne award. We thank TRiNDS LLC and the Cooperative International Neuromuscular Research Group (CINRG), including the CINRG DNHS and VBP15-002/003/LTE investigators, for the management and conduct of the CINRG DNHS and VBP15-002/003/LTE studies, as well as the participants in these studies, and their families.
CONFLICT OF INTEREST STATEMENT
UD received a Foundation to Eradicate Duchenne Award for this work (YF was funded through this grant) and receives consultancy funds from ReveraGen BioPharma on an ad-hoc basis. Dr Hoffman received salary as chief executive officer and owns stock from ReveraGen BioPharma, served as a board member for Therapeutic Research in Neuromuscular Disorders Solutions (TRiNDS), served as vice president and owns stock for AGADA BioSciences outside the submitted work; and owns a patent issued to ReveraGen BioPharma. Dr Clemens served as a board member for TRiNDS; received grants from the National Institutes of Health (NIH), NS Pharma, Amicus, Sanofi, Spark, and Muscular Dystrophy Association; received research support through a donation from the Foundation to Eradicate Duchenne to the University of Pittsburgh; and received personal fees from Epirium during the conduct of the study outside the submitted work. Dr McDonald received grants from the NIH National Institute of Arthritis and Musculoskeletal and Skin Diseases (NIAMS), US Department of Defense, National Institute on Disability Independent Living and Rehabilitation Research, and Parent Project Muscular Dystrophy and personal fees from Astellas, BioMarin, Epirium Bio (formerly Capricor), Catabasis, Entrada Therapeutics, Avidity Therapeutics, Edgewise Therapeutics, FibroGen, Hoffmann La Roche, Marathon, Pfizer, Santhera Pharmaceuticals, Sarepta Therapeutics, and PTC Therapeutics outside the submitted work. Dr Gordish-Dressman served as board president for TRiNDS and receiving personal fees from TRiNDS, AGADA Biosciences, Audentes Therapeutics, and SOLID Bioscience during the conduct of the study outside the submitted work. Other authors have no relevant disclosures for this analysis.
SUPPLEMENTARY MATERIAL
[1] The supplementary material is available in the electronic version of this article: https://dx.doi.org/10.3233/JND-221527.
REFERENCES
[1] | Hoffman EP , Brown RH , Kunkel LM Dystrophin: The protein product of the Duchenne muscular dystrophy locus. Cell. (1987) ;51: (6):919–28. https://doi.org/https://doi.org/10.1016/0092-8674(87)90579-4 |
[2] | Dadgar S , Wang Z , Johnston H , Kesari A , Nagaraju K , Chen YW , et al. Asynchronous remodeling is a driver of failed regeneration in Duchenne muscular dystrophy. J Cell Biol. (2014) ;207: (1):139–58. https://doi.org/10.1083/jcb.201402079 |
[3] | Desguerre I , Christov C , Mayer M , Zeller R , Becane HM , Bastuji-Garin S , et al. Clinical heterogeneity of Duchenne muscular dystrophy (DMD): Definition of sub-phenotypes and predictive criteria by long-term follow-up. PLoS One. (2009) ;4: (2). https://doi.org/10.1371/JOURNAL.PONE.0004347 |
[4] | Hoffman EP Causes of clinical variability in Duchenne and Becker muscular dystrophies and implications for exon skipping therapies. Acta Myologica. (2020) ;39: (4):179. https://doi.org/10.36185/2532-1900-020 |
[5] | Humbertclaude V , Hamroun D , Bezzou K , Bérard C , Boespflug-Tanguy O , Bommelaer C , et al. Motor and respiratory heterogeneity in Duchenne patients: Implication for clinical trials. European Journal of Paediatric Neurology. (2012) ;16: (2):149–60. https://doi.org/10.1016/J.EJPN.2011.07.001 |
[6] | Finkel RS , McDonald CM , Lee Sweeney H , Finanger E , Neil Knierbein E , Wagner KR , et al. A randomized, double-blind, placebo-controlled, global phase 3 study of edasalonexent in pediatric patients with Duchenne muscular dystrophy: Results of the PolarisDMD trial. J Neuromuscul Dis. (2021) ;8: (5):769. https://doi.org/10.3233/JND-210689 |
[7] | Muntoni F , Torelli S , Ferlini A Dystrophin and mutations: One gene, several proteins, multiple phenotypes. Lancet Neurol. (2003) ;2: (12):731–40. https://doi.org/10.1016/S1474-4422(03)00585-4 |
[8] | Bello L , Pegoraro E The “Usual Suspects”: Genes for inflammation, fibrosis, regeneration, and muscle strength modify Duchenne muscular dystrophy. J Clin Med. (2019) ;8: (5):731–40. https://doi.org/10.3390/JCM8050649 |
[9] | Pegoraro E , Hoffman EP , Piva L , Gavassini BF , Cagnin S , Ermani M , et al. SPP1 genotype is a determinant of disease severity in Duchenne muscular dystrophy. Neurology. (2011) ;76: (3):219–26. https://doi.org/10.1212/WNL.0b013e318207afeb |
[10] | Flanigan KM , Ceco E , Lamar KM , Kaminoh Y , Dunn DM , Mendell JR , et al. LTBP4 genotype predicts age of ambulatory loss in Duchenne muscular dystrophy Ann Neurol. (2013) ;73: (4):481–8. https://doi.org/10.1002/ana.23819 |
[11] | van den Bergen JC , Hiller M , Böhringer S , Vijfhuizen L , Ginjaar HB , Chaouch A , et al. Validation of genetic modifiers for Duchenne muscular dystrophy: A multicentre study assessing SPP1 and LTBP4 variants. J Neurol Neurosurg Psychiatry. (2015) ;86: (10):1060–5. https://doi.org/10.1136/jnnp-2014-308409 |
[12] | Bello L , Punetha J , Gordish-Dressman H , Giri M , Hoffman EP , Bello L , et al. Association study of exon variants in the NF-κB and TGFβ Pathways identifies CD40 as a modifier of Duchenne muscular dystrophy. Am J Hum Genet (2016) ;99: (5). https://doi.org/10.1016/j.ajhg.2016.08.023 |
[13] | Hogarth MW , Houweling PJ , Thomas KC , Gordish-Dressman H , Bello L , Pegoraro E , et al. Evidence for ACTN3 as a genetic modifier of Duchenne muscular dystrophy. Nat Commun. (2017) ;8: : 14143. https://doi.org/10.1038/ncomms14143 |
[14] | Hathout Y , Liang C , Ogundele M , Xu G , Tawalbeh SM , Dang UJ , et al. Disease-specific and glucocorticoid-responsive serum biomarkers for Duchenne muscular dystrophy. Sci Rep. (2019) ;9: (1):12167. https://doi.org/10.1038/s41598-019-48548-9 |
[15] | McDonald CM , Henricson EK , Abresch RT , Duong T , Joyce NC , Hu F , et al. Long-term effects of glucocorticoids on function, quality of life, and survival in patients with Duchenne muscular dystrophy: A prospective cohort study. The Lancet. (2018) ;391: (10119):451–61. https://doi.org/10.1016/S0140-6736(17)32160-8 |
[16] | Mercuri E , Signorovitch JE , Swallow E , Song J , Ward SJ , Pane M , et al. Categorizing natural history trajectories of ambulatory function measured by the 6-minute walk distance in patients with Duchenne muscular dystrophy. Jefferies JL, editor. Neuromuscul Disord. (2016) ;26: (5):576–83. https://doi.org/10.1002/14651858.CD003725. pub4 |
[17] | Muntoni F , Domingos J , Manzur AY , Mayhew A , Guglieri M Network TUKN et al. Categorising trajectories and individual item changes of the North Star Ambulatory Assessment in patients with Duchenne muscular dystrophy. PLoS One. (2019) ;14: (9):e0221097–e0221097. https://doi.org/10.1371/journal.pone.0221097 |
[18] | Dang UJ , Ziemba M , Clemens PR , Hathout Y , Conklin LS , Hoffman EP Serum biomarkers associated with baseline clinical severity in young steroid-naïve Duchenne muscular dystrophy boys. Hum Mol Genet (2020) 29: (15), 2481–95. https://doi.org/10.1093/hmg/ddaa132 |
[19] | U.S. Food and Drug Administration. Duchenne muscular dystrophy and related dystrophinopathies: Developing drugs for treatment. Guidance for industry [Internet]. |
[20] | Conklin LS , Damsker JM , Hoffman EP , Jusko WJ , Mavroudis PD , Schwartz BD , et al Phase IIa trial in Duchenne muscular dystrophy shows vamorolone is a first-in-class dissociative steroidal anti-inflammatory drug. Pharmacol Res. (2018) ;136: : 140–50. https://doi.org/10.1016/j.phrs.2018.09.007 |
[21] | Hoffman EP , Schwartz BD , Mengle-Gaw LJ , Smith EC , Castro D , Mah JK , et al. Vamorolone trial in Duchenne muscular dystrophy shows dose-related improvement of muscle function. Neurology. (2019) ;93: (13):e1312–23. https://doi.org/10.1212/WNL.0000000000008168 |
[22] | Smith EC , Conklin LS , Hoffman EP , Clemens PR , Mah JK , Finkel RS , et al. Efficacy and safety of vamorolone in Duchenne muscular dystrophy: An 18-month interim analysis of a non-randomized open-label extension study. PLoS Med (2020) 17: (9), e1003222. https://doi.org/10.1371/journal.pmed.1003222 |
[23] | Mah JK , Clemens PR , Guglieri M , Smith EC , Finkel RS , Tulinius M , et al. Efficacy and safety of vamorolone in Duchenne muscular dystrophy: A 30-month nonrandomized controlled open-label extension trial. JAMA Netw Open. (2022) ;5: (1):e2144178–e2144178. https://doi.org/10.1001/JAMANETWORKOPEN.2021.44178 |
[24] | Guglieri M , Clemens PR , Perlman SJ , Smith EC , Horrocks I , Finkel RS , et al. Efficacy and safety of vamorolone vs placebo and prednisone among boys with duchenne muscular dystrophy: A randomized clinical trial. JAMA Neurol. 2022. https://doi.org/10.1001/JAMANEUROL.2022 2480 |
[25] | Guglieri M , Bushby K , McDermott MP , Hart KA , Tawil R , Martens WB , et al. Effect of different corticosteroid dosing regimens on clinical outcomes in boys with duchenne muscular dystrophy: A randomized clinical trial. JAMA. (2022) ;327: (15):1456–68. https://doi.org/10.1001/JAMA.2022.4315 |
[26] | Gloss D , Moxley RT , Ashwal S , Oskoui M Practice guideline update summary: Corticosteroid treatment of Duchenne muscular dystrophy. Neurology. (2016) ;86: (5):465LP–72. https://doi.org/10.1212/WNL.0000000000002337 |
[27] | Matthews E , Brassington R , Kuntzer T , Jichi F , Manzur AY Corticosteroids for the treatment of Duchenne muscular dystrophy. Cochrane Database of Systematic Reviews. (2016) ;(5). https://doi.org/10.1002/14651858.CD003725.pub4 |
[28] | Connolly AM , Zaidman CM , Golumbek PT , Cradock MM , Flanigan KM , Kuntz NL , et al. Twice-weekly glucocorticosteroids in infants and young boys with Duchenne muscular dystrophy. Muscle Nerve. (2019) ;59: (6):650–7. https://doi.org/10.1002/MUS.26441 |
[29] | Schwarz G Estimating the dimension of a model. The Annals of Statistics. 1978;461-4. |
[30] | Stimpson G , Raquq S , Chesshyre M , Fewtrell M , Ridout D , Sarkozy A , et al. Growth pattern trajectories in boys with Duchenne muscular dystrophy. Orphanet J Rare Dis. (2022) ;17: (1):20. https://doi.org/10.1186/S13023-021-02158-9 |
[31] | Chesshyre M , Ridout D , Hashimoto Y , Ookubo Y , Torelli S , Maresh K , et al. Investigating the role of dystrophin isoform deficiency in motor function in Duchenne muscular dystrophy. J Cachexia Sarcopenia Muscle. (2022) ;13: (2):1360. https://doi.org/10.1002/JCSM.12914 |
[32] | Proust-Lima C , Philipps V , Liquet B Estimation of extended mixed models using latent classes and latent processes: The R package lcmm. J Stat Softw (2017) 78: (2), 1–56. https://doi.org/10.18637/jss.v078.i02 |
[33] | Wickham H ggplot2: Elegant graphics for data analysis. Springer-Verlag New York. Springer; (2016) . https://doi.org/10.1007/978-0-387-98141-3 |
[34] | R Core Team A Language and Environment for Statistical Computing [Internet]. Vienna, Austria; 2020. |
[35] | Lingineni K , Aggarwal V , Morales JF , Conrado DJ , Corey D , Vong C , et al. Development of a model-based clinical trial simulation platform to optimize the design of clinical trials for Duchenne muscular dystrophy. CPT Pharmacometrics Syst Pharmacol. (2022) ;11: (3):318–32. https://doi.org/10.1002/PSP4.12753 |
[36] | U.S. Food and Drug Administration. Enrichment Strategies for Clinical Trials to Support Approval of Human Drugs and Biological Products. Guidance for Industry. [Internet].[cited 2022 Sep 26]. |
[37] | McDonald CM , Campbell C , Torricelli RE , Finkel RS , Flanigan KM , Goemans N , et al. Ataluren in patients with nonsense mutation Duchenne muscular dystrophy (ACT DMD): A multicentre, randomised, double-blind, placebo-controlled, phase 3 trial. The Lancet. (2017) 390: (10101):1489–98. https://doi.org/10.1016/S0140-6736(17)31611-2 |
[38] | Campbell C , Barohn RJ , Bertini E , Chabrol B , Comi pietro G , Darras BT , et al. Meta-analyses of ataluren randomized controlled trials in nonsense mutation Duchenne muscular dystrophy. J Comp Eff Res. (2020) ;9: (14):973–84. https://doi.org/10.2217/cer-2020-0095 |
[39] | Goemans N , Mercuri E , Belousova E , Komaki H , Dubrovsky A , McDonald CM , et al. A randomized placebo-controlled phase 3 trial of an antisense oligonucleotide, drisapersen, in Duchenne muscular dystrophy. Neuromuscular Disorders. (2018) ;28: (1):4–15. https://doi.org/10.1016/j.nmd.2017.10.004 |


