
Early Changes in Skeletal Muscle of Young C22 Mice, A Model of Charcot-Marie-Tooth 1A
Abstract
Background:
The C22 mouse is a Charcot-Marie-Tooth 1A transgenic model with minimal axonal loss.
Objective:
To analyse early skeletal muscle changes resulting from this dysmyelinating neuropathy.
Methods:
Histology of tibialis anterior muscles of C22 mice and wild type litter mate controls for morphometric analysis and (immuno-)histochemistry for known denervation markers and candidate proteins identified by representational difference analysis (RDA) based on mRNA from the same muscles; quantitative PCR and Western blotting for confirmation of RDA findings.
Results:
At age 10 days, morphometry was not different between groups, while at 21 days, C22 showed significantly more small diameter fibres, indicating the onset of atrophy at an age when weakness becomes detectable. Neither (immuno-)histochemistry nor RDA detected extrajunctional expression of acetylcholine receptors by age 10 and 21 days, respectively. RDA identified some mRNA up-regulated in C22 muscles, among them at 10 days, prior to detectable weakness or atrophy, integral membrane protein 2a (Itm2a), eukaryotic initiation factor 2, subunit 2 (Eif2s2) and cytoplasmic phosphatidylinositol transfer protein 1 (Pitpnc1). However, qPCR failed to measure significant differences. In contrast, Itm2a and Eif2s2 mRNA were significantly down-regulated comparing 21 versus 10 days of age in both groups, C22 and controls. Western blotting confirmed significant down-regulation of ITM2A protein in C22 only.
Conclusion:
Denervation-like changes in this model develop slowly with onset of atrophy and weakness at about three weeks of age, before detection of extrajunctional acetylcholine receptors. Altered Itm2a expression seems to begin early as an increase, but becomes distinct as a decrease later.
INTRODUCTION
The C22 mouse is a model of human Charcot-Marie-Tooth disease 1A (CMT 1A) that results from duplication of the PMP22 gene. It carries 7 copies of the human PMP22 gene in addition to its normal murine Pmp22 genes [1] on a C57BL/6J background. It shows a severe dysmyelinating neuropathy readily detectable at the 4th postnatal day in nerve pathology and by observable weakness about the third week of life. The latter is demonstrated by a splaying of the hind limbs when the mouse is lifted by its tail. However, like various other CMT mouse models, it deviates critically from the human disorder in the aspect of axonal loss. While CMT 1A patients suffer severe axonal loss during early adult life, neuropathological analysis of C22 nerves show severe dysmyelination (42%dysmyelinated fibres, g ratio of appr. 0.8), but no signs of axonal loss up to 18 months of age, when it has long developed severe weakness [2].
The early response of skeletal muscle to denervation, as characterised mostly by neurotomy experiments, develops in the following sequence: the resting membrane potential decreases after 3 to 6 hours, after > 24 hours areas of extrajunctional membrane sensitive to acetylcholine appear [3], then spread, due to extrajunctional expression of acetylcholine receptors (AChR) [4]. Within a few days a severe loss of muscle fibre cross-sectional area, i.e. atrophy, and changes in the ultrastructural morphology follow [5]. This is denervation in the strict sense, the reaction of skeletal muscle fibres to the actual loss of contact with their motoneuron. However, other ways to inhibit the lower motoneurons’ interaction with the muscle fibres, e.g. by block of nerve conduction, axonal transport or acetylcholin release or receptibility, respectively, have been the subject of numerous investigations. Their results indicate that synaptic contact dominates the trophic interactions between motoneuron and fibres in mature muscle [6]. Blocking the various aspects of the motoneuron’s activity without loss of synaptic contact leads to a pathology very similar to that caused by neurotomy, yet generally less severe, slower to develop and with subtle differences depending on the method used [7]. This pathology has been described as “denervation-like changes” [6, 8]. While most of these studies required application of neurotoxic substances or invasive procedures, the C22 model creates a situation with an “innervation deficit” without loss of synaptic contact, without the influence of products of neuronal degeneration or experimental tissue damage and –in young mice –without manifest weakness. The C22 mouse therefore seems ideal to study the effect of such “functional denervation” on the skeletal muscle. We investigated the early changes in tibialis anterior muscles of young C22 mice in comparison to their wild-type littermates. We selected one sample group at 10 postnatal days, before the onset of weakness, and a second at 21 days, i.e. at the onset of weakness but before the onset of macroscopic atrophy and behavioural differences. Three-month-old female breeders were used additionally to gain some reference points on later development in these mice.
In addition to morphometric and histochemical investigations, we used representional difference analysis (RDA) [9], a mRNA comparison technique, to search for new aspects of early skeletal muscle changes due to insufficient motoneuronal activity, preferably without a known connection to the above-mentioned well-described sequence
MATERIAL AND METHODS
Samples used
Human muscle
Residual material of a diagnostic muscle biopsy performed and investigated in our clinic was used. The patient had indicated previously in the written consent for biopsy work-up, that such scientific use was agreed once the diagnostic procedures were completed. Both, the written consent and the procedures used in the present study were approved by the local Ethic Committee (Ethikkommission an der Medizinischen Fakultät der Rheinischen Friedrich-Wilhelms-Universität Bonn; 069/03, 070/03 and 085/16). No procedure on humans was performed specifically for this study.
Muscle specimen was obtained by standard open biopsy during diagnostic work-up for neuromuscular complaints, in this case a vastus lateralis sample obtained as a diagnostic biopsy from an adult male caucasian patient complaining of muscle symptoms but ultimately deemed to be free of neuromuscular disease. The muscle was frozen in melting isopentane and stored in liquid nitrogen.
Mouse muscle
As male C22 do not breed well, female C22 mice, kindly provided by Clare Huxley, were transferred from the Division of Biomedical Sciences, Imperial College, London, UK, and inbred with inbred C57BL/6J (Harlan Winkelmann, Borchen, Germany) in the animal facility of the University of Bonn Medical Centre (Haus für Experimentelle Therapie). All mice were then housed in this institutional animal facility where all animal handling, husbandry and further procedures were performed under the supervision and with the approval of the local animal care and use committee with the head veterinarian as animal welfare officer in accordance with institutional and international guidelines (Federation of European Laboratory Animal Science Associations) and the national law. The need for further approvals was waived as the national law (Tierschutzgesetz, §7) does not regard the breeding and killing of animals for the removal of organs or tissues for research in the absence of further procedures on the living animal as an animal experiment, unless their very phenotype leads to suffering.
The mice had ad libitum access to water and standard mouse chow. They were maintained at a constant temperature of 22°C in rooms with a 12-hour light/dark cycle. Mice were killed by decapitation at the age of 10 and by cervical dislocation at the ages 21 days and three months, respectively. Distal muscles are considered to be more affected by neuropathic conditions in which nerve conduction is disturbed as a length-dependent process. We therefore sought a well-defined distal muscle to sample. Soleus muscles of the young mice were of too small volumes, therefore tibialis anterior (TA) muscles were used. TA muscles were removed and either frozen in melting isopentane and then transferred to liquid nitrogen for histological analysis or snap frozen in liquid nitrogen for mRNA or protein extraction. DNA was extracted from tail snips and transgene status and gender [10] determined by PCR (primer sequences in supplementary Table S2). Wild type litter mates of the C22 offspring were used as controls throughout. In preparing the muscles from litters, left and right TA were used alternatingly for protein/ mRNA extraction or histology. However, this was done before genotyping, therefore distribution of left and right side muscles in groups was random. The same applied to gender with the exception of the 3-month-old mice, which were female breeders of the litters used at 10 and 21 days exclusively. This last group was used only as additional reference for the changes found in the younger age groups. The individual muscles used for the RDA were from female mice to avoid selecting gender differences, in particular due to Y-chromosomal transcripts.
Histology
Myofibre preparations
Isolation of myofibre bundles/ single fibres was performed by manual separation of longitudinally cuts of mouse TA muscle or biopsy sample in ‘relaxation solution’ [11]. The fibres were then dried on glass slides, fixed and stained the same way as the cryostat sections (s. below).
Immunohistochemistry (IHC)
Transverse cryosections were cut at 6μm thickness and transferred onto silaned glass slides. In the cases were mouse antibodies had to be used on mouse tissue, frozen sections were dried at 37°C, fixed with acetone for 5 minutes at –20°C, air dried and then blocked for 30 minutes with 10%normal goat serum. To block endogenous mouse IgG, they were incubated with unconjugated AffiniPure goat-anti-mouse Fab fragments (Jackson ImmunoResearch Europe, DIANOVA, Hamburg, Germany) diluted 1:10 in bovine serum albumin (BSA) for a minimum of 2 hours at 4°C. Then the sections were washed with phosphate buffered saline (PBS) solution and incubated over night at 4°C with the primary antibodies in PBS.
If no mouse-on-mouse situation had to be observed, sections were fixed in a 1:1 methanol acetone mixture for 5 minutes at –20°C, air dried and blocked for 30 minutes with 10%normal serum of the animals in which the secondary antibody was raised, washed in PBS and then incubated over night at 4°C with the primary antibodies diluted in PBS. After thorough washing with PBS, secondary antibodies diluted in PBS were applied for an hour at room temperature. In the mouse-on-mouse case, DyLight-594-conjugated AffiniPure goat-anti-mouse F(ab’)2 fragments (Jackson Immuno Research) were used. Following further washes with PBS, nuclei were stained by two minutes incubation in a solution of bisbenzimide (0.5 g/ml; Sigma-Aldrich Chemie, Taufkirchen, Germany) in PBS at room temperature prior to a final PBS wash. The sections were finally mounted in a Mowiol 4–88 (Calbiochem, Merck Chemicals, Schwalbach, Germany) and glycerol mix in pH 8.5 Tris buffer with 0.1%DABCO (1,4-Diazabicyclo(2,2,2)octane; Sigma-Aldrich).
For immunohistochemical analysis of integral membrane protein 2a (ITM2A) we used an affinity-purified polyclonal rabbit antiserum raised against the polypeptide CLTGKELRVVPQEKDG as produced and provided by Eurogentec (Liege, Belgium). The latter 15 amino acids are equivalent to AA 34-48 just C-terminal of the helical transmembrane stretch (AA 54-74) of mouse ITM2A protein according to UniProt (Q61500). All antibodies used are found in supplementary Table S1.
Histochemistry
Further histochemistry used Atto 565-fluorescent labelled phalloidin (Sigma-Aldrich) and FITC-conjugated α-bungarotoxin (α-BuTX; Molecular Probes, Life Technologies, Darmstadt, Germany). Sections were incubated for one hour at room temperature in 2 ng/μl FITC-conjugated α-BuTX prior to or 0.01μmol/l Atto 565-fluorescent labelled phalloidin in PBS after fixation with acetone (5 minutes at –20°C), which was then followed by immunostaining as described above.
Microscopy and image documentation
We used a Nikon H800 microscope (Nikon, Germany) with a SPOT FLEX 64 Mp Shifting Pixel CCD-camera (model #15.2, Diagnostic Instruments Inc., Visitron Systems GmbH, Germany) and SPOT software (version 4.6, Visitron Systems), as well as a Leica TCS NT confocal microscope with Leica confocal software (version 2.00, build 0871, Leica Microsystems, Germany).
Morphometric analysis
Muscle fibre diameters were measured according to the ‘lesser diameter’ technique [12] with Scion Image (Scion Corporation, Frederick, Maryland, USA) from anti-laminin immunostain image files at 40fold primary magnification for the 10 days and 21 days groups and at 20fold primary magnification for the 3 months group. Muscle fibre diameters of more than 500 fibres from four or more muscles were measured per group (details in Table 1). For statistical analysis Kruskal-Wallis One Way Analysis of Variance on ranks was followed by Dunn’s All Pairwise Multiple Comparison procedure for the 10 days and 21 days groups. The 3 months groups were tested by Mann-Whitney Rank Sum Test as data was not normally distributed.
Table 1
Morphometric parameters
| Group | 10dC22 | 10dco | 21dC22 | 21dco | 3mC22 | 3mco |
| total fibres measured | 2,197 | 3,138 | 2,455 | 2,738 | 1,054 | 627 |
| individual muscles | 5 | 6 | 7 | 9 | 5 | 4 |
| median fibre diameter (μm) | 15.39 | 15.36 | 18.19* | 22.48 | 21.02** | 26.01 |
| fibre diameter range (μm) | 4.36–34.88 | 4.18–42.36 | 5.76–54.16 | 4.20–56.59 | 2.71–69.28 | 3.57–74.79 |
| nuclei per fibre profile mean | 0.73 | 0.79 | 0.77 | 0.87 | 0.90*** | 1.07 |
| fibres with internalised myonuclei (%) mean | 0.49 | 1.43 | 0.66 | 1.85 | 1.18 | 1.29 |
*statistically significant different in comparison to 21dco, p < 0.05 **statistically significant different in comparison to 3mco, p < 0.001 ***statistically significant different in comparison to 3mco, p < 0.05
Muscle fibre nuclei and muscle fibres were counted from five 10-day-old C22 (10dC22), six 10-day-old controls (10dco), seven 21-day-old C22 (21dC22), nine 21-day-old controls (21dco), five 3-month-old C22 (3mC22) and four 3-month-old controls (3mco).TA were analysed, assessing the number of fibres, number of nuclei in fibre profiles (as defined by anti-laminin immunohistochemistry) and number of nuclei in muscle fibre profiles not in a peripheral (i.e. subsarcolemmal) position. Such internalised and in particular central nuclei are considered a sign of immaturity and regeneration. For the young age groups (10dC22, 10dco, 21dC22 and 21dco) One Way Analysis of Variance followed by All Pairwise Multiple Comparison procedure were used for statistical testing of the resulting ratios of nuclei/ fibre profile and fibres with internalised myonuclei. As the data for the former ratio was normally distributed, but not for the latter, the former ANOVA was calculated with means and Tukey All Pairwise Multiple Comparison, while the latter was on ranks and used Dunn’s All Pairwise Multiple Comparison. Data from the 3-month-old groups were compared by t-tests.
For comparison between fluorescence stains on muscle sections from the four mouse groups 10dC22, 10dco, 21dC22 and 21dco, fixed exposure time and further settings were used acquiring the images. If modification steps with image software (Gimp 2.8 and Adobe Photoshop CS6, respectively) were necessary, these were applied to all the individual images compared to ensure identical treatment (details are given in the figure legends).
RNA based analysis
RNA extraction
Total RNA was extracted from whole muscle samples using Trizol reagent (Gibco Brl, Life Technologies), following the manufacturer’s protocol.
Representational Difference Analysis (RDA)
RDA was carried out as published [9], except for the use of SMART cDNA library construction kit (Clontech, BD Biosciences, Heidelberg, Germany) to build the initial cDNA library according to manufacturer’s protocol. RNA samples from the TA muscle of one female C22 mouse (for the tester) and one female control mouse (for the driver) at 10 days and 21 days of age, respectively, were used as the basis of the comparisons. Serial hybridisations were carried out at 1:100, 1:800 and finally 1:80,000 tester:driver ratios to select sequences only present in the tester, i.e. C22. The amplified products were cloned into TOPO (TOPO TA Cloning Kit (2.1 TOPO vector; Invitrogen, Life Technologies) and sequenced from these using a ABI PRISM 310 Genetic Analyzer (Applied Biosystems, Life Technologies) with BigDye Terminator v1.1 Cycle Sequencing Kit (Applied Biosystems).
Quantitative PCR (qPCR) and relative expression analysis
The cDNA from total RNA of individual TA muscles from the groups 10dC22, 10dco, 21dC22 and 21dco was synthesised with SuperScript III First-Strand Synthesis System for RT-PCR (Invitrogen) in accord with the manufacturer’s instructions. Then qPCR were performed on an iCycler Thermal Cycler using MyiQ Optical Module single colour detection (both Bio-Rad, Munich, Germany) with SYBR Green PCR Master Mix (Applied Biosystems) and analysed with MyiQ Optical Module software (Bio-Rad). Primers used for the individual candidates are listed in supplementray Tab S2.
All primer pairs were used after gel analysis and sequencing of test PCR products confirmed a correct, single product. Likewise, random qPCR products samples were controlled by agarose gel (Sigma-Aldrich) electrophoresis to ensure that they amplified indeed a single product of the desired size.
The cDNA samples from individual muscles were run at least in triplicate for each candidate and for Gapdh as housekeeper gene. The arithmetic means of their threshold cycle values determined by these qPCR for 25 10dC22 and 27 10dco as well as 25 21dC22 and 25 21dco TA and the triple measurements of serial cDNA dilutions for each PCR to determine its efficiency were analysed with Relative Expression Software Tool (REST) 2009 [13]. This software normalises the qPCR threshold cycle values by the efficiency of the individual PCR set-up and calculates the relative expression of the candidates in relation to the housekeeper. Pairwise fixed reallocation randomisation testing is used to detect statistical differences of the expressions between the groups, calculating p-values to determine significant differences. In this way the C22 samples in both age groups 10 days and 21 days were tested against respective controls. We then compared the 21 days controls and C22 with the respective 10 days groups in the same way to register changes during further growth and development. P-values were corrected for this repeated testing.
Protein based analysis
Protein extraction
Muscles were homogenized first mechanically with a fitted plastic pestle and then sonicated (500 W Cole-Parmer Ultrasonic Processor, Schwalbach, Germany) in lysis buffer (SDS (Merck), DTT, EGTA, EDTA, Bromphenol Blue (all Sigma-Aldrich) and Glycerol (Invitrogen) in Laemmli buffer (AppliChem, Darmstadt, Germany)), boiled for 15 minutes, centrifuged for 15 minutes at 13,000 rpm and the supernatant transferred under protease inhibition with Complete Mini Protease Inhibitor Cocktail tablets (PI; Roche; Roche Diagnostics, Mannheim, Germany) and 1μl phenylmethylsulfonyl fluoride (PMSF; Sigma-Aldrich). The total protein concentration was determination with Lowry Method using Total Protein Kit (Micro Lowry, Peterson’s Modification; Sigma-Aldrich) and a UV-2102 PC scanning spectrophotometer and cell positioner CPS 260 (Shimadzu Europa, Duisburg, Germany).
SDS-PAGE and western blotting
Protein extracts of 10μg for anti-GAPDH blotting and 25μg for all other antibodies in the 10 days and 21 days groups as well as 20μg for anti-ITM2A and 15μg for anti-PITPNC in the 3 months groups were separated by 15%SDS–PAGE under reducing conditions and transferred onto PVDF membrane with a pore size of 0.45μm (Immobilon-P; #IPVH00010; Merck Millipore, Germany) over night by wet-blotting method.
The membranes were blocked for 30 min with PBST (PBS with 0,1%Tween 20, Sigma-Aldrich) containing 5%milk powder for anti-PITPNC1 and anti-GAPDH, but with Roti-Block (Carl Roth, Karlsruhe, Germany; #A151.2) diluted 1:10 in the case of anti-ITM2A. Incubation with the primary antibody diluted in PBST in specific dilution (see supplementary Tab S1) for 2 h, washing with PBST, incubation with the secondary antibody diluted in PBST in the specific dilution at room temperature for one hour, washing with PBST and later with PBS followed. The membranes were incubated with the Super Signal West Dura Extended Duration Substrate (Thermo Fisher Scientific, Bonn, Germany) for 2 min in the case of anti-PITPNC1-antibody and anti-GAPDH-antibody or Super Signal West Pico Chemiluminescent Substrate (Thermo), for 5 min in the case of anti-ITM2A-antibody. Afterwards the membranes were placed on a radiographic film (Min-R 2000, Kodak) in a radiographic cassette (Kodak X-OMAT, Carestream Health, Stuttgart, Germany) over night. Next, the film was developed in the Kodak X-OMAT 1000 Processor. For quantification, the films were scanned and using Scion Image Software and a 20-step visual grey scale standard, we determined the individual bands’ density and normalised by GAPDH controls. Samples were analysed in triplicate and the arithmetic mean used for ANOVA and Tukey All Pairwise Multiple Comparison, testing samples from seven individual TA muscles from 10dco, 10dC22, 21dco and 21dC22, respectively. Likewise, samples from four 3mco and five 3mC22 TA were investigated, using Mann-Whitney Rank Sum Test for ITM2A and t-test for PITPNC, respectively, to compare these groups.
To test for phosphorylation of eIF2S2, we preincubated a sample of one of the 10dC22 TA with and one without the suspect additional band (see below) with 300 U of alkaline phosphatase for 30 minutes at room temperature prior to Western blotting as described above.
RESULTS
Immunohistochemistry and histochemistry for nicotinic acetylcholine receptor α-subunit localisation
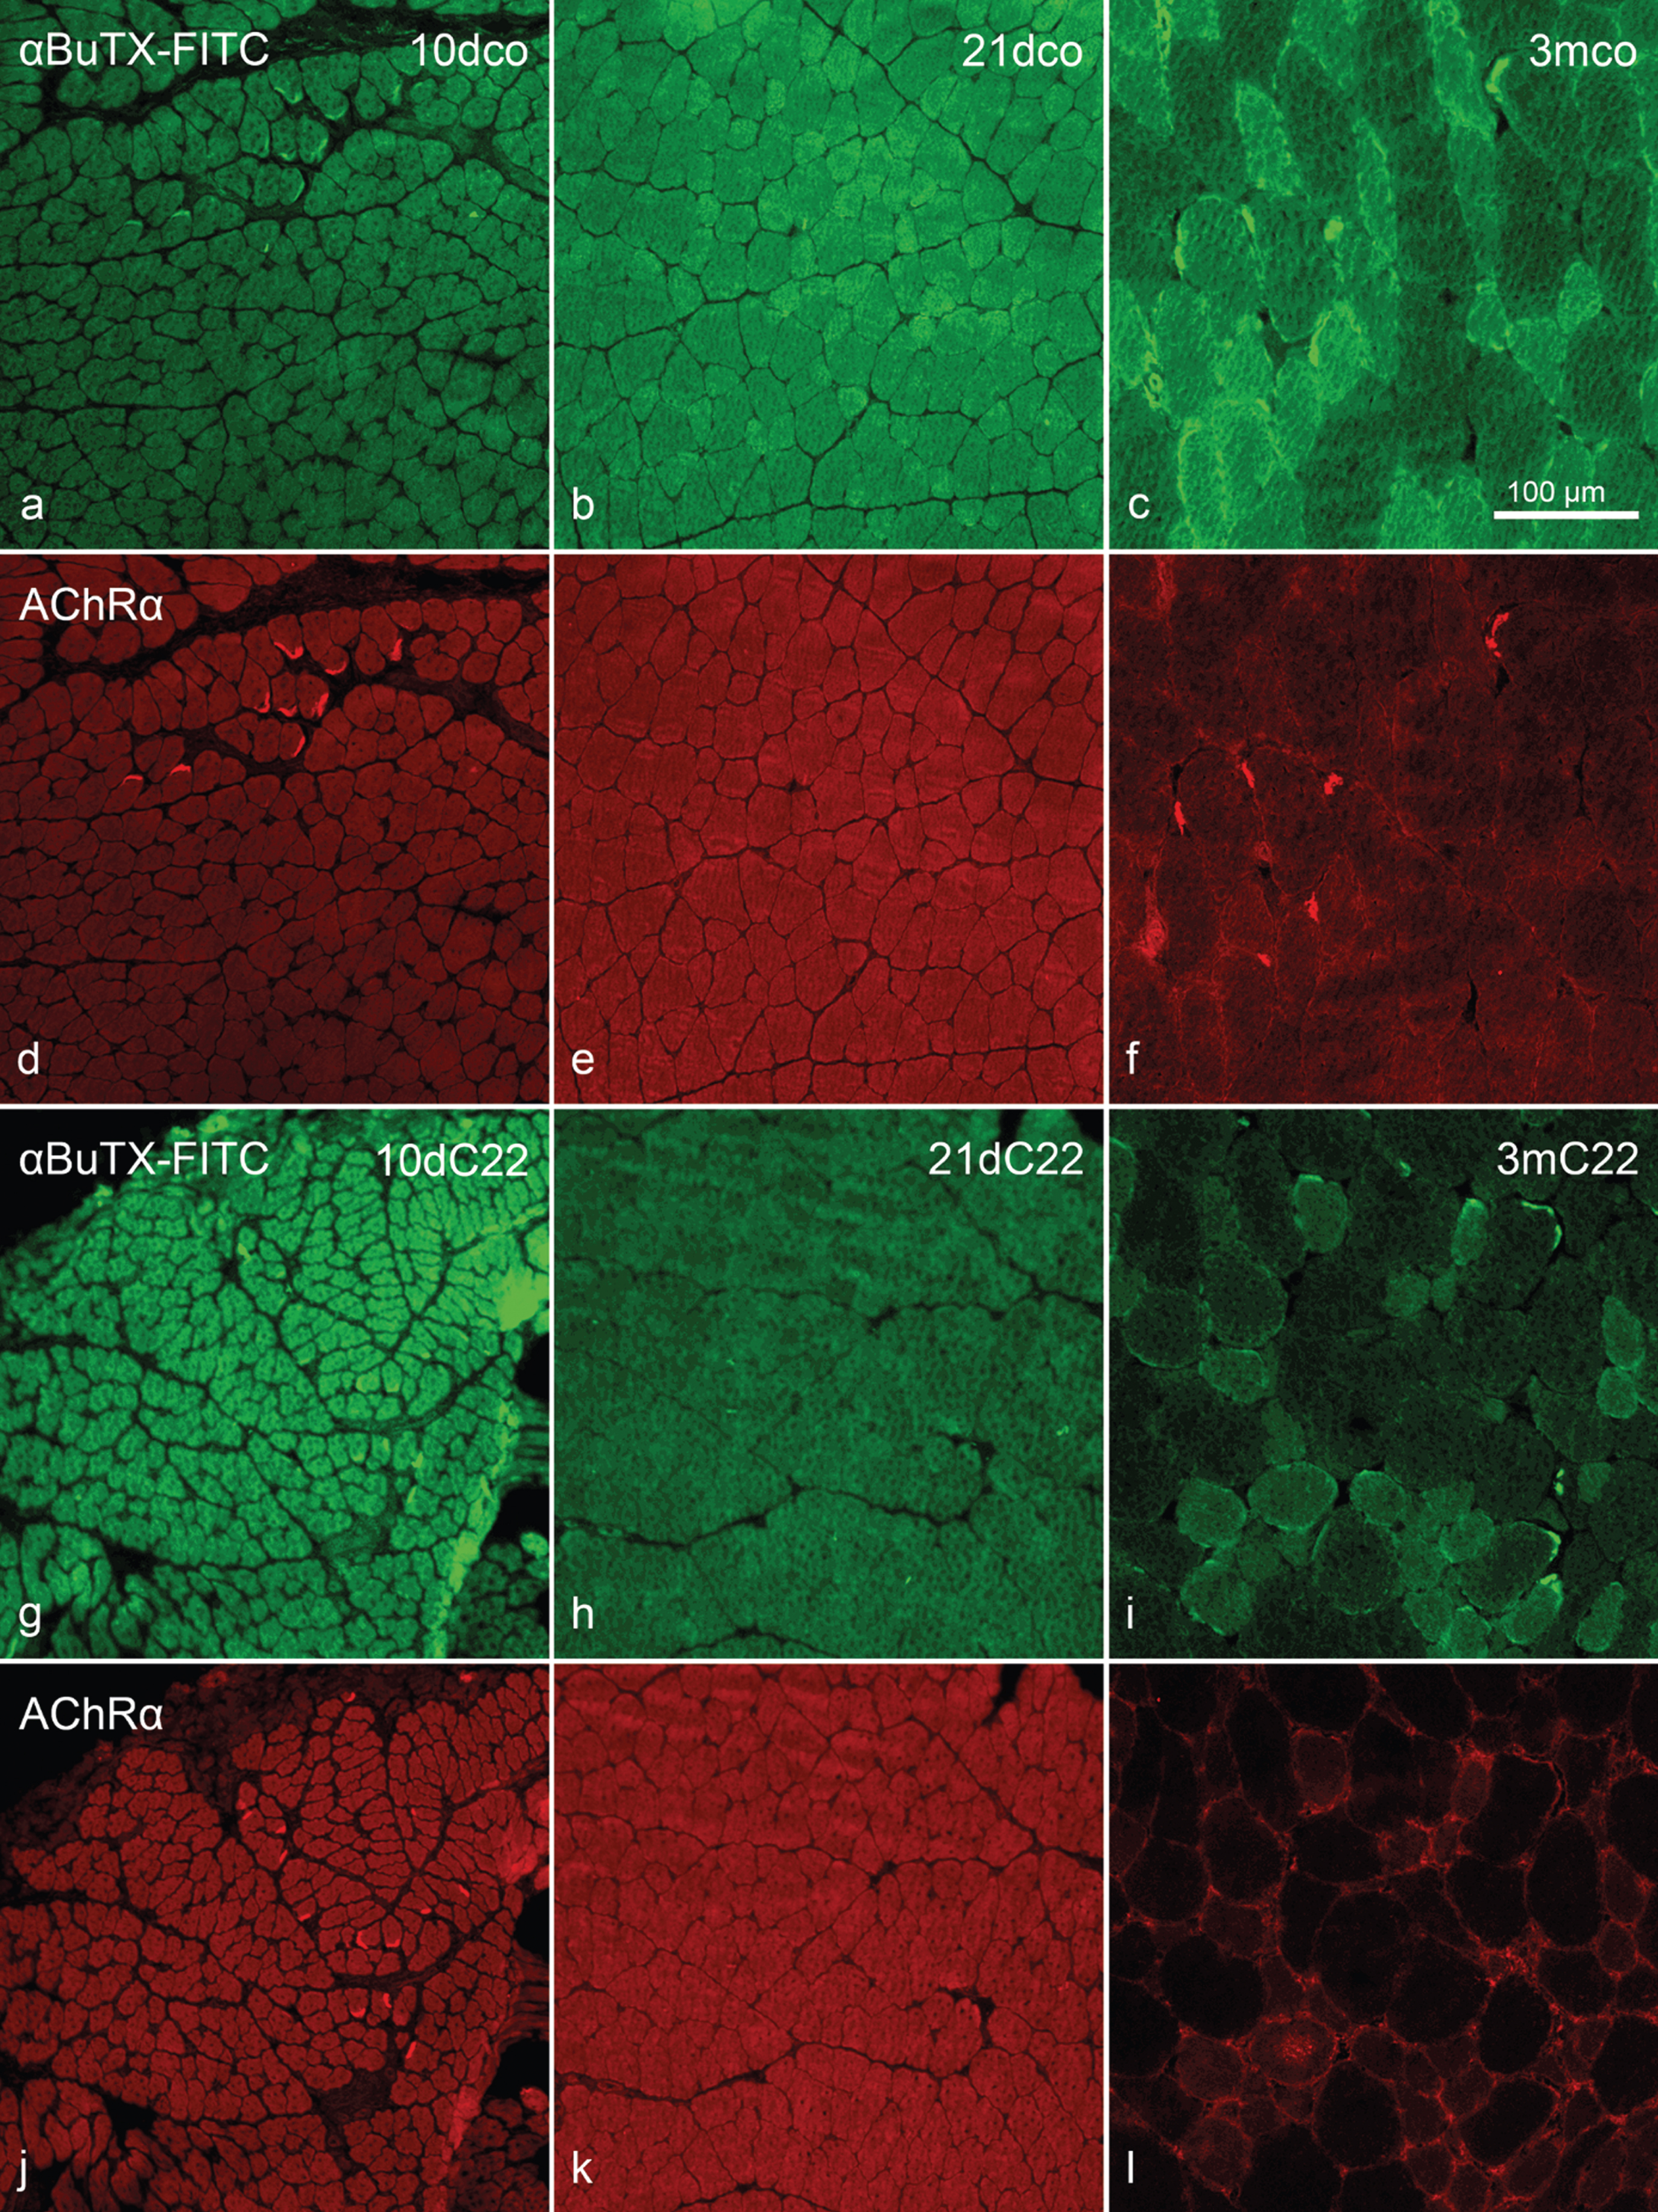
Using both, a monoclonal antibody against the AChR α-subunit and FITC-conjugated α-BuTX, we were unable to detect reactivity on the extrajunctional membrane areas of 10dco (n = 4 muscles), 10dC22 (n = 4), 21dco (n = 5), 21dC22 (n = 6) and 3mco (n = 3), respectively, while neuromuscular endplates always showed strong reactivity with both stains (Fig. 1). Only in the samples of 3mC22 (n = 5), we found fibres with reactivity along the transversely cut fibres’ circumference, clearly outside neuromuscular endplates. Interestingly, we found rare fibres with anti-AChRα reactivity within the fibres cross-sectional area (Fig. 1l).
Fig. 1
Detection of acetylcholine receptor α-subunit by (immuno)histochemistry. Double staining FITC-conjugated α-bungarotoxin (α-BuTX-FITC; a–c and g–i) and anti-acetylcholine receptor (α-subunit) (aAChRα; d–f and j–l). 10dco (a, d), 10dC22 (g, j), 21dco (b, e), 21dC22 (h, k), 3mco (c, f) and 3mC22 (i, l). Intense reactivity at neuromuscular endplates in a, c, d, f, g, i, j and l, but on extrajunctional sarcolemma only in l and –weaker –i. Note that while all images of a staining were acquired with identical exposure times, settings etc., further processing for presentation are identical between age groups only. This is due to changing background reactivity, in particular in the mouse-on-mouse situation, in the different ages. Primary magnification was 20fold, scale bar in (c) indicates 100μm for all images.
Morphometric analysis
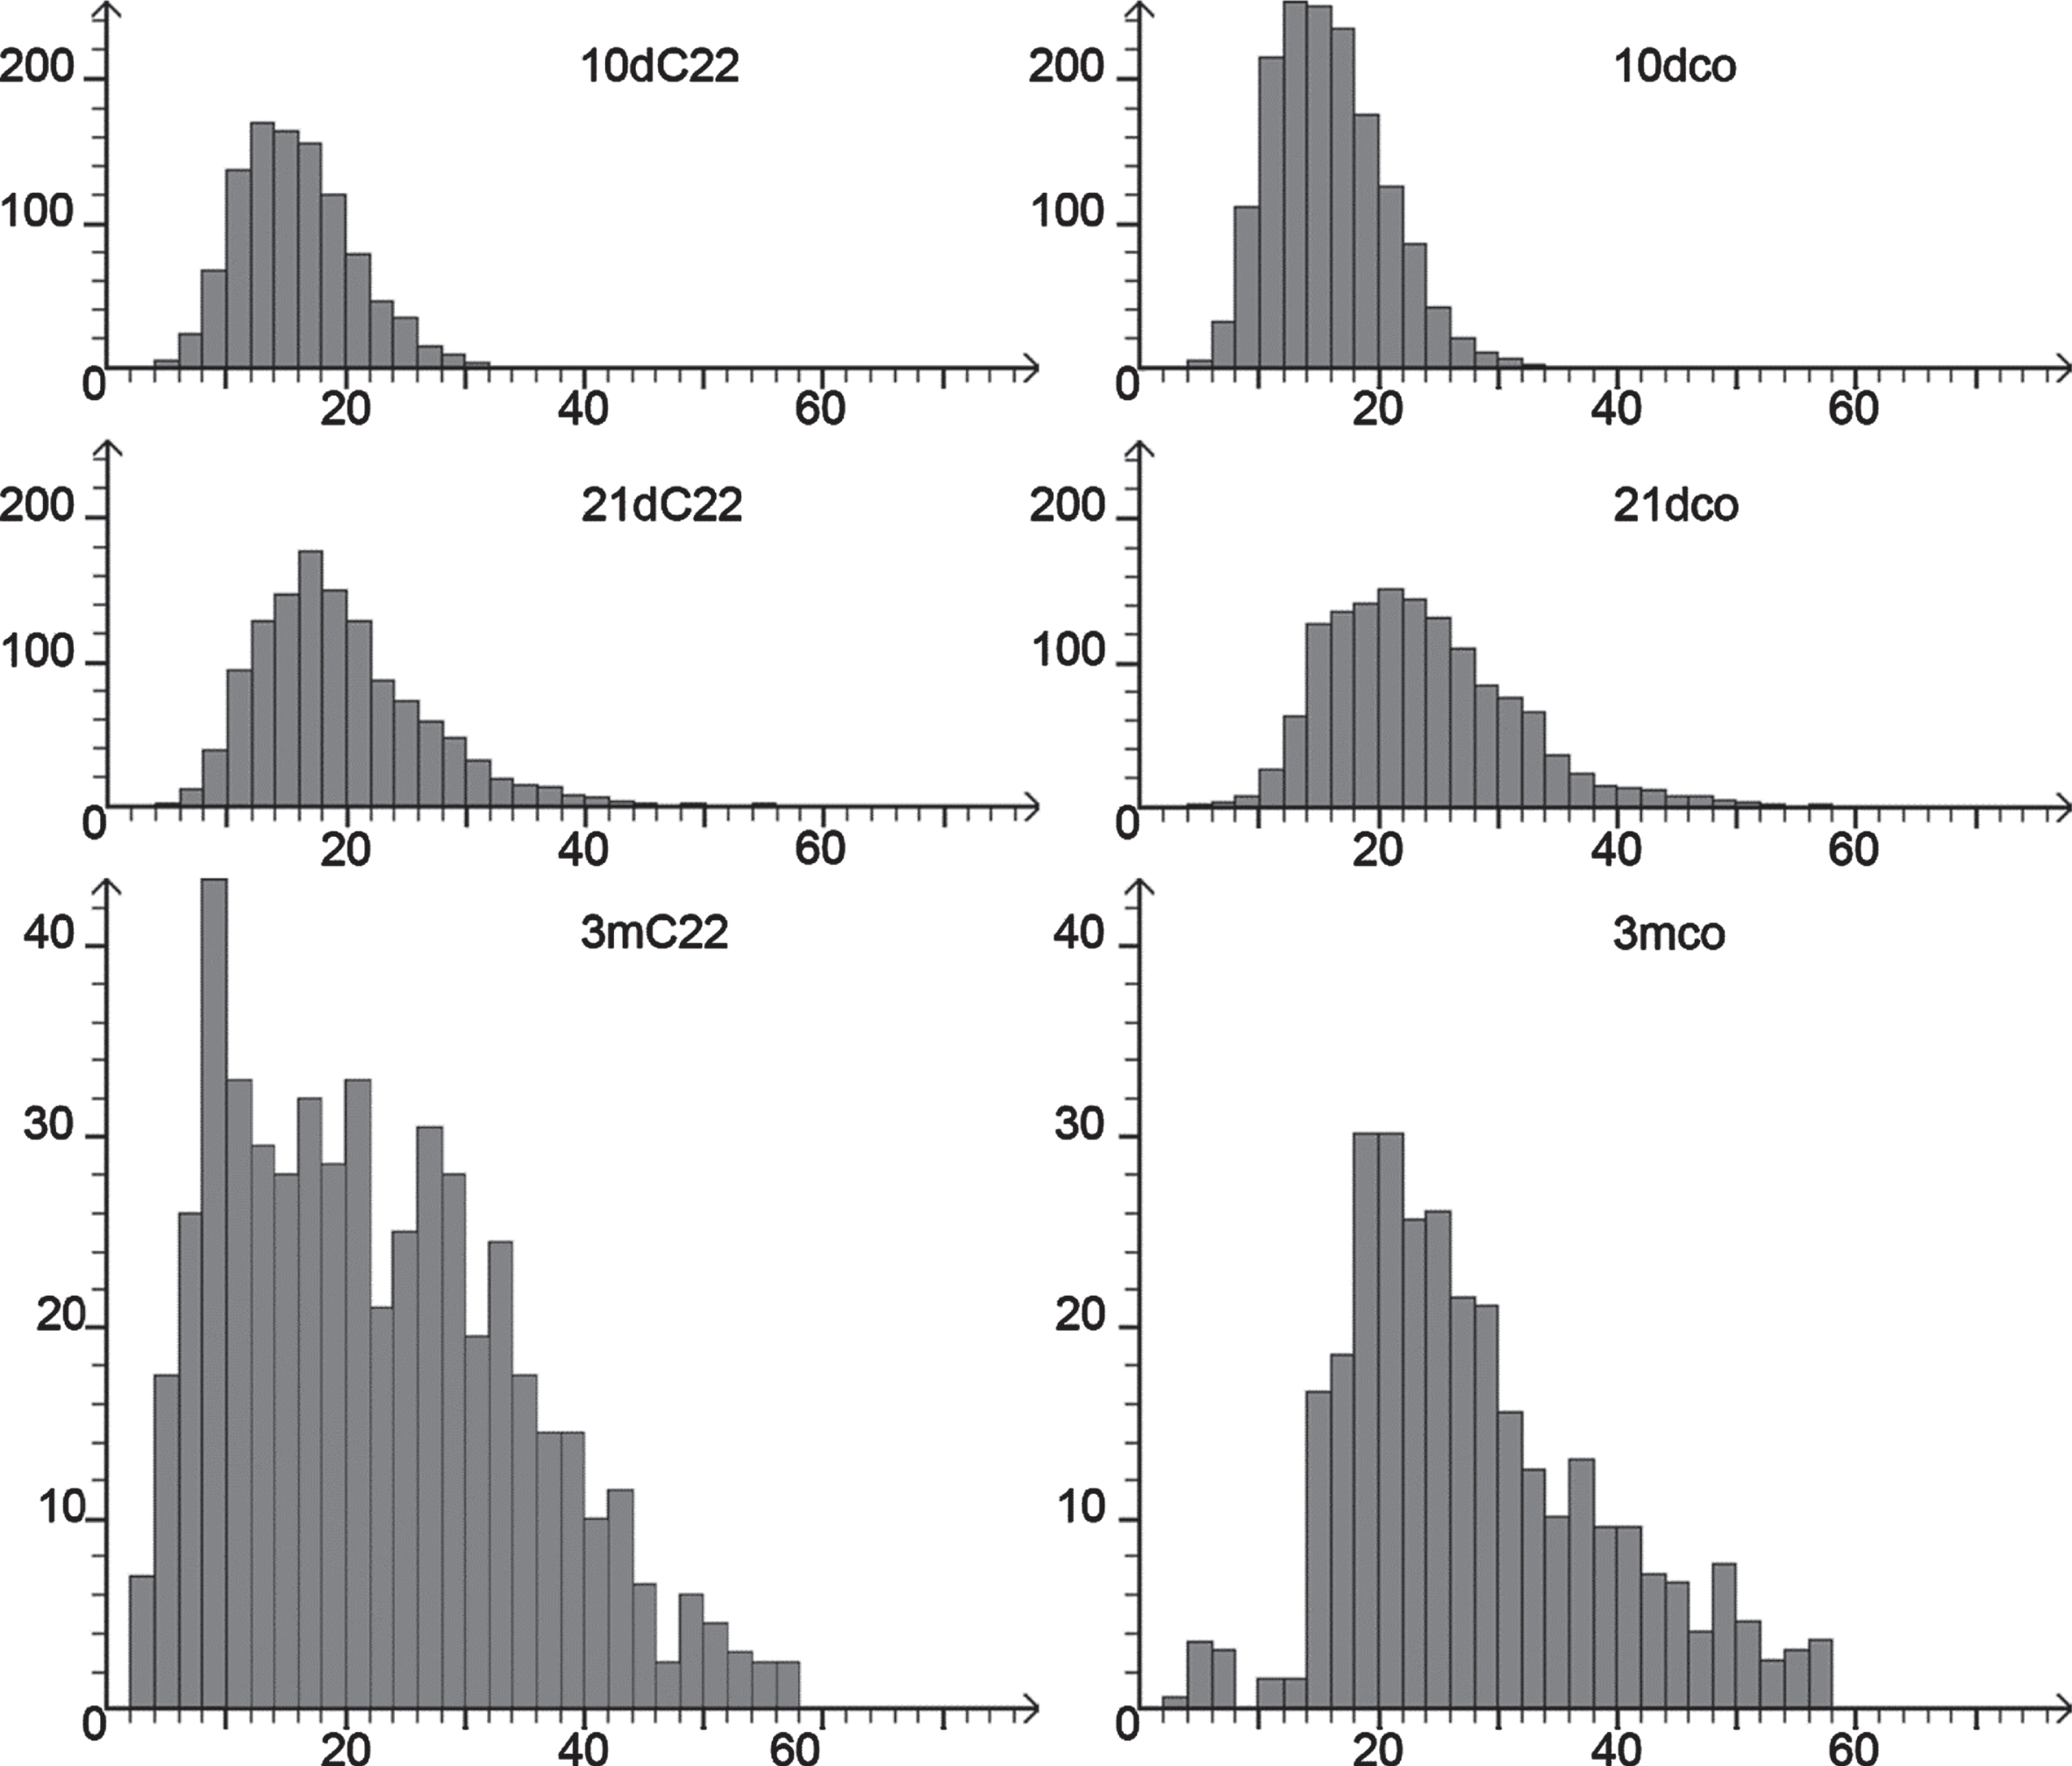
Comparison of macroscopic and microscopic gross morphology of TA showed no difference between the groups at 21 and 10 days, respectively. The presence of more atrophic fibres in 3-month-old C22 in comparison to 3-month-old controls could be identified on every section. In quantitative analysis, the only statistically significant difference within the young age groups was found in the ‘lesser diameter’ of the muscle fibres at the age of 21 days (Kruskal-Wallis one way ANOVA on ranks with Dunn’s all pairwise multiple comparison; p < 0.05), with smaller diameters in the C22 group, presumably indicating the onset of atrophy in the 21 days group. Fibre diameters in the 10 days groups were not different, neither were the number of nuclei per fibre profile nor the number of internalised myonuclei in these two age groups. The increase of muscle fibre size in postnatal growth of the mice was detected easily, but no pathologically high or increasing rate of internalised/ central nuclei found. In the 3 months age group, Mann-Whitney Rank Sum Test indicated a statistically significant difference in the fibre diameters with the 3mC22 mice showing the smaller median diameter. There was no statistically significant difference for the number of fibres with internalised myonuclei. This number of fibres with internalised myonuclei was not increased in either group. However, the number of nulei per fibre profile was statistically significant different with a lower mean in the 3mC22. For details see Table 1 and fibre size histograms in Fig. 2.
Fig. 2
Fibre diameter histograms. Fibre diameter histograms of (from top to bottom) 10 days, 21 days and 3 months. C22 on the left, controls on the right. Note difference in Y-axis scale for the 3 months groups that include fewer fibres.
Representatial difference analysis
Basic Local Alignment Search Tool (BLAST; http://blast.ncbi.nlm.nih.gov/Blast.cgi) searches of RDA selected sequence fragments identified nine gene transcripts from the 10-day-old mice and five from the 21-day-old mice, listed in Table 2. From these we selected integral membrane protein 2a (Itm2a), eukaryontic translation initiation factor 2 beta (Eif2s2) and cytoplasmic phosphatidylinositol transfer protein 1 (Pitpnc1) for further analysis. This selection was based on the strength of the RDA results, i.e. when multiple fragments of a sequence were identified, and the fact that at the time we found no data linking these candidates to denervation and very little data on their role in skeletal muscle at all [14].
Table 2
cDNA identified from RDA amplified sequence fragments
| cDNA BLAST-identified | Accession | age group |
| actinin alpha 2 (Actn2) | NM_033268 | 10 days |
| cofilin 1, non-muscle | BC058726 | 10 days |
| CUB and zona pellucida-like domains 1 (Cuzd1) | NM_008411 | 10 days |
| phosphatidylinositol transfer protein, cytoplasmic 1 (Pitpnc1) | BC082333 | 10 days |
| translation initiation factor 2, subunit 2 (Eif2s2) | NM_026030 | 10 days |
| integral membrane protein 2A (Itm2a) | NM_008409 | 10 days |
| myostatin (Gdf8) | NM_010834 | 10 days |
| NADH dehydrogenase (ubiquinone) 1 beta subcomplex, 11 | NM_019435 | 10 days |
| 18-day embryo whole body cDNA, RIKEN full-length enriched library, clone:1100001I18 product:tropomyosin 2, beta, full insert sequence. | AK003175 | 10 days |
| mesencephalic astrocyte-derived neurotrophic factor (Manf) | NM_029103 | 21 days |
| Similar to cytochrome c oxidase III | BC012020 | 21 days |
| 13 days embryo heart cDNA, RIKEN full-length enriched library, clone:D330008P16 product: hypothetical EPSP synthase (3-phosphoshikimate 1-carboxyvinyltransferase)/Short-chain dehydro-genase/reductase (SDR) superfamily containing protein | AK052209 | 21 days |
| tropomyosin 1, alpha (Tpm1), transcript variant Tpm1.6 | NM_024427 | 21 days |
| ubiquitin A-52 residue ribosomal protein fusion product 1 | BC054413 | 21 days |
qPCR
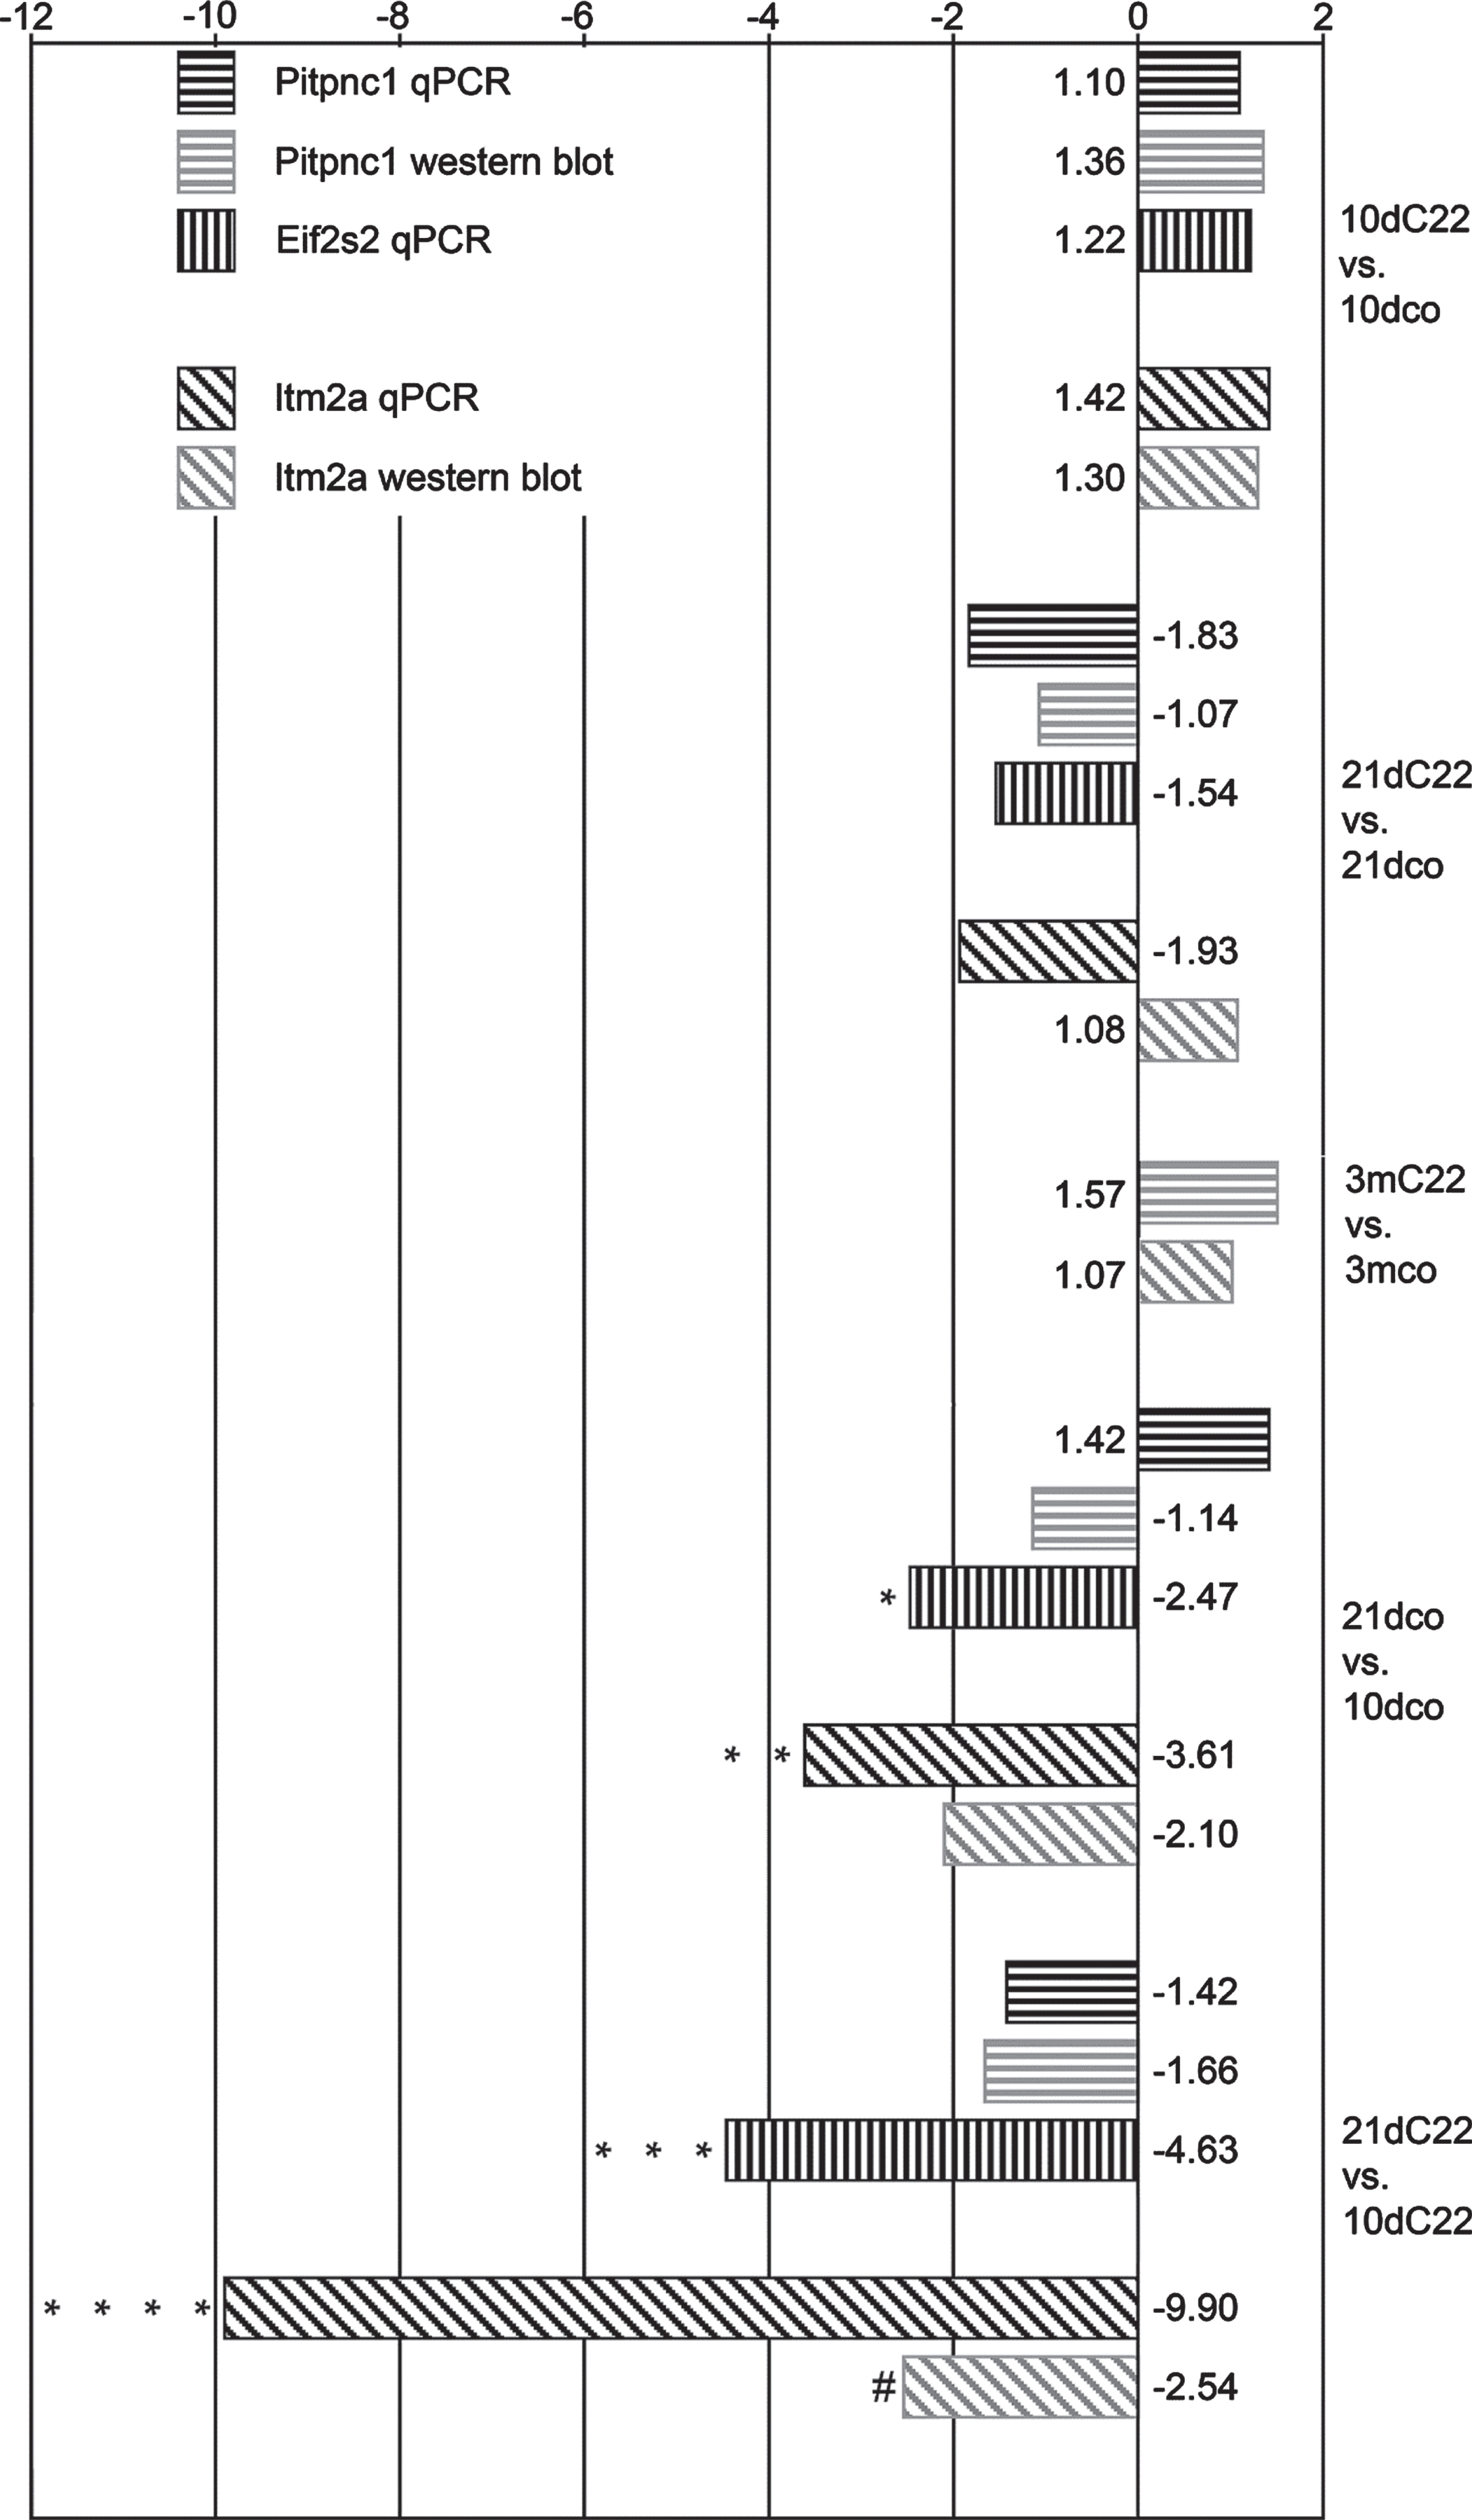
Analysis of qPCR measurements with REST 2009 software [13] confirmed up-regulation of all three selected mRNA in the 10dC22. However, the factors involved were all below two-fold and without statistical significance. All three mRNA were down-regulated in 21dC22 mice, again without reaching statistical significance. To look further into the changes between the two ages selected, we again used REST 2009 software to compare the 21-day-old with the 10-day-old within the groups. Pitpnc1 was non-significantly up-regulated in 21dco in comparison to 10dco and non-significantly down-regulated in 21dC22 in comparison to 10dC22. In contrast, statistically significant down-regulation was found for both Itm2a and Eif2s2 in the 21-day-old mice in controls as well as C22. For C22 this reached a down-regulation of more than 9-fold for Itm2a. Details can be found in Fig. 3.
Fig. 3
Relative expression of candidate sequences by qPCR and western blot. Column diagram of x-fold up- and down-regulations of Pitpnc1, Eif2s2 and Itm2a, respectively, for qPCR (black) and western blot (PITPNC1 and ITM2A; grey), in the comparisons between the experimental groups (C22 vs. control, upper half) and age groups (21d vs. 10d, lower half). Differences found statistically significant –after appropriate corrections for repeat testing –are marked: * p = 0.046; ** p = 0.008, *** p = 0.006, **** p < 0.001, # p = 0.045.
Western blotting
Confirmation of the effects found for mRNA regulation was sought by Western blot analysis. The up- and down-regulations found in qPCR result comparison were detected here as well with the exceptions of the down-regulation of ITM2A in the comparison of 21dC22 with 21dco and the up-regulation of PITPNC1 in the comparison of 21dco with 10dco. However, the only regulation reaching statistical significance here was the down-regulation of ITM2A in the comparison of 21dC22 with 10dC22 (details in Fig. 3). No statistically significant differences were found between the 3-month-old C22 and controls. We had to abandon quantitative comparison of eIF2S2 (frequently referred to as eIF2β) Western blots when we discovered a strong approximately 55 kDa band in addition to the main approximately 50 kDa band in two of our 10dC22 samples. This band was no longer detected after phosphatase pretreatment indicating that it represents a phosphorylated form of eIF2S2 [Supplementary Figure S1]. As this band was found in one male and one female 10dC22, but not in the other five samples in this group or any other sample in the other groups, we were unable to attribute it to any of the experimental parameters, despite the occurrence in 10dC22 only.
Immunohistochemistry
As vasculature, connective tissue and peripheral nerve were obviously included in the tissue samples used to gain the mRNA and protein extracts used above, immunostains were carried out to clarify the distribution of the candidate proteins within muscle sections and to further confirm the changes described above. Moreover, to address the possibility that the differences detailed above are only a disturbance in the physiological sequence of postnatal growth and maturation, we included sections from 3-month-old C22 (3mC22) and wild type control (3mco) TA.
Integral membrane protein 2a (ITM2A)
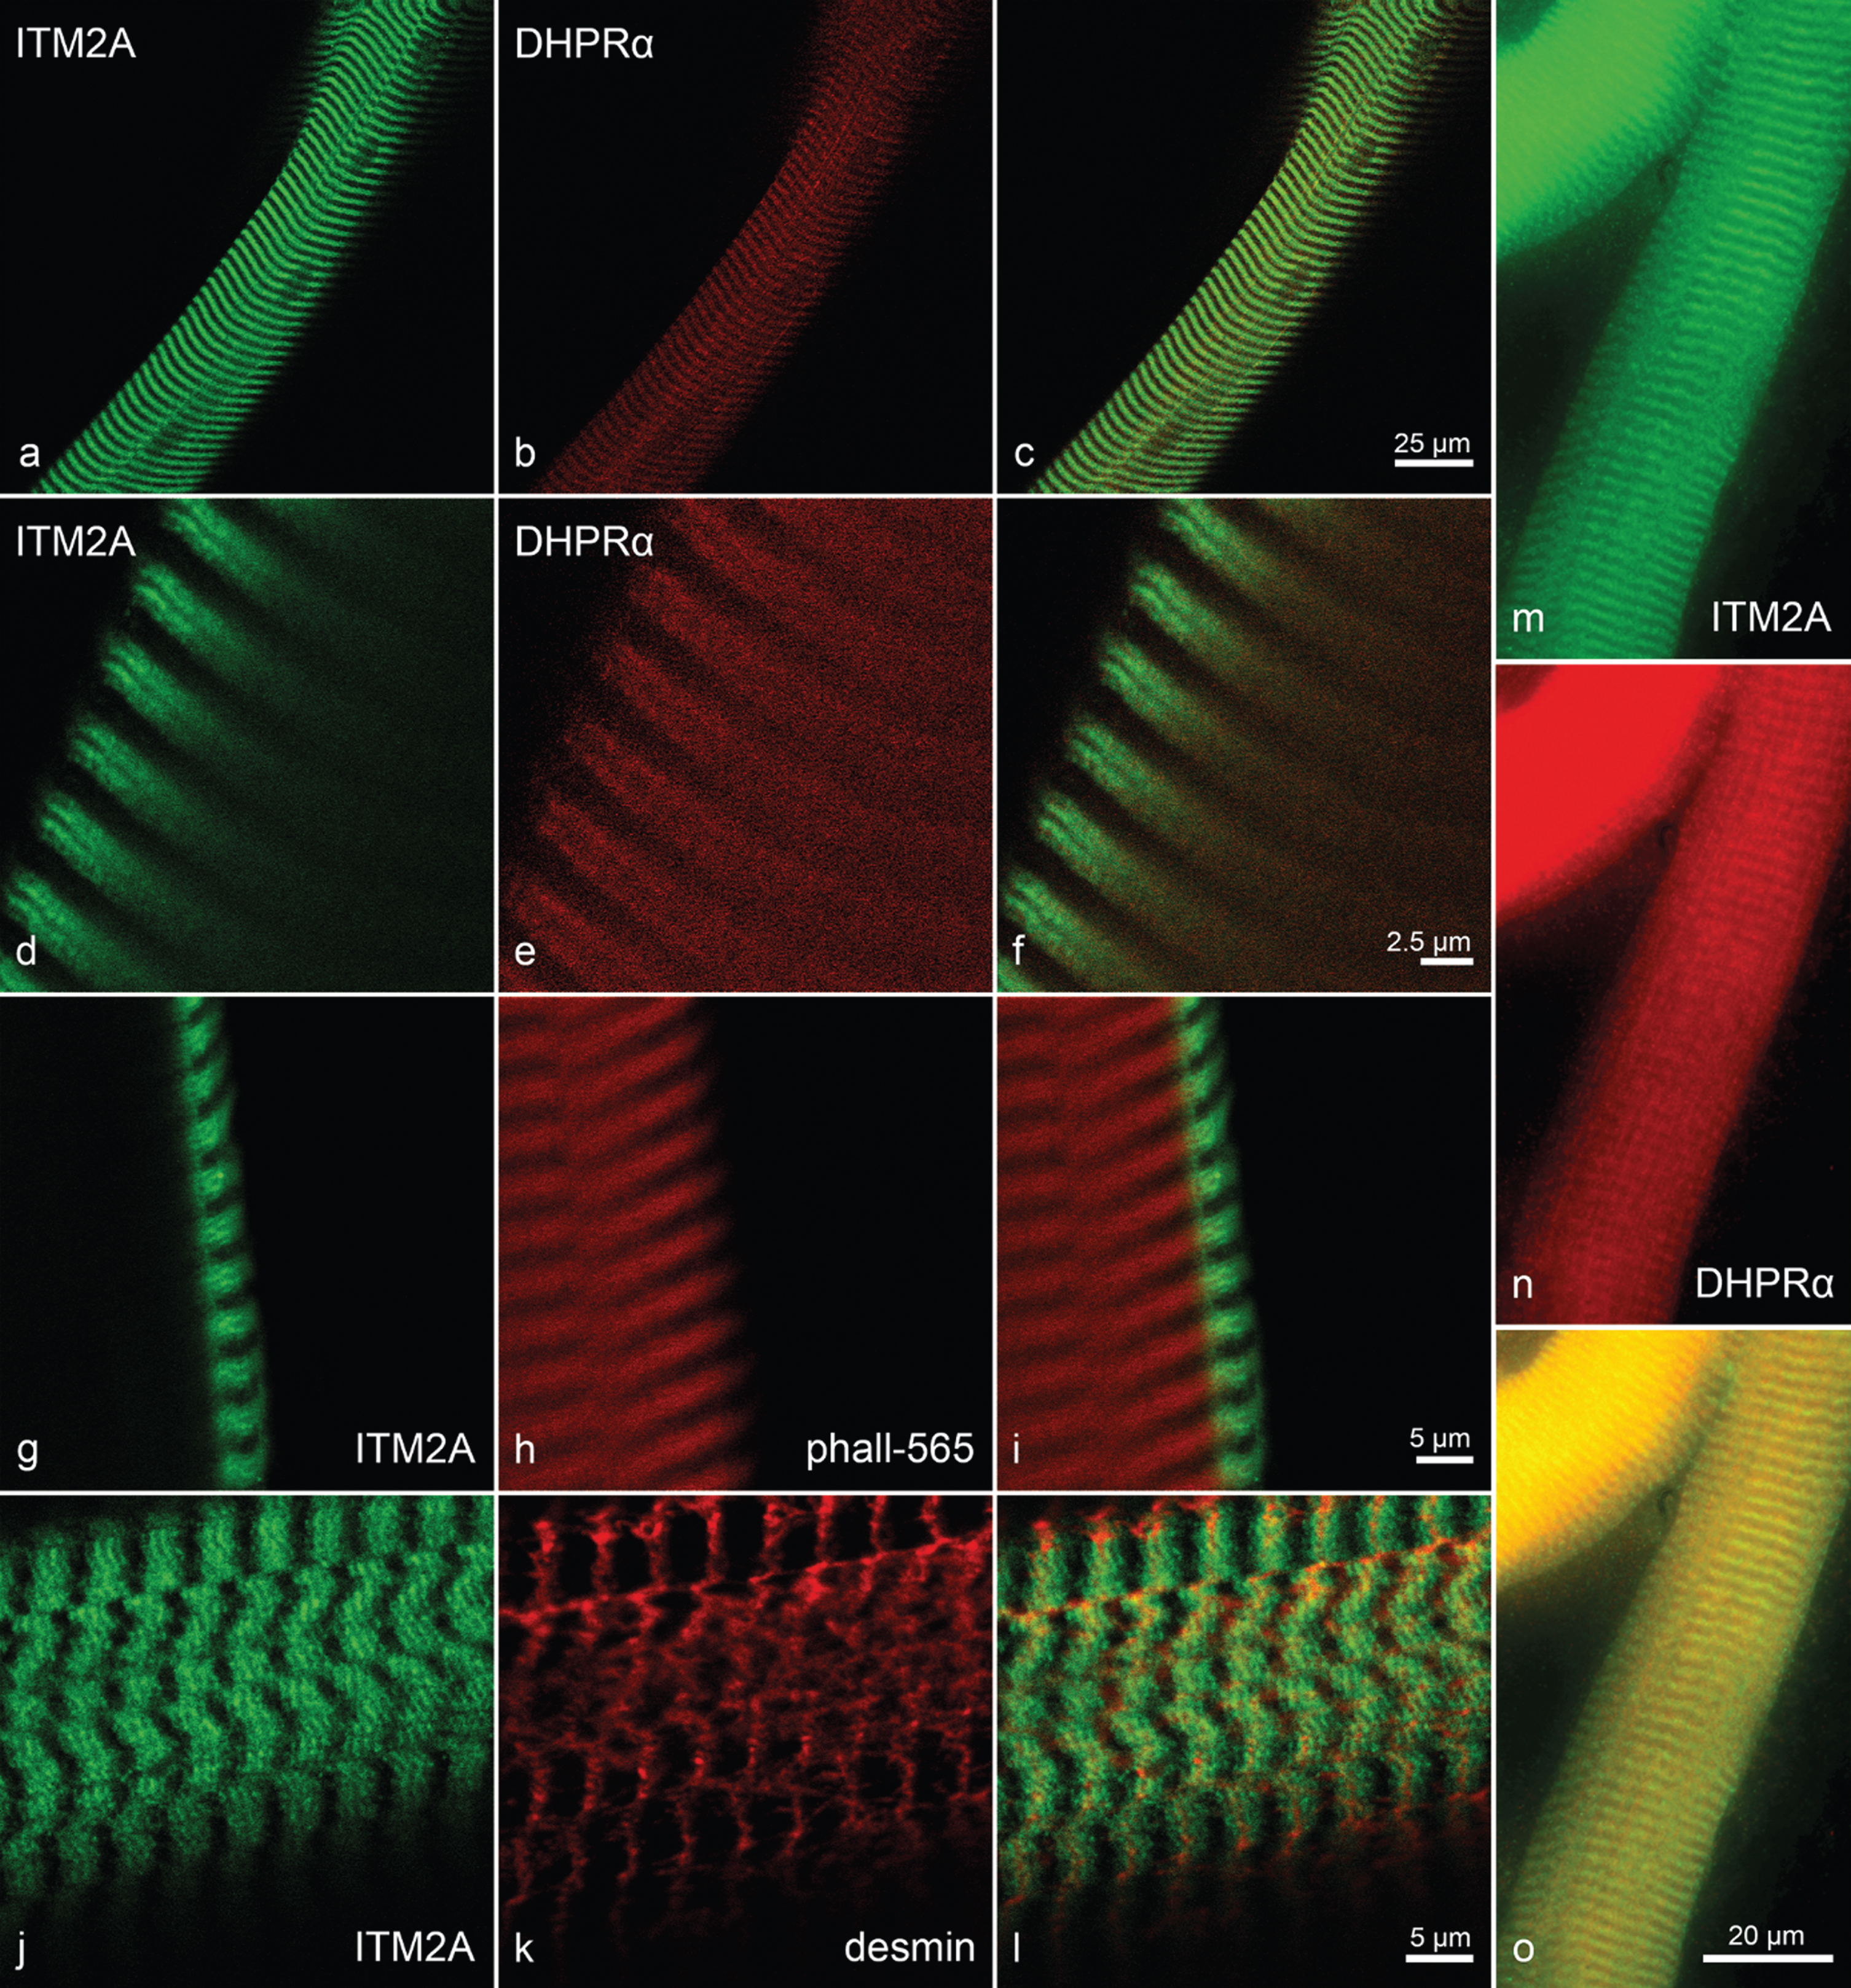
Throughout all groups, the highest immunoreactivity for ITM2A was found in the walls of perimysial arterioles and in the sarcoplasm of some but not all intrafusal fibres (i.e. fibres in muscle spindles). There also was pronounced reactivity at myotendinous junctions, but these were encountered too infrequently to asses in all groups. For these reactivities, as well as for a mild capillary reactivity, there seemed to be no differences between C22 and control TA muscles. However, for the sarcoplasmic reactivity of the extrafusal muscle fibres outside myotendinous junctions, a gradient of reactivity was found from highest immunofluorescene in the 10dC22 via the 10dco via the 21dco to the 21dC22 with the lowest signal as shown in Fig. 4. In the three-month-old group overall reactivities were not judged to be different from the 21-day-old with the same difference between control and C22. Immunoreactivity on transverse sections of muscle fibres profiles showed a fine pattern ranging from weak and spotted to strong, more interlaced or reticular with a fibre type difference throughout with small diameter fast fibres exhibiting strongest reactivity. Mouse and human fibre preparations at lower magnification showed reactivity in a broad band that localises with the reactivity to phalloidin, therefore excluding the H-band (Fig. 5g-i). At higher magnification using human fibres this broad band was divided in halves by the Z-band, where little reactivity was found, and separated further into two main bands with some reactivity in between. Of these bands, the one bordering the Z-band frequently showed the more intense staining (Fig. 5j-l). In double immunolabelling with an antibody against the dihydropyrdine receptor’s alpha subunit (DHPRalpha) the two stains matched for these bands, but within the bands there was no exact co-localisation (Fig. 5a-f, n-o). Thus, integral membrane protein 2a appears to be at the level of the sarcomere structures between Z-band and A/I-band junction. Confocal microscopy, in particular the co-stain with phalloidin, furthermore argues for far more immunoreactivity at the sarcolemmal level than within the sarcoplasm (Fig. 5g-i).
Fig. 4
Comparison of anti-ITM2A immunohistochemistry in samples of the young mouse groups. Anti-ITM2A immunohistochemistry of TA muscles from 10dC22 (a), 10dco (b), 21dco (c) and 21dC22 (d), identical exposure time, settings etc. and image processing throughout. Note gradient of muscle fibre reactivity. Primary magnification was 40fold, scale bar in (a) indicates 50μm for all images.
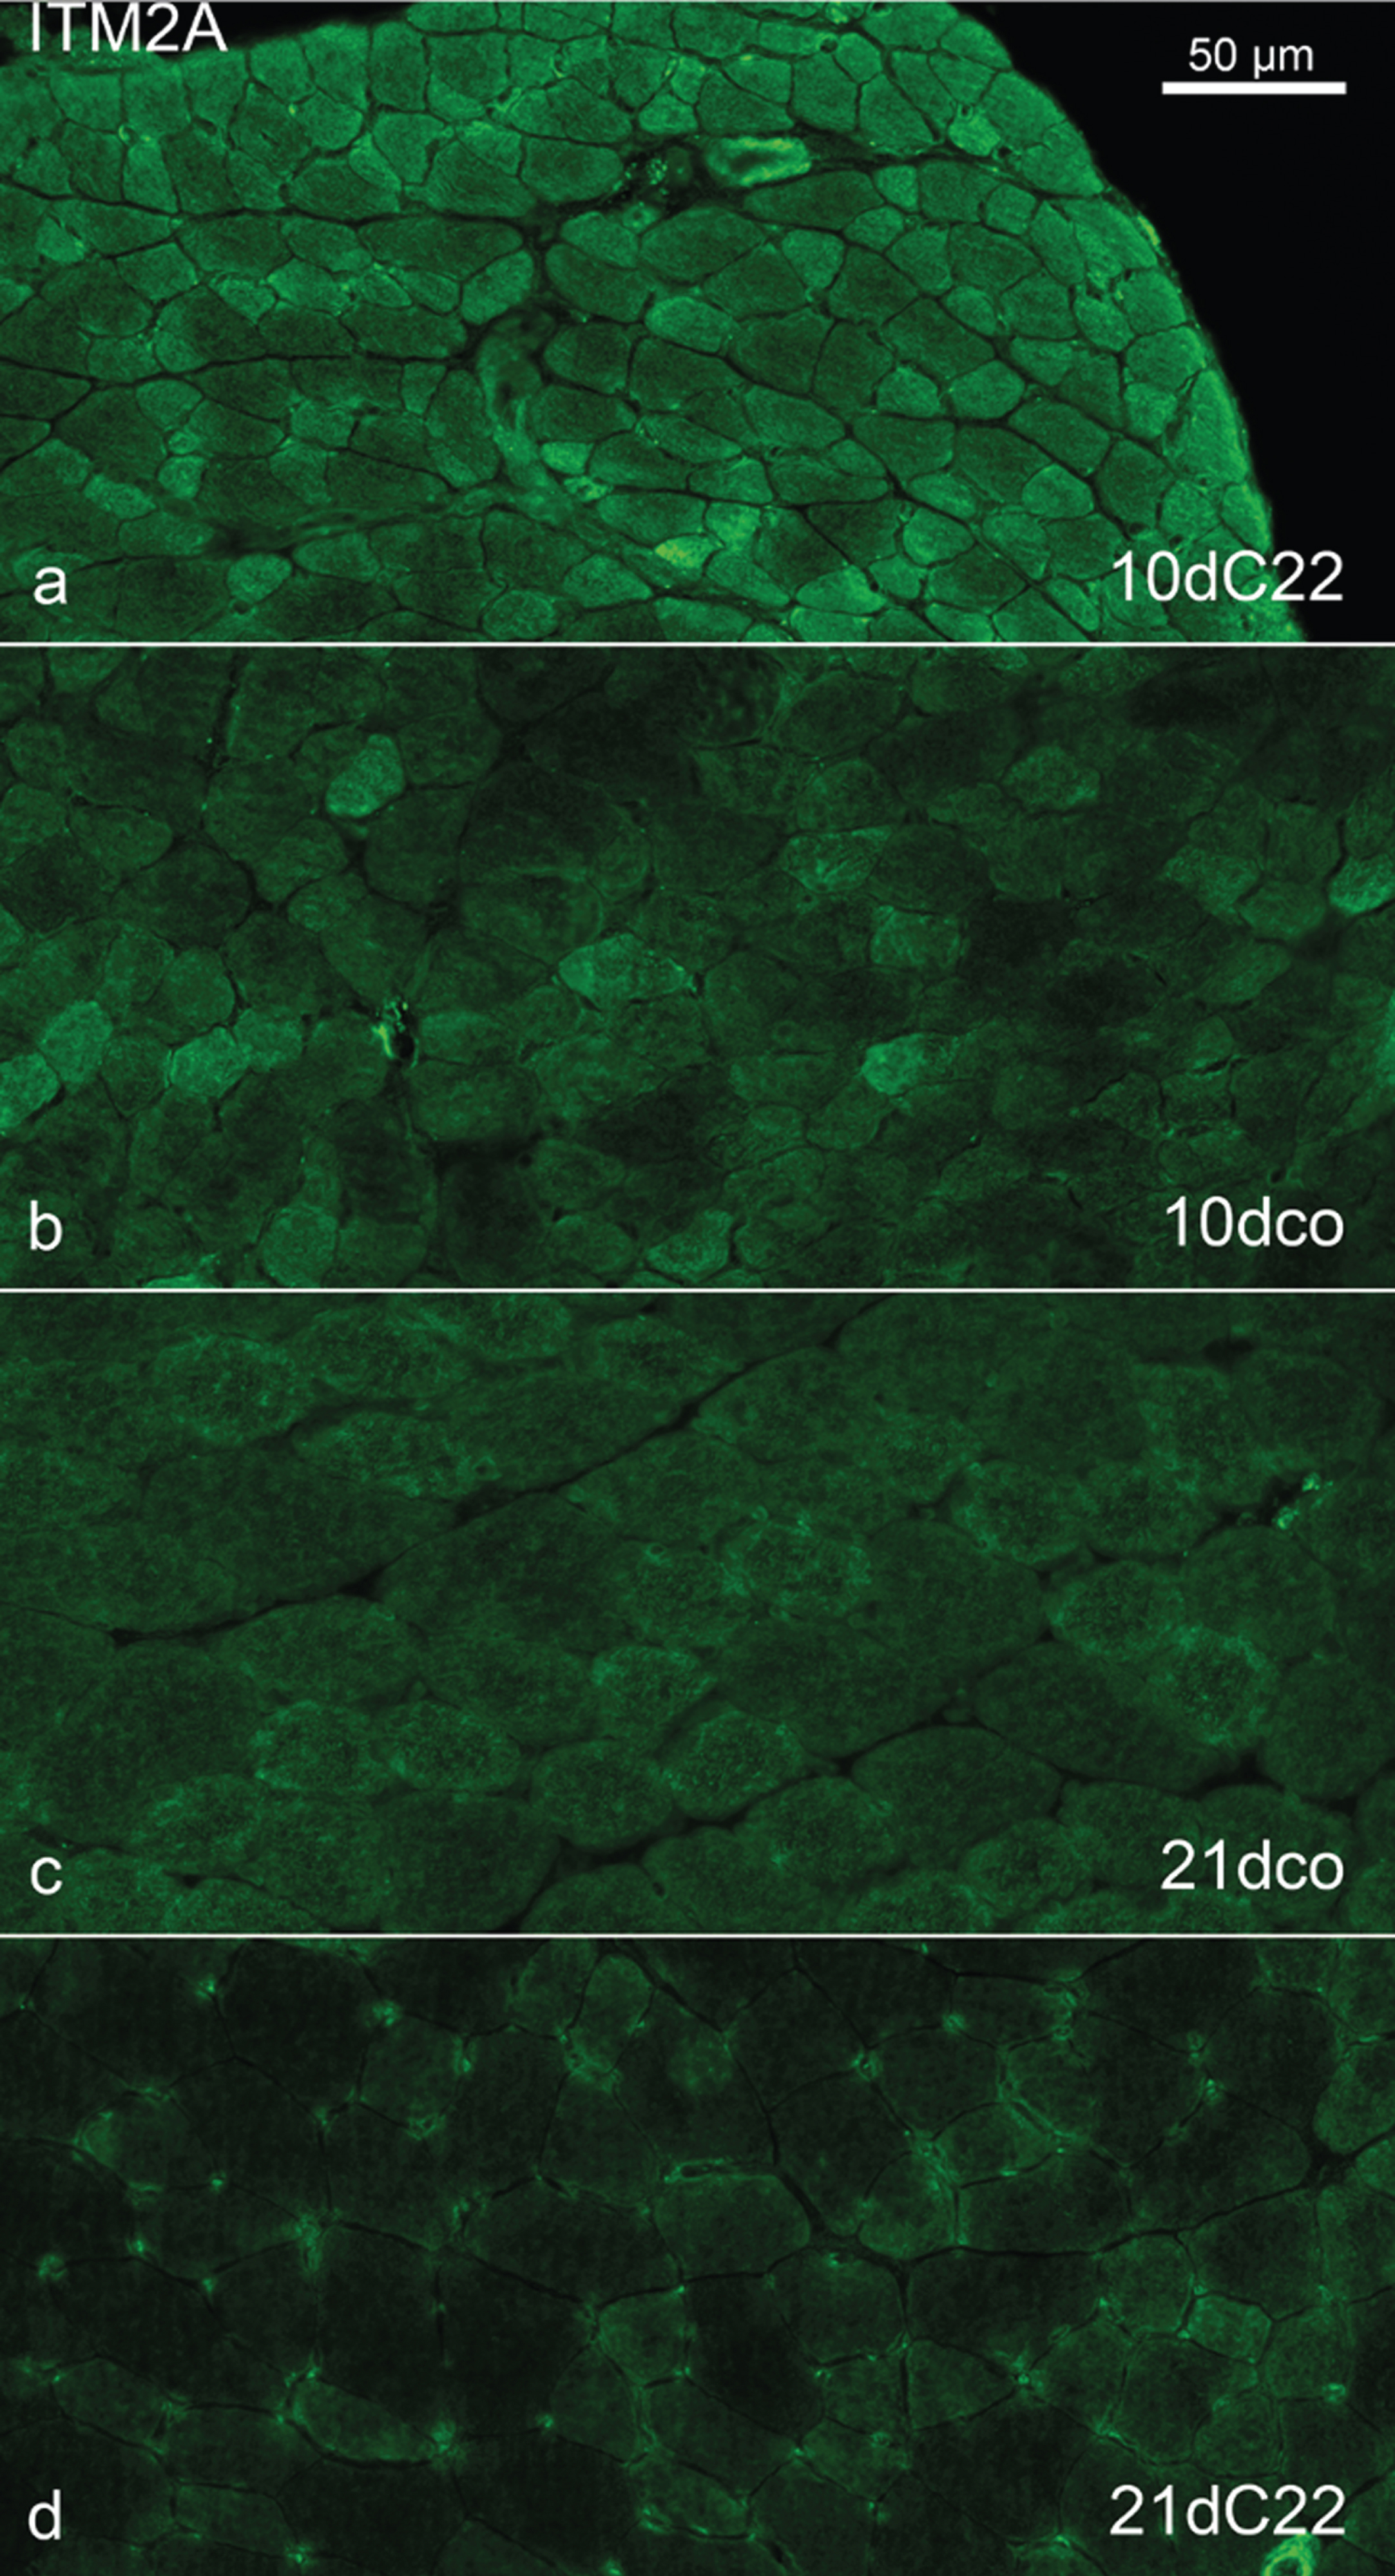
Fig. 5
Further determination of anti-ITM2A reactivity locations by immunohistochemistry. Confocal images of double immunohistochemistry anti-ITM2A (a, d) and anti-DHPR (α-subunit) (b, e) of a fibre from human vastus lateralis muscle (overlay in c and f) showing similar distribution but not exact co-localisation of the reactivities. Primary magnification 63fold, digital zoom, scale bars in (c) and (f) indicate 25μm and 2.5μm, respectively. Confocal images of doublestaining anti-ITM2A (g) and Atto 565-labelled phalloidin (phall-565; h) of a fibre from human vastus lateralis muscle (overlay in i). Both reactivities share a part of the sarcomere, anti-ITM2A reactivity is much stronger at the sarcolemmal level than in the sarcoplasm. Primary magnification 63fold, digital zoom, scale bar in (i) indicates 5μm. Confocal images of double immunohistochemistry anti-ITM2A (j) and anti-desmin (k) of fibres from human vastus lateralis muscle free of signs of neuromuscular disease (overlay in l). Note double band of anti-ITM2A immunoreactivity framing the single anti-desmin band. Primary magnification 63fold, digital zoom, scale bar in (l) indicates 5μm. Double immunohistochemistry anti-ITM2A (m) and anti-DHPR (α-subunit; n) of a fibre from a 10dco TA muscle (overlay in o), demonstrating the same distribution of reactivities as in the human (a –f). Primary magnification 100fold, scale bar in (o) indicates 20μm.
Phosphatidylinositol transfer protein, cytoplasmic 1 (PITPNC1)
Sarcoplasmic immunoreactivity of extrafusal fibres presented in a relatively coarse pattern with no difference between the control and C22 groups. However, in the 10dC22 a reactivity of endomysial connective tissue was seen, that could not be found in the control group. Likewise, capillary reactivity was much stronger in the C22 than in the control. A somewhat stronger capillary reactivity could still be seen in 21dC22, but not at three months. The difference in connective tissue reactivity was only present at 10 days. Perimysial vessels showed reactivity throughout as did neuromuscular junctions and the axons of peripheral nerves (according to co-staining with anti-neurofilament antibody SMI 31; Fig. 6a-c) encountered. Intrafusal muscle fibres showed less reactivity than the extrafusal fibres (not shown).
Fig. 6
Anti-PITPNC1 immunohistochemistry. Double immunohistochemistry with anti-PITPNC1 (a) and anti-neurofilament SMI31 (b) (overlay in c) of an intramuscular nerve in a 3-month-old C57BL/6J litter mate control (3mco) TA muscle, showing strong axonal reactivity. Anti-PITPNC1 (d) and anti-desmin (e) of a bundle of muscle fibres from a 10dco TA muscle (overlay in f). Anti-PITPNC1 (g) and anti-desmin (h) of fibres from human vastus lateralis muscle free of signs of neuromuscular disease (overlay in i). Both reactivities are in close proximity, but at least on the human fibre, anti-PITPNC1 reactivity localises to either side of the anti-desmin reactivity. Primary magnification 100fold for all images, scale bars in (c, f, i) indicate 20μm.
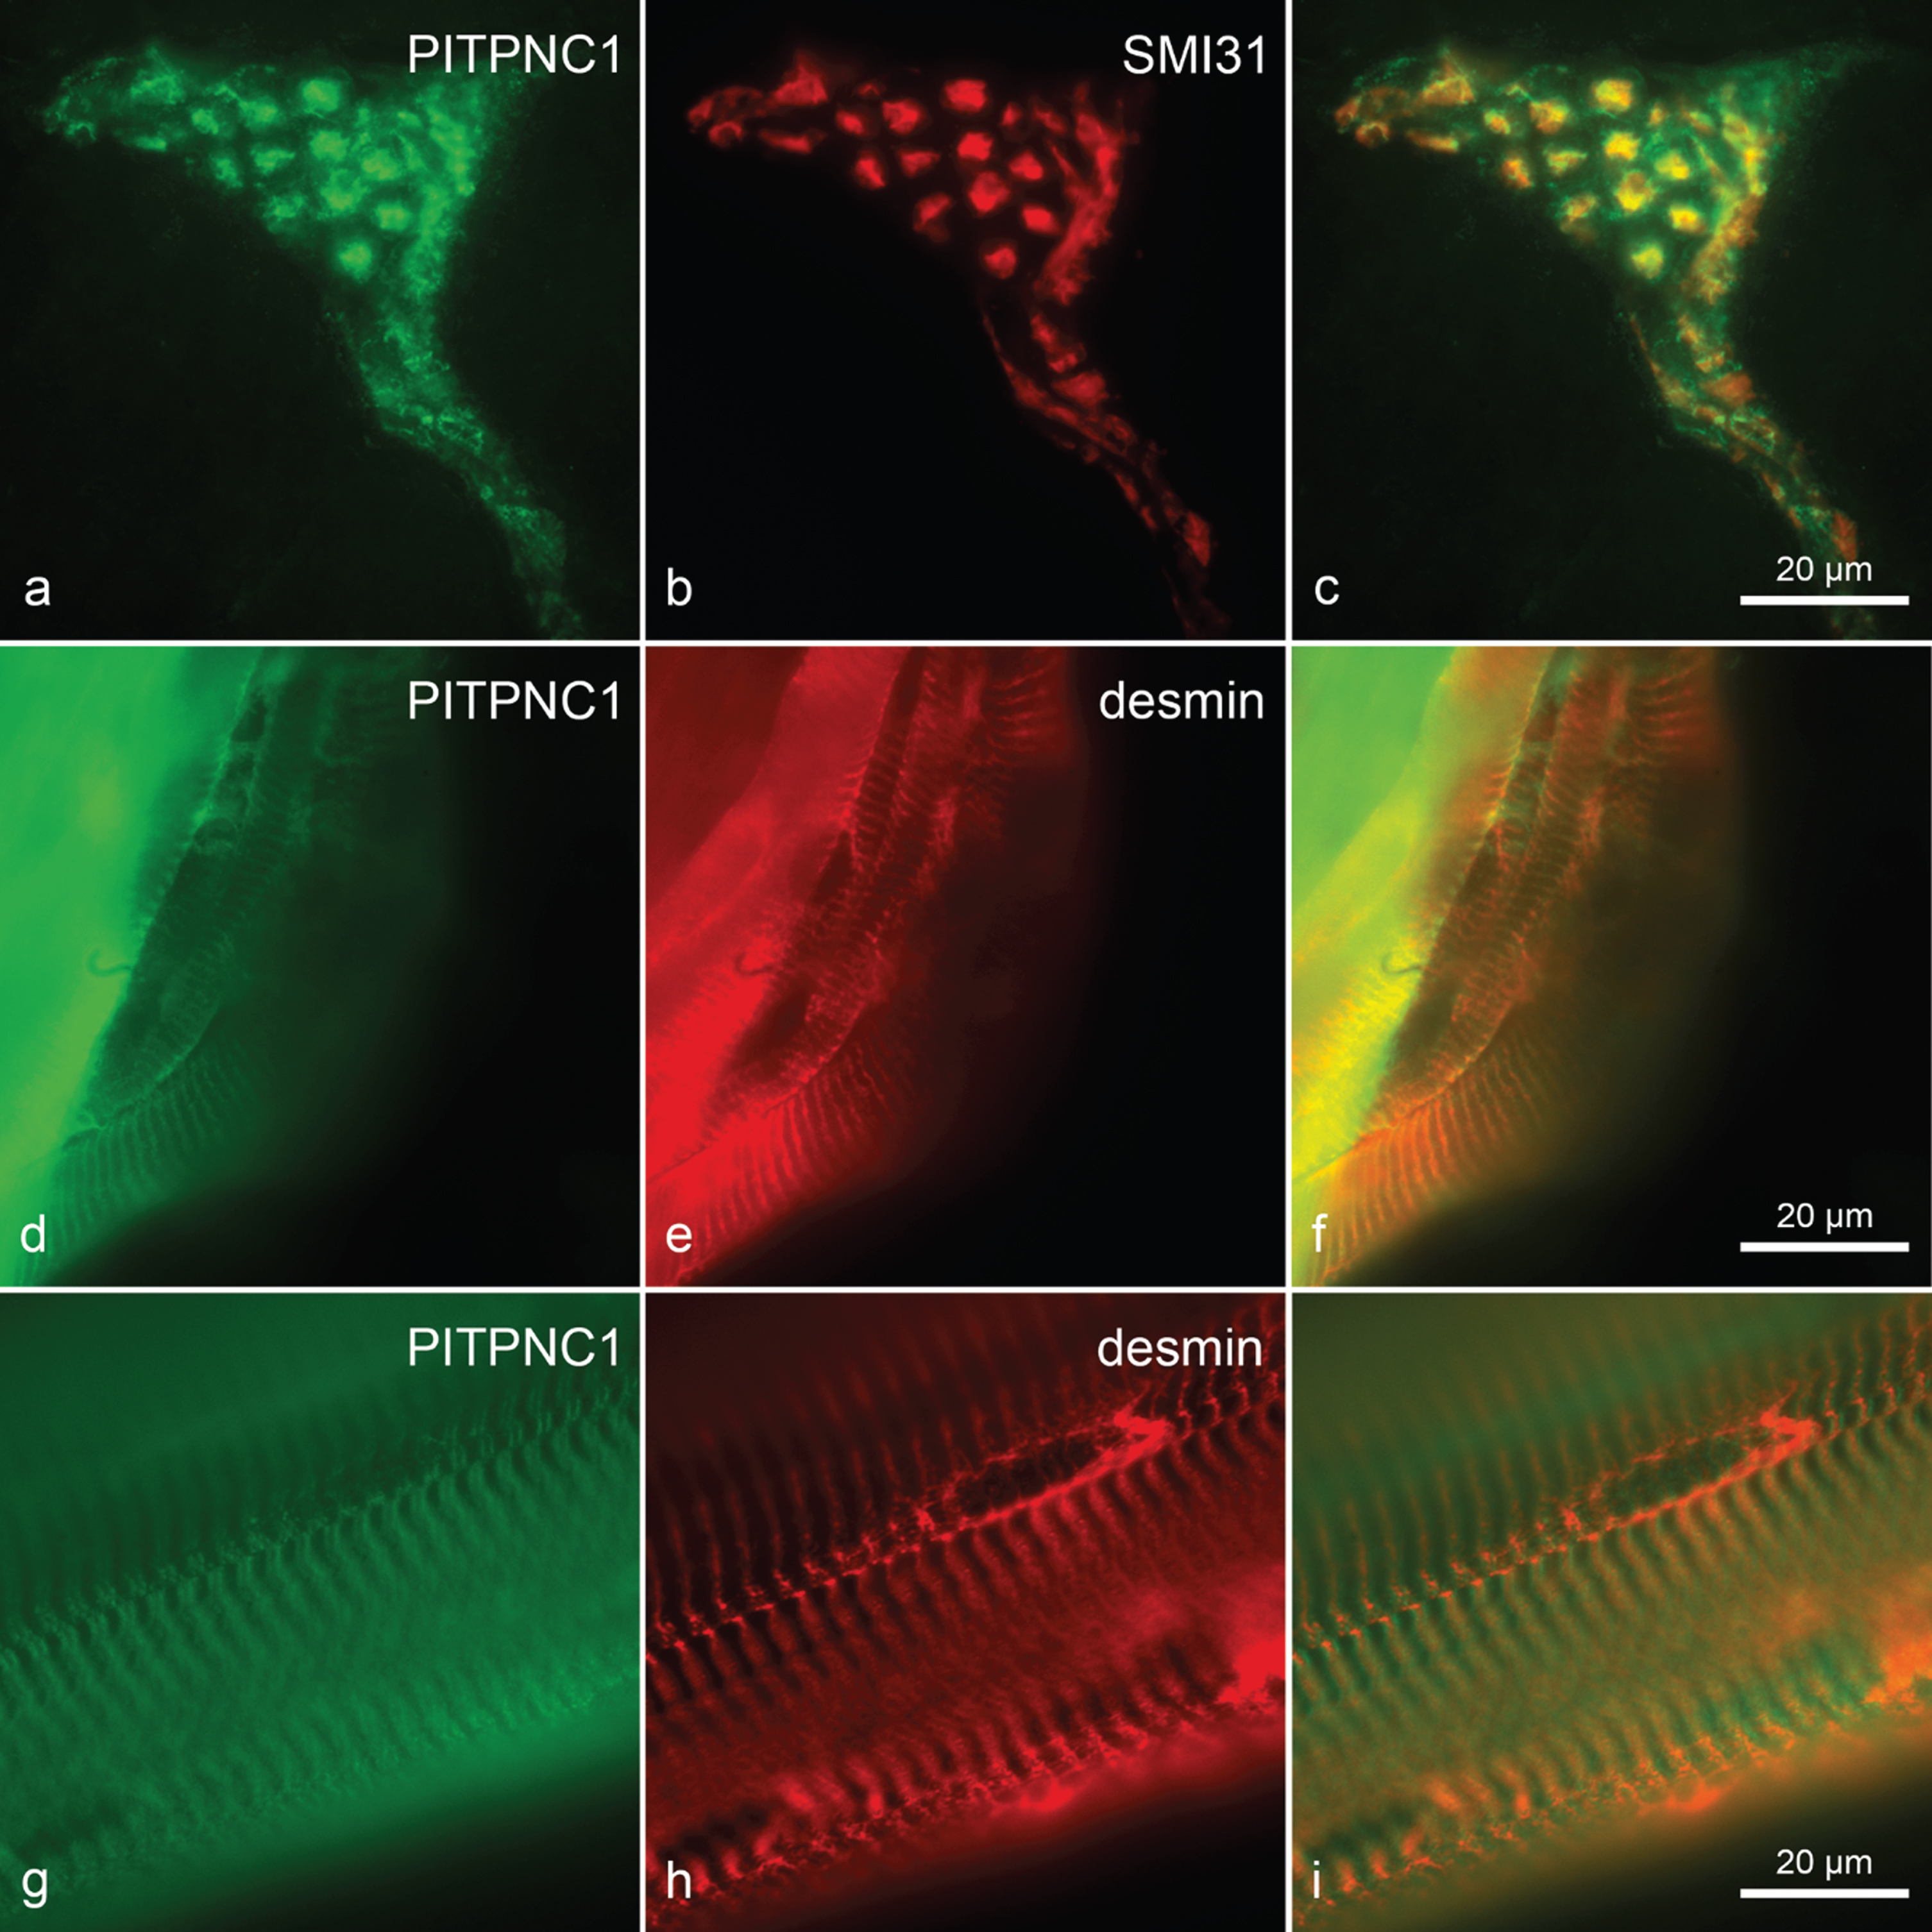
Longitudinally, on mouse fibres reactivity mostly matched that of anti-desmin, the band appearing slightly broader in some places (Fig. 6d-f). Using human fibres, this broad band consisted of two small bands of high intensity along the outer edge of the Z-band and a less reactive zone between these. In the double immunostaining with anti-desmin, the high intensity bands framed the anti-desmin reactivity (Fig. 6g-i). This would localise anti-PITPNC1 immunoreactivity to be close to the Z-band level.
DISCUSSION
According to our quantitative histology and RDA data, the differences of C22 and control TA appear to be minute prior to the onset of atrophy, as detected in the fibre diameter analysis at 21 days. Both the mRNA regulation differences in the 10-day-old groups identified by RDA and the histomorphological data compared were not statistically significant different. The very high sensitivity of RDA depending on the dilution relations used is well known and will lead to the amplification of appropriate cDNA fragments even when of low abundance and/or with only minor differences in concentrations. However, it has to be kept in mind that for further analysis in this project, we specifically selected transcripts from the RDA that we could not readily attribute to the atrophy process. By not following up other candidates (Table 2) we might have missed early significant regulations, e.g. for myostatin, a prominent key molecule of muscle fibre atrophy [15].
In summary, our data suggests that the denervation-like changes resulting from the dysmyelinating neuropathy in the C22 mouse are slow to develop, and were first evident in our study in the 21-day-old group, an age when weakness of the hind limbs can already be demonstrated. ‘Functional denervation’ seems to be a not entirely inapt description in this model. However, the extent of the axonal loss of the individual muscles’ respective nerves was not determined, although it is known not to exceed 4%in adult mice [2]. While it is interesting that neither RDA nor (immuno)histochemistry detected extrajunctional expression of acetylcholine receptors –in particular their α-subunit [7] –in 10dC22 and 21dC22, this does not prove a deviation from the classical denervation sequence. Differences in the methodology of detection used, as well as the basic mechanism of pathology taking effect could well account for a different time frame as well as scale of these changes. The detection of extrajunctional AChR α-subunits in the 3mC22 is in line with the literature and the failure to detect these in 10dC22 and 21dC22 is in agreement with very early stages of muscle pathology, which we aimed to investigate. It should be noted that extrajunctional AChR expression was found to be of limited time after denervation in some experiments and that in chronic neurogenic conditions not all atrophic fibre displayed it [16]. Thus, it cannot be considered the progressive development of a universal and permanent marker. A further deviation from classic denervation experiments is the use of the TA muscle, based simply on the smallness of individual distal hind leg muscles of 10-day-old mice, as opposed to the traditional choice of extensor digitorum longus/ soleus (fast/ slow) in adult rats. The lower number of nuclei per fibre profile, statistically significant in the 3-month-old C22, is in line with observations on the loss of myonuclei as well as satellite cells –that were not differentiated by using the anti-laminin immunohistochemistry –in chronic neurogenic damage [17]. However, in the C22 mice investigated here, these nuclei might not be lost but never gained due to lack of fibre growth. Further studies towards this aspect might be justified, as it could be important in considerations concerning treatments of hereditary demyelinating neuropathies, like CMT 1, in humans.
Following up the candidate sequences selected from the 10 days RDA results, we found minor down-regulations of these mRNA at 21 days throughout the groups. As one unavoidable aspect of working with mice of these ages is postnatal growth and development, we carried out comparisons between the age groups within C22 and control groups, detecting more pronounced down-regulations, in particular of Itm2a, that reached statistical significance in qPCR in both groups and in the Western blot for the C22 group. It therefore has to be considered that we observed differences in the schedule or extent of a common postnatal development program, i.e. a maturation phenomenon, overlapping with denervation-like pathology.
This appears to be in line with the known developmental course of ITM2A expression in skeletal muscle. In most of the instances investigated, ITM2A, a type II transmembrane glycoprotein with a BRICHOS domain, is suggested to play a role in the development, particularly the control of differentiation, of mesenchymal cell populations (cartilage [18], skeletal muscle [14, 19], thymocytes [20]) with the exception of the inner enamel epithelium in odontogenesis [21], which is clearly of ectodermal origin. The continuation of ITM2A expression in mature muscle fibres has been described [19], pointing to a function beyond an influence on fusion of myoblasts or immature myotubes as noted in C2C12 cells [14]; and very likely beyond a role in adult myogenesis [19], i.e. growth and regeneration, as well. Interestingly, our immunohistochemistry suggests an overall inverse correlation of denervation(-like changes) and immunoreactivity up to 3-month-old C22 muscles and suggests a localisation of the epitope detected in the proximity of the A/I-boundary, therefore, in possible association with the T-tubule system. This system, with its essential role for excitation-contraction coupling, has long been known to be sensitive to neurogenic damage, however, affected rather in the later stages of (neurotomy) denervation [5]. Could the ITM2A findings in our study be explained as purely a disturbance in the maturation of this system? When cells of the mouse myoblast cell line C2C12 are incubated in differentiation medium, Itm2a mRNA and respective protein increases from the proliferative to the differentiation stage, but then decreases slightly at terminal differentiation [22]. Thus, a delay in further maturation of 10dC22 muscle could lead to a higher expression of Itm2a, resulting in a bigger difference to levels at 21 days than in controls. However, as abnormalities in C22 progress in that time, presenting with denervation-like morphological changes at 21 days, there is no reason to assume a catching up of such a maturation delay. Furthermore, IHC suggests that muscle fibre ITM2A in 21dC22 [Fig. 4] is lower than in controls. Therefore, at least part of the difference will have its cause in the denervation. However, as ITM2A Western blots did not detect a significant difference between 3-month-old C22 and controls, this argues against a strict correlation to denervation pathology at least in this age group.
The fact that PAX3, and likely PAX7, transcription factors playing an essential role in skeletal muscle development [23] and regeneration [24], are driving Itm2a expression [19] is interesting. However, it seems unlikely to be relevant in mature muscle fibres, as these Pax transcription factors are not found [24] in their myonuclei. Itm2a expression is also known to be regulated via fibromodulin, again more likely to play a role in myogenesis and regeneration [22]. Furthermore, in adult murine heart muscle, Itm2a expression is driven by microRNA-296 and suppressed by competing long noncoding RNAs. [25], a mechanism that is likely to escape our analysis.
The assembly of a translation initiation complex of initiator methionyl-tRNA, mRNA and a range of eukaryotic initiation factors (eIFs) is necessary for the initiation of mRNA translation, thereby a major regulation point for protein synthesis [26]. In this complex the required exchange of GDP bound to eIF2 for GTP is mediated by the guanine nucleotide exchange protein eIF2B [27], with the eIF2B ɛ-subunit containing the catalytic domain [28]. Picking up changes in the expression of an eIF2 subunit might therefore be another instance of muscle metabolism moving toward catabolism/ atrophy early in the course of the consequences of the dysmyelinization. Changes in the binding dynamics and phosphorylation of other components of the complex have been reported to be under the influence of myostatin/ GDF8 [29] and reactive to denervation [30]. However, the reported point of regulation is eIF2–eIF2B interaction [31], with phosphorylation of eIF2S1 (eIF2α) inhibiting the complex formation [32]. Again, given the changes of particularly protein synthesis in a growing mouse, especially in skeletal muscle, the down-regulations in the later age stages could be considered the normal course of growth and maturation. The initial up-regulation in comparison to the control in C22, however, can at the present point not be attributed with confidence to a regulatory mechanism already described in the literature. We observed eIF2S2 phosphorylation in two of our 10dC22 samples not present in any other sample, obstructing correlation of qPCR and quantitative Western blot measurements. It remains unclear how and if this post-translational modification and the transcriptional regulation correlate and whether the former is related to the transgene status as it was only found in a minority of 10dC22 samples.
Phosphatidylinositol transfer protein, cytoplasmic 1, Pitpnc1, also known as RdgB β, is the most enigmatic candidate we selected. It binds and transfers phosphatidic acid and phosphatidylinositol [33]. While mutations in the genes of kinases and phosphatases modifying the derivatives of phosphatidic acid and phosphatidylinositol are now recognised as causing a spectrum of neurological disorders with prominent neuromuscular diseases (X-linked myotubular myopathy) among them [34], the role of PITPNC1 in muscle health and disease is so far unknown. Belonging to the class II of the phosphatidylinositol transfer protein (PITP) family, it interacts with the angiotensin II receptor associated protein (ATRAP) in the heart [33]. A differential regulation of angiotensin II receptors in skeletal muscle vasculature in early denervation is a tempting speculation. In particular as the response of the muscle’s microvasculature to denervation has so far been described as the loss of capillaries occurring in long-term denervated muscle, typically in atrophic muscles months after neurotomy [35], possibly due to reduced expression of angiogenesis-related factors [36], possibly correcting the relation of capillaries to muscle mass via capillary necrosis [37]. However, muscle cells are known to express both angiotensin receptors (AT1R, AT2R) as well [38] and we showed anti-PITPNC1 reactivity on muscle fibres. As we saw differences in anti-PITPNC1 IHC for both, capillaries and muscle fibres, as well as axonal reactivity, we have to consider the possibility of a variety of expression changes by several tissue elements that have yet to be untangled.
ACKNOWLEDGMENTS
The authors would like to thank Terence Partridge for the incitation and encouragement. We thank Clare Huxley for the C22 mice and related primers as well as providing material and support to start the project prior to the mouse transfer. We thank Jonathan Beauchamp for sharing his RDA protocol and experience. Furthermore, thanks to Manuela Stephien-Mering for her support with the Western blotting and Dirk Dietrich as well as Ronald Jabs for access to and support at the confocal microscope. We thank Wolfram S. Kunz for the use of his iCycler/ MyiQ systems and the relaxation solution.
SOURCES OF SUPPORT
Parts of this study were funded by BONFOR (O-129.0042) and DFG (RE1547/2-1).
CONFLICTS OF INTEREST
The authors declare no conflict of interest.
SUPPLEMENTARY MATERIAL
[1] The supplementary material is available in the electronic version of this article: https://dx.doi.org/10.3233/JND-210681.
REFERENCES
[1] | Huxley C , Passage E , Robertson AM , Youl B , Huston S , Manson A , et al. Correlation between varying levels of PMP22 expression and the degree of demyelination and reduction in nerve conduction velocity in transgenic mice. Hum Mol Genet. (1998) ;7: :449–58. doi: 10.1093/hmg/7.3.449 |
[2] | Robertson AM , Perea J , McGuigan A , King RH , Muddle JR , Gabreëls-Festen AA , et al. Comparison of a new pmp22 transgenic mouse line with other mouse models and human patients with CMT1A. J Anat. (2002) ;200: :377–90. doi: 10.1046/j.1469-7580.2002.00039.x |
[3] | Albuquerque EX , Schuh FT , Kauffman FC . Early membrane depolarization of the fast mammalian muscle after denervation. Pflugers Arch. (1971) ;328: :36–50. doi: 10.1007/BF00587359 |
[4] | Fambrough DM . Acetylcholine sensitivity of muscle fiber membranes: Mechanism of regulation by motoneurons. Science. (1970) ;168: :372–3. doi: 10.1126/science.168.3929.372 |
[5] | Engel AG , Stonnington HH . Trophic functions of the neuron. II. Denervation and regulation of muscle. Morphological effects of denervation of muscle. A quantitative ultrastructural study. Ann N Y Acad Sci. (1974) ;228: :68–88. doi: 10.1111/j.1749-6632.1974.tb20503.x |
[6] | Grinnell AD . Trophic Interaction between Nerve and Muscle. In: EngelAG, Franzini-Armstrong C, editors. Myology. 2nd ed. New York: McGraw-Hill; (1994) . pp. 303–32. |
[7] | Witzemann V , Brenner HR , Sakmann B . Neural factors regulate AChR subunit mRNAs at rat neuromuscular synapses. J Cell Biol. (1991) ;114: :125–41. doi: 10.1083/jcb.114.1.125 |
[8] | Cangiano A , Fried JA . The production of denervation-like changes in rat muscle by colchicine, without interference with axonal transport or muscle activity. J Physiol. (1977) ;265: :63–84. doi: 10.1113/jphysiol.1977.sp011705 |
[9] | Hubank M , Schatz DG . Identifying differences in mRNA expression by representational difference analysis of cDNA. Nucleic Acids Res. (1994) ;22: :5640–8. doi: 10.1093/nar/22.25.5640 |
[10] | Lambert JF , Benoit BO , Colvin GA , Carlson J , Delville Y , Quesenberry PJ . Quick sex determination of mouse fetuses. J Neurosci Methods. (2000) ;95: :127–32. doi: 10.1016/S0165-0270(99)00157-0 |
[11] | Vielhaber S , Kunz D , Winkler K , Wiedemann FR , Kirches E , Feistner H , et al. Mitochondrial DNA abnormalities in skeletal muscle of patients with sporadic amyotrophic lateral sclerosis. Brain. (2000) ;123: :1339–48. doi: 10.1093/brain/123.7.1339 |
[12] | Dubowitz V , Sewry CA . Muscle Biopsy: A Practical Approach. 3rd ed. London: Saunders Elsevier; (2007) . |
[13] | Pfaffl MW , Horgan GW , Dempfle L . Relative expression software tool (REST) for group-wise comparison and statistical analysis of relative expression results in real-time PCR. Nucleic Acids Res. (2002) ;30: (9):e36. doi: 10.1093/nar/30.9.e36 |
[14] | Van den Plas D , Merregaert J . Constitutive overexpression of the integral membrane protein Itm2A enhances myogenic differentiation of C2C12 cells. Cell Biol Int. (2004) ;28: :199–207. doi: 10.1016/j.cellbi.2003.11.019 |
[15] | Sharma M , McFarlane C , Kambadur R , Kukreti H , Bonala S , Srinivasan S . Myostatin: expanding horizons. IUBMB Life. (2015) ;67: :589–600. doi: 10.1002/iub.1392 |
[16] | Ringel SP , Bender AN , Engel WK . Extrajunctional acetylcholine receptors. Alterations in human and experimental neuromuscular diseases. Arch Neurol. (1976) ;33: :751–8. doi: 10.1001/archneur.1976.00500110019004 |
[17] | Dedkov EI , Kostrominova TY , Borisov AB , Carlson BM . Reparative myogenesis in long-term denervated skeletal muscles of adult rats results in a reduction of the satellite cell population. Anat Rec. (2001) ;263: :139–54. doi: 10.1002/ar.1087 |
[18] | Boeuf S , Börger M , Hennig T , Winter A , Kasten P , Richter W . Enhanced ITM2A expression inhibits chondrogenic differentiation of mesenchymal stem cells. Differentiation. (2009) ;78: :108–15. doi: 10.1016/j.diff.2009.05.007 |
[19] | Lagha M , Mayeuf-Louchart A , Chang T , Montarras D , Rocancourt D , Zalc A , et al. Itm2a is a Pax3 target gene, expressed at sites of skeletal muscle formation in vivo. PLoS One. (2013) May 1;8: (5):e63143. doi: 10.1371/journal.pone.0063143 |
[20] | Kirchner J , Bevan MJ . ITM2A is induced during thymocyte selection and T cell activation and causes downregulation of CD8 when overexpressed in CD4(+)CD8(+) double positive thymocytes. J Exp Med. (1999) ;190: :217–28. doi: 10.1084/jem.190.2.217 |
[21] | Kihara M , Kiyoshima T , Nagata K , Wada H , Fujiwara H , Hasegawa K , et al. Itm2a expression in the developing mouse first lower molar, and the subcellular localization of Itm2a in mouse dental epithelial cells. PLoS One. (2014) ;9: (7):e103928. doi: 10.1371/journal.pone.0103928 |
[22] | Lee EJ , Jan AT , Baig MH , Ahmad K , Malik A , Rabbani G , et al. Fibromodulin and regulation of the intricate balance between myoblast differentiation to myocytes or adipocyte-like cells. FASEB J. (2018) ;32: :768–81. doi: 10.1096/fj.201700665R |
[23] | Relaix F , Rocancourt D , Mansouri A , Buckingham M . A Pax3/Pax7-dependent population of skeletal muscle progenitor cells. Nature. (2005) ;435: (7044):948–53. doi: 10.1038/nature03594 |
[24] | Kuang S , Chargé SB , Seale P , Huh M , Rudnicki MA . Distinct roles for Pax7 and Pax3 in adult regenerative myogenesis. J Cell Biol. (2006) ;172: :103–13. doi: 10.1083/jcb.200508001 |
[25] | Cai B , Ma W , Ding F , Zhang L , Huang Q , Wang X , et al. The Long Noncoding RNA CAREL Controls Cardiac Regeneration. J Am Coll Cardiol. (2018) ;72: :534–50. doi: 10.1016/j.jacc.2018.04.085 |
[26] | Kimball SR , O’Malley JP , Anthony JC , Crozier SJ , Jefferson LS . Assessment of biomarkers of protein anabolism in skeletal muscle during the life span of the rat: sarcopenia despite elevated protein synthesis. Am J Physiol Endocrinol Metab. (2004) ;287: :E772–80. doi: 10.1152/ajpendo.00535.2003 |
[27] | Proud CG . Regulation of eukaryotic initiation factor eIF2B. Prog Mol Subcell Biol. (2001) ;26: :95–114. doi: 10.1007/978-3-642-56688-2_4 |
[28] | Gomez E , Mohammad SS , Pavitt GD . Characterization of the minimal catalytic domain within eIF2B: the guanine-nucleotide exchange factor for translation initiation. EMBO J. (2002) ;21: :5292–301. doi: 10.1093/emboj/cdf515 |
[29] | Rodriguez J , Vernus B , Toubiana M , Jublanc E , Tintignac L , Leibovitch S , et al. Myostatin inactivation increases myotube size through regulation of translational initiation machinery. J Cell Biochem. (2011) ;112: :3531–42. doi: 10.1002/jcb.23280. |
[30] | Hornberger TA , Hunter RB , Kandarian SC , Esser KA . Regulation of translation factors during hindlimb unloading and denervation of skeletal muscle in rats. Am J Physiol Cell Physiol. (2001) ;281: :C179–87. doi: 10.1152/ajpcell.2001.281.1.C179. |
[31] | Proud CG . eIF2 and the control of cell physiology. Semin Cell Dev Biol. (2005) ;16: :3–12. doi: 10.1016/j.semcdb.2004.11.004. |
[32] | Rowlands AG , Panniers R , Henshaw EC . The catalytic mechanism of guanine nucleotide exchange factor action and competitive inhibition by phosphorylated eukaryotic initiation factor 2. J Biol Chem. (1988) ;263: :5526–33. |
[33] | Garner K , Hunt AN , Koster G , Somerharju P , Groves E , Li M , et al. Phosphatidylinositol transfer protein, cytoplasmic 1 (PITPNC1) binds and transfers phosphatidic acid. J Biol Chem. (2012) ;287: :32263–76. doi: 10.1074/jbc.M112.375840 |
[34] | Volpatti JR , Al-Maawali A , Smith L , Al-Hashim A , Brill JA , Dowling JJ . The expanding spectrum of neurological disorders of phosphoinositide metabolism. Dis Model Mech. 2019;12:dmm038174. doi: 10.1242/dmm.038174 |
[35] | Borisov AB , Huang SK , Carlson BM . Remodelling of the vascular bed and progressive loss of capillaries in denervated skeletal muscle. Anat Rec. (2000) ;258: :292–304. doi: 10.1002/(SICI)1097-0185(20000301)258:3<292::AID-AR9>3.0.CO;2-N |
[36] | Wagatsuma A , Tamaki H , Ogita F . Capillary supply and gene expression of angiogenesis-related factors in murine skeletal muscle following denervation. Exp Physiol. (2005) ;90: :403–9. doi: 10.1113/expphysiol.2004.029769 |
[37] | Carpenter S , Karpati G . Necrosis of capillaries in denervation atrophy of human skeletal muscle. Muscle Nerve. (1982) ;5: :250–4. doi: 10.1002/mus.880050313 |
[38] | Gorman JL , Liu ST , Slopack D , Shariati K , Hasanee A , Olenich S , et al. Angiotensin II evokes angiogenic signals within skeletal muscle through co-ordinated effects on skeletal myocytes and endothelial cells. PLoS One. (2014) ;9: (1):e85537. doi: 10.1371/journal.pone.0085537 |


