
Ryanodine Receptor 1-Related Myopathies: Quantification of Intramuscular Fatty Infiltration from T1-Weighted MRI
Abstract
Background:
Ryanodine receptor 1-related myopathy (RYR1-RM) can present with a selective pattern and gradient of intramuscular fatty infiltration (IMFI) on magnetic resonance imaging (MRI).
Objective:
To demonstrate an automated protocol for quantification of IMFI in the lower extremity muscles of individuals with RYR1-RM using T1-weighted MRI and to examine the relationships of IMFI with motor function and clinical severity.
Methods:
Axial images of the lower extremity muscles were acquired by T1-weighted fast spin-echo and short tau inversion recovery (STIR) sequences. A modified ImageJ-based program was used for quantification. IMFI data was analyzed by mode of inheritance, motor function, and clinical severity.
Results:
Upper and lower leg IMFI from 36 genetically confirmed and ambulatory RYR1-RM affected individuals (26 dominant and 10 recessive) were analyzed using Grey-scale quantification. There was no statistically significant difference in IMFI between dominant and recessive cases in upper or lower legs. IMFI in both upper and lower legs was inversely correlated with participant performance on the motor function measure (MFM-32) total score (upper leg: p < 0.001; lower leg: p = 0.003) and the six-minute walk test (6MWT) distance (upper leg: p < 0.001; lower leg: p = 0.010). There was no significant difference in mean IMFI between participants with mild versus severe clinical phenotypes (p = 0.257).
Conclusion:
A modified ImageJ-based algorithm was able to select and quantify fatty infiltration in a cohort of heterogeneously affected individuals with RYR1-RM. IMFI was not predictive of mode of inheritance but showed strong correlation with motor function and capacity tests including MFM-32 and 6MWT, respectively.
INTRODUCTION
Pathogenic variations in the ryanodine receptor 1 (RYR1) gene (OMIM* 180901), which encodes the largest intracellular calcium-release channel critical to excitation-contraction coupling in skeletal muscle in humans (RyR1), are the most frequent cause of congenital myopathies [1]. RyR1 is a 2.2 megadalton protein responsible for gating calcium within the sarcoplasmic reticulum. RYR1-related myopathies (RYR1-RM) are variable in severity and comprise a broad disease spectrum of established and emerging phenotypes associated with dominant and recessive inheritance patterns [2]. RYR1-RM can present with a selective pattern and gradient of intramuscular fatty infiltration (IMFI) on magnetic resonance imaging (MRI). High IMFI and loss of muscle mass is associated with skeletal muscle dysfunction and increased disease severity in muscular dystrophies, sarcopenic adults and those with motor neuron disease [3–6]. Muscle biopsy remains the standard approach for assessing muscle pathology. With no approved treatment for RYR1-RM, a non-invasive reliable outcome measure is needed for monitoring disease progression and evaluating therapeutic efficacy.
In dominant RYR1-RM cases, muscle involvement is often characterized by relative sparing of the rectus femoris, adductor longus, gracilis, and tibialis anterior muscles in the lower extremity [7] while recessive cases can exhibit more widespread fatty infiltration [8]. This makes ancillary non-invasive modalities such as muscle ultrasound and MRI useful for differential diagnosis, interpretation of novel genetic findings, scoring disease severity, and objectively ass-essing treatment efficacy in ambulatory and non-ambulatory patients [9, 10]. The three-point Dixon MRI technique is a precise and accurate way to differentiate and quantify water and fat contributions in muscle tissue, as the chemical shift difference be-tween water and fat is encoded into images with different echo shifts [11]. However, this technology is not as widely available or accessible as conventional semi-quantitative T1-w spin echo MR images, where the signal intensity within a voxel is the vector sum of the fat and water signal intensities of the protons within that voxel [4]. The availability of muscle T1 MR makes this technique an appropriate tool to assess slowly progressive neuromuscular diseases [12]. Manual scoring of intramuscular fatty infiltration (IMFI) can be impractical in this heter-ogeneous group of disorders because it requires mul-tiple trained raters and relies upon subjective scoring. In comparison, many open-source software tools such as MATLAB (www.mathworks.com) and Image J (www.imagej.net/ImageJ) can obtain objective im-age information such as pixel intensity differences (thresholding) for classification. While complete automation is difficult due to the variability in image appearance, a semi-automated segmentation technique facilitated by these tools can provide a more efficient and consistent approach to extracting data from MR images compared to manual segmentation [13].
Here, we aimed to demonstrate the use of a semi-automated pixel intensity-based thresholding script developed using an open-access platform (Fiji, a version of ImageJ®), optimized for RYR1-RM selective muscle involvement to 1) quantify IMFI in dominant and recessive RYR1-RM cases from whole muscle segmentation of T1-w MRI, and 2) examine the relationships between IMFI and motor function/capacity and clinical severity.
METHODS
Participants
Baseline, T1-weighted MRI data from 36 individuals [males, n = 16 (44%); adults, n = 24 (67%)] were obtained from the natural history lead-in phase of a previously reported randomized controlled trial for RYR1-RM (NCT02362425) [14]. Mean age at the time of MRI scan was 28.3 years (range = 7–62 years). All study procedures were approved by a National Institutues of Health (NIH) Institutional Review Board. All participants provided informed consent/assent prior to commencing the study. Eligibility criteria included (a) confirmatory genetic report of RYR1-RM, (b) ambulatory, (c) clinically symptomatic and, if available, (d) a muscle biopsy report indicative of RYR1-RM histopathology. Individuals completed baseline study visits at the NIH Clinical Center, Bethesda, MD, USA between March 2015 and September 2017.
Clinical severity scoring
Clinical severity was determined using a previously reported 8-point scale based on ambulatory and respiratory function in RYR1-RM, with 0–4 rated as mild and 5–8 rated as severe [15].
Functional outcome assessments
The motor function measure (MFM)-32 and six-minute walk test (6MWT) were administered by one of two physical therapists for assessment of motor function and capacity, respectively. Inter-rater reliability for the MFM-32 was previously established for these two physical therapists [16]. The MFM-32 is a valid and reliable measure used to assess motor function in individuals with neuromuscular disease. It consists of 3 domains that assess standing position and transfers (domain 1, D1), axial and proximal motor function (domain 2, D2), and distal motor function (domain 3, D3) [17]. The 6MWT was performed in accordance with the modified American Thoracic Society Guidelines using a 50 m length course [18].
MRI
MRI measurements used for this analysis were performed at the baseline study visit (natural history phase). A trained technician conducted muscle ima-ging at the NIH Radiology Department using a sin-gle 3T whole-body MRI system (Verio, Siemens Medical Systems, Erlangen, Germany) and flexible phased array body-matrix coils. Axial images of the lower extremity muscles were acquired by T1-wei-ghted (T1-w) fast spin-echo and short tau inversion recovery (STIR) sequences with the following para-meters: T1-w, TR/TE = 600/20 ms, echo train length = 4, slice thickness/gap = 8 mm/20%, resolution = 1.4×1.0 mm, one average. STIR, TR/TE/TI = 5600/82/220 ms, echo train length = 15, slice thickness/gap = 8mm/20%, resolution = 1.2×1.0 mm, one average. Muscle involvement pattern was defined for each case using previously reported criteria for RYR1-RM [8, 19]; cases were classified as either “typical” if muscle involvement pattern was similar to those described or associated with RYR1 variations or “uninformative” if the changes were mild or nonspecific. The T1-w image quality were reviewed by a neurologist not affiliated with the study, and a series of ten representative MRI slices from the upper and lower extremities of each participant was selected for fatty infiltration quantification.
ImageJ-based script for image analysis
We developed a script to automatically quantify contractile (hypointense) and non-contractile (hyperintense) tissue from whole muscle segmentation within axial sections of the thigh and calf regions, referenced to the average signal intensity of a local region in each participant’s MRI. Analyses were conducted using Fiji and Java software (Windows 64-bit, Mac OS and Mac OS X). MRI slices from within the maximal volume of the thigh and calf regions (10 each) were initially selected; single images were then chosen to minimize the amount of artifact from each region. Using the script, the folder containing these images is selected, and the images are automatically loaded into Fiji for thresholding analysis. Thresholding (the difference in pixel intensities) is a critical step in segmentation as it determines the accuracy and differentiation between the foreground (area of interest) and background. As images can have regional differences in background, staining, and illumination, local thresholding is preferred to global thresholding.
The script was initially tested on MRI of indivi-duals with juvenile amyotrophic lateral sclerosis (ALS4) [20]. ALS4 is a rare, childhood or adoles-cent-onset autosomal dominant form of ALS chara-cterized by slow disease progression, distal muscle weakness and atrophy, and pyramidal signs associ-ated with degeneration of motor neurons in the brain and spinal cord [21, 22]. The Phansalkar local thre-sholding method was used for quantification of the ALS4 MR images as it provided the best segmen-tation [23]. In contrast, the MidGrey method of the “Auto Local Threshold” function provided the best muscle segmentation for the RYR1-RM images and was used to quantify the contractile and non-con-tractile tissue using the semi-automated code. The MidGrey method calculates the average pixel int-ensity within a local region and uses this to determine foreground vs. background (https://imagej.net/Auto_Local_Threshold.html#MidGrey)(http://homepages.inf.ed.ac.uk/rbf/HIPR2/adpthrsh.htm). This is especially useful for cases where there are regions of hyper- or hypo-intensity within a single image due to imaging errors/variability. The structures and details within these “error regions” will be preserved and more accurately segmented by comparing intensities within the area of the “error”. While the MidGrey thresholding method has been used to adjust or binarize pixelated applications involving blood vessels [24], subchondrial bone [25], and neural plasma membrane [26], to our knowledge, this is the first application in a neuromuscular disease imaging study. Manual image measurements were obtained for the bone marrow, compact bone, and subcutaneous adipose tissue. These measurements were not included (segmented out) in the analysis. IMFI was calculated as the ratio of non-contractile tissue to total tissue within the thigh muscle and leg muscle compartments.
Regions of interest on T1-w images were demarcated for analysis by a single investigator. A total of 20 images were used to confirm that the script worked in the two different patient populations (T1-w MR images from individuals with juvenile amyotrophic lateral sclerosis and RYR1-RM), with good to excellent face validity by four of the authors (TL, JT, AP, and CG) comparing MRI and their corresponding segmented images. The script was not validated against manual segmentation and analyses of selected images.
Statistical analysis
Statistical analyses were conducted using the Statistical Package for the Social Sciences (SPSS; IBM, Armonk, NY, USA), and significance was set at p < 0.05. Descriptive statistics were generated for both dominant and recessive cases. Logistic regression was used to assess whether fatty infiltration predicted inheritance pattern. An independent t-test was used to evaluate the difference between IMFI (in pixels) in the upper and lower legs in both groups. IMFI images that were not quantifiable using the image script were reported as missing. Mean fatty infiltration (average value of the sum of upper and lower leg fatty infiltration) was also analyzed. Due to non-normal distribution of the data, correlational analyses using Spearman’s rho was performed to examine the relationship between IMFI in the upper and lower legs. Motor function and capacity were measured using MFM-32 and 6MWT, respectively. Spearman’s rho correlational analysis was also used to assess the relationships between the ordinal clinical severity score and mean IMFI. The mean IMFI between participants whose clinical severity was rated as mild and severe was compared using the independent t-test. Linear regression was performed to test the effect of IMFI on MFM-32 total and ordinal clinical severity score. Since the analyses were exploratory, multiple testing adjustment was not performed on any of the tests.
RESULTS
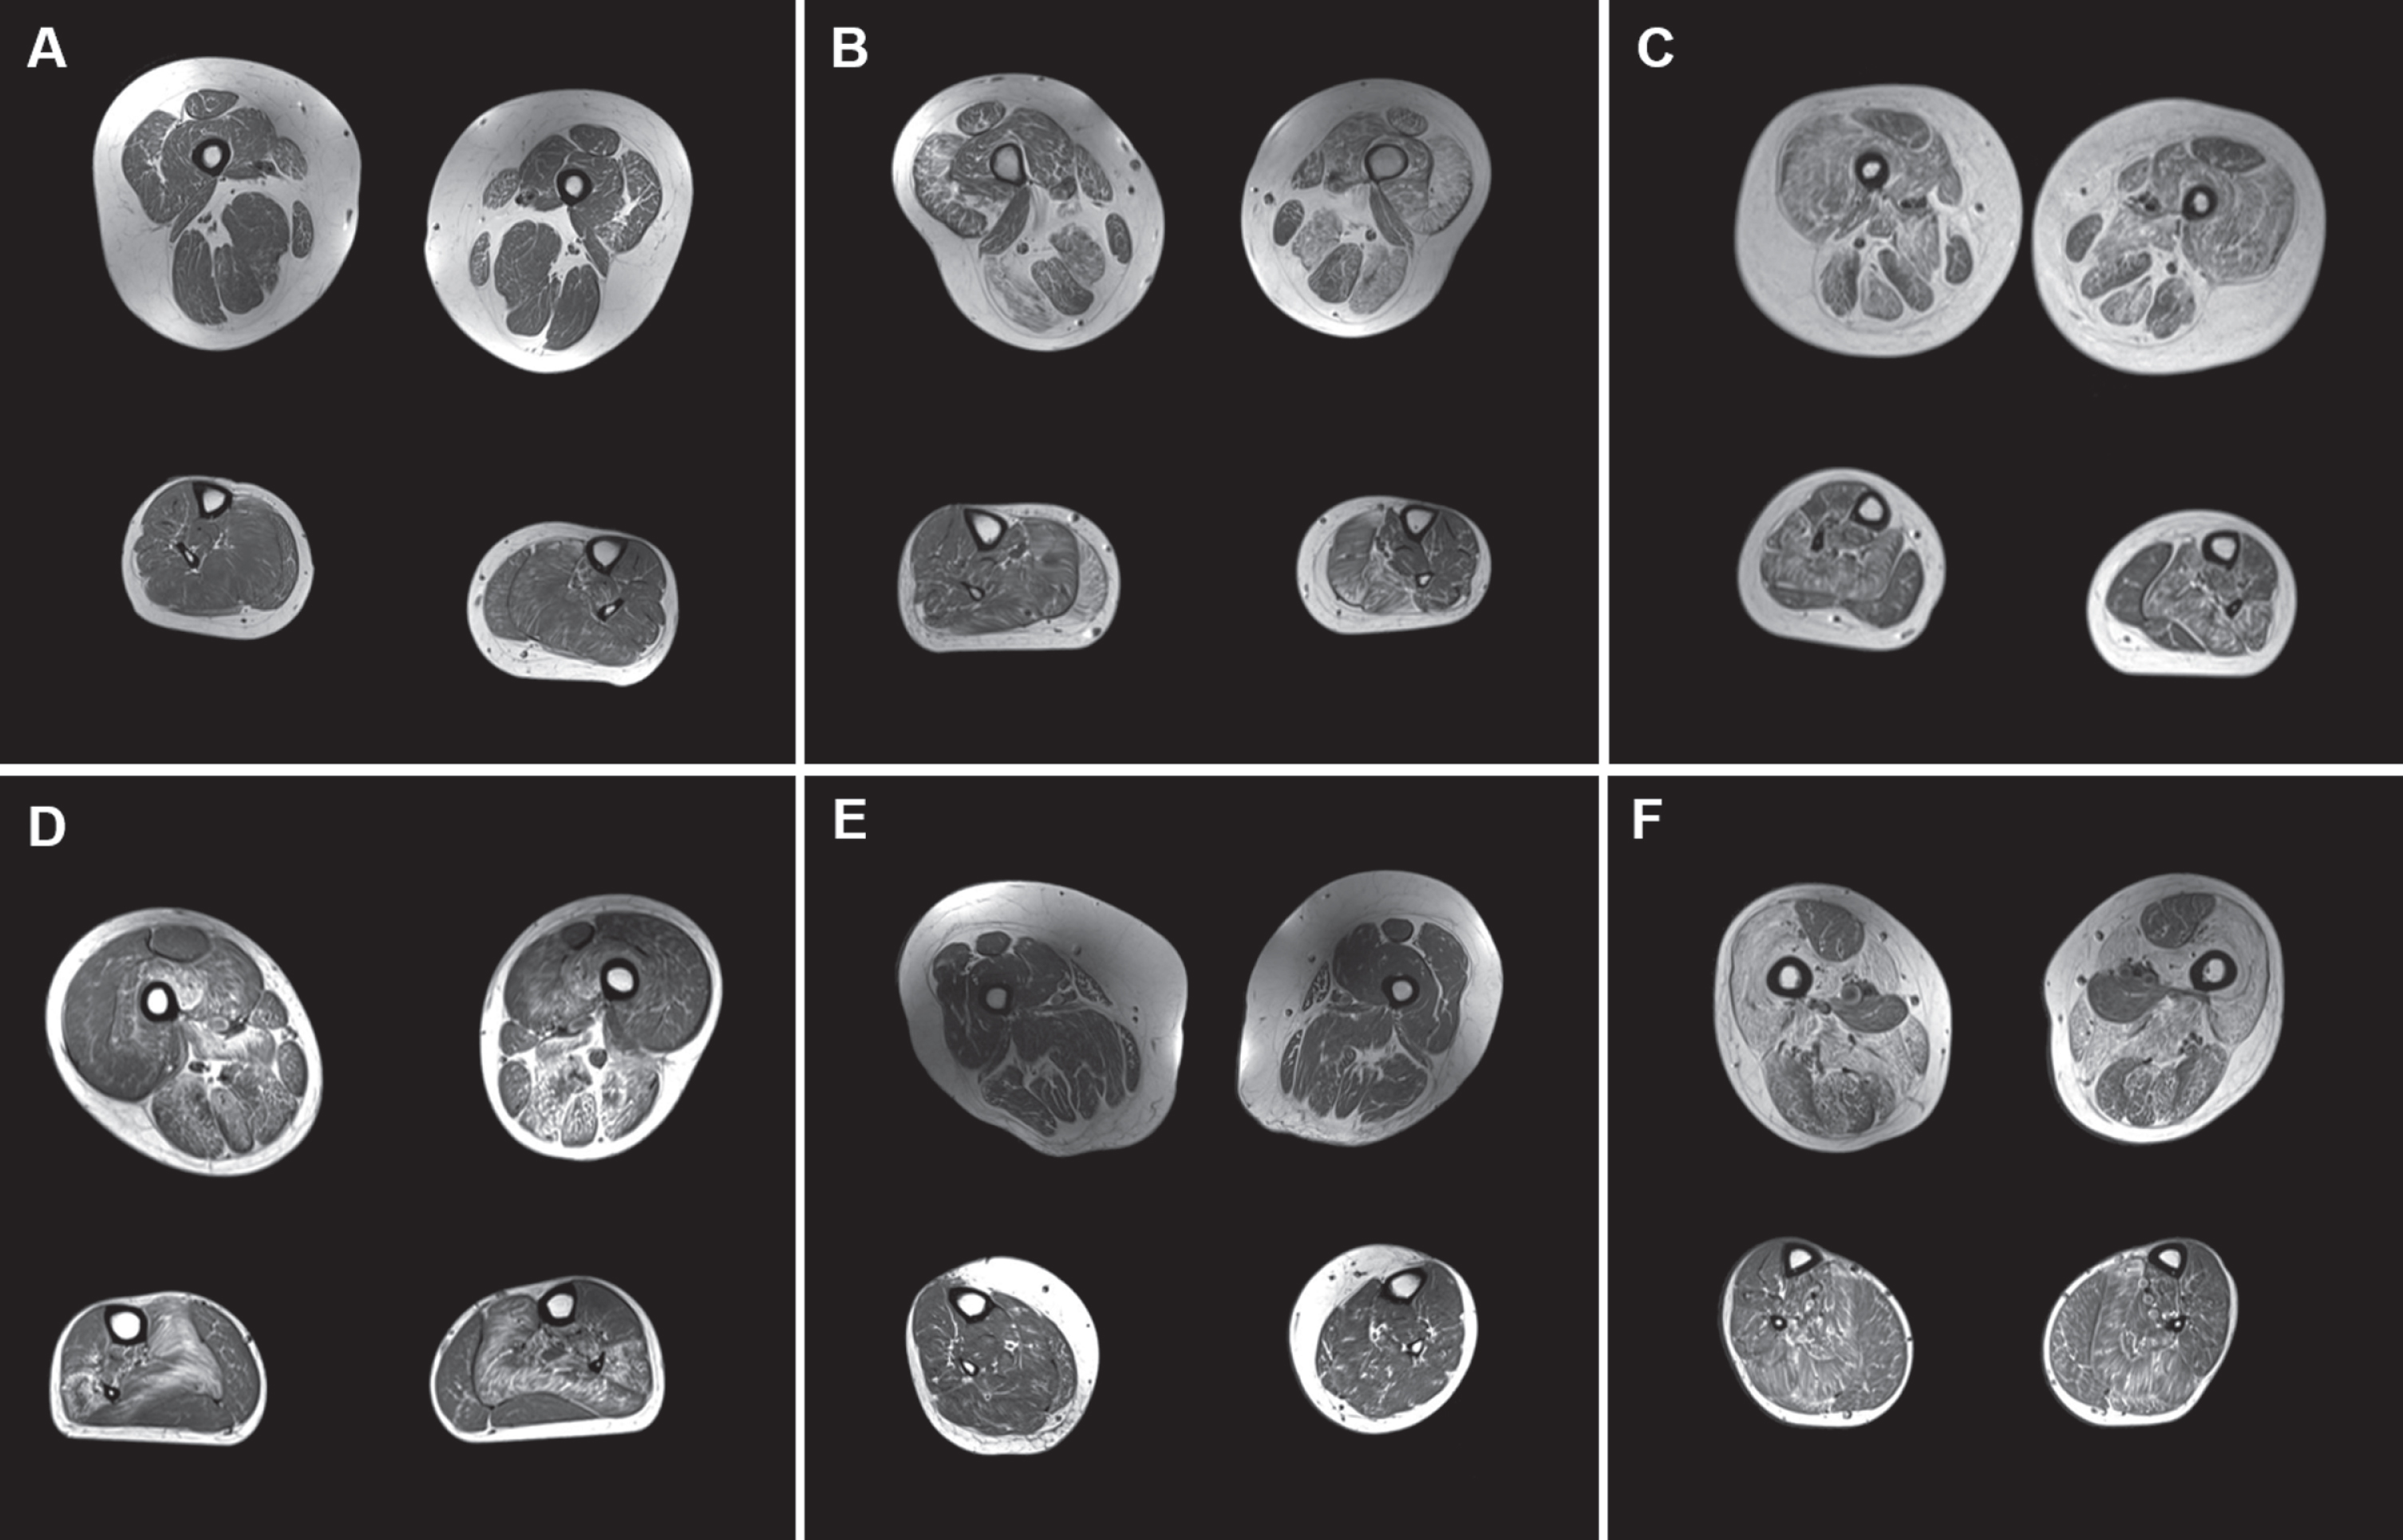
The genetic and clinical characteristics of participants are listed in (Table 1). MRI data from all 36 RYR1-RM participants (26 dominant, 10 recessive) were included in this analysis. MRI of the upper and lower leg muscles were performed for all participants. The pattern of selective muscle involvement previously described in RYR1-RM (some relative sparing of rectus femoris, adductor longus, and gracilis in the upper leg, and preferential involvement of the soleus, lateral head of the gastrocnemius, and peroneal group) [8] was generally seen in cases categorized as clinically severe, four of which had dominant inheritance in this study (Fig. 1: MRI of all 6 cases categorized as clinically severe). There was a nonspecific pattern of fatty infiltration in individuals with mild disease phenotypes. Of note, T1-w images of four individuals with RYR1-RM from the parent study were not included in the analysis due to widely varying signal intensity (B1 inhomogeneity) because manual adjustments were required following the automated measurement to adequately capture both upper and lower leg IMFI. Additionally, there were two participant MR images with upper leg IMFI measurements but lower leg measurements that required manual adjustments (Case #1 and #34), and two participant MR images with lower leg IMFI measurements but upper leg measurements requiring manual adjustments (Case #29 and #30). Only IMFI measurements not requiring manual adjustments were included in this analysis.
Table 1
Participant genetic and clinical severity rating data
| Case #/Age at MRI, y/Sex | Variant detail(s) | Mode of Inheritance | Variant classificationa | Previous report(s) for this genetic variant | Clinical severity ratingb |
| 1/7/M | c.14763C>G; p.Phe4921Leu | Dominant (de novo) | VUS | [42] | 2 |
| 2/34/F | c.7354C>T; p.Arg2452Trp | Dominant | Pathogenic | [43] | 6 |
| 3/44/F | c.14818G>A; p.Ala4940Thr | Dominant | Pathogenic | [44] | 3 |
| 4/41/M | c.14458G>A; p.Gly4820Arg | Dominant | VUS | [45] | 4 |
| 5/10/M | c.14458G>A; p.Gly4820Arg | Dominant | VUS | [45] | 4 |
| 6/13/F | c.14582G>A; p.Arg4861His | Dominant | Pathogenic | [8, 46] | 2 |
| 7/10/F | c.838C>T; p.Arg280* | Dominant (de novo) | Pathogenic | [42] | 4 |
| 8/34/M | c.6721C>T; p.Arg2241* | Recessive | Pathogenic | [47] | 4 |
| c.325C>T; p.Arg109Trp | Likely pathogenic | [8, 48] | |||
| c.2122G>A; p.Asp708Asn | VUS | [49] | |||
| c.1453A>G; p.Met485Val | VUS | [48] | |||
| 9/48/F | c.14582G>A; p.Arg4861His | Dominant | Pathogenic | [50] | 4 |
| c.13331_13351dup; p.Gly4444- | VUS | gnomAD#19:39056300 | |||
| 10/10/M | c.14807T>G; p.Leu4936Arg | Dominant (de novo) | VUS | [15] | 2 |
| 11/52/F | c.14210G>A; p.Arg4737Gln | Recessive | Pathogenic | [51] | 2 |
| c.12063_12064dupCA; p.Met4022Thrfs*4 | VUS | LOVD#0030253 | |||
| c.6797–9C>T; (intronic) | Likely benign | dbSNP#191934693 | |||
| 12/7/M | c.7354C>T; p.Arg2452Trp | Dominant | Pathogenic | [43] | 4 |
| 13/39/M | c.12083C>T; p.Ser4028Leu | Dominant | VUS | [52] | 2 |
| 14/28/M | c.14422_14423delTTinsAA; p.Phe4808Asn | Dominant | Likely Pathogenic | [53] | 4 |
| 15/38/F | c.14558C>T; p.Thr4853Ile | Dominant | Pathogenic | [54] | 2 |
| 16/43/F | c.14731G>A; p.Glu4911Lys | Dominant | Pathogenic | [55] | 3 |
| 17/8/M | c.14731G>A; p.Glu4911Lys | Recessive | Pathogenic | [56] | 2 |
| c.4711A>G; p.Ile1571Val | VUS | [46] | |||
| c.10097G>A; p.Arg3366His | VUS | [57] | |||
| c.11798A>G; p.Tyr3933Cys | VUS | [55] | |||
| 18/43/F | c.13513G>C; p.Asp4505His | Dominant | VUS | [52] | 2 |
| 19/8/M | c.13513G>C; p.Asp4505His | Dominant | VUS | [52] | 1 |
| 20/9/F | c.6721C>T; p.Arg2241* | Recessive | Pathogenic | [55] | 2 |
| c.14126C>T; p.Thr4709Met | Pathogenic | [58] | |||
| 21/57/F | c.6488G>A; p.Arg2163His | Dominant | Pathogenic | [59] | 2 |
| 22/14/M | c.1589G>A; p.Arg530His | Recessive | VUS | [60] | 2 |
| c.3127C>T; p.Arg1043Cys | VUS | [60] | |||
| c.7007G>A; p.Arg2336His | VUS | [55] | |||
| 23/53/M | c.14681C>A; p.Ala4894Asp | Dominant | VUS | [42] | 2 |
| 24/55/F | c.14818G>A; p.Ala4940Thr | Dominant | Pathogenic | [44] | 5 |
| 25/19/M | c.6671G>A; p.Arg2224His | Dominant | VUS | dbSNP#537994744 | 4 |
| c.14818G>A; p.Ala4940Thr | Pathogenic | [44] | |||
| 26/7/F | c.7166_7176del11; p.Asp2389Glyfs*16 | Recessive | Likely pathogenic | [42] | 6 |
| c.8933–1G>A (intronic) | Likely pathogenic | [58] | |||
| 27/22/F | c.4485_4500del16; p.Trp1495* | Recessive | Pathogenic | [61] | 7 |
| c.7060_7062delGTG; p.Val2354del | Likely pathogenic | [61] | |||
| 28/14/F | c.7300G>A; p.Gly2434Arg | Recessive | Pathogenic | [44] | 2 |
| c.14623A>G; p.Met4875Val | VUS | [42] | |||
| 29/59/F | c.2923C>T; p.Arg975Trp | Dominant | VUS | [62] | 6 |
| 30/27/F | c.2923C>T; p.Arg975Trp | Dominant | VUS | [62] | 2 |
| 31/62/M | c.14678G>A; p.Arg4893Gln | Dominant | Pathogenic | [19, 53] | 3 |
| 32/44/F | c.14678G>A; p.Arg4893Gln | Dominant | Pathogenic | [53] | 4 |
| 33/34/F | c.3495C>T; p.Gly1165Gly | Recessive | VUS | dbSNP#772616442 | 1 |
| c.4817G>A; p.Arg1606His | VUS | dbSNP#368399715 | |||
| c.12499G>T; p.Glu4167* | Pathogenic | dbSNP#772494345 | |||
| 34/39/M | c.6617C>T; p.Thr2206Met | Recessive | Pathogenic | [63] | 4 |
| c.9001–2A>G; (intronic) | VUS | [46] | |||
| 35/19/M | c.14582G>A; p.Arg4861His | Dominant (de novo) | Pathogenic | [8, 46] | 4 |
| 36/37/M | c.14582G>A; p.Arg4861His | Dominant | Pathogenic | [8, 46] | 5 |
aDetermined by genetic testing and validation using Alamut Visual; bClinical severity scale based on ambulatory and respiratory ratings.
Fig. 1
A-F: MRI of 6 clinically severe cases. Upper and lower leg slices from cases with clinical severity scores > 5 (A: clinical severity score = 6; B = 5; C = 6; D = 7; E = 6; F = 5) with relative sparing of rectus femoris (in A, E, and F), adductor longus and gracilis in the upper leg, and soleus being the most affected muscle in the lower leg.
IMFI by mode of inheritance
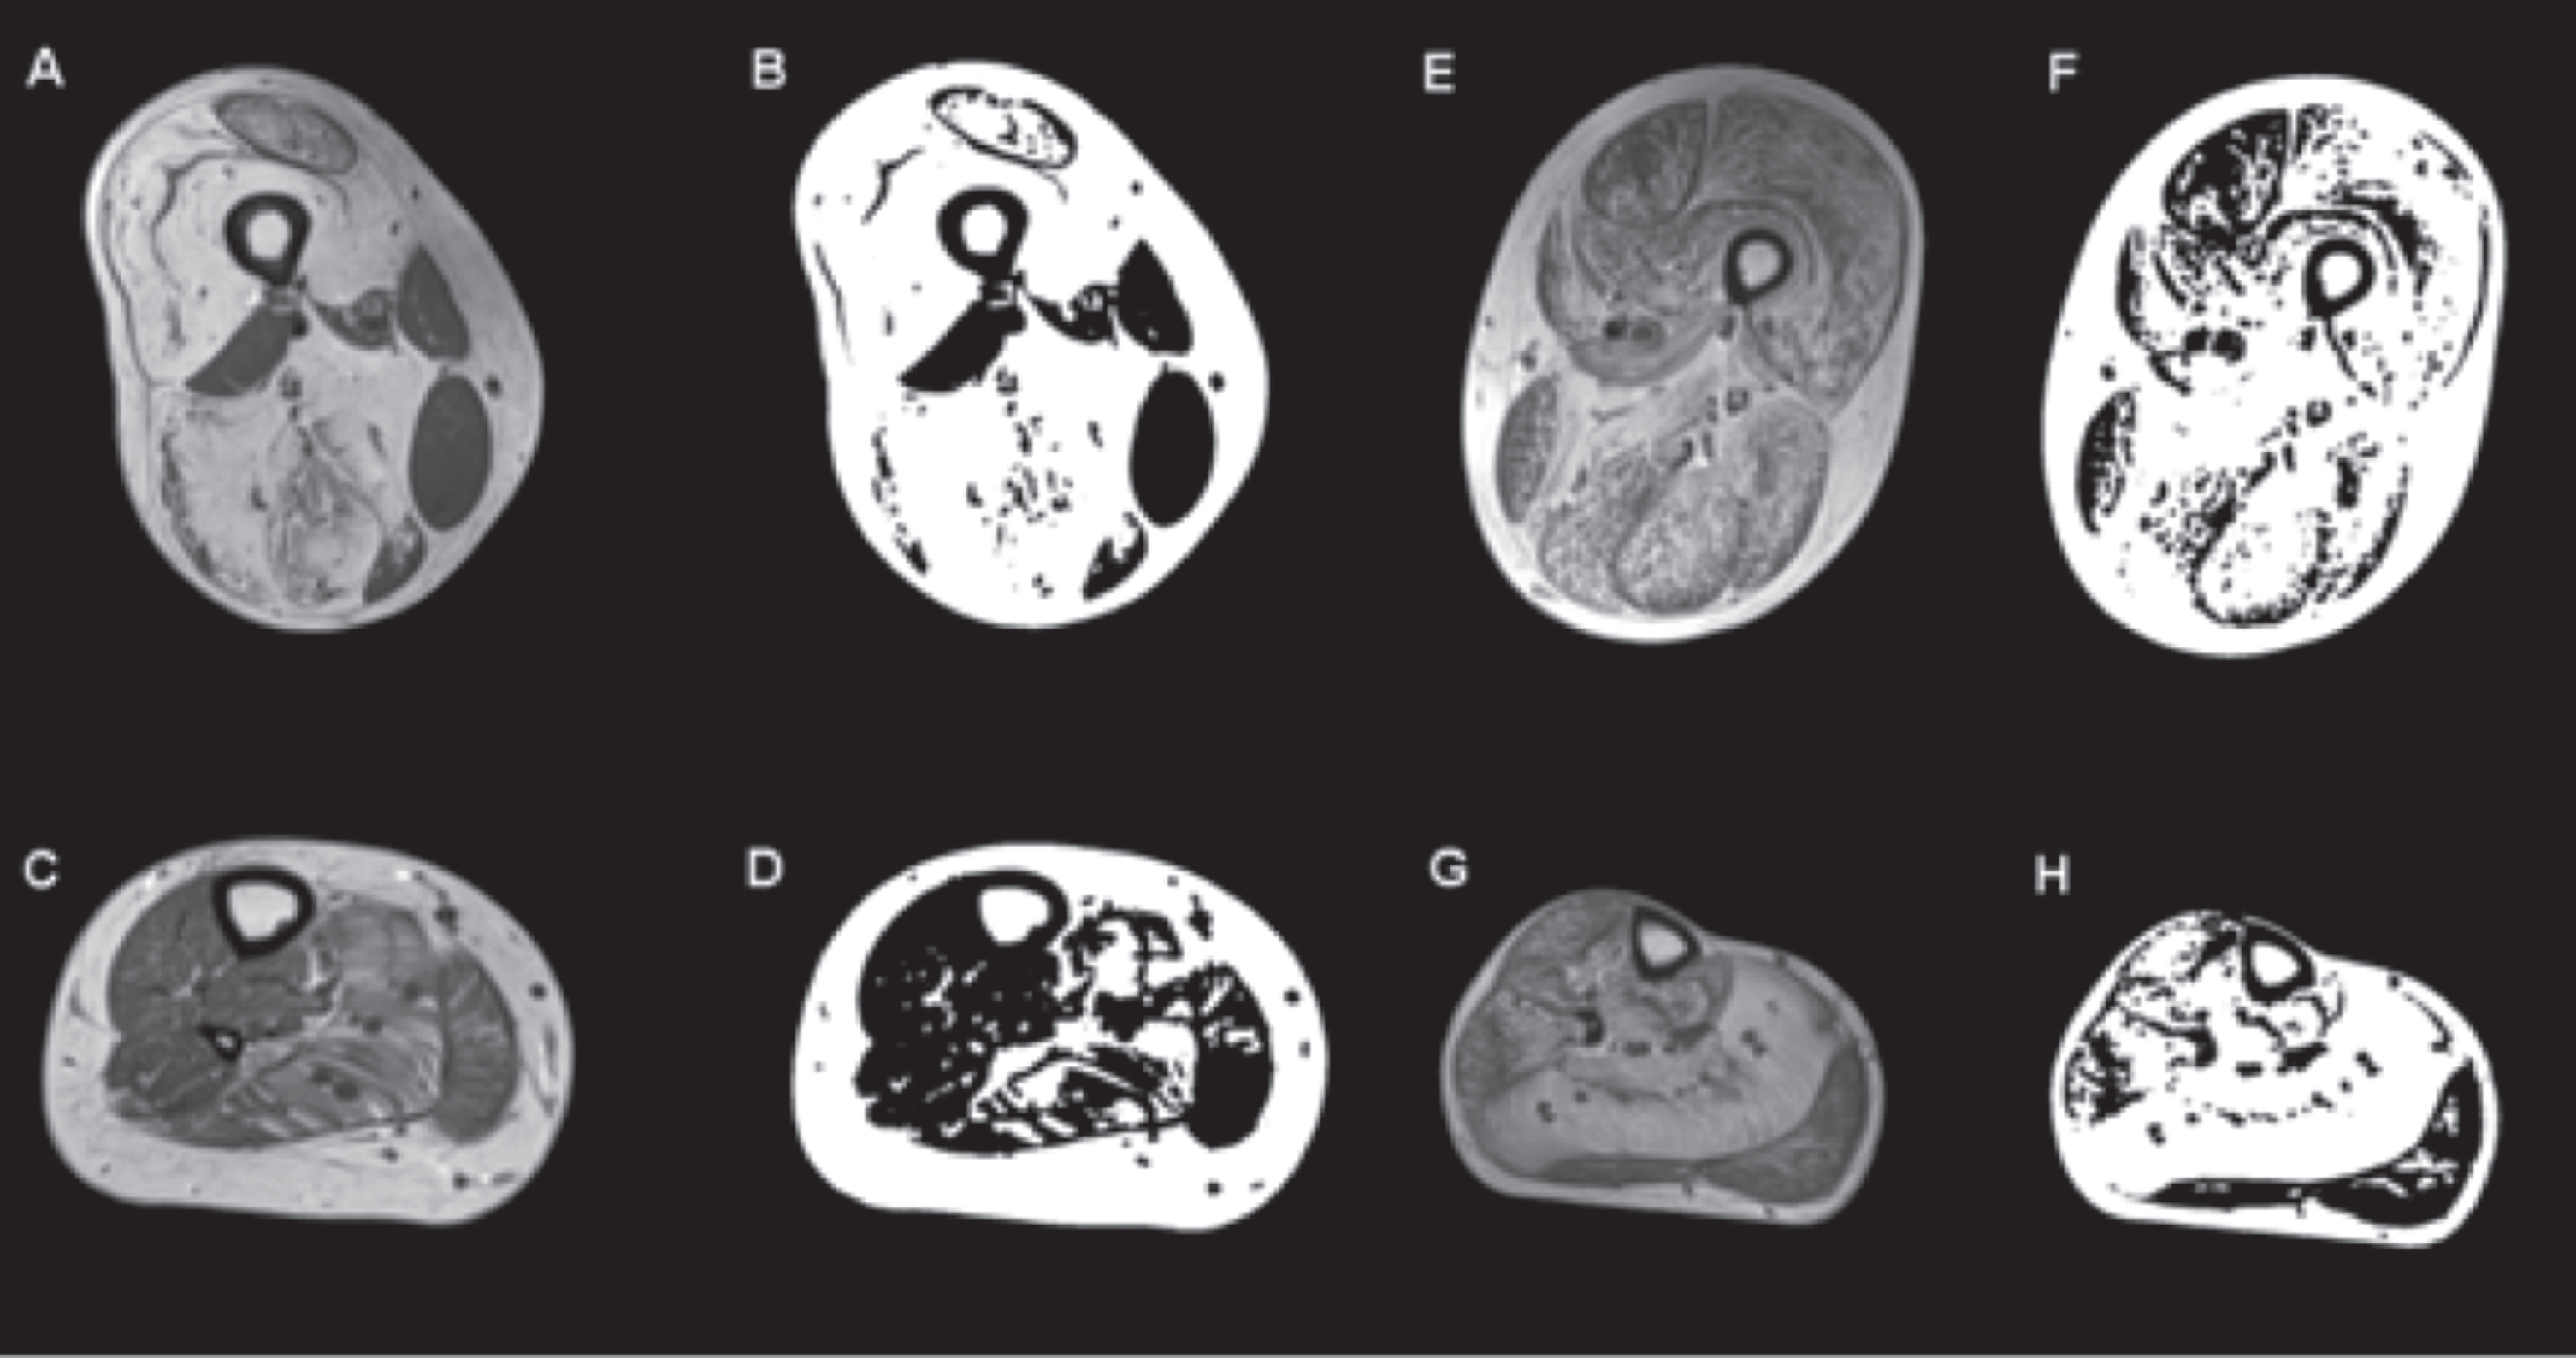
IMFI did not predict inheritance mode because there was no difference in fat quantification (pixels) between dominant and recessive cases in both upper (mean difference=–0.1018, p = 0.235) and lower legs (mean difference=–0.0097, p = 0.901) (Fig. 2).
Fig. 2
T1-weighted MRI and images generated using an ImageJ-derived quantification script showing selective muscle fatty infiltration in RYR1-RM. Transverse sections of the proximal thigh and lower leg in a dominantly inherited case (#11: A and C are the MR images of the upper and lower leg respectively, B and D are the quantification images generated by ImageJ script) and a recessive case (#8: E and G are the MR images of the upper and lower leg respectively, and F and H are their quantification images). In the dominant case, there is relative sparing of rectus femoris, adductor longus, and hypertrophied gracilis in the upper thigh, and in the lower leg the soleus and gastrocnemius lateralis are the most affected while the tibialis anterior, peroneal group, and gastrocnemius medialis are relatively spared. In the recessive case, all muscle groups are affected in the upper leg, including the tibialis anterior and peroneal group in the lower leg, with the soleus being the most affected. No statistically significant difference in intramuscular fatty infiltration was observed between dominant and recessive cases.
IMFI by age
The regression model with age as a continuous variable showed no statistically significant effect on IMFI (β= 0.002, p = 0.154). Correlation of mean fatty infiltration and clinical severity score was tested separately in adults (n = 24) and pediatric participants (<17 years, n = 12). Both correlations were not statistically significant (adults: ρ= 0.182, p = 0.429; pediatric: ρ= 0.346, p = 0.298).
IMFI and motor function/capacity
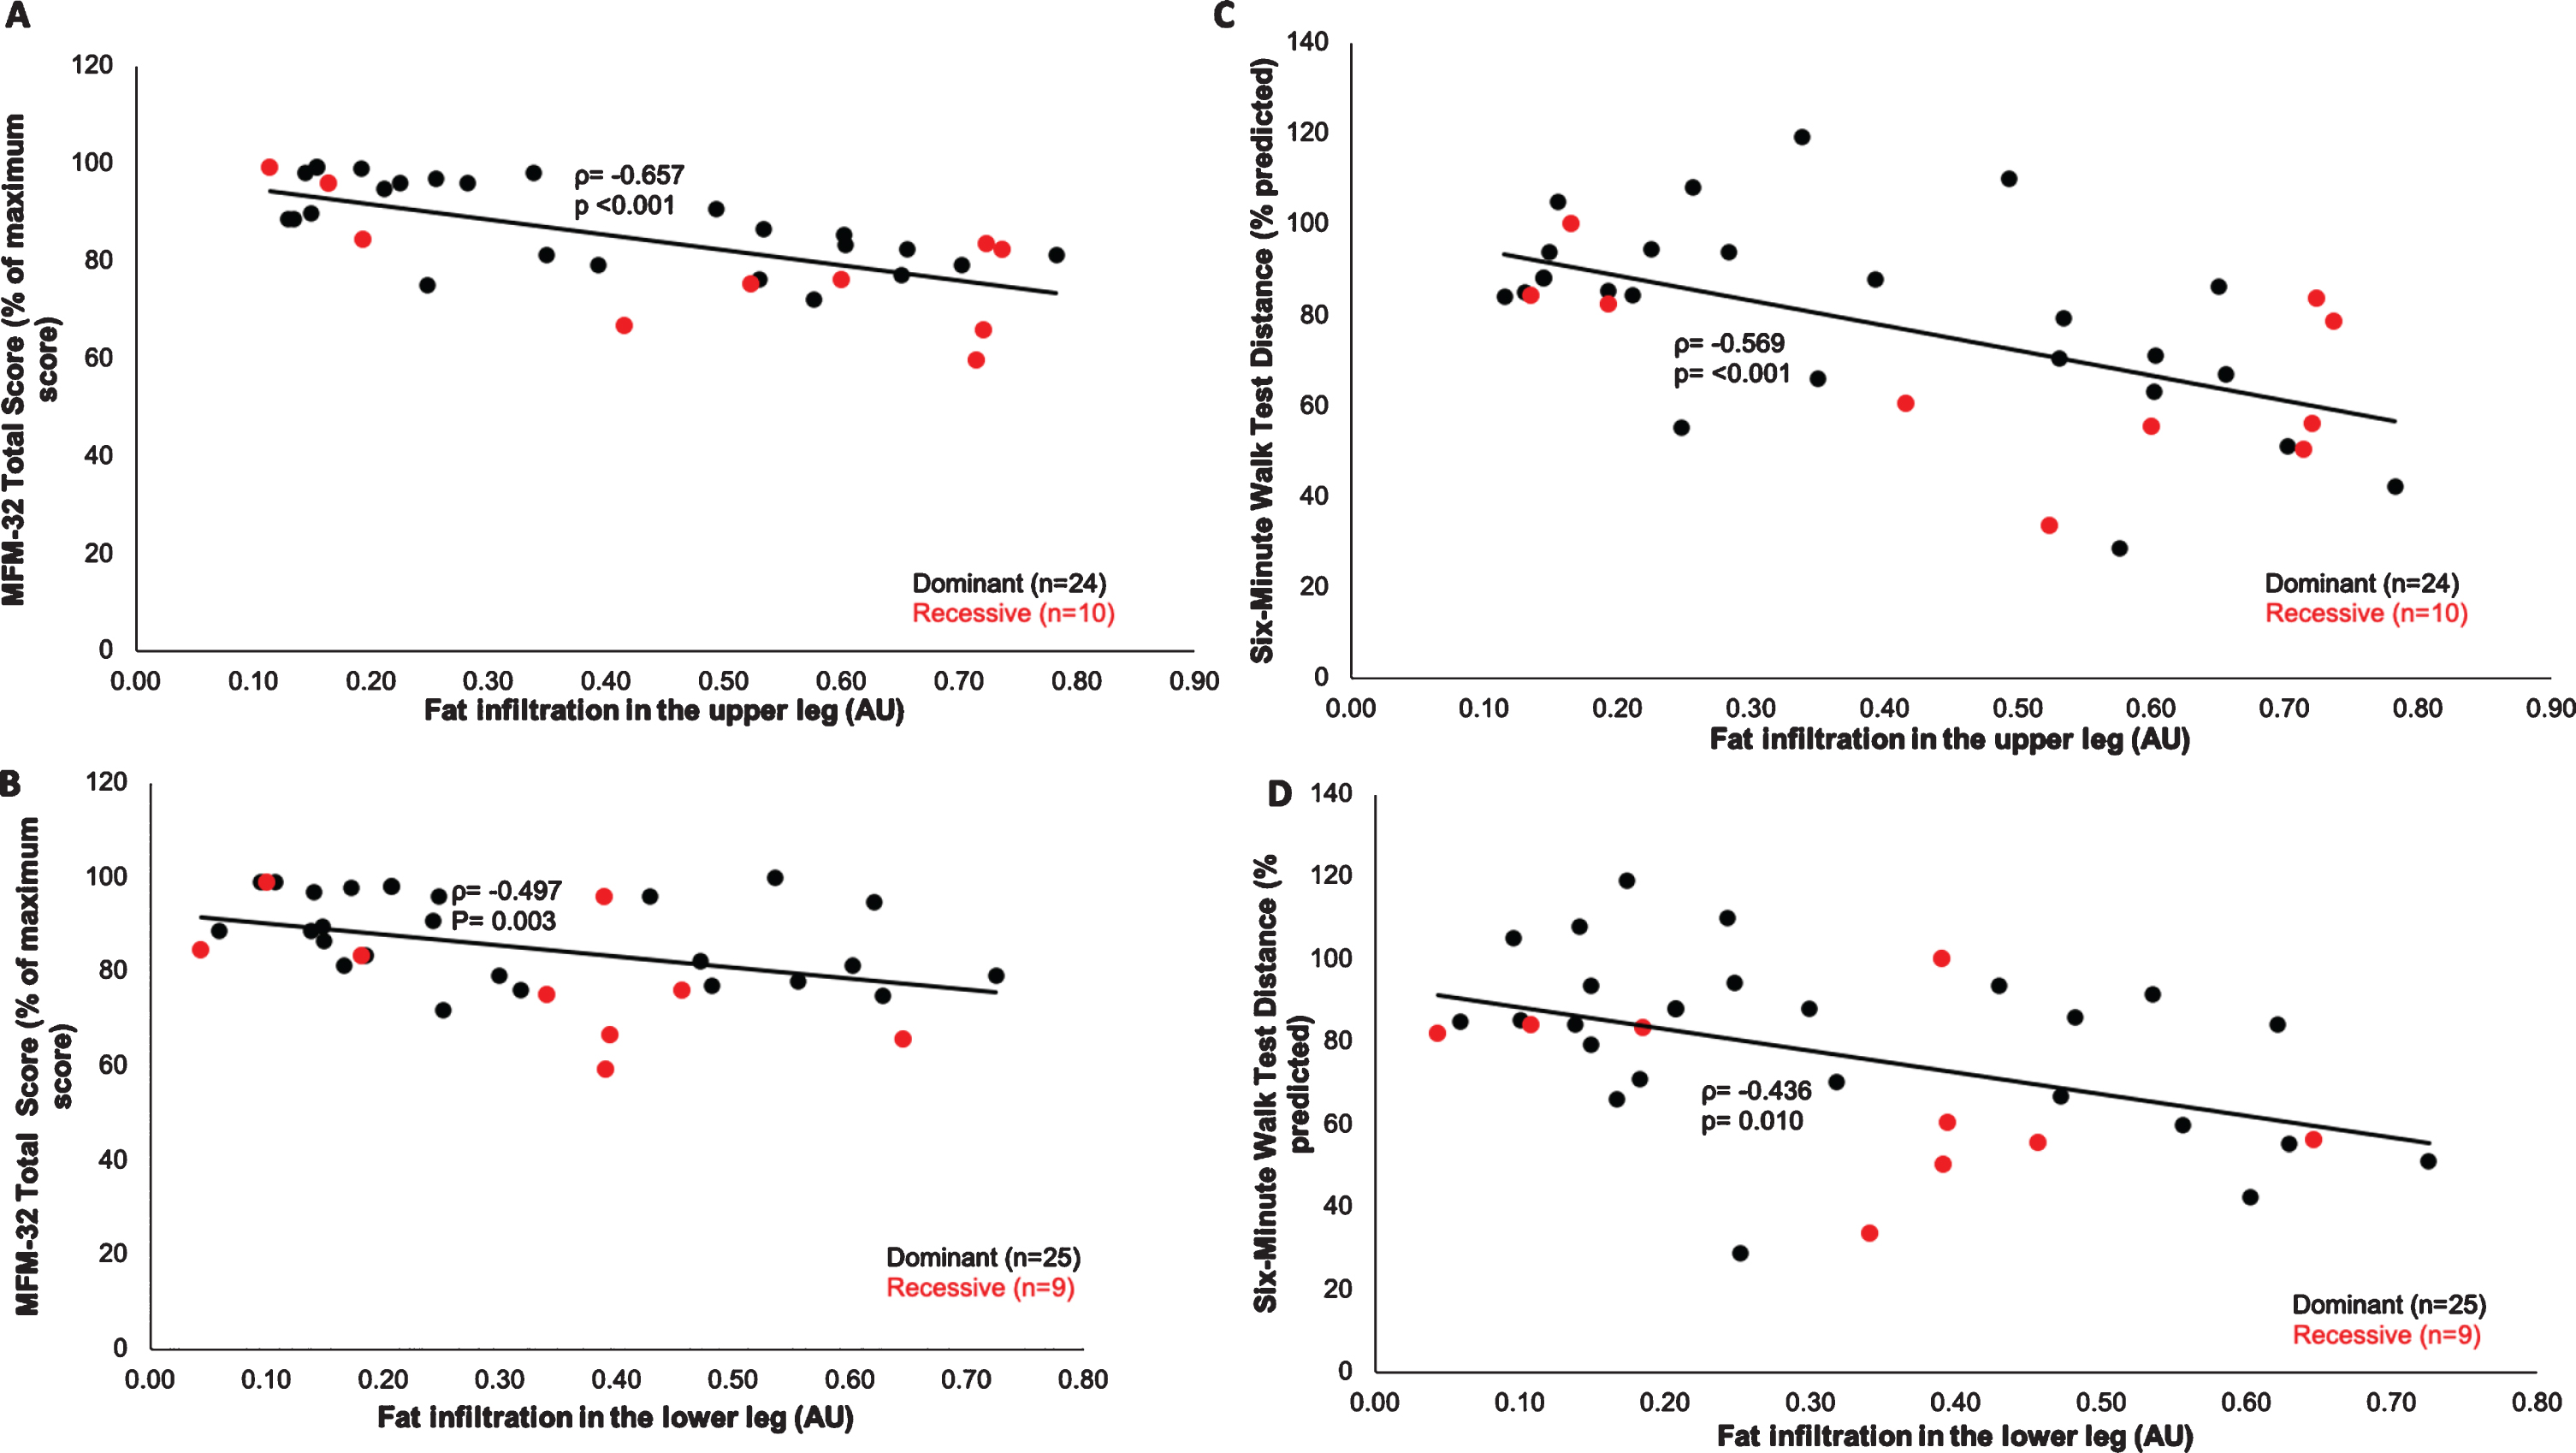
Overall, IMFI in the upper and lower legs was inversely correlated with performance on the motor function measure (MFM-32) total score (upper leg: p < .001; lower leg: p = 0.003) and the six-minute walk test (6MWT) distance (upper leg: p < 0.001; lower leg: p = 0.010), (Figs. 3A-D). Of the three MFM-32 domains, Domain 1(standing and transfers) had the strongest correlation with IMFI (upper leg: ρ=–0.698, p < 0.001, lower leg: ρ=–0.513, p = 0.002) compared to Domains 2 - axial and proximal motor capacity (upper leg: ρ=–0.320, p = 0.065; lower leg: ρ=–0.215, p = 0.222) and 3 - distal motor capacity (upper leg: ρ=–0.348, p = 0.044; lower leg: ρ=–0.329, p = 0.057).
Fig. 3
Bivariate correlations between muscle fatty infiltration and motor function in RYR1-RM. (A-B) Muscle fatty infiltration was inversely correlated with MFM-32 total score (upper leg: Spearman’s rho (ρ) = –0.657, p < 0.001; lower leg: ρ= –0.497, p = 0.003) and (C-D) 6MWT distance (upper leg: ρ= –0.569, p < 0.001; lower leg: ρ= –0.436, p = 0.010).
IMFI and clinical severity
Most participants had mild (0–4) clinical severity scores, and only six (four dominant, two recessive) of the 36 (17%) participants had scores in the severe range (5 –8). One of the six participants categorized as clinically severe was excluded from the analysis because no upper leg fatty infiltration data was captured by the MRI quantification algorithm due to poor homogeneity. The remaining five participants categorized as clinically severe had mean fatty infiltration fraction of 0.44 (range 0.26 –0.60, Table 2), while the fraction for those with mild scores was 0.33 (range 0.095 –0.74). In the clinically severe group, the two recessive cases had the highest severity scores (#40: score = 6; #41: score = 7). The correlation between IMFI and clinical severity scores was not statistically significant (Spearman’s rho = 0.239, p = 0.187), and there was no statistically significant difference in IMFI between individuals with severe and mild clinical severity scores, t (30) =–1.16, p = 0.257. Linear regression analysis showed that mean IMFI had a statistically significant effect on MFM-32 total score (F (2, 29) = 12.67, p < 0.001). Each 0.012 decrease in mean IMFI resulted in 1-unit increase in the MFM-32 total score.
Table 2
Participant measurement output from semi-automated script
| Case # | Total thigh (upper leg) area (px) | Total calf (lower leg) area (px) | Muscle area in thigh (px) A | Muscle area in calf (px) A | Fat intrusion in thigh (px) B | Fat intrusion in calf (px) B | Proportion of fat intrusion to manual inner thigh area | Proportion of fat intrusion to manual inner calf area | Mean fatty infiltration C |
| 1 | 345048 | 45035 | 73033 | 43619 | 124233 | –15772 | 0.601989 | undefined | N/A |
| 2 | 512036 | 364306 | 177608 | 187869 | 100390 | 40549 | 0.349393 | 0.166182 | 0.257787 |
| 3 | 564723 | 366064 | 86963 | 62910 | 222463 | 191682 | 0.701896 | 0.725016 | 0.713456 |
| 4 | 278359 | 145527 | 154440 | 101369 | 38503 | 12313 | 0.19265 | 0.10041 | 0.14653 |
| 5 | 300942 | 152986 | 165752 | 36224 | 46407 | 75523 | 0.211292 | 0.621323 | 0.416307 |
| 6 | 249480 | 108043 | 24038 | 18705 | 101267 | 33813 | 0.78193 | 0.602598 | 0.692264 |
| 7 | 250949 | 115493 | 143686 | 68601 | 23531 | 11840 | 0.135175 | 0.137886 | 0.136531 |
| 8 | 232555 | 148990 | 49669 | 39490 | 139981 | 81173 | 0.721039 | 0.646138 | 0.683588 |
| 9 | 301935 | 137416 | 58262 | 36177 | 120823 | 39288 | 0.650362 | 0.481973 | 0.566167 |
| 10 | 241451 | 150732 | 110294 | 81824 | 40934 | 14849 | 0.25597 | 0.140498 | 0.198234 |
| 11 | 315550 | 170156 | 61195 | 110971 | 186184 | 26753 | 0.723815 | 0.184964 | 0.454389 |
| 12 | 323159 | 179369 | 199109 | 106936 | 37162 | 20346 | 0.148936 | 0.148219 | 0.148578 |
| 13 | 404769 | 203672 | 145561 | 118014 | 154550 | 41000 | 0.493393 | 0.242654 | 0.368024 |
| 14 | 413706 | 186003 | 132136 | 72329 | 91515 | 34419 | 0.393045 | 0.299324 | 0.346185 |
| 15 | 403589 | 215758 | 72194 | 112778 | 91825 | 21095 | 0.533441 | 0.148845 | 0.341143 |
| 16 | 263017 | 191133 | 91677 | 100686 | 49844 | 22877 | 0.338185 | 0.173185 | 0.255685 |
| 17 | 289173 | 114468 | 60021 | 41998 | 73229 | 24374 | 0.523592 | 0.340628 | 0.43211 |
| 18 | 345450 | 196422 | 183927 | 130951 | 35360 | 14826 | 0.155033 | 0.095082 | 0.125057 |
| 19 | 354703 | 244299 | 193907 | 147843 | 30206 | 9830 | 0.13005 | 0.059177 | 0.094613 |
| 20 | 223507 | 140068 | 144629 | 91426 | 19914 | 12200 | 0.114619 | 0.107735 | 0.111177 |
| 21 | 502713 | 164888 | 238771 | 43452 | 82993 | 92640 | 0.247705 | 0.628767 | 0.438236 |
| 22 | 267003 | 131234 | 162752 | 92900 | 40652 | 4568 | 0.193333 | 0.043595 | 0.118464 |
| 23 | 361282 | 136046 | 201510 | 80025 | 62369 | 28683 | 0.225365 | 0.247872 | 0.236619 |
| 24 | 237080 | 112684 | 70552 | 54167 | 85401 | 27587 | 0.530056 | 0.317413 | 0.423734 |
| 25 | 274522 | 172376 | 189258 | 102723 | 33813 | 30142 | 0.144307 | 0.207899 | 0.176103 |
| 26 | 292933 | 152530 | 44893 | 51114 | 124254 | 36793 | 0.714572 | 0.391702 | 0.553137 |
| 27 | 326038 | 170114 | 142020 | 78541 | 106776 | 57233 | 0.416308 | 0.394528 | 0.405418 |
| 28 | 231319 | 186672 | 41793 | 54439 | 70847 | 51890 | 0.600088 | 0.456646 | 0.528367 |
| 29 | 344332 | 156715 | 146683 | 81701 | –39923 | 109803 | undefined | 0.555382 | N/A |
| 30 | 276423 | 103702 | 138724 | 69402 | –39781 | 85819 | undefined | 0.535328 | N/A |
| 31 | 265107 | 154347 | 45949 | 58028 | 70934 | 21195 | 0.576245 | 0.251522 | 0.413883 |
| 32 | 217135 | 185449 | 79440 | 91755 | 34081 | 75696 | 0.282788 | 0.429128 | 0.355958 |
| 33 | 203473 | 125567 | 88182 | 66102 | 18236 | 45164 | 0.164894 | 0.390418 | 0.277656 |
| 34 | 429401 | 193952 | 75135 | 81802 | 242858 | –6075 | 0.736348 | undefined | N/A |
| 35 | 345678 | 184929 | 78036 | 101498 | 133503 | 25754 | 0.602799 | 0.182172 | 0.392485 |
| 36 | 319436 | 163533 | 74899 | 67354 | 160589 | 65890 | 0.655738 | 0.471438 | 0.563588 |
A: All black regions in pixels calculated as follows: (total image area –total thigh or calf area) –compact bone; B: Fat intrusion in pixels = manual inner thigh area - muscle area –compact bone with bone marrow. C: average value of the sum of upper and lower leg fatty infiltration; Undefined: data not automatically analyzed and reported by image script. Supplementary Material: ImageJ-based algorithm used for intramuscular fatty infiltration quantification attached.
DISCUSSION
IMFI is a clinical feature of myopathy, and evaluation by MRI is a valuable non-invasive tool that can aid disease diagnosis [27, 28]. In dystrophic muscle diseases, MRI can function as a sensitive and objective biomarker of muscle function and treatment efficacy in ambulatory and non-ambulatory patients [9, 29–31].The selective pattern of IMFI in RYR1-RM has been described in both dominant and recessive cases [8, 19, 27]. In this study, we aimed to quantify the IMFI in dominant and recessive RYR1-RM cases using pixel intensity-based thresholding of cross-sections of T1-w MRI and to examine the relationship of IMFI with motor function and clinical severity, respectively.
Recessive cases of RYR1-RM typically present with extensive fatty and connective tissue infiltration in comparison to dominant cases, but severe dominant cases can also have extensive fatty infiltration [32]. However, IMFI did not predict mode of inheritance in this study as there was no difference in fa-tty infiltration between dominant and recessive cases in either the upper or lower leg IMFI quantification. The lack of difference in fatty infiltration between dominant and recessive cases in this study may be due in part to the fact that inclusion criteria required all participants to be ambulatory; thus the most severe recessive cases of RYR1-RM, with potentially greater fatty infiltration, were excluded. Nonetheless, the gradient of IMFI in affected muscle group, in addition to the pattern of relatively spared muscles, can provide useful diagnostic information specific to RYR1-RM especially in cases with equivocal genetic and histopathologic findings [8, 19].
IMFI from both dominant and recessive cases showed moderate to strong inverse correlation with MFM-32 and 6MWT distance, two well-described and validated measures of motor function and capacity in neuromuscular diseases [33, 34]. Of all three domains of the MFM-32, IMFI correlated strongest with domain 1 (standing and transfers) (upper leg: ρ=–0.698, p < 0.001; lower leg: ρ=–0.513, p = 0.002). This association is consistent with our previous findings that the standing and transfers domain of the MFM-32 reflects the greatest motor deficits in individuals with RYR1-RM [33, 35]. We found that IMFI predicted MFM-32 scores in this study. Further work is needed to establish the utility of MRI IMFI quantification as a biomarker of disease progression.
The clinical severity scale is based on ambulatory and respiratory ratings and suggests that increased IMFI could lead to ambulatory dysfunction in individuals with RYR1-RM. Additionally, decreased RyR1 expression and increased IMFI are associated with high clinical severity scores [15]. However, there was no difference in mean IMFI between participants with mild and severe clinical severity scores in this study. The clinical relevance of this finding remains uncertain due to the small sample size, especially of severe participants with MRI analyzed (n = 5).
Limitations
This image processing algorithm uses intensity for image analysis; therefore, image quality and distortions in tissue intensities can affect its performance. Quantification of IMFI using T1-w imaging presents with inhomogeneity (static (B0) and radiofrequency (B1)) at both clinical (up to 3T) and ultra-high (≥7 T) field strengths [36]. This can be mitigated by a con-sistent reference within the tissue such as the bone marrow and patient positioning [30]. Although consistent bone marrow referencing and positioning was performed, the ImageJ script developed for this study was not able to adequately quantify both upper and lower leg T1-w images from four participants and either upper or lower leg images from an additional 4 participants due to the quality (“shadows”) of the images without manual alterations (Table 2). The in-compatibility of the script with field inhomogenei-ties typically seen on T1-w MR images underscores the importance of establishing parameters of control (ideally inhomogeneity-free) MR images prior to scoring patient MR images. This introduces syste-matic bias to the generated output based on intensity non-uniformity (intensity of the same tissue varies with the location of the tissue within the image). Promising work is ongoing to incorporate inhomogeneity correction capabilities (intensity variation-based evaluation) into the script. Nevertheless, the script automatically analyzed 34 out of 40 (85%) T1-w images of both upper and lower legs. Although inter-rater variability may be low for certain image segmentations [37], manual analysis of IMFI is time-consuming, subjective, user-dependent, and more likely to be influenced by the quality of the ground truth (MR image and reference points selected within the same tissue) compared to automated or semi-automated analysis [38]. Using a chemical shift imaging method such as the 3-point Dixon technique for future imaging and analyses, especially in severely affected muscle, is recommended to avoid inhomogeneities [39]. However, the use of MRI and MR spectroscopy (MRS) apart from the Dixon technique continue to predict clinical function. A recent study by Barnard and colleagues showed that fat fraction as measured by MRS correlated with decline in 6MWT and 10 m walk/run velocity [31]. In the same study, fat fraction by MRS also predicted loss of ambulation in individuals affected with Duchenne muscular dystrophy. Ability to ambulate independently was an eligibility criterion for the parent study, which likely limited recruitment of recessive cases with the most severe clinical presentations. This may have also influenced our observation of the typical pattern of involvement in recessive versus dominant cases. Stratification to evaluate the impact of IMFI on function and capacity by age group was not conducted due to the small sample size of our dataset. The small number of recessive and clinically severe cases available for this analysis may have been insufficient to identify differences in IMFI between mode of inheritance and clinical severity score subgroups. Additionally, a limitation of this finding is the lack of systematic data collection on research participant exercise regimen in the home setting, a known confounder of IMFI and activity level. Age-matched controls were not measured for this study. The range of fatty infiltration in this disease cohort is much higher than would be expected for healthy controls. A study comparing IMFI content in otherwise healthy individuals showed that older adults had higher IMFI contents than younger adults (9.5%to 14.3%vs. 4.8%to 8.6%, respectively) in volume-based measurements [40], which are appreciably lower than the proportions of IMFI measured in this study (9.5%to 71%). This would suggest that disease is a significant driver of IMFI in this cohort, as age group differences are not likely to primarily account for these results. While the changes in fatty infiltration are likely disease associated, the lack of age-matched controls in this study limits the ability to confidently conclude that fatty changes are driven only by disease. Finally, although not included in the original study protocol, the script could have been validated using a semi-quantitative scoring method such as the modified Mercuri scale [41] rating of T1-w MR imaging signal intensity differences.
CONCLUSIONS
T1-w MRI can be effectively used to quantify IMFI in RYR1-RM, a clinically and histopathologically heterogeneous group of disorders, using a modified ImageJ-based algorithm. In this exploratory analysis, IMFI was not predictive of mode of inheritance but showed strong correlations with the motor function and capacity tests MFM-32 and 6MWT, respectively. While these findings are noteworthy, future work is needed to validate the association of IMFI and disease severity with a larger representation of individuals with recessive modes of inheritance. Standardized MRI acquisition protocols and quantification programs can be used to quantify IMFI in individuals affected with neuromuscular disorders such as RYR1-RM. However, additional investigation and validation are needed to develop a reliable T1-w image-based algorithm for monitoring disease progression and evaluating therapeutic efficacy in this heterogeneous group of disorders.
ACKNOWLEDGMENTS
This work was funded by the Intramural Research Programs of the National Institute of Nursing Research (NINR) and National Institute of Neurological Disorders and Stroke (NINDS), and the NIH Radiology Department. The authors sincerely thank the individuals who participated in the RYR1-RM clinical trial from which this data was obtained, Karez Hawkins for scheduling participants for MRI appointments, Mary M. Cosgrove for data management, the Radiology Department at the NIH for administering all the MRI, Dr. Joan Austin (Indiana University) and CDR Malini Krishnan (Centers for Medicare & Medicaid Services) for reviewing the manuscript, and Dr. Glenn Walter (University of Florida) for his direction on MRI segmentation approaches.
AUTHOR CONTRIBUTIONS
Conception and design of the study: TAL, AP, JJT, MSR, CG, KGM.
Acquisition and analysis of data: CYL, MSJ, MW, MSR, ICC, JWW, MEB, TAL, AP, JJT, XZ.
Drafting of the manuscript: TAL, AP, JJT, XZ, CG, KGM.
CONFLICTS OF INTEREST
The authors declare no conflict of interest.
REFERENCES
[1] | Darras BT RJ JJ , Ryan MM , et al. Neuromuscular disorders of infancy, childhood, and adolescence: A clinician’s approach. Neurogenetics. London: Elsevier; (2014) . |
[2] | Gonorazky HD , Bonnemann CG , Dowling JJ . The genetics of congenital myopathies. Handb Clin Neurol. (2018) ;148: :549–64. |
[3] | Buch A , Carmeli E , Boker LK , Marcus Y , Shefer G , Kis O , et al. Muscle function and fat content in relation to sarcopenia, obesity and frailty of old age–An overview. Exp Gerontol. (2016) ;76: :25–32. |
[4] | Finlayson S , Morrow JM , Rodriguez Cruz PM , Sinclair CD , Fischmann A , Thornton JS , et al. Muscle magnetic resonance imaging in congenital myasthenic syndromes. Muscle Nerve. (2016) ;54: (2):211–9. |
[5] | Klickovic U , Zampedri L , Sinclair CDJ , Wastling SJ , Trimmel K , Howard RS , et al. Skeletal muscle MRI differentiates SBMA and ALS and correlates with disease severity. Neurology. (2019) ;93: (9):e895–e907. |
[6] | Liu GC , Jong YJ , Chiang CH , Jaw TS . Duchenne muscular dystrophy: MR grading system with functional correlation. Radiology. (1993) ;186: (2):475–80. |
[7] | Fischer D , Herasse M , Ferreiro A , Barragan-Campos HM , Chiras J , Viollet L , et al. Muscle imaging in dominant core myopathies linked or unlinked to the ryanodine receptor 1 gene. Neurology. (2006) ;67: (12):2217–20. |
[8] | Klein A , Jungbluth H , Clement E , Lillis S , Abbs S , Munot P , et al. Muscle magnetic resonance imaging in congenital myopathies due to ryanodine receptor type 1 gene mutations. Arch Neurol. (2011) ;68: (9):1171–9. |
[9] | Fischer D , Bonati U , Wattjes MP . Recent developments in muscle imaging of neuromuscular disorders. Curr Opin Neurol. (2016) ;29: (5):614–20. |
[10] | Willcocks RJ , Rooney WD , Triplett WT , Forbes SC , Lott DJ , Senesac CR , et al. Multicenter prospective longitudinal study of magnetic resonance biomarkers in a large duchenne muscular dystrophy cohort. Annals of Neurology. (2016) ;79: (4):535–47. |
[11] | Kovanlikaya A , Guclu C , Desai C , Becerra R , Gilsanz V . Fat quantification using three-point dixon technique: in vitro validation. Acad Radiol. (2005) ;12: (5):636–9. |
[12] | Mercuri E , Pichiecchio A , Allsop J , Messina S , Pane M , Muntoni F . Muscle MRI in inherited neuromuscular disorders: Past, present, and future. J Magn Reson Imaging. (2007) ;25: (2):433–40. |
[13] | Banerjee P , Hu M , Kannan R , Krishnaswamy S . A Semi-automated Approach to Improve the Efficiency of Medical Imaging Segmentation for Haptic Rendering. J Digit Imaging. (2017) ;30: (4):519–27. |
[14] | Todd JJ , Lawal TA , Witherspoon JW , Chrismer IC , Razaqyar MS , Punjabi M , et al. Randomized controlled trial of N-acetylcysteine therapy for RYR1-related myopathies. Neurology. (2020) ;94: (13):e1434–e44. |
[15] | Amburgey K , Bailey A , Hwang JH , Tarnopolsky MA , Bonnemann CG , Medne L , et al. Genotype-phenotype correlations in recessive RYR1-related myopathies. Orphanet J Rare Dis. (2013) ;8: :117. |
[16] | Meilleur KG , Jain MS , Hynan LS , Shieh CY , Kim E , Waite M , et al. Results of a two-year pilot study of clinical outcome measures in collagen VI- and laminin alpha2-related congenital muscular dystrophies. Neuromuscul Disord. (2015) ;25: (1):43–54. |
[17] | Berard C , Payan C , Hodgkinson I , Fermanian J , Group MFMCS. A motor function measure for neuromuscular diseases. Construction and validation study. Neuromuscul Disord. (2005) ;15: (7):463–70. |
[18] | Society AT. ATS statement: Guidelines for the six-minute walk test. American Journal of Respiratory and Critical Care Medicine. (2002) ;166: (1):111–7. |
[19] | Jungbluth H , Davis MR , Muller C , Counsell S , Allsop J , Chattopadhyay A , et al Magnetic resonance imaging of muscle in congenital myopathies associated with RYR1 mutations. Neuromuscul Disord. (2004) ;14: (12):785–90. |
[20] | Grunseich C , Patankar A , Amaya J , Watts JA , Li D , Ramirez P , et al. Clinical and Molecular Aspects of Senataxin Mutations in Amyotrophic Lateral Sclerosis 4. Annals of Neurology. (2020) ;87: (4):547–55. |
[21] | Chance PF , Rabin BA , Ryan SG , Ding Y , Scavina M , Crain B , et al. Linkage of the gene for an autosomal dominant form of juvenile amyotrophic lateral sclerosis to chromosome 9q34. Am J Hum Genet. (1998) ;62: (3):633–40. |
[22] | Rabin BA , Griffin JW , Crain BJ , Scavina M , Chance PF , Cornblath DR . Autosomal dominant juvenile amyotrophic lateral sclerosis. Brain. (1999) ;122: (Pt 8):1539–50. |
[23] | Phansalkar NMS , Sabale A , Joshi M , et al. Adaptive local thresholding for detection of nuclei in diversity stained cytology images. International Conference on Communications and Signal Processing (ICCSP). 2011:218-20. |
[24] | Ban C , Park JB , Cho S , Kim HR , Kim YJ , Choi YJ , et al. Reduction of focal sweating by lipid nanoparticle-delivered myricetin. Scientific Reports. (2020) ;10: (1):13132. |
[25] | Fox M The biomechanical consequences of body size differences in humans [Dissertation]. Urbana, Illinois: University of Illinois at Urbana-Champaign; 2020. |
[26] | Jiménez-Garduño AM , Mitkovski M , Alexopoulos IK , Sánchez A , Stühmer W , Pardo LA , et al. KV10 K(+)-channel plasma membrane discrete domain partitioning and its functional correlation in neurons. Biochim Biophys Acta. (2014) ;1838: (3):921–31. |
[27] | Tordjman M , Dabaj I , Laforet P , Felter A , Ferreiro A , Biyoukar M , et al. Muscular MRI-based algorithm to differentiate inherited myopathies presenting with spinal rigidity. Eur Radiol. (2018) ;28: (12):5293–303. |
[28] | Wattjes MP , Kley RA , Fischer D . Neuromuscular imaging in inherited muscle diseases. Eur Radiol. (2010) ;20: (10):2447–60. |
[29] | Quijano-Roy S , Avila-Smirnow D , Carlier RY , group W-Mms. Whole body muscle MRI protocol: Pattern recognition in early onset NM disorders. Neuromuscul Disord. (2012) ;22: (Suppl 2):S68–84. |
[30] | Hollingsworth KG , Garrood P , Eagle M , Bushby K , Straub V . Magnetic resonance imaging in Duchenne muscular dystrophy: Longitudinal assessment of natural history over 18 months. Muscle Nerve. (2013) ;48: (4):586–8. |
[31] | Barnard AM , Willcocks RJ , Triplett WT , Forbes SC , Daniels MJ , Chakraborty S , et al. MR biomarkers predict clinical function in Duchenne muscular dystrophy. Neurology. (2020) ;94: (9):e897–e909. |
[32] | Bharucha-Goebel DX , Santi M , Medne L , Zukosky K , Dastgir J , Shieh PB , et al. Severe congenital RYR1-associated myopathy: The expanding clinicopathologic and genetic spectrum. Neurology. (2013) ;80: (17):1584–9. |
[33] | Witherspoon JW , Vuillerot C , Vasavada RP , Waite MR , Shelton M , Chrismer IC , et al Motor function performance in individuals with RYR1-related myopathies. Muscle Nerve. (2019) ;60: (1):80–7. |
[34] | Arafah AM KA , & Mayo NE . Untangling Perception of Fatigue and Fatigability: First Steps. Austin J Mult Scler & Neuroimmunol. (2015) ;2: (3):1018. |
[35] | Todd JJ , Sagar V , Lawal TA , Allen C , Razaqyar MS , Shelton MS , et al. Correlation of phenotype with genotype and protein structure in RYR1-related disorders. Journal of Neurology. (2018) ;265: (11):2506–24. |
[36] | Truong TK , Chakeres DW , Beversdorf DQ , Scharre DW , Schmalbrock P . Effects of static and radiofrequency magnetic field inhomogeneity in ultra-high field magnetic resonance imaging. Magn Reson Imaging. (2006) ;24: (2):103–12. |
[37] | Van Leemput K , Maes F , Vandermeulen D , Colchester A , Suetens P . Automated segmentation of multiple sclerosis lesions by model outlier detection. IEEE Trans Med Imaging. (2001) ;20: (8):677–88. |
[38] | Vovk U , Pernus F , Likar B . A review of methods for correction of intensity inhomogeneity in MRI. IEEE Trans Med Imaging. (2007) ;26: (3):405–21. |
[39] | Dixon WT . Simple proton spectroscopic imaging. Radiology. (1984) ;153: (1):189–94. |
[40] | Yoshiko A , Hioki M , Kanehira N , Shimaoka K , Koike T , Sakakibara H , et al. Three-dimensional comparison of intramuscular fat content between young and old adults. BMC Med Imaging. (2017) ;17: (1):12. |
[41] | Mercuri E , Cini C , Pichiecchio A , Allsop J , Counsell S , Zolkipli Z , et al. Muscle magnetic resonance imaging in patients with congenital muscular dystrophy and Ullrich phenotype. Neuromuscul Disord. (2003) ;13: (7-8):554–8. |
[42] | Todd JJ , Razaqyar MS , Witherspoon JW , Lawal TA , Mankodi A , Chrismer IC , et al. Novel Variants in Individuals with RYR1-Related Congenital Myopathies: Genetic, Laboratory, and Clinical Findings. Front Neurol. (2018) ;9: :118. |
[43] | Rueffert H , Olthoff D , Deutrich C , Meinecke CD , Froster UG . Mutation screening in the ryanodine receptor 1 gene (RYR1) in patients susceptible to malignant hyperthermia who show definite IVCT results: Identification of three novel mutations. Acta Anaesth Scand. (2002) ;46: (6):692–8. |
[44] | Robinson R , Carpenter D , Shaw MA , Halsall J , Hopkins P . Mutations in RYR1 in malignant hyperthermia and central core disease. Hum Mutat. (2006) ;27: (10):977–89. |
[45] | Lavezzi WA , Capacchione JF , Muldoon SM , Sambuughin N , Bina S , Steele D , et al. Case report: Death in the emergency department: An unrecognized awake malignant hyperthermia-like reaction in a six-year-old. Anesth Analg. (2013) ;116: (2):420–3. |
[46] | Snoeck M , van Engelen BG , Kusters B , Lammens M , Meijer R , Molenaar JP , et al. RYR1-related myopathies: A wide spectrum of phenotypes throughout life. Eur J Neurol. (2015) ;22: (7):1094–112. |
[47] | Illingworth MA , Main M , Pitt M , Feng L , Sewry CA , Gunny R , et al. RYR1-related congenital myopathy with fatigable weakness, responding to pyridostigimine. Neuromuscul Disord. (2014) ;24: (8):707–12. |
[48] | Zhou H , Yamaguchi N , Xu L , Wang Y , Sewry C , Jungbluth H , et al. Characterization of recessive RYR1 mutations in core myopathies. Hum Mol Genet. (2006) ;15: (18):2791–803. |
[49] | Wilmshurst JM , Lillis S , Zhou H , Pillay K , Henderson H , Kress W , et al. RYR1 mutations are a common cause of congenital myopathies with central nuclei. Annals of Neurology. (2010) ;68: (5):717–26. |
[50] | Shepherd S , Ellis F , Halsall J , Hopkins P , Robinson R . RYR1 mutations in UK central core disease patients: More than just the C-terminal transmembrane region of the RYR1 gene. J Med Genet. (2004) ;41: (3). |
[51] | Galli L , Orrico A , Lorenzini S , Censini S , Falciani M , Covacci A , et al. Frequency and localization of mutations in the 106 exons of the RYR1 gene in 50 individuals with malignant hyperthermia. Hum Mutat. (2006) ;27: (8):830. |
[52] | Dai Y , Wei X , Zhao Y , Ren H , Lan Z , Yang Y , et al A comprehensive genetic diagnosis of Chinese muscular dystrophy and congenital myopathy patients by targeted next-generation sequencing. Neuromuscul Disord. (2015) ;25: (8):617–24. |
[53] | Davis MR , Haan E , Jungbluth H , Sewry C , North K , Muntoni F , et al. Principal mutation hotspot for central core disease and related myopathies in the C-terminal transmembrane region of the RYR1 gene. Neuromuscul Disord. (2003) ;13: (2):151–7. |
[54] | Haugen T , Toft M , Muller CR , Aasly J . [Malignant hyperthermia–a hereditary and potentially life-threatening condition]. Tidsskr Nor Laegeforen. (2005) ;125: (20):2792–4. |
[55] | Bevilacqua JA , Monnier N , Bitoun M , Eymard B , Ferreiro A , Monges S , et al Recessive RYR1 mutations cause unusual congenital myopathy with prominent nuclear internalization and large areas of myofibrillar disorganization. Neuropathol Appl Neurobiol. (2011) ;37: (3):271–84. |
[56] | Kraeva N , Heytens L , Jungbluth H , Treves S , Voermans N , Kamsteeg E , et al. Compound RYR1 heterozygosity resulting in a complex phenotype of malignant hyperthermia susceptibility and a core myopathy. Neuromuscul Disord. (2015) ;25: (7):567–76. |
[57] | Tammaro A , Di Martino A , Bracco A , Cozzolino S , Savoia G , Andria B , et al. Novel missense mutations and unexpected multiple changes of RYR1 gene in 75 malignant hyperthermia families. Clin Genet. (2011) ;79: (5):438–47. |
[58] | Todd EJ , Yau KS , Ong R , Slee J , McGillivray G , Barnett CP , et al. Next generation sequencing in a large cohort of patients presenting with neuromuscular disease before or at birth. Orphanet J Rare Dis. (2015) ;10: :148. |
[59] | Manning BM , Quane KA , Ording H , Urwyler A , Tegazzin V , Lehane M , et al. Identification of novel mutations in the ryanodine-receptor gene (RYR1) in malignant hyperthermia: Genotype-phenotype correlation. Am J Hum Genet. (1998) ;62: (3):599–609. |
[60] | Zullo A , Klingler W , De Sarno C , Ferrara M , Fortunato G , Perrotta G , et al. Functional characterization of ryanodine receptor (RYR1) sequence variants using a metabolic assay in immortalized B-lymphocytes. Hum Mutat. (2009) ;30: (4):E575–90. |
[61] | Blackburn PR , Selcen D , Gass JM , Jackson JL , Macklin S , Cousin MA , et al. Whole exome sequencing of a patient with suspected mitochondrial myopathy reveals novel compound heterozygous variants in RYR1. Mol Genet Genomic Med. (2017) ;5: (3):295–302. |
[62] | Brandom BW , Bina S , Wong CA , Wallace T , Visoiu M , Isackson PJ , et al. Ryanodine receptor type 1 gene variants in the malignant hyperthermia-susceptible population of the United States. Anesth Analg. (2013) ;116: (5):1078–86. |
[63] | Rueffert H , Wehner M , Ogunlade V , Meinecke C , Schober R . Mild clinical and histopathological features in patients who carry the frequent and causative malignant hyperthermia RyR1 mutation p.Thr2206Met. Clin Neuropathol. (2009) ;28: (6):409–16. |


