
Exploration of New Contrasts, Targets, and MR Imaging and Spectroscopy Techniques for Neuromuscular Disease – A Workshop Report of Working Group 3 of the Biomedicine and Molecular Biosciences COST Action BM1304 MYO-MRI
Abstract
Neuromuscular diseases are characterized by progressive muscle degeneration and muscle weakness resulting in functional disabilities. While each of these diseases is individually rare, they are common as a group, and a large majority lacks effective treatment with fully market approved drugs. Magnetic resonance imaging and spectroscopy techniques (MRI and MRS) are showing increasing promise as an outcome measure in clinical trials for these diseases. In 2013, the European Union funded the COST (co-operation in science and technology) action BM1304 called MYO-MRI (www.myo-mri.eu), with the overall aim to advance novel MRI and MRS techniques for both diagnosis and quantitative monitoring of neuromuscular diseases through sharing of expertise and data, joint development of protocols, opportunities for young researchers and creation of an online atlas of muscle MRI and MRS. In this report, the topics that were discussed in the framework of working group 3, which had the objective to: Explore new contrasts, new targets and new imaging techniques for NMD are described. The report is written by the scientists who attended the meetings and presented their data. An overview is given on the different contrasts that MRI can generate and their application, clinical needs and desired readouts, and emerging methods.
Abbreviations
ADP | adenosine diphosphate |
ATP | adenosine triphosphate |
bSSFP | balanced steady state free precession |
cCSA | contractile cross sectional area |
CK | creatine kinase |
COST | cooperation in science and technology |
CS | corticosteroid/compressed sensing (in the context of MR image reconstruction methods) |
CSA | cross sectional area |
CT | computed tomography |
CV | coefficient of variation |
DENSE | displacement encoding with stimulated echoes |
DESS | double echo steady state |
DMD | Duchenne muscular dystrophy |
DWI | diffusion weighted imaging |
DTI | diffusion tensor imaging |
EPG | extended phase graph |
18F-FDG | 18F-fluorodeoxyglucose |
FH | foot-head |
FSHD | facioscapulohumeral dystrophy |
GCL | gastrocnemius lateral head |
GCM | gastrocnemius medial head |
Gr | gracilis |
GRAPPA | generalized autocalibrating partial parallel acquisition |
GRMD | golden retriever muscular dystrophy |
IDEAL | iterative decomposition of water and fat with echo asymmetry and least-squares estimation |
IR | inversion recovery |
ISIS | image-selected in vivo spectroscopy |
NMD | neuromuscular diseases |
MIRACLE | motion-insensitive rapid configuration relaxometry |
MOLLI | modified look-locker inversion recovery |
MR | magnetic resonance |
MRE | magnetic resonance elastography |
MRI | magnetic resonance imaging |
MRS | magnetic resonance spectroscopy |
MSE | multi-spin-echo |
MT | magnetization transfer |
MTR | magnetization transfer ratio |
NBD | nemo-binding-domain |
PC | phase contrast |
PCr | phosphocreatine |
PDE | phosphodiesters |
PDFF | proton density fat fraction |
PER | peroneus |
PET | positron emission tomography |
Pi | inorganic phosphate |
PME | phosphomonoesters |
PS | pulsed saturation |
PSR | pool size ratio |
pSSFP | partially spoiled steady state free precession |
qMT | quantitative magnetization transfer |
RF | rectus femoris/radio frequency (in the context of MRI excitation pulses and signal acquisition) |
SIR | selective inversion recovery |
sLASER | semi-localized by adiabatic selective refocusing |
SMA | spinal muscular atrophy |
SNR | signal-to-noise ratio |
SOL | soleus |
Sr | Sartorius |
SSFP | steady state free precession |
STEAM | stimulated echo acquisition mode |
STIR | short-TI inversion recovery |
TA | tibialis anterior |
TESS | triple echo steady state |
TIRM | turbo inversion recovery magnitude |
TP | tibialis posterior |
TSE | turbo spin echo |
UTE | ultra-short echo time |
VI | vastus intermedius |
VL | vastus lateralis |
VM | vastus medialis |
INTRODUCTION
Neuromuscular diseases (NMD) form a large group of individually rare diseases that are present in all populations and affect people of all ages. They are often, particularly at chronic stages, characterized by progressive muscle degeneration and muscle weakness resulting in functional disabilities. Many of them result in chronic disability, which poses a significant healthcare burden for society, and most of them lack an effective therapy. Even though NMDs have very different causes and pathogenic mechanisms, fibrosis, edema, and fat replacement are frequently observed histological features. Diagnosis and therapy development for NMD has rapidly expanded in recent years [1–3] and there is an urgent need to develop objective, non-invasive outcome measures to monitor disease progression and treatment effect [4, 5]. Muscle biopsies have been used extensively to classify NMD and to gain a better understanding of their underlying pathomechanisms. However, because they are invasive, it is undesirable to repeat them often. Also, they only assess a small sample in a single muscle, leading to non-representative results and making them less suitable as outcome measures for clinical trials. Functional measures are often used in clinical trials as the primary outcome, but most of them heavily rely on patient cooperation and motivation, and are therefore inherently variable and subjective.
The use of magnetic resonance imaging and spectroscopy techniques (MRI and MRS) applied to NMD is showing increasing promise as an outcome measure in clinical trials [6, 7]. Unfortunately, progress has been hindered by the rarity of individual NMDs and lack of options for pooling data from different groups. Therefore, in 2013, the European Union funded the cooperation in science and technology (COST) action BM1304 called MYO-MRI (www.myo-mri.eu). The overall aim of MYO-MRI was to advance novel MRI and MRS techniques for both diagnosis and quantitative monitoring of neuromuscular diseases through sharing of expertise and data, joint development of protocols, opportunities for young researchers and creation of an online atlas of muscle MRI and MRS. There were four working groups in the action, which all held two working group meetings a year, where data were shared and discussed in an open and informal atmosphere. In this report, the topics that were discussed in the framework of working group 3, which had the objective to explore new contrasts, new targets and new imaging techniques for NMD are described.
This report is written by scientists who attended the meetings and presented their data. The report starts with the different contrasts that MRI can generate, and describes their recent developments as applied to skeletal muscle. Clinically, the two most used contrast mechanisms are those that determine fat infiltration and from that muscular fraction (area), in the form of T1-weighted imaging, and those that use T2 relaxation to characterize a combination of various states of water in muscles (T2-weighted imaging with fat suppression, or inversion-recovery based short-tau inversion recovery (STIR) or turbo inversion recovery magnitude (TIRM) sequences). As the focus of the working group 3 meetings was on new contrasts, T1- and T2-weighted imaging will not be discussed, and the report will focus on the more experimental imaging sequences that can generate quantitative image contrasts. This report will describe the different contrasts and their applications, followed by a section on the most pressing clinical needs, with an overview of applied and desired readouts for NMD, as well as combinations of MR techniques. In addition, an overview is given of emerging methods, including new developments in post-processing technology and acceleration techniques. The report ends with summarizing perspectives.
CONTRASTS
Dixon imaging
The increased number of potential treatments for NMDs results in a higher need for a reliable and sensitive biomarkers which would allow objective quantification of disease progression [8–13]. Since one of the main characteristics of chronic NMDs is fatty infiltration of muscle tissue, a method quantifying fat content would be a natural choice for such a biomarker. A technique commonly employed in MRI to measure fat content is the Dixon method [14–16]. It utilizes the difference in resonance frequencies of water and fat to produce separate maps of water and fat distribution. While solely water or fat images remain qualitative, the combination of the two becomes quantitative by giving the relative content of the two species, generally defined through a fat fraction FF = f/(w + f), where w and f are water and fat signals, respectively.
The Dixon technique is well-established, but many variants exist, and one of the objectives of working group 3 was to reach a consensus on the optimal approach to apply it in the muscles. In particular a number of confounding factors needs to be addressed to make the method independent of the protocol and system where the data is acquired, and some trade-offs need to be addressed. First, to properly compensate for main field inhomogeneities, it is recommended that at least 3 echoes (Dixon points) are acquired [15, 16]. The sequence parameters need to be chosen so that the sequence is minimally T1-weighted, since water and fat tissue have very different T1 values. This can be avoided by using long repetition times and low flip angles [17, 18]. Also, the complexity of the fat spectrum needs attention – basic implementation of Dixon reconstruction assumes a single spectral peak, however around 30% of the fat protons resonate at frequencies different from that of the main peak [19–21]. T2* relaxation effects need to be accounted for. This can be included in the reconstruction model, but often requires acquisition of additional echoes to be stable [22]. Moreover, noise bias from magnitude correction can influence the measurements, so a post-processing correction method is advised, particularly if the signal-to-ratio (SNR) of the images is low [17]. Finally, phase data from the scanner needs to be reliable – this can be confounded by bipolar readouts, eddy currents, and gradient delays. Using monopolar readout sequences helps to mitigate some of these, otherwise modeling is needed [23–25].
If these confounders are accounted for, the Dixon technique is considered to produce a setup-independent measurement of fat fraction, generally referred to as proton density fat fraction (PDFF), and working group 3 published a consensus paper detailing what is necessary to achieve this goal, as well as listing important NMD studies to date utilizing the Dixon technique [26].
T2 Relaxation time mapping
The transverse relaxation time (T2) is one of the main variables that determine the MR signal intensity. It describes the nuclear spin-spin interactions and its value highly depends on the molecular tumbling rate. T2 relaxation time mapping can be performed for the T2 of the water signal (commonly referred to as water-T2 or MRS-T2), the fat signals or of all signals combined (commonly referred to global-T2 or MRI-T2). Muscle water T2 variations provide relevant information about disease activity and muscle physiological status but are highly nonspecific. They may indeed reflect inflammatory processes, myocyte swelling, sarcoplasmic leakiness, cell necrosis, denervation, or simply hydrostatic edema. More about T2 as a biomarker for inflammation in NMD can be found in section 3.1.
The standard way to measure T2 consists of adjusting an exponential model to the signal decay measured with a multi-spin-echo (MSE) sequence. Quantitative relaxometry in fat infiltrated muscles should be interpreted with care though since water and fat protons T2 largely differ. Because of the long T2 of fat compared to the T2 of normal muscle tissue, a single-component analysis of non-fat-suppressed signal results in a global T2 that primarily reflects the fat content in tissues and may hide underlying alterations of the muscle tissue itself [27]. Different approaches were proposed to decompose the global signal decay into a sum of fat and water contributions. A bi-exponential fit was introduced by Yao et al. and combined with a Dixon acquisition to determine water T2 [28]. More recently, a tri-exponential model was introduced, where the fat signal decay was approximated by a bi-exponential (based on the analysis of subcutaneous fat) and the muscle tissue decay by a single exponential and resulted in the simultaneous estimation of water T2 and the fat fraction [29]. However, in practice, the signal resulting from an MSE sequence rarely displays a pure T2 decay. It is sensitive to instrumental imperfections like non-ideal slice pulse profiles, B1+ inhomogeneities, and insufficient crushing schemes. This leads to the generation of T1-weighted stimulated echoes that contaminate the signal decay curves [30]. This can be resolved applying more complex models based either on Bloch equations [31] or extended phase graph (EPG) analysis [30]. Recently, a bi-component EPG approach was proposed to simultaneously quantify the muscle water T2 and fat fraction from a standard MSE acquisition (Fig. 1) [32].
Fig.1
Bi-component extended phase graph (EPG) approach to simultaneously quantify the muscle water T2 and fat fraction. (A) Water T2 map. (B) Fat image. (C) Water image. Figure adapted from Marty et al. with permission [32].
![Bi-component extended phase graph (EPG) approach to simultaneously quantify the muscle water T2 and fat fraction. (A) Water T2 map. (B) Fat image. (C) Water image. Figure adapted from Marty et al. with permission [32].](https://content.iospress.com:443/media/jnd/2019/6-1/jnd-6-1-jnd180333/jnd-6-jnd180333-g001.jpg)
Alternatively, a method that exploits the chemical shift between fat and water [33, 34] has been proposed, combining an IDEAL (iterative decomposition of water and fat with echo asymmetry and least-squares estimation) decomposition of water and fat signals with an MSE sequence was also specifically designed for simultaneous estimation of water T2 and fat fraction.
Several rapid T2-mapping sequences based on 2D- or 3D-SSFP sequences have been developed for musculoskeletal imaging, including bSSFP [35, 36], pSSFP [37, 38], DESS [39], TESS [40]. These methods are generally sensitive to B1+ inhomogeneities and flip angle profiles, and some of them show, in addition, some sensitivity to motion. Recently a rapid B1+, B0, and motion-insensitive 3D-SSFP relaxometry approach, MIRACLE [41], was presented. It allows accurate T1 and T2 mapping within one single scan, but was to date only applied in the brain. To mitigate the effects of B1+ inhomogeneities on muscle water T2 quantification T2-prepared 3D-TSE sequences employing an adiabatic T2 preparation have been also proposed [42, 43].
Although rarely mentioned, the T2-relaxation of muscle water is multi-exponential [44], as revealed by spectroscopic studies. At least three T2 components can be observed: a short one (T2 < 5 ms) attributed to hydration water, and two others around 30 and 150 ms, with respective relative fractions of about 90% and 5%, reflecting the water compartmentation into intracellular, interstitial, and vascular spaces [45]. On standard single-exponent T2-mapping methods the signal is dominated by the longer T2 components. Multicomponent T2 decay analysis has the potential of determining compartment-specific T2 values, relative volumes, and compartmental exchange rates.
Diffusion-weighted imaging
Diffusion-weighted imaging (DWI) has been widely applied in various medical and non-medical fields, ranging from solid material, phantom and animal experiments to human tissue studies. DWI uses diffusion-sensitizing pulsed-field gradients to assess displacement of water protons in vitro and in vivo [46]. This has motivated its use to probe microstructural information beyond the resolution of conventional MR imaging, i.e. in the range of several 10’s of micrometers. Depending on the pulsed-field diffusion gradient scheme and strategy of analysis of the acquired DWI data, different parameters can be estimated from the investigated object: the apparent diffusion coefficient (ADC) and the directional diffusivity [47], the displacement probability [48], the sizes of the diffusion-restricting boundaries, e.g. pore or cell diameter [49], and the transition probability between compartments delimited by semi-permeable boundaries [50–52].
When applying DWI in a clinical setting, especially the analysis of the directional diffusivity and the time-dependent analysis of DWI parameters have shown to be a promising tool for the non-invasive investigation of human skeletal muscle architecture [53, 54]. However, its use can be hampered by the time-consuming acquisitions, as measurement time is directly proportional to the number of diffusion-sensitizing gradient directions, the steps of diffusion weighting (the number of b-values), and for specific sequences also the diffusion time (time between diffusion gradients). The ADC can be estimated easily and fast using one image without diffusion weighting and three images with orthogonal gradient directions in order to get the trace image. Prior studies in pathological human skeletal muscle have demonstrated a change in ADC due to muscle denervation (24% increase) [55], in inflammatory myopathies (17% increase) [56], and deformation-induced injury (between 16% increase and 10% decrease, depending on time after injury) [57] – hence the ADC could serve as a biomarker in muscular disorders. However, analysis of ADC in resting healthy human muscles has yielded a broad range of normal values between 1.26×10⁻³ and 1.99×10⁻³ mm2/s [54–56, 58–61], i.e. a 58% difference between the lowest and the highest values. Additionally, changes in muscle ADC are rather unspecific. Changes in ADC and directional diffusivity in healthy human muscles have previously been reported to be dependent on exercise [62, 63], training condition [64], active muscle contraction [65], and passive joint position [66, 67]. Recent systematic evaluations of DWI in healthy human skeletal muscle have furthermore described the DWI parameters to be dependent on different technical issues during acquisition and post-processing, such as spatial resolution, diffusion-encoding parameters, signal-to-noise ratio, and phase-sensitive variations due to microcirculation [68–71]. Fatty infiltration of muscle tissue is a hallmark of NMD and confounds DWI measurements [72, 73]. Hence new acquisition methods for robust fat suppression need to be used in such cases [74, 75]. Careful planning of MR examinations can take the DWI parameter dependences mentioned above into account, but the variability of values in resting healthy human muscle means that interpreting DWI changes in pathological conditions remains challenging.
Magnetization transfer
Magnetization transfer (MT) MRI is sensitive to the relative sizes of, and exchange between, the free water and solid-like macromolecular proton pools in tissues. One mechanism for this exchange is a through-space interaction between magnetic dipoles, commonly termed cross-relaxation. Another mechanism is the chemical exchange of protons in free water protons and certain functional groups on macromolecules, thought to occur by way of the intermediate pool of the macromolecule’s interfacial water. The MT’s sensitivity to the relative proportions of free water and macromolecules may make this technique sensitive to common aspects of muscle pathology such as inflammation and fibrosis. Because the rate of chemical exchange between water and functional groups such as amides is sensitive to pH [76], MT methods may potentially afford insight into a tissue’s metabolic status as well.
Two common MT methods are the pulsed saturation (PS-MT [77]) and selective inversion recovery (SIR-MT [78, 79]) approaches. Both approaches take advantage of the broad linewidth of the macromolecular proton signal, relative to the narrow linewidth of the water proton signal. In PS-MT, the macromolecular signal is saturated with an RF pulse centered on a resonance frequency sufficiently different from the water signal. Typically, the saturation pulse is applied several kHz off-resonance to water. MT takes place between the solid and free water proton pools, and as the saturated magnetization enters the free water pool, the water signal is reduced in amplitude. In SIR-MT, a narrow-bandwidth RF pulse is used to invert the water signal selectively. MT between the solid and free water proton pools causes the water signal to recover as a bi-exponential function.
Semi-quantitative methods based on PS-MT methods express the reduction in water signal amplitude following off-resonance saturation relative to the signal observed in a control condition (typically achieved by centering the saturation pulse ∼50 kHz off-resonance to water, beyond the reasonable limits of the macromolecular peak). This quotient is called the MT-ratio (MTR). A disadvantage of this approach is that the MTR is sensitive to the saturation pulse power and offset frequency. Consequently, if studies have employed different RF saturation pulse parameters, then strict quantitative comparisons of the results are not possible. In truly quantitative MT (qMT) methods, data are collected at a variety of saturation offsets (for the PS-MT method) or inversion times (for SIR-MT). These data are then fitted to a biophysical model, allowing estimation of the ratio of macromolecular to free water protons (the pool size ratio, PSR), the relaxation rates of these pools, and the rates of exchange between them.
MT has been developed and applied in healthy muscles [80–90]. Some of these works have provided fundamental quantitative or semi-quantitative descriptions of the MT process in healthy muscle tissue. For example, Harrison et al. observed that the amount of signal loss due to off-resonance MT saturation pulses is greater in the T2 signal component associated with the intracellular space than in the T2 component associated with the extracellular space [82]. Normative values for exchange rate, PSR, and other important parameters have been reported [83, 85, 86, 88, 89], as a function of variables such as age [85, 88] and sex [88]. Other studies have advanced the understanding of the MT process in muscle or implemented technical advances. For example, Louie et al. studied the effect of intracellular pH on the MT rate and observed a direct, linear dependence of the MT rate on pH [84], which they postulated may reflect base-catalyzed amide-water proton exchange [76]. Other advances have included the correction of MT parametric maps for RF inhomogeneity [91, 92], the effects of fat signal contamination [90], the reduction of data acquisition time by adopting reduced parameter models [90], and establishment of the reproducibility of the technique [88, 89].
MT has also been used to characterize human NMD and animal models of human disease. Quantitative MT has been used to study small animal models of muscle inflammation, wherein it has been shown that inflammation decreases the PSR [93]. Inasmuch as MT reflects both the macromolecular and free water proton pools, the PSR may also be influenced by fibrosis [94, 95]. Also consistent with inflammation, Sinclair et al. have observed a reduced MTR in patients with peripheral neuropathies [87]. They further observed that the MTR was correlated with clinical severity and was even reduced in otherwise normally appearing images. In a study of patients with Charcot-Marie-Tooth disease and inclusion body myositis, Sinclair et al. likewise observed reductions in MTR [91].
MR Elastography
Palpation is frequently used in the physical examination of patients with NMD. Pathological features related to NMD such as fat infiltration, fibrosis, and edema affect the muscle biomechanical properties and can be detected using palpation by the sense of touch. Although very practical in the clinical setting, assessment of skeletal muscle biomechanical properties using manual palpation is of a qualitative nature and therefore less useful to objectively assess disease progression and for treatment evaluation. A quantification of the biomechanical properties of tissue can be done with a specialized MRI technique called MR Elastography (MRE). Since the invention of this palpation by imaging technique, it is increasingly used to quantify the biomechanical properties of skeletal muscle [96, 97].
MRE is based on the imaging of shear waves, most often introduced in the tissue by an external vibrating actuator mechanically coupled to the tissue, usually the skin. During vibration, the tissue displacements, i.e. the shear waves, are imaged with a motion-encoded MRI sequence synchronized to the motion [98]. By inversion of these shear wave images, viscoelastic biomechanical properties, such as the complex shear modulus G* can be subsequently estimated [99].
Current applications of skeletal muscle MRE can be roughly divided in four categories. A first application involves skeletal muscle rheology. Skeletal muscle exhibits nonlinear viscoelastic anisotropic material behavior, which makes accurate determination of the biomechanical properties challenging. Several research groups focused on sophisticated experimental and analysis techniques to approximate the true mechanical properties. Most effort was put into including the anisotropic behavior of skeletal muscle. Some proposed a linear (visco-) elastic transverse isotropic material approach as intermediate solution [101–106]. Other relevant rheological features for skeletal muscle, including nonlinear viscoelasticity, frequency dependence (power-law) behavior, incompressibility, tissue fluid content, tension-compression nonlinearity, and inhomogeneity are currently often neglected, however, could be worthwhile to investigate further [107]. Secondly, the study of the biomechanical properties of healthy skeletal muscle is an active field of research, since it is believed that there are relevant differences in stiffness between muscles and because thorough understanding of muscle’s baseline biomechanical properties is considered essential to study muscle injury or disease. Most studied are the individual skeletal muscles in the lower extremities, upper extremities, and shoulder [108–117]. Furthermore, MRE-derived biomechanical properties during skeletal muscle contraction and relaxation can be used as readout for skeletal muscle function. Several groups have studied the relationship between muscle biomechanical properties and load [115, 116], as well as the effects of skeletal muscle exercise on muscle biomechanical properties, and the difference in relaxed versus contracted skeletal muscle [100, 105, 109, 113, 118–120]. The fourth application is MRE applied for studying skeletal muscle pathology. MRE has been applied to study mechanical changes due to neuromuscular dysfunction, myositis, deformation-induced damage, testosterone treatment, aging, disuse, hyperthyroidism, myofascial pain, and Duchenne muscular dystrophy (DMD) [100, 110, 120–127]. For example, in boys with DMD, Bensamoun et al. have observed elevated vastus medialis muscle stiffness at rest and decreased muscle stiffness in contracted state compared to healthy controls (Fig. 2) [100].
Fig.2
Biomechanical characterization of skeletal muscle in DMD children. (A) MR Elastography derived sheer stiffness color maps projected on parts of the legs of a healthy subject and a child with DMD. VM = vastus medialis, Sr = sartorius, Gr = gracilis. (B) Quantification of the shear stiffness in the vastus medialis and the subcutaneous adipose tissue (* = P < 0.1). Figure reproduced with permission from Ref. [100].
![Biomechanical characterization of skeletal muscle in DMD children. (A) MR Elastography derived sheer stiffness color maps projected on parts of the legs of a healthy subject and a child with DMD. VM = vastus medialis, Sr = sartorius, Gr = gracilis. (B) Quantification of the shear stiffness in the vastus medialis and the subcutaneous adipose tissue (* = P < 0.1). Figure reproduced with permission from Ref. [100].](https://content.iospress.com:443/media/jnd/2019/6-1/jnd-6-1-jnd180333/jnd-6-jnd180333-g002.jpg)
31P and 13C MR Spectroscopy
Following initial animal experiments, MR spectroscopy (MRS) was first applied to human subjects in the 1980s, using the 31P nucleus to monitor the levels and fate of high-energy phosphates in skeletal muscle [128]. The technique was initially applied in healthy individuals at rest and during exercise, and rapidly also in NMD patients [129, 130]. 31P MRS offers a unique non-invasive window on some key high-energy phosphate metabolites such as ATP, phosphocreatine (PCr) and inorganic phosphate (Pi), which are present at sufficient tissue levels to generate resonances with good SNR. Other compounds that may be estimated from usually less intense signals in 31P MR spectra of muscles are total NAD(H), phosphomonoesters (PME) and phosphodiesters (PDE) [131]. In addition, intracellular pH can be derived from the chemical shift of the Pi resonance [132], free Mg++ from shifts of the α-ATP and γ-ATP peaks and a measure of free cytosolic ADP may be derived from the creatine kinase (CK) equilibrium assuming its substrates to be free in solution [133]. The enzyme kinetics of the CK reaction and of ATPases may be estimated from saturation transfer experiments [134, 135]. During in-magnet exercise bioenergetics data involving PCr, ATP, Pi, and tissue pH can also be acquired [136], Recent studies have identified so-called 31P-31P nuclear Overhauser effects for ATP due to its transient binding to large molecular structures like mitochondria [137].
To be able to excite and acquire 31P spectra, or any other nucleus apart from 1H, a dedicated coil is needed. 31P MR spectroscopy of skeletal muscle is traditionally done by only using a 31P surface coil (for transmit and receive) close to the muscles of interest, sampling mostly signal from tissue adjacent to the coil. However, spectra acquired in this way are not very well localized and do not arise purely from one muscle which can complicate interpretations, especially in NMDs where muscles of clinically asymptomatic patients can already show fatty infiltration in some muscles, while others still appear to be normal [138]. This has been addressed in several ways, including localization methods like ISIS or sLASER to select single voxels within a muscle [139, 140] or spectroscopic imaging [141–143]. As these methods usually sacrifice some of the total information present in 31P MR spectra of muscles an educated selection of a method for a specific purpose is required. It was recently discovered that high-energy phosphate metabolism and fatty infiltration may be very different within a muscle and therefore localization is also required to capture this heterogeneity [144–147].
A major advantage of using 31P MRS in NMD is that the metabolites sampled are hardly present in fat and are therefore representative of muscle and to a lesser extent interstitial tissue rather than the fat. This is potentially very useful in therapy development, as drugs are commonly designed to preserve or improve muscle tissue. It is generally thought that fat replacement of muscle tissue is irreversible, while other processes may be at least partially reversible. Typical findings in resting 31P spectra of skeletal muscle affected by NMD are a low total P-compound level due to atrophy and fatty infiltration, a low PCr/ATP ratio indicating a loss in contractile elements or unbalanced energy metabolism, high Pi/PCr ratio which may indicate increased ADP and thus unbalanced ATP production versus consumption, changes in PDE levels and an increased tissue pH [148–150]. However, not all NMDs show the same changes, and even if the metabolic alterations are similar, they likely arise from different mechanisms for each pathology [150, 151]. As a result, it is unlikely that metabolic alterations as shown by 31P MRS are specific markers for disease in NMD.
The technique has also been used to study pathophysiology and timing of events in the disease cascade. Recently, it was postulated that the increased tissue pH in patients with DMD is due to a splitting of the Pi peak, with an interstitial Pi associated with damaged dystrophic myocytes and/or expanded interstitial space related to fibrosis [152]. An additional Pi peak has also been assigned to a mitochondrial compartment in healthy muscles [153]. Using chemical shift imaging, it was shown that in patients with facioscapulohumeral dystrophy (FSHD), metabolic changes were only present in fat infiltrated muscles [154], while in both Becker and Duchenne muscular dystrophy, the PDE peak was increased already in muscles without fat infiltration [155, 156]. PDE is often assigned to membrane breakdown products and its signal may be used as a biomarker for treatments [6]. Longitudinal studies which followed 31P MRS changes over time in NMD patients are scarce [9, 152, 157]. In the forearms of patients with DMD, it was shown that the ratio of the alkaline Pi signal over Pi and Pi/PCr were increased over one year in non-ambulant patients only [9, 152]. In the legs of patients with DMD (an example is demonstrated in Fig. 3), no changes in 31P MR indices were observed in a 2-year follow up, but in this study no distinction was made between ambulant and non-ambulant patients [157].
Fig.3
(top row) Representative reconstructed water images of the right lower leg and (bottom row) 31P spectra of the TP muscle of a DMD patient at (A) baseline, (B) 12-months and (C) 24-months. PDE/ATP ratios in TP muscles are shown in the graph and % fat for the all analyzed muscle for all three time points are as follows. Baseline: GCL = 5.6%; GCM = 7.3%; SOL = 7.1%; PER = 14,4%; TA = 6.24%; TP = 4.2%; 12-months: GCL = 6,6%; GCM = 8.8%; SOL = 5.2%; PER = 20.6%; TA = 5.71%; TP = 4.3%; 24-months: GCL = 10.1%; GCM = 11.3% SOL = 5.9%; PER = 24.7%; TA = 7.3%; TP = 4.3%. GCL = gastrocnemius lateral head, GCM = gastrocnemius medial head, SOL = soleus, PER = peroneus, TA = tibialis anterior, TP = tibialis posterior. Figure reproduced with permission from Hooijmans et al. [157].
![(top row) Representative reconstructed water images of the right lower leg and (bottom row) 31P spectra of the TP muscle of a DMD patient at (A) baseline, (B) 12-months and (C) 24-months. PDE/ATP ratios in TP muscles are shown in the graph and % fat for the all analyzed muscle for all three time points are as follows. Baseline: GCL = 5.6%; GCM = 7.3%; SOL = 7.1%; PER = 14,4%; TA = 6.24%; TP = 4.2%; 12-months: GCL = 6,6%; GCM = 8.8%; SOL = 5.2%; PER = 20.6%; TA = 5.71%; TP = 4.3%; 24-months: GCL = 10.1%; GCM = 11.3% SOL = 5.9%; PER = 24.7%; TA = 7.3%; TP = 4.3%. GCL = gastrocnemius lateral head, GCM = gastrocnemius medial head, SOL = soleus, PER = peroneus, TA = tibialis anterior, TP = tibialis posterior. Figure reproduced with permission from Hooijmans et al. [157].](https://content.iospress.com:443/media/jnd/2019/6-1/jnd-6-1-jnd180333/jnd-6-jnd180333-g003.jpg)
Studies with 31P MRS during and after exercise to assess the dynamics of high-energy phosphate metabolism have only rarely been performed in patients with muscular dystrophies, but have been done in metabolic and inflammatory myopathies. In general, changes in tissue pH and PCr depletion during exercise and differences in metabolite and tissue pH recovery after exercise were noted in a number of diseases [149, 158–160]. More recent studies on this topic are scarce [161–163], and maybe more practical to assess the kinetics of CK and ATPase is the application of saturation transfer experiments at rest. It has been performed in muscles of patients such as diabetics type II, but not yet in NMD [164].
As 13C MRS is a relatively insensitive method and 13C nuclei only occur at 1% natural abundance it is only feasible to detect highly concentrated compounds at natural abundance such as lipids and glycogen [165]. As a result, application of this method in NMD is limited to a study in adult onset acid maltase deficiency [166]. As an alternative, 13C labeled compounds can be used, such as 13C1-glucose, as this allows following metabolic conversions. As 13C labeled material is costly and the method requires special hardware it is not much applied and only in a rare case to a neuromuscular disease [167]. A much higher sensitivity can be achieved with so-called hyperpolarized 13C, but this new approach is still in development and has not been applied yet to neuromuscular diseases [168].
Sodium imaging
Sodium ions (Na+) play an important role in the ion homeostasis of skeletal muscle tissue. In healthy tissue, the intracellular concentration ([Na+]in = 10–15 mmol/L) is about 10-fold lower than the extracellular concentration ([Na+]ex = 145 mmol/L). This concentration gradient across the cell membrane is maintained by the Na+/K+-ATPase pump and is of utmost importance for the excitation and inhibition of muscle cells. Sodium MRI enables non-invasive imaging of the stable and naturally occurring (100% natural abundance) isotope (23Na). However, its quadrupolar nature leads to a fast transverse relaxation and, thus, requires acquisition techniques that enable ultra-short echo times [169]. In addition, dedicated hardware such as transmit/receive coils that are tuned to the Larmor frequency of 23Na are required [170].
During the last decades, 23Na MRI has evolved into a versatile tool in biomedical research [171]. It enables non-invasive determination of the total tissue Na+ concentration (Fig. 4C) and relaxation-weighted measurements (Fig. 4D). The latter allows at least a partial separation between different Na+ compartments. For example, it was shown that 23Na inversion recovery MRI can visualize changes of the intracellular Na+ content in muscular channelopathies [172] that are not visible in conventional 1H MRI (Fig. 4). 23Na inversion recovery MRI and conventional 23Na MRI in combination with sophisticated modelling have also been applied to provide a quantitative estimation of the intracellular Na+ concentration in brain tissue [173].
Fig.4
1H and 23Na MR images of a patient with a muscular channelopathy (paramyotonia congenita). The right lower leg (*) was cooled with an ice bag, which results in an increase of the intracellular Na+ concentration and in severe muscle weakness. Two reference tubes were used for signal normalization (1:51.3 mmol/L NaCl and 5% agarose gel, 2:51.3 mmol/L NaCl solution). (A) T1-weighted and (B) T2-weighted 1H MRI revealed no pathological signal differences between the cooled (*) and the non-cooled muscle. (C) The cooled leg shows a slightly increased total Na+ concentration. (D) 23Na inversion recovery (IR) MRI revealed a distinct increase of the signal in the cooled leg and, thus, visualizes the increase of the intracellular Na+content. Note, reference tube 2 (pure saline solution) shows no signal intensity in 23Na IR MRI. Images adapted from Ref. [172] with permission.
![1H and 23Na MR images of a patient with a muscular channelopathy (paramyotonia congenita). The right lower leg (*) was cooled with an ice bag, which results in an increase of the intracellular Na+ concentration and in severe muscle weakness. Two reference tubes were used for signal normalization (1:51.3 mmol/L NaCl and 5% agarose gel, 2:51.3 mmol/L NaCl solution). (A) T1-weighted and (B) T2-weighted 1H MRI revealed no pathological signal differences between the cooled (*) and the non-cooled muscle. (C) The cooled leg shows a slightly increased total Na+ concentration. (D) 23Na inversion recovery (IR) MRI revealed a distinct increase of the signal in the cooled leg and, thus, visualizes the increase of the intracellular Na+content. Note, reference tube 2 (pure saline solution) shows no signal intensity in 23Na IR MRI. Images adapted from Ref. [172] with permission.](https://content.iospress.com:443/media/jnd/2019/6-1/jnd-6-1-jnd180333/jnd-6-jnd180333-g004.jpg)
Although 23Na MRI largely benefits from the increased signal-to-noise ratio at ultra-high magnetic field strength (e.g. 7 T), 23Na MRI of skeletal muscle can also reliably be performed at clinical field strengths (3 T).
In NMD, it has been shown that muscle tissue of patients with myotonic dystrophy [174] and DMD [175] have increased sodium concentrations. Also in the muscles of mdx-mice (a model for DMD), abnormally high intracellular concentrations have been reported [176]. In DMD, the absence of dystrophin modifies the gating properties and expression level of the voltage-gated Na+ channel (Nav1.4). This results in an increased Na+ concentration under the sarcolemma [177]. It was hypothesized that the elevation of the intracellular Na+ concentration contributes to an elevated rate of cell death in dystrophic muscle. In vitro studies demonstrated that both effects can be reversed by a specific Nav1.4 channel blocker (tetrodotoxin) [177]. In DMD patients, it has been shown, that the K+-sparing diuretic agent eplerenone reduces muscular Na+ overload and edema [178]. However, long-term studies with larger patient numbers are required to investigate treatment effects of eplerenone in more detail. In future, 23Na MRI might be used in clinical studies that investigate disease progression or therapy effects in neuromuscular diseases.
CLINICAL NEEDS
Inflammation & disease activity
Multiple MR imaging strategies have been shown to be sensitive to muscle inflammation and muscle damage in the NMDs. For instance, STIR sequences are commonly used to enhance the contrast generated by in areas of muscle inflammation and edema. In many NMDs it is believed that areas that are hyperintense on STIR images precede the eventual deposition by fibrofatty tissues. For instance, Marden et al. [179] observed regions of increased signal intensity on STIR images in the muscles of young DMD boys in the absence of fatty infiltration. This finding is consistent with the conjecture that inflammation, as well as necrosis and edema, occurs early in DMD, prior to the loss in contractile tissue and accumulation of fatty infiltration. The importance of inflammation in DMD is supported by the 100-fold higher serum levels of TNF-α in boys with DMD compared to controls (27.8 vs. 0.27 ng/L) [180]. Changes in the serum levels of TNF-α with age are also consistent with the observations that muscle expression of TNF-α and IL-6 decreases with age [181]. In another type of muscular dystrophy, FSHD, a direct relationship between inflammatory markers (serum and tissue) and hyperintensity observed on STIR images has also been documented [182]. Due to these early inflammatory changes a wide range of therapeutics are in clinical trials for NMD targeting specific inflammatory pathways [183].
Changes in muscle T2, MT, and diffusion have all been commonly used to look at acute muscle damage and inflammation. Damage and inflammation has been induced in animal models using myotoxins [184, 185], a local inflammatory agent [93, 186–188], and in humans [189–191] and preclinical models [192–195] following eccentric muscle contractions. Due to the close association between muscle damage (loss of sarcoplasm integrity), inflammation, and edema, it is often difficult to separate these individual components from net changes in MRI signal. Despite this, careful animal studies along with detailed histological analysis at specific time points [93, 186] and multimodal MR acquisitions are providing insight into sources of the different contrast mechanisms [57, 93, 184, 186]. Often in these analyses it is necessary to take into account the multicomponent nature of relaxation or diffusion that are occurring on the subpixel scale [186]. Due to the fact that the primary problem in many of the muscular dystrophies is related to a mutation or absence of a structural protein, many modern therapeutics aim at replacing or mitigating these defective or missing proteins which leads to bouts of muscle damage and inflammation [183].
Agents that are known to decrease inflammation have also been shown to lower muscle T2. Currently the only intervention that has been shown to be successful in mitigating some of the effects of dystrophy are glucocorticosteroids. Studies have shown that corticosteroid treatment can significantly improve muscle strength and function, reduce the incidence of scoliosis, maintain the respiratory and cardiac function, as well as prolong ambulation and survival in boys with DMD [196–198]. Although there is increasing evidence of long-term benefits of corticosteroids in DMD, the exact mechanism of action of these drugs in dystrophic muscle is unclear but a primary mechanism is believed to reduce muscle inflammation possibly by modulating NF-κβ activation. Arpan et al. measured the muscle water T2 in 5 to 7 year-old DMD boys whom were using corticosteroids and age matched corticosteroid naïve subjects and found that muscle water T2 measured by 1H-MRS was significantly reduced in both the vastus lateralis and soleus muscles of the boys on corticosteroids [199], consistent with the anti-inflammatory effect of corticosteroids (Fig. 5). At the low levels of fatty tissue deposition in these young DMD patients, they also found lower T2 values in both thigh and lower leg muscles of boys on corticosteroid treatment. Of the muscle groups studied, the gracilis muscle was the only exception. Where, the gracilis is known to be one of the most preserved muscles in DMD and hence might not reveal treatment response at such a young age. Both MRI and MRS measures detected the beneficial effects of corticosteroids on the skeletal muscles as early as 3 months after drug initiation. Additional evidence of ability of water T2 to be a readout for inflammation was shown by Marty et al. [32] in which they found an almost complete recovery to normal water T2 values after 3 months of steroid treatment in patients with juvenile dermatomyositis.
Fig.5
Cross-sectional comparisons of water T2 measured by MRS between corticosteroid- treated (CS) and corticosteroid-naïve (CS-naïve) boys with Duchenne muscular dystrophy. (A) Spectroscopic relaxometry measurement using 1H-MRS STEAM to quantify water T2 in individual muscles. (B) T2 values for both the soleus (Sol) and vastus lateralis (VL) muscles were lower in CS boys compared to the CS-naïve boys, indicating less damage in the muscles of boys on corticosteroid treatment. Figure reproduced with permission from [199].
![Cross-sectional comparisons of water T2 measured by MRS between corticosteroid- treated (CS) and corticosteroid-naïve (CS-naïve) boys with Duchenne muscular dystrophy. (A) Spectroscopic relaxometry measurement using 1H-MRS STEAM to quantify water T2 in individual muscles. (B) T2 values for both the soleus (Sol) and vastus lateralis (VL) muscles were lower in CS boys compared to the CS-naïve boys, indicating less damage in the muscles of boys on corticosteroid treatment. Figure reproduced with permission from [199].](https://content.iospress.com:443/media/jnd/2019/6-1/jnd-6-1-jnd180333/jnd-6-jnd180333-g005.jpg)
Whereas the clinical benefits of steroids in DMD are clear, their use also comes with significant side effects and great effort has been spent to identify new anti-inflammatory agents for the NMDs [183]. Preclinical studies in the golden retriever muscular dystrophy (GRMD) model revealed that MRI water T2 changes following the treatment with a nemo-binding-domain (NBD) peptide, which is a specific inhibitor of NF-κβ [200]. Post NBD treatment, GRMD dogs had normalized postural changes and a trend towards lower tissue injury on T2 images. Unfortunately, despite phenotypic improvement in the dystrophic dogs, NBD administration over time led to infusion reactions and an immune response in both treated GRMD and wild type dogs. Other drugs that target inflammation that have shown great success in preclinical models such as Vamorolone (VBP-15; NCT03439670), Edasalonexent (CAT-1004; NCT02439216), Histone deacetylase 2 inhibitor (Givinostat; NCT02851797) are now in clinical trials [183] and either plan to or include MRI and MRS measures as secondary outcome measures.
23Na imaging – see also section 2.7 – showed that areas of hyperintensity on STIR images from skeletal muscle in DMD subjects are directly related to muscle edema [201]. In a pilot study, Glemser et al. performed a longitudinal assessment of edema in 2 DMD patients treated with eplerenone or steroid using a combination of 23Na, Dixon, and STIR imaging [178]. This study demonstrated that longitudinal changes in sodium content, and presumably tissue edema, can be noninvasively monitored throughout therapeutic intervention.
Taken together, these findings indicate that multiple MR sequences may be sensitive to early inflammation in the NMDs and emphasize the potential of MRI and MRS as biomarkers for the quantification of early and subtle muscle changes caused by the disease process and evaluation of therapeutic interventions in NMD.
Fat infiltration
Muscle fat infiltration has been extensively investigated in NMDs with single-voxel 1H MRS and 2D and 3D imaging. Over the past decade, fat infiltration has been evaluated with respect to functional measures, the rate of disease progression, in clinical trials, and to assess differences between and within individual muscles. A listing of important NMD studies to date assessing muscle fat fraction can be found in the recently published article from our COST action [26]. All these findings together showed that muscle fat infiltration differs between muscles and diseases, is highly associated with disease progression and that functional and strength measures are correlated to the fat fraction in NMD. A recent large longitudinal study in DMD reinforced this finding, with correlations to functional endpoints and sentinel events ranging from 0.59 to 0.78 depending on the muscle studied [202]. Besides all the possible readouts used for fat fraction itself — i.e. whole muscle fat fraction, specific volume fat fraction for an individual muscle or muscle groups, delta % fat etc. – other closely related measures, such as contractile cross-sectional-area (cCSA = % fat × total CSA) or muscle volume have also been widely investigated and it was shown that specific strength is reduced in a number of NMD [10, 203–205]. Recently, this analysis was extended by obtaining physiological cross-sectional areas in patients with FSHD, showing that specific strength is also reduced in these patients [206]. Besides the relation with function, some recent studies also focused on the methodological aspects of fat infiltration as outcome measure. Different MR fat quantification methods have been assessed and benchmarked against each other and other methods for fat quantification [13, 26, 207–210]. Muscle fat fraction measurements showed to be highly reproducible from day-to-day and across centers, with CV values ranging between 1.8–7.3% [10, 88, 211]. However, in situations where muscles inevitably change in between measurements, for instance in a maturing study population (for instance in patients with DMD and patients with spinal muscular atrophy, SMA), repositioning according to internal muscle references and bony landmarks becomes more challenging and could affect the reproducibility.
It is important to consider the non-uniform fat distribution patterns along the proximodistal muscle axis in various NMDs [145–147, 212, 213]. This non-uniform shape emphasizes the need for accurate spatial localization between measurements, as a slight shift of the imaging stack or volume can result in over- or underestimation of fat fraction between measurement points. Subsequently, the choice of intrinsic parameters of most imaging and spectroscopy approaches, i.e. slice gaps, slice thickness, restricted voxel size, results in limited and location specific information, which could amplify the effect of inaccurate spatial localization. 3D acquisitions with full limb coverage would allow accurate offline matching of datasets in a standardized way as well as the possibility to retrospectively decide which readout is most suitable for the study set-up.
Fibrosis
Besides fatty infiltration of skeletal musculature, patients with NMD often show excessive accumulation of extracellular matrix proteins as collagen (fibrosis) in their skeletal muscles. The process of formation of proteins in the extracellular space between remaining myocytes and resulting scars is physiologically active during repair of damaged musculature (e.g. after injuries). This repair involves several cell types acting in response to various local and systemic signals, but those activities are not persisting in healthy subjects. In contrast, during chronic tissue damage in muscular dystrophies, an inflammatory cell infiltration persists, leading to activation of fibroblasts and their transformation to myofibroblasts, which are continuously building up excess amounts of connective tissue, while the reparative capacity of muscle stem cells is more and more attenuated.
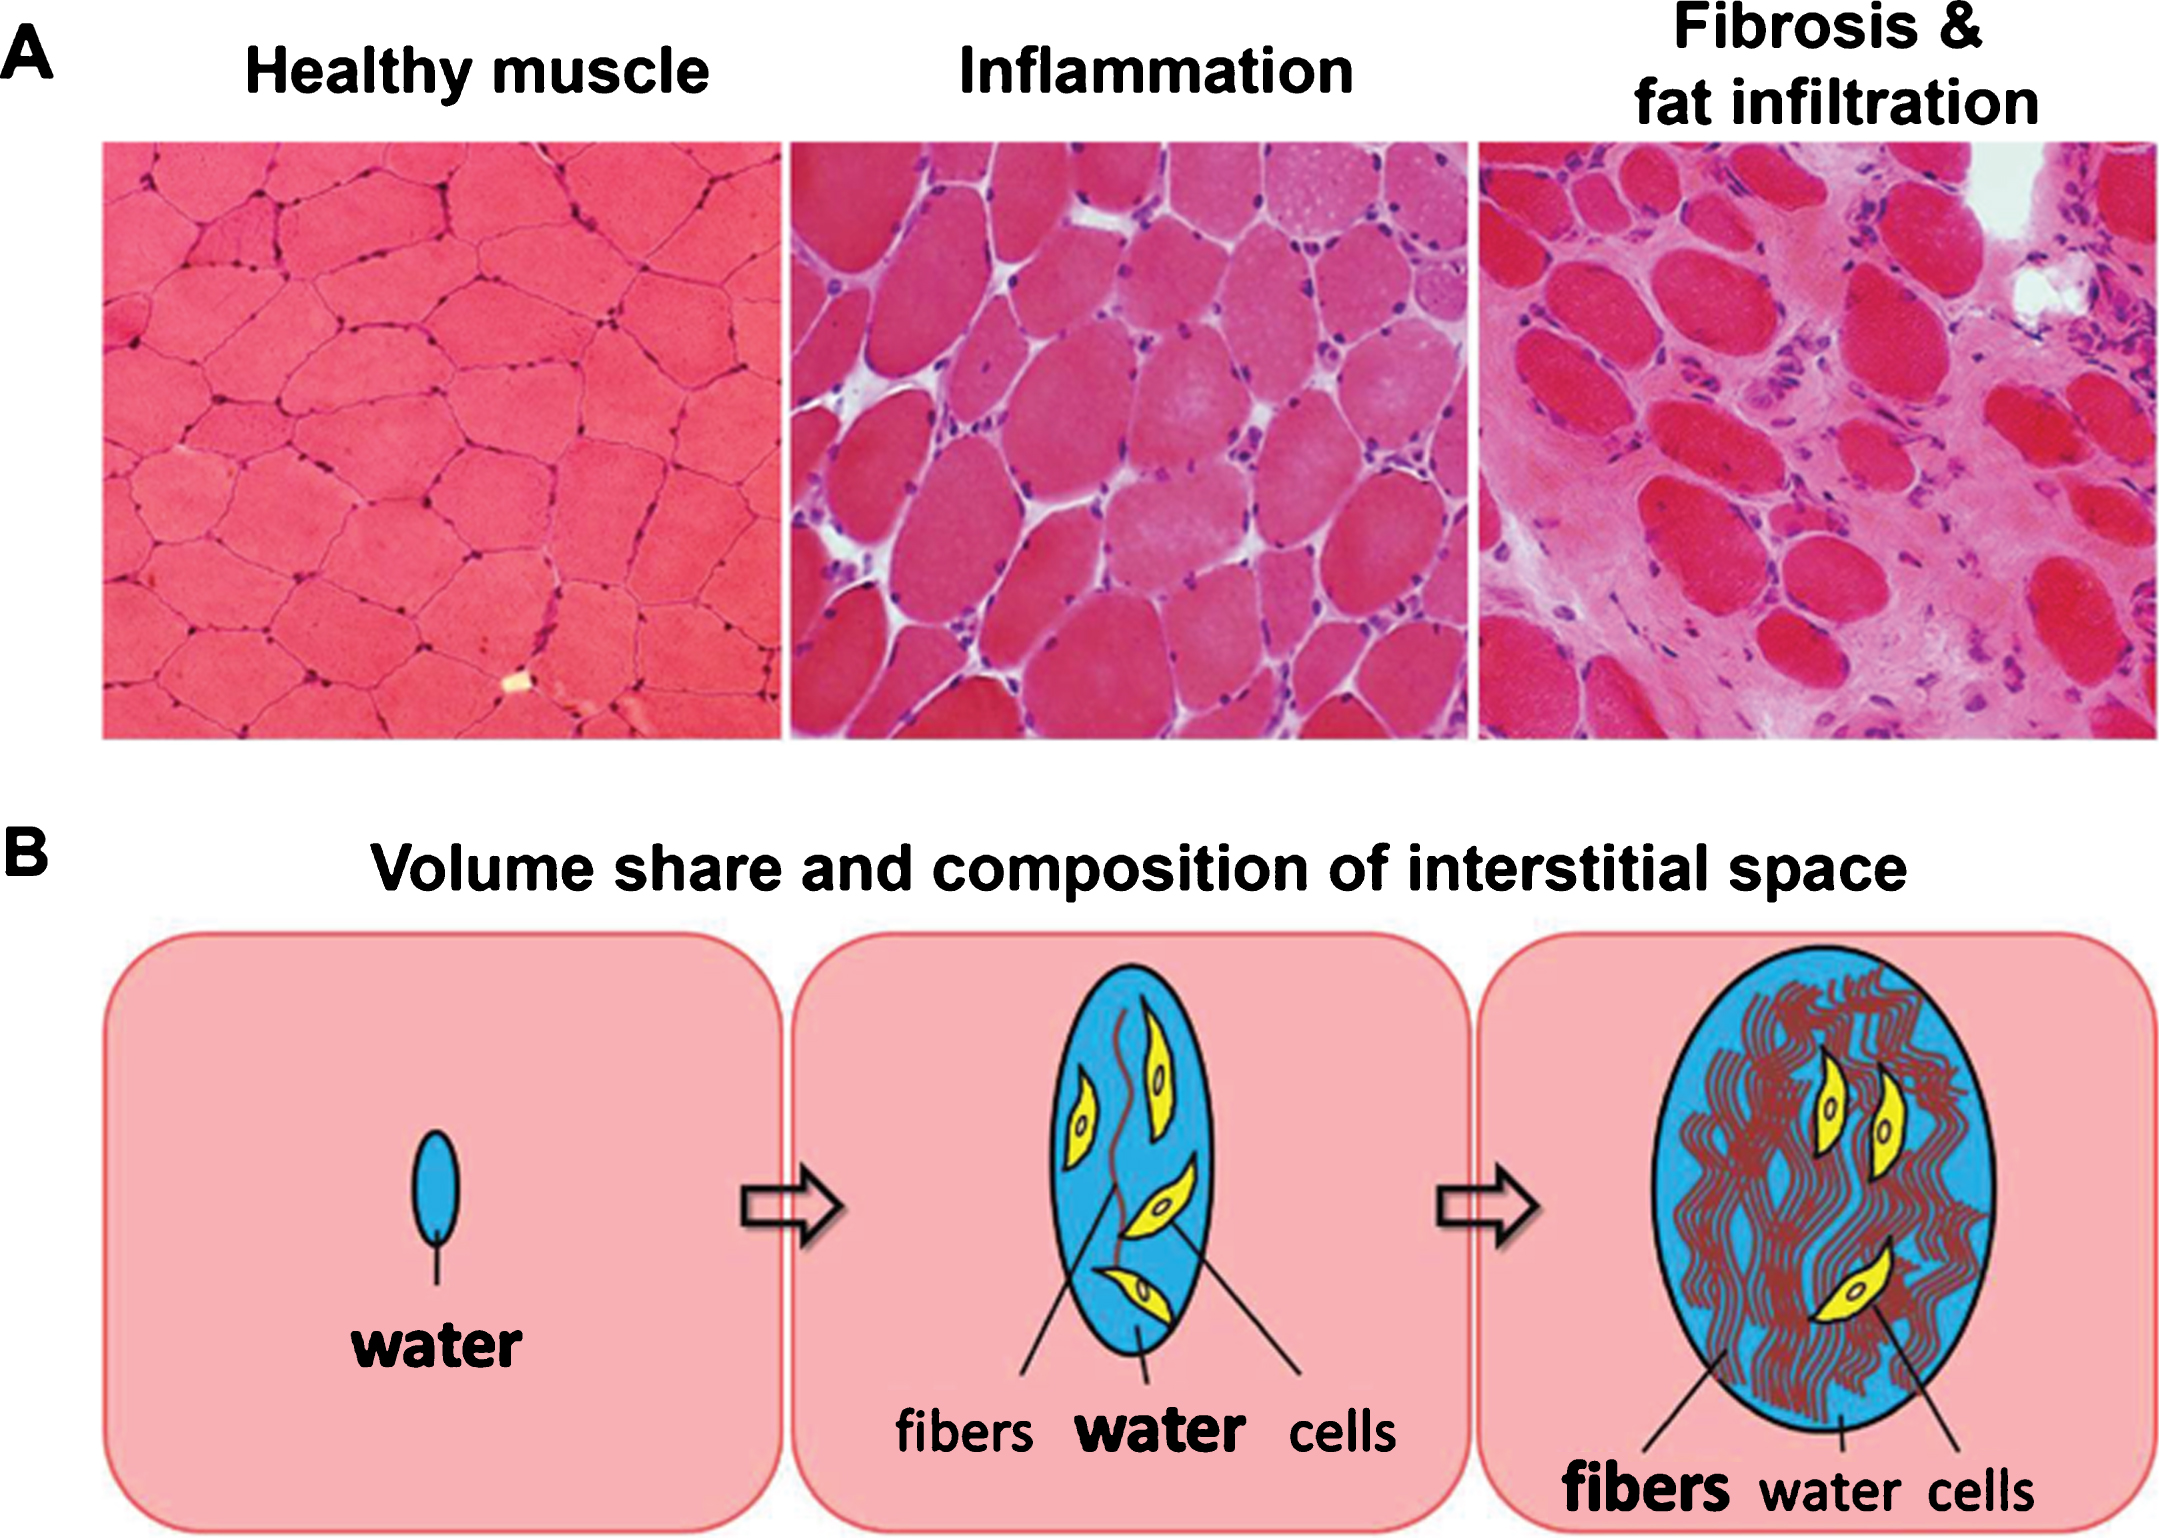
Volume share and composition of the extracellular space in musculature involved in NMD strongly depends on the intensity and duration of inflammatory activity (Fig. 6). Their non-invasive detection is of high clinical interest in order to better stage the disease and monitor therapeutic interventions. In early involvement of musculature, inflammatory activity leads to increasing amounts of interstitial fluid without fibers. Thus, an increased amount of free water is detectable by prolonged T2 values in MRI, and also other MR detectable features of musculature (e.g. proton density, diffusion, magnetization transfer, 23Na content) undergo changes due to inflammation. Persistent inflammatory activity often leads to an irreversible and increasing accumulation of protein fibers in the extracellular space (fibrosis). It is evident that mechanical properties (stiffness) and signal characteristics of musculature in MRI depend on the composition of the extracellular compartment containing variable amounts of fluid and increasing volume share of protein fibers.
Fig.6
(A) Histological sections of healthy muscle, inflamed muscle, and heavily fat infiltrated and fibrotic muscle tissue. (B) Schematic of changes in volume share and composition of the interstitial space due to inflammation and as a consequence of fibrosis and fat infiltration.
However, since fibrotic areas and remaining muscular elements are distributed microscopically, it is impossible to selectively record MR signals from the interstitial compartment only. We have to deal with a superposition of signal contributions from remaining functional musculature, from the components of the interstitial space (mainly water and protein fibers, but also cellular elements), and in some cases from fat in cases with fatty degeneration. So, valid and unambiguous interpretation of results from MR imaging with respect to fibrosis of musculature is very challenging. The gold standard for assessment of fibrosis (in any type of tissue) is biopsy. Unfortunately, this procedure is invasive, and results are often not representative for extended tissue areas, since fibrosis is often not disseminated homogenously, neither microscopically nor macroscopically. Therefore, non-invasive imaging techniques for reliable assessment of the degree of fibrosis are highly desired.
The most common MR approach for examination of muscle stiffness is MR elastography [101, 123]. This technique works with mechanical stimulation and assessment of mechanical wave propagation inside musculature and is established for assessment of fibrosis in other organs like liver and breast. Applications in musculature are more difficult because of the variable muscle tone and geometric anisotropy of muscle tissue (see section 2.5).
Other approaches to non-invasively measure fibrosis by MRI are currently investigated. Changes in water diffusion, magnetization transfer, prolonged T1, prolonged T1-rho, short T2 components, and late enhancement after administration of a contrast agent were correlated to fibrosis in myocardium, liver, and bone marrow [94, 214–217]. However, only a few approaches have been discussed regarding applications in NMD [6, 93]. Pathological events concurrent to fibrosis in muscular dystrophy, such as inflammation and muscle damage, may affect the contrast in the same direction or in opposite direction than fibrosis, which poses a challenge to disentangle the contribution of fibrosis. Nevertheless, a promising technique that deserves further attention in the context of NMD is ultra-short echo time (UTE) imaging, which was already applied to characterize age-related difference in collagenous tissue in muscle [218].
Muscle cell morphology/architecture
Routine clinical MRI investigation in patients with NMD continues to rely largely on T1-weighted, T2-weighted and STIR methods to obtain high definition anatomical information. These methods primarily distinguish between apparently normal appearing muscle fibers and muscle tissue with strong fatty infiltration, which represents the end stage of the disease process. In the context of clinical patient management and treatment there is an important need to visualize the early and ongoing pathological changes, which are occurring in the remaining muscle fibers. For clinical trials, such information is vital to understand drug-target interaction and to identify early treatment response. In the muscular dystrophies, disease progression is characterized at the cellular level by cycles of degeneration and regeneration of muscle fibers. Over time, the ability to regenerate fibers is lost and fibers are eventually replaced by fibrotic tissue and fat. Histological measurement of muscle in animal models shows that the distribution of muscle fiber sizes changes in dystrophic muscle over and above differences driven by maturation or healthy ageing [219]. Specifically, an increase in the proportion of fibers with much larger or smaller diameter than normal muscle is observed, represented by a shift and broadening of the muscle fiber size histogram [220]. In addition, muscle sarcolemma permeability to large tracer molecules is increased in dystrophic muscle, driven by damage to the membrane [221, 222].
These two basic morphological properties (fiber size and permeability) are fundamental determinants of the effective (apparent) diffusivity of water within the tissue microstructure. Indeed, the earliest in vivo studies of self-diffusion characteristics of water in tissue by magnetic resonance methods were made in excised muscle specimens [223]. In that early work Tanner demonstrated that measurement of water diffusivity at extremely long diffusion time (hundreds of milliseconds to seconds, achieved through the use of stimulated echoes) showed evidence of restricted behavior. The magnitude of the effect increased with diffusion time as each water molecule has an increased probability of interacting with major barriers in the tissue such as the sarcolemma itself. More recently such measurements have been revisited as imaging experiments in living tissue, both in animal models and in human subjects [50, 220, 224–226]. In the context of NMD, studies in wild type mice have shown that clear maturation related changes can be seen in diffusion restriction [220], while in the mdx-mouse model significant differences are reported, particularly at long diffusion times with reduced restriction compared to wild type animals [227]. Applications of the DWI technique in humans are also described in section 2.3.
To quantify the changes seen using diffusion methods, Tanner et al. applied a simple biophysical model of regularly spaced semi-permeable membranes to estimate muscle fiber size and permeability [223]. It is however clear from the progressively complex models which have subsequently been proposed to quantify muscle water diffusion behavior [224, 226, 228], that sarcolemmal permeability and muscle fiber scale are inherently opposing factors – increasing permeability reduces restriction whatever the change in muscle fiber size. In diseased muscle, such as in the muscular dystrophies where significant changes are expected in muscle fiber permeability, it seems unlikely that a unique solution is possible and that the effects of altered permeability will dominate the ability to assess muscle fiber sizes [229]. Nevertheless, the potential to differentiate normal from diseased muscle using long diffusion times and to detect changes with time [227], as suggested by recent animal data suggest that further development is warranted.
EMERGING IMAGING TECHNOLOGY
Muscle segmentation
Segmentation of individual muscles is of high interest in NMD, as fat infiltration can differ greatly even between adjacent muscles. This issue is also of interest if one aims at monitoring changes resulting from training and/or pharmaceutical interventions.
The task of segmenting MR images into meaningful compartments has been recognized as challenging for a variety of reasons. In addition to the high muscle shape variability among subjects, fatty infiltration and muscle atrophy can change the visibility and location of borders between muscles and therefore greatly complicate the segmentation task. So far, manual segmentation of anatomical structures is the gold standard and has been used in multiple studies. However, this approach is widely acknowledged as very time-consuming and can be operator-dependent [230]. For example, accurate segmentation of the quadriceps femoris compartment in controls may take a few hours.
More recently, several semi-automated and automated methods have been tested on MR images of healthy subjects. An example by Ogier et al. is shown in (Fig. 7) [231]. They implemented an algorithm allowing a semi-automatic transverse propagation of a number of manually drawn masks, resulting in an 85% reduction in segmentation time. A random walk algorithm based on graphs has been reported by Baudin et al. [232, 233], while Gilles et al. [234] proposed a method based on mesh deformable registration models. In order to take into account the large inter-individual variability, Prescott et al. [235] used a semi-automatic segmentation method based on the pre-selection of appropriate templates selected from a database. Using atlas-based registration, Ahmad et al. proposed a semi-automatic segmentation tool for quadriceps muscles [236]. At the whole body-level and using a multi-atlas based method, Karlsson et al. reported a 3% volume error for the quadriceps femoris compartment [237]. Using a similar approach, Le Troter et al. further confirmed a 3% volume error for the quadriceps femoris compartment but reported much larger errors when considering individual muscles [238]. The corresponding muscle volume errors measurements ranged from 4 (vastus medialis muscle) to 17% (rectus femoris and vastus lateralis muscles).
Fig.7
Semi-automatic segmentation of the upper leg muscles on axial slices. (A) Manual segmentations (blue colored ROIs) of vastus lateralis (VL), rectus femoris (RF), vastus medialis (VM) and vastus intermedius (VI). Sagittal and axials views of the automatic segmentations of intermediate slices (yellow-orange colored ROIs) based on (B) 2 and (C) 4 initial manual segmentations. Figure reproduced from Ref. [231] with permission.
![Semi-automatic segmentation of the upper leg muscles on axial slices. (A) Manual segmentations (blue colored ROIs) of vastus lateralis (VL), rectus femoris (RF), vastus medialis (VM) and vastus intermedius (VI). Sagittal and axials views of the automatic segmentations of intermediate slices (yellow-orange colored ROIs) based on (B) 2 and (C) 4 initial manual segmentations. Figure reproduced from Ref. [231] with permission.](https://content.iospress.com:443/media/jnd/2019/6-1/jnd-6-1-jnd180333/jnd-6-jnd180333-g007.jpg)
Overall, segmentation methods have been developed and tested so far mostly in healthy subjects so that the issues of fat infiltration and muscle atrophy as confounding factors still need to be systematically addressed.
Accelerated imaging
The acquisition time of quantitative MRI is a barrier to the expanded use of these methods in NMD, particularly for DMD and SMA, where restricting the duration of the protocol is critical to ensuring child compliance and avoiding motion artifacts.
The acquisition time of an MRI acquisition is conventionally limited by the need to acquire a matrix of raw data (k-space) of an equivalent size to the eventual desired imaging matrix (the Shannon-Nyquist criterion). Whereas the read dimension is acquired rapidly, the other dimensions using phase encoding require multiple repetition times. If the amount of k-space data points to be acquired can be reduced by the use of additional information, then the number of repetition time delays and hence the acquisition time can be reduced.
Parallel imaging, now available on all modern scanners, achieves this by exploiting the spatial sensitivity of multi-channel array coils. More recently, research effort has exploited a different source of additional information, the sparsity of the image under a mathematical transform, such as discrete wavelets or the calculation of total variation. If the k-space is undersampled quasi-randomly, such that no coherent aliasing is produced under inverse Fourier transformation, then the sparsity in spatial and/or temporal domains can be exploited to permit a high quality iterative reconstruction. This method has been coined compressed sensing.
Research into the use of compressed sensing in MRI has proliferated [240], with applications in skeletal and cardiac muscle relevant to NMD. It has been demonstrated that combined compressed sensing and parallel imaging could be applied to a 3D IDEAL-type fat fraction measurement in skeletal muscle at acceleration factors of up to 5× without significant loss of image quality or impairment of fat fraction fidelity (Fig. 8) [22, 239, 240].
Fig.8
Reconstructions of the left lower leg of a subject showing (A) the calculated fat fraction maps and (B) the total water and fat signal map for a fully sampled acquisition (top row) using CS and traditional parallel imaging (GRAPPA) with different undersampling ratios (subsequent rows). Figure reproduced with permission from Hollingsworth et al. [239].
![Reconstructions of the left lower leg of a subject showing (A) the calculated fat fraction maps and (B) the total water and fat signal map for a fully sampled acquisition (top row) using CS and traditional parallel imaging (GRAPPA) with different undersampling ratios (subsequent rows). Figure reproduced with permission from Hollingsworth et al. [239].](https://content.iospress.com:443/media/jnd/2019/6-1/jnd-6-1-jnd180333/jnd-6-jnd180333-g008.jpg)
The measurement of cardiac function is of increasing interest in NMD. In preclinical cardiac imaging, a Cartesian spatiotemporal undersampling scheme has been used to allow an acceleration of up to 3× [241] while producing comparable results for end systolic and end diastolic volumes and the early to late filling ratio in diastole. Subsequently, a 2D multi-slice golden-angle radial acquisition was applied to a sequence with ultra-short echo time, which reduces artifacts due to flow and susceptibility [242]. Golden-angle radial schemes permit post-hoc decisions to be made about the number of spokes to be reconstructed per cardiac phase and the number of cardiac phases resolved in the spatiotemporal scheme. This permitted accelerations of 2, 4 and 5× to be assessed for end-systolic-volume, end-diastolic-volume, ejection fraction and cardiac output, using Bland-Altman analysis.
The assessment of myocardial extra-cellular volume by pre- and post- contrast gadolinium T1 measurement has found an increasing role in cardiac studies, with potential applications to monitoring the neuromuscular disease process [243]. Marty et al. have demonstrated T1 measurement using compressed sensing reconstruction with a 2D multi-slice radial MOLLI sequence which permits accurate reconstruction of T1 maps in a breath hold of 5 heart beats, a substantial time saving over the 12–17 heartbeats conventionally required [244]. This has recently been extended to rapid T1-mapping of skeletal muscle in Becker muscular dystrophy [245].
Measuring muscle contraction & strain
The MRI techniques used for dynamic muscle contraction and strain imaging can be categorized in three main groups: MR tagging, phase contrast (PC), and displacement encoding with stimulated echoes (DENSE). Tagging has been used to monitor tissue displacement and deformation during active isometric contraction in humans [246, 247] as well as for muscle indentation in rats [248] and in humans [249, 250]. The PC method, which enables tissue velocity measurements in three directions, has been applied to quantify muscle inertial forces [251], as well as changes in fascicle length [252] and strain rate [253, 254]. DENSE is conceptually similar to PC, as it encodes displacement on the phase of the signal, but it is based on the acquisition of stimulated echoes. One of the advantages of DENSE over PC is that it allows to encode motion over longer time intervals, which is especially beneficial for skeletal muscles, that are characterized by low velocities [255].
Dedicated MRI technology has been developed to visualize and quantify muscle deformation during active and passive contraction [256]. Dynamic muscle imaging can be performed in real time [257] or in a triggered fashion by mechanically restricting muscle motion to repeatable patterns, or by using electrical muscle stimulation [254, 258]. Because of imaging speed restrictions, real-time imaging is commonly limited to a 2D single slice approach, or 3D with coarse spatiotemporal resolution [250, 257]. When the motion task can be consistently repeated, displacements or velocities can be acquired in a segmented way, allowing for volumetric acquisition and 3D strain measurements. Mazzoli et al. [259] have recently introduced a 4D PC method for quantification of velocities and strain rate of the muscles in the lower leg during active plantarflexion and dorsiflexion, using the latest compressed sensing acceleration technology requiring only 2:46 min of scan time (Fig. 9).
Fig.9
Accelerated 3D dynamic muscle contraction imaging of the lower leg during active plantarflexion and dorsiflexion. (A) Two velocity-imaging frames from a 12-frame movie with varying degree of image acceleration. The reference image required 10:52 min of scan time and 326 repetitions of the motion task, whereas the 6.41 times accelerated scan was only 2:46 min and 83 repetitions. (B) Velocities in foot-head (FH) direction for 4 muscles of the lower leg during the motion cycle for various degree of image acceleration. Figure was reproduced with permission from Mazzoli et al. [259].
![Accelerated 3D dynamic muscle contraction imaging of the lower leg during active plantarflexion and dorsiflexion. (A) Two velocity-imaging frames from a 12-frame movie with varying degree of image acceleration. The reference image required 10:52 min of scan time and 326 repetitions of the motion task, whereas the 6.41 times accelerated scan was only 2:46 min and 83 repetitions. (B) Velocities in foot-head (FH) direction for 4 muscles of the lower leg during the motion cycle for various degree of image acceleration. Figure was reproduced with permission from Mazzoli et al. [259].](https://content.iospress.com:443/media/jnd/2019/6-1/jnd-6-1-jnd180333/jnd-6-jnd180333-g009.jpg)
Dynamic imaging offers great opportunities to study musculoskeletal healthy function and dysfunction from (neuromuscular) disease, particularly when combined with structural information and modeling of muscle function. PC MRI in skeletal muscles showed non-uniform strain values in the biceps brachii during elbow flexion, as well as in the soleus aponeurosis-tendon complex [260, 261]. A later study combined such information with finite element modeling and confirmed that a different fascicle length and curvature within the muscle are the main cause for non-uniform strains [262]. Non-uniform strain values were also reported in the tibialis anterior [263], as well as changed strain rate values in the gastrocnemius muscle [264].
Sinha et al. observed significant differences in strain rates between young and elderly subjects in the medial gastrocnemius, as well as smaller angles between the principal strain rate and the fiber direction in the older cohort [253]. Since acquisition was limited to a single slice, the out-of-plane component of the strain rate could not be measured, and was estimated under the assumption of volume incompressibility [265, 266]. Non-collinearity of the strain directions and fiber directions and non-uniform strains observed are believed to be caused by architectural heterogeneity in terms of fiber lengths and pennation angles [263]. Diffusion tensor imaging (DTI) combined with appropriate post-processing, allows for determination of fiber lengths [267, 268], fiber curvatures [68, 269, 270], and pennation angles [268]. We foresee that combining these architectural parameters with local 3D strain measurement will assist in a better understanding of mechanisms of altered muscle force production and lateral force transmission as a consequence of healthy aging and NMD.
MRI/PET
MRI/PET is a relatively new multimodal imaging technique, which combines superior anatomical, structural, and functional information provided by MRI, with the greater sensitivity of PET for providing molecular information via the detection of radiolabeled molecular tracers. The evolution of MRI/PET has been rapid over the past decade and has successfully addressed the technical challenges, which are related to the design of PET detectors that operate in the presence of the strong magnetic field in the MR scanner. Initially this resulted in high-performance preclinical prototype and research systems, but by now both preclinical and clinical PET/MRI systems are available from several vendors [271].
There may be added value to PET/MRI in the field of NMD, considering that MRI/PET is practically the combination of a standard MRI, which means that all the MRI techniques described in this paper may be enriched with molecular information from PET. Currently, because of its young age, there are only few examples of application of MRI/PET in the neuromuscular field. Behera et al. [272] observed increased 18F-FDG uptake in the affected nerve of animals with neuropathic pain. Based on these findings Lee et al. showed increased 18F-FDG uptake in the ipsilateral trapezius muscle in a limited number of patients with varying degree of severity of spinal accessory neuropathy [273]. Priola et al. showed that the combination of PET and MRI can provide additional information to the standard computed tomography (CT) for the identification of myasthenia gravis, the detection and type of the thymic abnormality, and preoperative planning [274]. Haddock et al. employed hybrid MRI/PET to determine the relationship between relative 18F-FDG uptake and MRI T2 changes in skeletal muscles following resistance exercise. They found a high correlation between 18F-FDG uptake and changes in muscle T2 with physical exercise, leading to an improved insight into the metabolic changes that occur with muscle activation [275]. Since the family of neuromuscular disorders is associated with a large number of muscle pathologies the role of this technology is expected to increase as new protocols and PET tracers become available.
SUMMARIZING PERSPECTIVES
For the seven working group three meetings of COST action BM1304, research teams from a large number of universities have contributed unpublished preclinical and clinical data with the intention to discuss the potential and pitfalls of a large range of advanced imaging techniques. The workshops were attended by a core group of attendees and a selected group of invited experts per topic. In this workshop report, an overview of the topics that were discussed was presented.
Of the techniques that were discussed, fat fraction by MRS or Dixon imaging as well as T2 relaxation time mapping are already used as an outcome measure in a number of clinical trials as a primary or secondary endpoint (e.g. NCT02851797, NCT02439216) [276]. In the research realm, a significant number of publications have appeared on DTI and 31P; for DTI several groups have been working together on consensus protocols for application in skeletal muscle, whereas the commercial availability of higher field human MR systems has resulted in renewed interest in phosphorous MRS and MRI by several groups. In terms of practical implementation, both (semi-) automatic segmentation and scan acceleration are areas of great interest, and a number of groups are actively pursuing these goals. Imaging of fibrosis and/or other aspects of muscle tissue apart from fatty infiltration is being regarded as a great clinical need, but the optimal technique to assess this remains a topic for further study.
The atmosphere during the workshops was open and informal, and the frequency of the meetings created common ground for new collaborations and strengthening of existing ones. The action brought the community together and had several tangible outputs in the form of shared publications. The final activity of MYO-MRI consisted of the first International Conference on Imaging in Neuromuscular Disease [277]. The conference was very successful, with 200 participants and almost equal contribution from clinical and academic partners, with more than 10% industry participation. This illustrates the large interest in imaging in NMD and shows that collaboration between disciplines in this field is very active.
ACKNOWLEDGMENTS
This work was support by The European Cooperation in Science and Technology (COST) action BM1403 (MYO-MRI).
REFERENCES
[1] | Díaz-Manera J , Llauger J , Gallardo E , Illa I . Muscle MRI in muscular dystrophies. Acta Myol. Pacini Editore. (2015) ;34: (2-3):95–108. |
[2] | Carlier PG , Mercuri E , Straub V . Applications of MRI in muscle diseases. Neuromuscul Disord. (2012) ;22: (2):S41. |
[3] | TREAT-NMD. www.treat-nmd.eu. |
[4] | Straub V , Balabanov P , Bushby K , Ensini M , Goemans N , De Luca A , Pereda A , Hemmings R , Campion G , Kaye E , Arechavala-Gomeza V , Goyenvalle A , Niks E , Veldhuizen O , Furlong P , Stoyanova-Beninska V , Wood MJ , Johnson A , Mercuri E , Muntoni F , Sepodes B , Haas M , Vroom E , Aartsma-Rus A . Stakeholder cooperation to overcome challenges in orphan medicine development: The Example of Duchenne muscular dystrophy. The Lancet Neurology. (2016) ;15: (8):882–90. |
[5] | Thompson R , Straub V . Limb-girdle muscular dystrophies — international collaborations for translational research. Nat Rev Neurol. (2016) ;12: (5):294–309. |
[6] | Carlier PG , Marty B , Scheidegger O , Loureiro de Sousa P , Baudin P-Y , Snezhko E , Vlodavets D . Skeletal muscle quantitative nuclear magnetic resonance imaging and spectroscopy as an outcome measure for clinical trials. JND. (2016) ;3: (1):1–28. |
[7] | Hollingsworth KG , de Sousa PL , Straub V , Carlier PG . Towards harmonization of protocols for MRI outcome measures in skeletal muscle studies: Consensus recommendations from two TREAT-NMD NMR workshops, 2 May 2010, Stockholm, Sweden, 1-2 October 2009, Paris, France. Neuromuscul Disord. (2012) ;22: (2):S54–67. |
[8] | Fischmann A , Hafner P , Gloor M , Schmid M , Klein A , Pohlman U , Waltz T , Gonzalez R , Haas T , Bieri O , Fischer D . Quantitative MRI and loss of free ambulation in Duchenne muscular dystrophy. J Neurol. (2013) ;260: (4):969–74. |
[9] | Hogrel J-Y , Wary C , Moraux A , Azzabou N , Decostre V , Ollivier G , Canal A , Lilien C , Ledoux I , Annoussamy M , Reguiba N , Gidaro T , Le Moing AG , Cardas R , Voit T , Carlier PG , Servais L . Longitudinal functional and NMR assessment of upper limbs in Duchenne muscular dystrophy. Neurology. (2016) ;86: (11):1022–30. |
[10] | Morrow JM , Sinclair CDJ , Fischmann A , Machado PM , Reilly MM , Yousry TA , Thornton JS , Hanna MG . MRI biomarker assessment of neuromuscular disease progression: A Prospective observational cohort study. The Lancet Neurology. (2016) ;15: (1):65–77. |
[11] | Willcocks RJ , Rooney WD , Triplett WT , Forbes SC , Lott DJ , Senesac CR , Daniels MJ , Wang D-J , Harrington AT , Tennekoon GI , Russman BS , Finanger EL , Byrne BJ , Finkel RS , Walter GA , Sweeney HL , Vandenborne K . Multicenter prospective longitudinal study of magnetic resonance biomarkers in a large duchenne muscular dystrophy cohort. Ann Neurol. (2016) ;79: (4):535–47. |
[12] | Willis TA , Hollingsworth KG , Coombs A , Sveen M-L , Andersen S , Stojkovic T , Eagle M , Mayhew A , de Sousa PL , Dewar L , Morrow JM , Sinclair CDJ , Thornton JS , Bushby K , Lochmüller H , Hanna MG , Hogrel J-Y , Carlier PG , Vissing J , Straub V . Quantitative muscle MRI as an assessment tool for monitoring disease progression in LGMD2I: A Multicentre longitudinal study. PLoS ONE. (2013) ;8: (8):e70993. |
[13] | Wokke BH , Bos C , Reijnierse M , van Rijswijk CS , Eggers H , Webb A , Verschuuren JJ , Kan HE . Comparison of dixon and T1-weighted MR methods to assess the degree of fat infiltration in duchenne muscular dystrophy patients. J Magn Reson Imaging. (2013) ;38: (3):619–24. |
[14] | Dixon WT . Simple proton spectroscopic imaging. Radiology. (1984) ;153: (1):189–94. |
[15] | Glover GH . Multipoint Dixon technique for water and fat proton and susceptibility imaging. J Magn Reson Imaging. (1991) ;1: (5):521–30. |
[16] | Glover GH , Schneider E . Three-point Dixon technique for true water/fat decomposition with B0 inhomogeneity correction. Magn Reson Med. (1991) ;18: (2):371–83. |
[17] | Liu C-Y , McKenzie CA , Yu H , Brittain JH , Reeder SB . Fat quantification with IDEAL gradient echo imaging: Correction of bias from T1 and noise. Magn Reson Med. (2007) ;58: (2):354–64. |
[18] | Karampinos DC , Yu H , Shimakawa A , Link TM , Majumdar S . T1-corrected fat quantification using chemical shift-based water/fat separation: Application to skeletal muscle. Magn Reson Med. (2011) ;66: (5):1312–26. |
[19] | Yu H , Shimakawa A , McKenzie CA , Brodsky E , Brittain JH , Reeder SB . Multiecho water-fat separation and simultaneous R2* estimation with multifrequency fat spectrum modeling. Magn Reson Med. (2008) ;60: (5):1122–34. |
[20] | Hamilton G , Yokoo T , Bydder M , Cruite I , Schroeder ME , Sirlin CB , Middleton MS . In vivo characterization of the liver fat 1H MR spectrum. NMR Biomed. (2010) ;24: (7):784–90. |
[21] | Ren J , Dimitrov I , Sherry AD , Malloy CR . Composition of adipose tissue and marrow fat in humans by 1H NMR at 7 Tesla. J Lipid Res. (2008) ;49: (9):2055–62. |
[22] | Loughran T , Higgins DM , McCallum M , Coombs A , Straub V , Hollingsworth KG . Improving highly accelerated fat fraction measurements for clinical trials in muscular dystrophy: Origin and quantitative effect of R2* changes. Radiology. (2015) ;275: (2):570–8. |
[23] | Yu H , Shimakawa A , Hines CDG , McKenzie CA , Hamilton G , Sirlin CB , Brittain JH , Reeder SB . Combination of complex-based and magnitude-based multiecho water-fat separation for accurate quantification of fat-fraction. Magn Reson Med. (2011) ;66: (1):199–206. |
[24] | Hernando D , Hines CDG , Yu H , Reeder SB . Addressing phase errors in fat-water imaging using a mixed magnitude/complex fitting method. Magn Reson Med. (2012) ;67: (3):638–44. |
[25] | Ruschke S , Eggers H , Kooijman H , Diefenbach MN , Baum T , Haase A , Rummeny EJ , Hu HH , Karampinos DC . Correction of phase errors in quantitative water-fat imaging using a monopolar time-interleaved multi-echo gradient echo sequence. Magn Reson Med. (2017) ;78: (3):984–96. |
[26] | Burakiewicz J , Sinclair CDJ , Fischer D , Walter GA , Kan HE , Hollingsworth KG . Quantifying fat replacement of muscle by quantitative MRI in muscular dystrophy. Journal of Neurology. (2017) ;264: (10):2053–67. |
[27] | Carlier PG . Global T2 versus water T2 in NMR imaging of fatty infiltrated muscles: Different methodology, different information and different implications. Neuromuscul Disord. (2014) ;24: (5):390–2. |
[28] | Yao L , Gai N . Fat-corrected T2 measurement as a marker of active muscle disease in inflammatory myopathy. American Journal of Roentgenology. (2012) ;198: (5):W475–81. |
[29] | Azzabou N , Loureiro de Sousa P , Caldas E , Carlier PG . Validation of a generic approach to muscle water T2 determination at 3T in fat-infiltrated skeletal muscle. J Magn Reson Imaging. (2015) ;41: (3):645–53. |
[30] | Lebel RM , Wilman AH . Transverse relaxometry with stimulated echo compensation. Magn Reson Med. (2010) ;64: (4):1005–14. |
[31] | Ben-Eliezer N , Sodickson DK , Block KT . Rapid and accurate T2 mapping from multi-spin-echo data using Bloch-simulation-based reconstruction. Magn Reson Med. (2014) ;73: (2):809–17. |
[32] | Marty B , Baudin P-Y , Reyngoudt H , Azzabou N , Araujo ECA , Carlier PG , de Sousa PL . Simultaneous muscle water T2 and fat fraction mapping using transverse relaxometry with stimulated echo compensation. NMR Biomed. (2016) ;29: (4):431–43. |
[33] | Janiczek RL , Gambarota G , Sinclair CDJ , Yousry TA , Thornton JS , Golay X , Newbould RD . Simultaneous T2 and lipid quantitation using IDEAL-CPMG. Magn Reson Med. (2011) ;66: (5):1293–302. |
[34] | Sinclair CDJ , Morrow JM , Janiczek RL , Evans MRB , Rawah E , Shah S , Hanna MG , Reilly MM , Yousry TA , Thornton JS . Stability and sensitivity of water T2 obtained with IDEAL-CPMG in healthy and fat-infiltrated skeletal muscle. NMR Biomed. (2016) ;29: (12):1800–12. |
[35] | de Sousa PL , Vignaud A , Fleury S , Carlier PG . Fast monitoring of T1, T2, and relative proton density (M0) changes in skeletal muscles using an IR-TrueFISP sequence. J Magn Reson Imaging. (2011) ;33: (4):921–30. |
[36] | Cooper MA , Nguyen TD , Spincemaille P , Prince MR , Weinsaft JW , Wang Y . Flip angle profile correction for T1 and T2 quantification with look-locker inversion recovery 2D steady-state free precession imaging. Magn Reson Med. (2012) ;68: (5):1579–85. |
[37] | Bieri O , Scheffler , Welsch GH , Trattnig S , Mamisch TC , Ganter C . Quantitative mapping of T2 using partial spoiling. Magn Reson Med. (2011) ;66: (2):410–8. |
[38] | de Sousa PL , Vignaud A , Caldas de Almeida Araújo E , Carlier PG . Factors controlling T2 mapping from partially spoiled SSFP sequence: Optimization for skeletal muscle characterization. Magn Reson Med. (2011) ;67: (5):1379–90. |
[39] | Welsch GH , Scheffler , Mamisch TC , Hughes T , Millington S , Deimling M , Trattnig S . Rapid estimation of cartilage T2 based on double echo at steady state (DESS) with 3 Tesla. Magn Reson Med. (2009) ;62: (2):544–9. |
[40] | Heule R , Ganter C , Bieri O . Triple echo steady-state (TESS) relaxometry. Magn Reson Med. (2014) ;71: (1):230–7. |
[41] | Nguyen D , Bieri O . Motion-insensitive rapid configuration relaxometry. Magn Reson Med. (2017) ;78: (2):518–26. |
[42] | Klupp E , Weidlich D , Schlaeger S , Baum T , Cervantes B , Deschauer M , Kooijman H , Rummeny EJ , Zimmer C , Kirschke JS , Karampinos DC . B1-insensitive T2 mapping of healthy thigh muscles using a T2-prepared 3D TSE sequence. PLoS ONE. (2017) ;12: (2):e0171337. |
[43] | Weidlich D , Schlaeger S , Kooijman H , Börnert P , Kirschke JS , Rummeny EJ , Haase A , Karampinos DC . T2 mapping with magnetization-prepared 3D TSE based on a modified BIR-4 T2 preparation. NMR Biomed. (2017) ;30: (11):e3773. |
[44] | Hazlewood CF , Chang DC , Nichols BL , Woessner DE . Nuclear magnetic resonance transverse relaxation times of water protons in skeletal muscle. Biophys J. (1974) ;14: (8):583–606. |
[45] | Araujo ECA , Fromes Y , Carlier PG . New insights on human skeletal muscle tissue compartments revealed by in vivo T2 NMR relaxometry. Biophys J. (2014) ;106: (10):2267–74. |
[46] | Le Bihan D . Molecular diffusion nuclear magnetic resonance imaging. Magn Reson Q. (1991) ;7: (1):1–30. |
[47] | Basser PJ , Jones DK . Diffusion-tensor MRI: Theory, experimental design and data analysis - a technical review. NMR Biomed. (2002) ;15: (7-8):456–67. |
[48] | Assaf Y , Mayk A , Cohen Y . Displacement imaging of spinal cord using q-space diffusion-weighted MRI. Magn Reson Med. (2000) ;44: (5):713–22. |
[49] | Barazany D , Basser PJ , Assaf Y . In vivo measurement of axon diameter distribution in the corpus callosum of rat brain. Brain. (2009) ;132: (5):1210–20. |
[50] | Fieremans E , Lemberskiy G , Veraart J , Sigmund EE , Gyftopoulos S , Novikov DS . In vivo measurement of membrane permeability and myofiber size in human muscle using time-dependent diffusion tensor imaging and the random permeable barrier model. NMR Biomed. (2017) ;30: (3). |
[51] | Novikov DS , Fieremans E , Jensen JH , Helpern JA . Random walks with barriers. Nature Phys. (2011) ;7: (6):508–14. |
[52] | Meier C , Dreher W , Leibfritz D . Diffusion in compartmental systems. II. Diffusion-weighted measurements of rat brain tissue in vivo and postmortem at very large b-values. Magn Reson Med. (2003) ;50: (3):510–4. |
[53] | Damon BM , Froeling M , Buck AKW , Oudeman J , Ding Z , Nederveen AJ , Bush EC , Strijkers GJ . Skeletal muscle diffusion tensor-MRI fiber tracking: Rationale, data acquisition and analysis methods, applications and future directions. Vermathen P, editor. . NMR Biomed. (2017) ;30: (3):e3563. |
[54] | Froeling M , Oudeman J , van den Berg S , Nicolay K , Maas M , Strijkers GJ , Drost MR , Nederveen AJ . Reproducibility of diffusion tensor imaging in human forearm muscles at 3.0 T in a clinical setting. Magn Reson Med. (2010) ;64: (4):1182–90. |
[55] | Holl N , Holl N , Echaniz-Laguna A , Echaniz-Laguna A , Bierry G , Bierry G , Mohr M , Mohr M , Loeffler J-P , Loeffler J , Moser T , Moser T , Dietemann J-L , Dietemann J , Kremer S , Kremer S . Diffusion-weighted MRI of denervated muscle: A Clinical and experimental study. Skeletal Radiol. (2008) ;37: (12):1111–7. |
[56] | Qi J , Olsen NJ , Price RR , Winston JA , Park JH . Diffusion-weighted imaging of inflammatory myopathies: Polymyositis and dermatomyositis. J Magn Reson Imaging. (2008) ;27: (1):212–7. |
[57] | Nelissen JL , Traa WA , de Boer HH , de Graaf L , Mazzoli V , Savci-Heijink CD , Nicolay K , Froeling M , Bader DL , Nederveen AJ , Oomens CWJ , Strijkers GJ . An advanced magnetic resonance imaging perspective on the etiology of deep tissue injury. J Appl Physiol. (2018) ;54: :524. |
[58] | Schwenzer NF , Steidle G , Martirosian P , Schraml C , Springer F , Claussen CD , Schick F . Diffusion tensor imaging of the human calf muscle: Distinct changes in fractional anisotropy and mean diffusion due to passive muscle shortening and stretching. NMR Biomed. (2009) ;22: (10):1047–53. |
[59] | Kermarrec E , Budzik J-F , Khalil C , Le Thuc V , Hancart-Destee C , Cotten A . In vivo diffusion tensor imaging and tractography of human thigh muscles in healthy subjects. AJR Am J Roentgenol. (2010) ;195: (5):W352–6. |
[60] | Froeling M , Nederveen AJ , Heijtel DFR , Lataster A , Bos C , Nicolay K , Maas M , Drost MR , Strijkers GJ . Diffusion-tensor MRI reveals the complex muscle architecture of the human forearm. J Magn Reson Imaging. (2012) ;36: (1):237–48. |
[61] | Froeling M , Oudeman J , Strijkers GJ , Maas M , Drost MR , Nicolay K , Nederveen AJ . Muscle changes detected with diffusion-tensor imaging after long-distance running. Radiology. (2015) ;274: (2):548–62. |
[62] | Ababneh ZQ , Ababneh R , Maier SE , Winalski CS , Oshio K , Ababneh AM , Mulkern RV . On the correlation between T2 and tissue diffusion coefficients in exercised muscle: Quantitative measurements at 3T within the tibialis anterior. Magn Reson Mater Phy. (2008) ;21: (4):273–8. |
[63] | Nygren AT , Kaijser L . Water exchange induced by unilateral exercise in active and inactive skeletal muscles. J Appl Physiol. (2002) ;93: (5):1716–22. |
[64] | Okamoto Y , Mori S , Kujiraoka Y , Nasu K , Hirano Y , Minami M . Diffusion property differences of the lower leg musculature between athletes and non-athletes using 1.5T MRI. Magn Reson Mater Phy. Springer-Verlag. (2012) ;25: (4):277–84. |
[65] | Deux JF , Malzy P , Paragios N , Bassez G , Luciani A , Zerbib P , Roudot-Thoraval F , Vignaud A , Kobeiter H , Rahmouni A . Assessment of calf muscle contraction by diffusion tensor imaging. Eur Radiol. (2008) ;18: (10):2303–10. |
[66] | Hatakenaka M , Matsuo Y , Setoguchi T , Yabuuchi H , Okafuji T , Kamitani T , Nishikawa K , Honda H . Alteration of proton diffusivity associated with passive muscle extension and contraction. J Magn Reson Imaging. (2008) ;27: (4):932–7. |
[67] | Mazzoli V , Oudeman J , Nicolay K , Maas M , Verdonschot N , Sprengers AM , Nederveen AJ , Froeling M , Strijkers GJ . Assessment of passive muscle elongation using diffusion tensor MRI: Correlation between fiber length and diffusion coefficients. NMR Biomed. (2016) ;29: (12):1813–24. |
[68] | Froeling M , Nederveen AJ , Nicolay K , Strijkers GJ . DTI of human skeletal muscle: The Effects of diffusion encoding parameters, signal-to-noise ratio and T2on tensor indices and fiber tracts. NMR Biomed. (2013) ;26: (11):1339–52. |
[69] | De Luca A , Bertoldo A , Froeling M . Effects of perfusion on DTI and DKI estimates in the skeletal muscle. Magn Reson Med. (2016) ;78: (1):233–46. |
[70] | Karampinos DC , Banerjee S , King KF , Link TM , Majumdar S . Considerations in high-resolution skeletal muscle diffusion tensor imaging using single-shot echo planar imaging with stimulated-echo preparation and sensitivity encoding. NMR Biomed. (2012) ;25: (5):766–78. |
[71] | Karampinos DC , King KF , Sutton BP , Georgiadis JG . Intravoxel partially coherent motion technique: Characterization of the anisotropy of skeletal muscle microvasculature. J Magn Reson Imaging. (2010) ;31: (4):942–53. |
[72] | Williams SE , Heemskerk AM , Welch EB , Li K , Damon BM , Park JH . Quantitative effects of inclusion of fat on muscle diffusion tensor MRI measurements. J Magn Reson Imaging. (2013) ;38: (5):1292–7. |
[73] | Hooijmans MT , Damon BM , Froeling M , Versluis MJ , Burakiewicz J , Verschuuren JJGM , Niks EH , Webb AG , Kan HE . Evaluation of skeletal muscle DTI in patients with duchenne muscular dystrophy. NMR Biomed. (2015) ;28: (11):1589–97. |
[74] | Burakiewicz J , Hooijmans MT , Webb AG , Verschuuren JJGM , Niks EH , Kan HE . Improved olefinic fat suppression in skeletal muscle DTI using a magnitude-based dixon method. Magn Reson Med. (2017) ;79: (1):152–9. |
[75] | Hernando D , Karampinos DC , King KF , Haldar JP , Majumdar S , Georgiadis JG , Liang Z-P . Removal of olefinic fat chemical shift artifact in diffusion MRI. Magn Reson Med. (2011) ;65: (3):692–701. |
[76] | Mori S , van Zijl P , Shortle D . Measurement of water-amide proton exchange rates in the denatured state of staphylococcal nuclease by a magnetization transfer technique. Proteins. (1997) ;28: (3):325–32. |
[77] | Sled JG , Pike GB . Quantitative interpretation of magnetization transfer in spoiled gradient echo MRI sequences. Journal of Magnetic Resonance. (2000) ;145: (1):24–36. |
[78] | Gochberg DF , Gore J . Quantitative magnetization transfer imaging via selective inversion recovery with short repetition times. Magn Reson Med. (2007) ;57: (2):437–41. |
[79] | Li K , Zu Z , Xu J , Janve VA , Gore J , Does MD , Gochberg DF . Optimized inversion recovery sequences for quantitative T1 and magnetization transfer imaging. Magn Reson Med. (2010) ;64: (2):491–500. |
[80] | Wolff SD , Balaban RS . Magnetization transfer contrast (MTC) and tissue water proton relaxation in vivo. Magn Reson Med. (1989) ;10: (1):135–44. |
[81] | Swallow CE , Kahn CE , Halbach RE , Tanttu JI , Sepponen RE . Magnetization transfer contrast imaging of the human leg at 0.1 T: A Preliminary study. Magn Reson Imaging. (1992) ;10: (3):361–4. |
[82] | Harrison R , Bronskill MJ , Henkelman RM . Magnetization transfer and T2 relaxation components in tissue. Magn Reson Med. (1995) ;33: (4):490–6. |
[83] | Stanisz GJ , Odrobina EE , Pun J , Escaravage M , Graham SJ , Bronskill MJ , Henkelman RM . T1, T2 relaxation and magnetization transfer in tissue at 3T. Magn Reson Med. (2005) ;54: (3):507–12. |
[84] | Louie EA , Gochberg DF , Does MD , Damon BM . Transverse relaxation and magnetization transfer in skeletal muscle: Effect of pH. Magn Reson Med. (2009) ;61: (3):560–9. |
[85] | Schwenzer NF , Martirosian P , Machann J , Schraml C , Steidle G , Claussen CD , Schick F . Aging effects on human calf muscle properties assessed by MRI at 3 Tesla. J Magn Reson Imaging. (2009) ;29: (6):1346–54. |
[86] | Sinclair CDJ , Samson RS , Thomas DL , Weiskopf N , Lutti A , Thornton JS , Golay X . Quantitative magnetization transfer in in vivo healthy human skeletal muscle at 3T. Magn Reson Med. (2010) ;64: (6):1739–48. |
[87] | Sinclair CDJ , Morrow JM , Miranda MA , Davagnanam I , Cowley PC , Mehta H , Hanna MG , Koltzenburg M , Yousry TA , Reilly MM , Thornton JS . Skeletal muscle MRI magnetisation transfer ratio reflects clinical severity in peripheral neuropathies. Journal of Neurology, Neurosurgery & Psychiatry. (2011) ;83: (1):29–32. |
[88] | Morrow JM , Sinclair CDJ , Fischmann A , Reilly MM , Hanna MG , Yousry TA , Thornton JS . Reproducibility, and age, body-weight and gender dependency of candidate skeletal muscle MRI outcome measures in healthy volunteers. Eur Radiol. 4 ed. (2014) ;24: (7):1610–20. |
[89] | Li K , Dortch RD , Welch EB , Bryant ND , Buck AKW , Towse TF , Gochberg DF , Does MD , Damon BM , Park JH . Multi-parametric MRI characterization of healthy human thigh muscles at 3.0 T - relaxation, magnetization transfer, fat/water, and diffusion tensor imaging. NMR Biomed. (2014) ;27: (9):1070–84. |
[90] | Li K , Dortch RD , Kroop SF , Huston JW , Gochberg DF , Park JH , Damon BM . A Rapid approach for quantitative magnetization transfer imaging in thigh muscles using the pulsed saturation method. Magn Reson Imaging. (2015) ;33: (6):709–17. |
[91] | Sinclair CDJ , Morrow JM , Hanna MG , Reilly MM , Yousry TA , Golay X , Thornton JS . Correcting radiofrequency inhomogeneity effects in skeletal muscle magnetisation transfer maps. NMR Biomed. (2011) ;25: (2):262–70. |
[92] | Ropele S , Filippi M , Valsasina P , Korteweg T , Barkhof F , Tofts PS , Samson R , Miller DH , Fazekas F . Assessment and correction of B1-induced errors in magnetization transfer ratio measurements. Magn Reson Med. (2004) ;53: (1):134–40. |
[93] | Bryant ND , Li K , Does MD , Barnes S , Gochberg DF , Yankeelov TE , Park JH , Damon BM . Multi-parametric MRI characterization of inflammation in murine skeletal muscle. NMR Biomed. 7 ed. (2014) ;27: (6):716–25. |
[94] | Aisen AM, Doi K, Swanson SD. Detection of liver fibrosis with magnetic cross-relaxation. Magn Reson Med. (1994) ;31: (5):551–6. |
[95] | Kim H , Booth CJ , Pinus AB , Chen P , Lee A , Qiu M , Whitlock M , Murphy PS , Constable RT . Induced hepatic fibrosis in rats: Hepatic steatosis, macromolecule content, perfusion parameters, and their correlations—preliminary MR imaging in rats. Radiology. (2008) ;247: (3):696–705. |
[96] | Muthupillai R , Lomas DJ , Rossman PJ , Greenleaf JF , Manduca A , Ehman RL . Magnetic resonance elastography by direct visualization of propagating acoustic strain waves. Science. (1995) ;269: (5232):1854–7. |
[97] | Lewa CJ . Magnetic resonance imaging in the presence of mechanical waves. Spectroscopy Letters. Taylor & Francis. (1991) ;24: (1):55–67. |
[98] | Uffmann K , Ladd ME . Actuation systems for MR elastography: Design and applications. IEEE Eng Med Biol Mag. (2008) ;27: (3):28–34. |
[99] | Hirsch S , Sack I , Braun J . Magnetic resonance elastography. John Wiley & Sons; (2017) . pp. 1. |
[100] | Bensamoun SF , Charleux F , Debernard L , Themar-Noel C , Voit T . Elastic properties of skeletal muscle and subcutaneous tissues in Duchenne muscular dystrophy by magnetic resonance elastography (MRE): A Feasibility study. Elsevier Masson SAS. (2015) ;36: (1):4–9. |
[101] | Green MA , Geng G , Qin E , Sinkus R , Gandevia SC , Bilston LE . Measuring anisotropic muscle stiffness properties using elastography. NMR Biomed. (2013) ;26: (11):1387–94. |
[102] | Guo J , Hirsch S , Scheel M , Braun J , Sack I . Three-parameter shear wave inversion in MR elastography of incompressible transverse isotropic media: Application to in vivo lower leg muscles. Magn Reson Med. (2016) ;75: (4):1537–45. |
[103] | Song J , Kwon OI , Seo JK . Anisotropic elastic moduli reconstruction in transversely isotropic model using MRE. Inverse Problems. (2012) ;28: (11):115003–14. |
[104] | Qin EC , Sinkus R , Geng G , Cheng S , Green M , Rae CD , Bilston LE . Combining MR elastography and diffusion tensor imaging for the assessment of anisotropic mechanical properties: A Phantom study. J Magn Reson Imaging. (2012) ;37: (1):217–26. |
[105] | Klatt D , Papazoglou S , Braun J , Sack I . Viscoelasticity-based MR elastography of skeletal muscle. Phys Med Biol. (2010) ;55: (21):6445–59. |
[106] | Papazoglou S , Braun J , Hamhaber U , Sack I . Two-dimensional waveform analysis in MR elastography of skeletal muscles. Phys Med Biol. (2005) ;50: (6):1313–25. |
[107] | Bilston LE . Soft tissue rheology and its implications for elastography: Challenges and opportunities. NMR Biomed. (2017) ;43: (2):e3832. |
[108] | Chakouch MK , Charleux F , Bensamoun SF . Quantifying the elastic property of nine thigh muscles using magnetic resonance elastography. PLoS ONE. (2015) ;10: (9):e0138873. |
[109] | Bensamoun SF , Ringleb SI , Littrell L , Chen Q , Brennan M , Ehman RL , An K-N . Determination of thigh muscle stiffness using magnetic resonance elastography. J Magn Reson Imaging. (2006) ;23: (2):242–7. |
[110] | Ringleb SI , Bensamoun SF , Chen Q , Manduca A , An K-N , Ehman RL . Applications of magnetic resonance elastography to healthy and pathologic skeletal muscle. J Magn Reson Imaging. (2007) ;25: (2):301–9. |
[111] | Debernard L , Robert L , Charleux F , Bensamoun SF . Characterization of muscle architecture in children and adults using magnetic resonance elastography and ultrasound techniques. Journal of biomechanics. (2011) ;44: (3):397–401. |
[112] | Dresner MA , Rose GH , Rossman PJ , Muthupillai R , Manduca A , Ehman RL . Magnetic resonance elastography of skeletal muscle. J Magn Reson Imaging. (2001) ;13: (2):269–76. |
[113] | Barnhill E , Kennedy P , Hammer S , van Beek EJR , Brown C , Roberts N . Statistical mapping of the effect of knee extension on thigh muscle viscoelastic properties using magnetic resonance elastography. Physiol Meas. (2013) ;34: (12):1675–98. |
[114] | Uffmann K , Maderwald S , Ajaj W , Galban CG , Mateiescu S , Quick HH , Ladd ME . In vivo elasticity measurements of extremity skeletal muscle with MR elastography. NMR Biomed. (2004) ;17: (4):181–90. |
[115] | Heers G , Jenkyn T , Dresner MA , Klein M-O , Basford JR , Kaufman KR , Ehman RL , An K-N . Measurement of muscle activity with magnetic resonance elastography. Clinical Biomechanics. (2003) ;18: (6):537–42. |
[116] | Jenkyn TR , Ehman RL , An K-N . Noninvasive muscle tension measurement using the novel technique of magnetic resonance elastography (MRE). Journal of Biomechanics. (2003) ;36: (12):1917–21. |
[117] | Bilston LE , Tan K . Measurement of passive skeletal muscle mechanical properties in vivo: Recent progress, clinical applications, and remaining challenges. Annals of Biomedical Engineering. (2015) ;43: (2):261–73. |
[118] | Cheng S , Gandevia SC , Green M , Sinkus R , Bilston LE . Viscoelastic properties of the tongue and soft palate using MR elastography. Journal of Biomechanics. (2011) ;44: (3):450–4. |
[119] | Green MA , Sinkus R , Gandevia SC , Herbert RD , Bilston LE . Measuring changes in muscle stiffness after eccentric exercise using elastography. NMR Biomed. (2012) ;25: (6):852–8. |
[120] | Bensamoun SF , Ringleb SI , Chen Q , Ehman RL , An K-N , Brennan M . Thigh muscle stiffness assessed with magnetic resonance elastography in hyperthyroid patients before and after medical treatment. J Magn Reson Imaging. (2007) ;26: (3):708–13. |
[121] | Basford JR , Jenkyn TR , An K-N , Ehman RL , Heers G , Kaufman KR . Evaluation of healthy and diseased muscle with magnetic resonance elastography. Archives of Physical Medicine and Rehabilitation. (2002) ;83: (11):1530–6. |
[122] | McCullough MB , Domire ZJ , Reed AM , Amin S , Ytterberg SR , Chen Q , An K-N . Evaluation of muscles affected by myositis using magnetic resonance elastography. Muscle Nerve. (2011) ;43: (4):585–90. |
[123] | Nelissen JL , de Graaf L , Schreurs TJL , Moerman KM , Nederveen AJ , Sinkus R , Oomens CWJ , Nicolay K , Strijkers GJ . A MRI-Compatible combined mechanical loading and MR Elastography setup to study deformation-induced skeletal muscle damage in rats. PLoS ONE. (2017) ;12: (1):e0169864. |
[124] | Brauck K , Galban CJ , Maderwald S , Herrmann BL , Ladd ME . Changes in calf muscle elasticity in hypogonadal males before and after testosterone substitution as monitored by magnetic resonance elastography. European Journal of Endocrinology. (2007) ;156: (6):673–8. |
[125] | Eby SF , Cloud BA , Brandenburg JE , Giambini H , Song P , Chen S , LeBrasseur NK , An K-N . Shear wave elastography of passive skeletal muscle stiffness: Influences of sex and age throughout adulthood. Clin Biomech (Bristol, Avon). (2015) ;30: (1):22–7. |
[126] | Muraki T , Domire ZJ , McCullough MB , Chen Q , An K-N . Measurement of stiffness changes in immobilized muscle using magnetic resonance elastography. Clin Biomech (Bristol, Avon). (2010) ;25: (5):499–503. |
[127] | Qin EC , Jugé L , Lambert SA , Paradis V , Sinkus R , Bilston LE . In vivo anisotropic mechanical properties of dystrophic skeletal muscles measured by anisotropic MR elastographic imaging: The Mdx mouse model of muscular dystrophy. Radiology. (2014) ;273: (3):726–35. |
[128] | Chance B , Eleff S , Leigh JS . Noninvasive, nondestructive approaches to cell bioenergetics. Proc Natl Acad Sci USA. (1980) ;77: (12):7430–4. |
[129] | Newman RJ , Bore PJ , Chan L , Gadian DG , Styles P , Taylor D , Radda GK . Nuclear magnetic-resonance studies of forearm muscle in duchenne dystrophy. British Medical Journal. (1982) ;284: (6322):1072–4. |
[130] | Heerschap A , Houtman C , in ‘t Zandt HJ , van den Bergh AJ , Wieringa B . Introduction to in vivo 31P magnetic resonance spectroscopy of (human) skeletal muscle. Proc Nutr Soc. (1999) ;58: (4):861–70. |
[131] | Valkovič L , Chmelík M , Krššák M . In-vivo31P-MRS of skeletal muscle and liver: A Way for non-invasive assessment of their metabolism. Anal Biochem. (2017) ;529: :193–215. |
[132] | Moon RB , Richards JH . Determination of intracellular pH by 31P magnetic resonance. J Biol Chem. (1973) ;248: (20):7276–8. |
[133] | McGilvery RW , Murray TW . Calculated equilibria of phosphocreatine and adenosine phosphates during utilization of high energy phosphate by muscle. J Biol Chem. (1974) ;249: (18):5845–50. |
[134] | Alger JR , Shulman RG . NMR studies of enzymatic rates in vitro and in vivo by magnetization transfer. Q Rev Biophys. (1984) ;17: (1):83–124. |
[135] | Brindle KM , Campbell ID . NMR studies of kinetics in cells and tissues. Q Rev Biophys. (1987) ;19: (3-4):159–82. |
[136] | Kemp GJ , Ahmad RE , Nicolay K , Prompers J . Quantification of skeletal muscle mitochondrial function by 31P magnetic resonance spectroscopy techniques: A Quantitative review. Acta Physiol. (2014) ;213: (1):107–44. |
[137] | Nabuurs C , Huijbregts B , Wieringa B , Hilbers CW , Heerschap A . 31P Saturation transfer spectroscopy predicts differential intracellular macromolecular association of ATP and ADP in skeletal muscle. J Biol Chem. (2010) ;285: (51):39588–96. |
[138] | Fischmann A , Hafner P , Fasler S , Gloor M , Bieri O , Studler U , Fischer D . Quantitative MRI can detect subclinical disease progression in muscular dystrophy. J Neurol. (2012) ;259: (8):1648–54. |
[139] | Buchli R , Meier D , Martin E , Boesiger P . Assessment of absolute metabolite concentrations in human tissue by 31P MRS in vivo. Part II: Muscle, liver, kidney. Magn Reson Med. (1994) ;32: (4):453–8. |
[140] | Meyerspeer M , Scheenen T , Schmid AI , Mandl T , Unger E , Moser E . Semi-LASER localized dynamic 31P magnetic resonance spectroscopy in exercising muscle at ultra-high magnetic field. Magn Reson Med. (2011) ;65: (5):1207–15. |
[141] | Forbes SC , Slade JM , Francis RM , Meyer RA . Comparison of oxidative capacity among leg muscles in humans using gated 31P 2-D chemical shift imaging. NMR Biomed. (2009) ;22: (10):1063–71. |
[142] | Parasoglou P , Xia D , Chang G , Regatte RR . Dynamic three-dimensional imaging of phosphocreatine recovery kinetics in the human lower leg muscles at 3T and 7T: A Preliminary study. NMR Biomed. (2013) ;26: (3):348–56. |
[143] | Steinseifer IK , Wijnen JP , Hamans BC , Heerschap A , Scheenen TWJ . Metabolic imaging of multiple x-nucleus resonances. Magn Reson Med. (2013) ;70: (1):169–75. |
[144] | Boss A , Heskamp L , Breukels V , Bains LJ , van Uden MJ , Heerschap A . Oxidative capacity varies along the length of healthy human tibialis anterior. J Physiol (Lond). (2018) ;596: (8):1467–83. |
[145] | Hooijmans MT , Niks EH , Burakiewicz J , Anastasopoulos C , van den Berg SI , van Zwet E , Webb AG , Verschuuren JJGM , Kan HE . Non-uniform muscle fat replacement along the proximodistal axis in Duchenne muscular dystrophy. Neuromuscular Disorders. (2017) ;27: (5):458–64. |
[146] | Janssen BH , Voet NBM , Nabuurs CI , Kan HE , de Rooy JWJ , Geurts AC , Padberg GW , van Engelen BGM , Heerschap A . Distinct disease phases in muscles of facioscapulohumeral dystrophy patients identified by MR detected fat infiltration. PLoS ONE. (2014) ;9: (1):e85416. |
[147] | Kan HE , Scheenen TWJ , Wohlgemuth M , Klomp DWJ , van Loosbroek-Wagenmans I , Padberg GW , Heerschap A . Quantitative MR imaging of individual muscle involvement in facioscapulohumeral muscular dystrophy. Neuromuscul Disord. (2009) ;19: (5):357–62. |
[148] | Argov Z , Löfberg M , Arnold DL . Insights into muscle diseases gained by phosphorus magnetic resonance spectroscopy. Muscle Nerve. (2000) ;23: (9):1316–34. |
[149] | Kemp GJ , Taylor DJ , Dunn JF , Frostick SP , Radda GK . Cellular energetics of dystrophic muscle. Journal of the Neurological Sciences. (1993) ;116: (2):201–6. |
[150] | Tarnopolsky MA , Parise G . Direct measurement of high-energy phosphate compounds in patients with neuromuscular disease. Muscle Nerve. (1999) ;22: (9):1228–33. |
[151] | Heerschap A , Hollander den JA , Reynen H , Goris RJ . Metabolic changes in reflex sympathetic dystrophy: A 31P NMR spectroscopy study. Muscle Nerve. (1993) ;16: (4):367–73. |
[152] | Wary C , Azzabou N , Giraudeau C , Le Louër J , Montus M , Voit T , Servais L , Carlier P . Quantitative NMRI and NMRS identify augmented disease progression after loss of ambulation in forearms of boys with Duchenne muscular dystrophy. NMR Biomed. (2015) ;28: (9):1150–62. |
[153] | Kan HE , Klomp DWJ , Wong CS , Boer VO , Webb AG , Luijten PR , Jeneson JA . In vivo 31P MRS detection of an alkaline inorganic phosphate pool with short T1 in human resting skeletal muscle. NMR Biomed. (2010) ;23: (8):995–1000. |
[154] | Kan HE , Klomp DWJ , Wohlgemuth M , van Loosbroek-Wagemans I , van Engelen BGM , Padberg GW , Heerschap A . Only fat infiltrated muscles in resting lower leg of FSHD patients show disturbed energy metabolism. NMR Biomed. (2010) ;23: (6):563–8. |
[155] | Wokke BH , Hooijmans MT , van den Bergen JC , Webb AG , Verschuuren JJ , Kan HE . Muscle MRS detects elevated PDE/ATP ratios prior to fatty infiltration in Becker muscular dystrophy. NMR Biomed. (2014) ;27: (11):1371–7. |
[156] | Hooijmans MT , Niks EH , Burakiewicz J , Verschuuren JJGM , Webb AG , Kan HE . Elevated phosphodiester and T2 levels can be measured in the absence of fat infiltration in Duchenne muscular dystrophy patients. NMR Biomed. (2017) ;30: (1). |
[157] | Hooijmans MT , Doorenweerd N , Baligand C , Verschuuren JJGM , Ronen I , Niks EH , Webb AG , Kan HE . Spatially localized phosphorous metabolism of skeletal muscle in Duchenne muscular dystrophy patients: 24-month follow-up. PLoS ONE. (2017) ;12: (8):e0182086. |
[158] | Kemp GJ , Taylor DJ , Styles P , Radda GK . The Production, buffering and efflux of protons in human skeletal muscle during exercise and recovery. NMR Biomed. (1993) ;6: (1):73–83. |
[159] | Steele HE , Horvath R , Lyon JJ , Chinnery PF . Monitoring clinical progression with mitochondrial disease biomarkers. Brain. (2017) ;140: (10):2530–40. |
[160] | Cea G , Bendahan D , Manners D , Hilton-Jones D , Lodi R , Styles P , Taylor DJ . Reduced oxidative phosphorylation and proton efflux suggest reduced capillary blood supply in skeletal muscle of patients with dermatomyositis and polymyositis: A quantitative 31P-magnetic resonance spectroscopy and MRI study. Brain. (2002) ;125: (Pt 7):1635–45. |
[161] | Wary C , Nadaj-Pakleza A , Laforet P , Claeys KG , Carlier R , Monnet A , Fleury S , Baligand C , Eymard B , Labrune P , Carlier PG . Investigating glycogenosis type III patients with multi-parametric functional NMR imaging and spectroscopy. Neuromuscul Disord. (2010) ;20: (8):548–58. |
[162] | Kemp GJ , Tonon C , Malucelli E , Testa C , Liava A , Manners D , Trevisi E , Martinuzzi A , Barbiroli B , Lodi R . Cytosolic pH buffering during exercise and recovery in skeletal muscle of patients with McArdle’s disease. Eur J Appl Physiol. Springer-Verlag. (2009) ;105: (5):687–94. |
[163] | van Brussel M , van Oorschot JWM , Schmitz JPJ , Nicolay K , van Royen-Kerkhof A , Takken T , Jeneson JAL . Muscle metabolic responses during dynamic in-magnet exercise testing: A Pilot study in children with an idiopathic inflammatory myopathy. Academic radiology. (2015) ;22: (11):1443–8. |
[164] | Lim EL , Hollingsworth KG , Smith FE , Thelwall PE , Taylor R . Effects of raising muscle glycogen synthesis rate on skeletal muscle ATP turnover rate in type 2 diabetes. Am J Physiol Endocrinol Metab. American Physiological Society Bethesda, MD. (2011) ;301: (6):E1155–62. |
[165] | de Graaf RA . In Vivo NMR Spectroscopy. John Wiley & Sons, (2013) . pp. 1. |
[166] | Wary C , Laforet P , Eymard B , Fardeau M , Leroy-Willig A , Bassez G , Leroy JP , Caillaud C , Poenaru L , Carlier PG . Evaluation of muscle glycogen content by 13C NMR spectroscopy in adult-onset acid maltase deficiency. Neuromuscular Disorders. (2003) ;13: (7-8):545–53. |
[167] | Janssen BH , Lassche S , Hopman MT , Wevers RA , van Engelen BGM , Heerschap A . Monitoring creatine and phosphocreatine by 13C MR spectroscopic imaging during and after 13C4 creatine loading: A Feasibility study. Amino Acids. 3rd ed. (2016) ;48: (8):1857–66. |
[168] | Golman K , Ardenkjaer-Larsen JH , Petersson JS , Månsson S , Leunbach I . Molecular imaging with endogenous substances. Proc Natl Acad Sci USA. (2003) ;100: (18):10435–9. |
[169] | Konstandin S , Nagel AM . Measurement techniques for magnetic resonance imaging of fast relaxing nuclei. Magn Reson Mater Phy. (2013) ;27: (1):5–19. |
[170] | Wiggins GC , Brown R , Lakshmanan K . High-performance radiofrequency coils for 23Na MRI: Brain and musculoskeletal applications. NMR Biomed. (2015) ;29: (2):96–106. |
[171] | Madelin G , Regatte RR . Biomedical applications of sodium MRI in vivo. J Magn Reson Imaging. (2013) ;38: (3):511–29. |
[172] | Nagel AM , Amarteifio E , Lehmann-Horn F , Jurkat-Rott K , Semmler W , Schad LR , Weber M-A . 3 Tesla sodium inversion recovery magnetic resonance imaging allows for improved visualization of intracellular sodium content changes in muscular channelopathies. Investigative Radiology. (2011) ;46: (12):759–66. |
[173] | Madelin G , Kline R , Walvick R , Regatte RR . A method for estimating intracellular sodium concentration and extracellular volume fraction in brain in vivo using sodium magnetic resonance imaging. Sci Rep. (2014) ;4: :1–7. |
[174] | Constantinides CD , Gillen JS , Boada FE , Pomper MG , Bottomley PA . Human skeletal muscle: Sodium MR imaging and quantification—potential applications in exercise and disease. Radiology. (2000) ;216: (2):559–68. |
[175] | Weber M-A , Nagel AM , Wolf MB , Jurkat-Rott K , Kauczor H-U , Semmler W , Lehmann-Horn F . Permanent muscular sodium overload and persistent muscle edema in Duchenne muscular dystrophy: A Possible contributor of progressive muscle degeneration. Journal of Neurology. (2012) ;259: (11):2385–92. |
[176] | Dunn JF , Bannister N , Kemp GJ , Publicover SJ . Sodium is elevated in mdx muscles: Ionic interactions in dystrophic cells. Journal of the Neurological Sciences. (1993) ;114: (1):76–80. |
[177] | Hirn C , Shapovalov G , Petermann O , Roulet E , Ruegg UT . Na v1.4 Deregulation in dystrophic skeletal muscle leads to Na+Overload and enhanced cell death. J Gen Physiol. (2008) ;132: (2):199–208. |
[178] | Glemser PA , Jaeger H , Nagel AM , Ziegler AE , Simons D , Schlemmer H-P , Lehmann-Horn F , Jurkat-Rott K , Weber M-A . 23Na MRI and myometry to compare eplerenone vs. glucocorticoid treatment in Duchenne dystrophy. Acta Myol. (2017) ;36: (1):2–13. |
[179] | Marden FA , Connolly AM , Siegel MJ , Rubin DA . Compositional analysis of muscle in boys with Duchenne muscular dystrophy using MR imaging. Skeletal Radiol. Springer-Verlag. (2005) ;34: (3):140–8. |
[180] | Saito K , Kobayashi D , Komatsu M , Yajima T , Yagihashi A , Ishikawa Y , Minami R , Watanabe N . A Sensitive assay of tumor necrosis factor alpha in sera from Duchenne muscular dystrophy patients. Clin Chem. (2000) ;46: (10):1703–4. |
[181] | Messina S , Vita GL , Aguennouz M , Sframeli M , Romeo S , Rodolico C , Vita G . Activation of NF-kappaB pathway in Duchenne muscular dystrophy: Relation to age. Acta Myol. Pacini Editore. (2011) ;30: (1):16–23. |
[182] | Frisullo G , Frusciante R , Nociti V , Tasca G , Renna R , Iorio R , Patanella AK , Iannaccone E , Marti A , Rossi M , Bianco A , Monforte M , Tonali PA , Mirabella M , Batocchi AP , Ricci E . CD8(+) T cells in facioscapulohumeral muscular dystrophy patients with inflammatory features at muscle MRI. J Clin Immunol. Springer US. (2011) ;31: (2):155–66. |
[183] | Guiraud S , Davies KE . Pharmacological advances for treatment in Duchenne muscular dystrophy. Curr Opin Pharmacol. (2017) ;34: :36–48. |
[184] | Feng S , Chen D , Kushmerick M , Lee D . Multiparameter MRI analysis of the time course of induced muscle damage and regeneration. J Magn Reson Imaging. (2013) ;40: (4):779–88. |
[185] | Mattila KT , Lukka R , Hurme T , Komu M , Alanen A , Kalimo H . Magnetic resonance imaging and magnetization transfer in experimental myonecrosis in the rat. Magn Reson Med. (1995) ;33: (2):185–92. |
[186] | Fan R , Fan RH , Does M , Does MD . Compartmental relaxation and diffusion tensor imaging measurements in vivo in lambda-carrageenan-induced edema in rat skeletal muscle. NMR Biomed. (2008) ;21: (6):566–73. |
[187] | Ababneh ZQ , Beloeil H , Berde CB , Gambarota G , Maier SE , Mulkern RV . Biexponential parameterization of diffusion and T2 relaxation decay curves in a rat muscle edema model: Decay curve components and water compartments. Magn Reson Med. (2005) ;54: (3):524–31. |
[188] | Ruiz-Cabello J , Regadera J , Santisteban C , Graña M , Pérez de Alejo R , Echave I , Avilés P , Rodriguez I , Santos I , Gargallo D , Cortijo M . Monitoring acute inflammatory processes in mouse muscle by MR imaging and spectroscopy: A Comparison with pathological results. NMR Biomed. (2002) ;15: (3):204–14. |
[189] | Barfield WL , Uaesoontrachoon K , Wu C-S , Lin S , Chen Y , Wang PC , Kanaan Y , Bond V , Hoffman EP . Eccentric muscle challenge shows osteopontin polymorphism modulation of muscle damage. Hum Mol Genet. (2014) ;23: (15):4043–50. |
[190] | Marqueste T , Giannesini B , Fur YL , Cozzone PJ , Bendahan D . Comparative MRI analysis of T2 changes associated with single and repeated bouts of downhill running leading to eccentric-induced muscle damage. Journal of Applied Physiology. American Physiological Society. (2008) ;105: (1):299–307. |
[191] | Foley JM , Jayaraman RC , Prior BM , Pivarnik JM , Meyer RA . MR measurements of muscle damage and adaptation after eccentric exercise. Journal of Applied Physiology. (1999) ;87: (6):2311–8. |
[192] | Chrzanowski SM , Vohra RS , Lee-McMullen BA , Batra A , Spradlin RA , Morales J , Forbes S , Vandenborne K , Barton ER , Walter GA . Contrast-enhanced near-infrared optical imaging detects exacerbation and amelioration of murine muscular dystrophy. Mol Imaging. SAGE PublicationsSage CA: Los Angeles, CA. (2017) ;16: (5):1536012117732439. |
[193] | Mathur S , Vohra RS , Germain SA , Forbes S , Bryant ND , Vandenborne K , Walter GA . Changes in muscle T2 and tissue damage after downhill running in mdx mice. Muscle Nerve. (2011) ;43: (6):878–86. |
[194] | Kobayashi YM , Rader EP , Crawford RW , Campbell KP . Endpoint measures in the mdx mouse relevant for muscular dystrophy pre-clinical studies. Neuromuscul Disord. (2012) ;22: (1):34–42. |
[195] | Kobayashi YM , Rader EP , Crawford RW , Iyengar NK , Thedens DR , Faulkner JA , Parikh SV , Weiss RM , Chamberlain JS , Moore SA , Campbell KP . Sarcolemma-localized nNOS is required to maintain activity after mild exercise. Nature. Nature Publishing Group. (2008) ;456: (7221):511–5. |
[196] | Angelini C , Pegoraro E , Turella E , Intino MT , Pini A , Costa C . Deflazacort in Duchenne dystrophy: Study of long-term effect. Muscle Nerve. (1994) ;17: (4):386–91. |
[197] | Schram G , Fournier A , Leduc H , Dahdah N , Therien J , Vanasse M , Khairy P . All-cause mortality and cardiovascular outcomes with prophylactic steroid therapy in Duchenne muscular dystrophy. J Am Coll Cardiol. (2013) ;61: (9):948–54. |
[198] | Pradhan S , Ghosh D , Srivastava NK , Kumar A , Mittal B , Pandey CM , Singh U . Prednisolone in Duchenne muscular dystrophy with imminent loss of ambulation. Journal of Neurology. Steinkopff-Verlag. (2006) ;253: (10):1309–16. |
[199] | Arpan I , Willcocks RJ , Forbes SC , Finkel RS , Lott DJ , Rooney WD , Triplett WT , Senesac CR , Daniels MJ , Byrne BJ , Finanger EL , Russman BS , Wang D-J , Tennekoon GI , Walter GA , Sweeney HL , Vandenborne K . Examination of effects of corticosteroids on skeletal muscles of boys with DMD using MRI and MRS. Neurology. (2014) ;83: (11):974–80. |
[200] | Kornegay JN , Peterson JM , Bogan DJ , Kline W , Bogan JR , Dow JL , Fan Z , Wang J , Ahn M , Zhu H , Styner M , Guttridge DC . NBD delivery improves the disease phenotype of the golden retriever model of Duchenne muscular dystrophy. Skelet Muscle. BioMed Central. (2014) ;4: (1):18. |
[201] | Weber M-A , Nagel AM , Jurkat-Rott K , Lehmann-Horn F . Sodium (23Na) MRI detects elevated muscular sodium concentration in Duchenne muscular dystrophy. Neurology. (2011) ;77: (23):2017–24. |
[202] | Barnard AM , Willcocks RJ , Finanger EL , Daniels MJ , Triplett WT , Rooney WD , Lott DJ , Forbes SC , Wang D-J , Senesac CR , Harrington AT , Finkel RS , Russman BS , Byrne BJ , Tennekoon GI , Walter GA , Sweeney HL , Vandenborne K . Skeletal muscle magnetic resonance biomarkers correlate with function and sentinel events in Duchenne muscular dystrophy. PLoS ONE. (2018) ;13: (3):e0194283. |
[203] | Wokke BH , van den Bergen JC , Versluis MJ , Niks EH , Milles J , Webb AG , van Zwet EW , Aartsma-Rus A , Verschuuren JJ , Kan HE . Quantitative MRI and strength measurements in the assessment of muscle quality in Duchenne muscular dystrophy. Neuromuscular Disorders. (2014) ;24: (5):409–16. |
[204] | Akima H , Lott D , Senesac C , Deol J , Germain S , Arpan I , Bendixen R , Lee Sweeney H , Walter G , Vandenborne K . Relationships of thigh muscle contractile and non-contractile tissue with function, strength, and age in boys with Duchenne muscular dystrophy. Neuromuscul Disord. (2012) ;22: (1):16–25. |
[205] | Løkken N , Hedermann G , Thomsen C , Vissing J . Contractile properties are disrupted in Becker muscular dystrophy, but not in limb girdle type 2I. Ann Neurol. (2016) ;80: (3):466–71. |
[206] | Marra MA , Heskamp L , Mul K , Lassche S , van Engelen BGM , Heerschap A , Verdonschot N . Specific muscle strength is reduced in facioscapulohumeral dystrophy: An MRI based musculoskeletal analysis. Neuromuscul Disord. (2018) ;28: (3):238–45. |
[207] | Triplett WT , Baligand C , Forbes SC , Willcocks RJ , Lott DJ , DeVos S , Pollaro J , Rooney WD , Sweeney HL , Bönnemann CG , Wang D-J , Vandenborne K , Walter GA . Chemical shift-based MRI to measure fat fractions in dystrophic skeletal muscle. Magn Reson Med. (2014) ;72: (1):8–19. |
[208] | Agten CA , Rosskopf AB , Gerber C , Pfirrmann CWA . Quantification of early fatty infiltration of the rotator cuff muscles: Comparison of multi-echo Dixon with single-voxel MR spectroscopy. Eur Radiol. (2015) ;26: (10):3719–27. |
[209] | Smith AC , Parrish TB , Abbott R , Hoggarth MA , Mendoza K , Chen YF , Elliott JM . Muscle-fat MRI: 1.5 tesla and 3.0 tesla versus histology. Muscle Nerve. (2014) ;50: (2):170–6. |
[210] | Horiuchi S , Nozaki T , Tasaki A , Yamakawa A , Kaneko Y , Hara T , Yoshioka H . Reliability of MR Quantification of rotator cuff muscle fatty degeneration using a 2-point Dixon technique in comparison with the goutallier classification. Academic Radiology. (2017) ;24: (11):1343–51. |
[211] | Forbes SC , Walter GA , Rooney WD , Wang D-J , DeVos S , Pollaro J , Triplett W , Lott DJ , Willcocks RJ , Senesac C , Daniels MJ , Byrne BJ , Russman B , Finkel RS , Meyer JS , Sweeney HL , Vandenborne K . Skeletal muscles of ambulant children with Duchenne muscular dystrophy: Validation of multicenter study of evaluation with MR imaging and MR spectroscopy. Radiology. (2013) ;269: (1):198–207. |
[212] | Ricotti V , Evans MRB , Sinclair CDJ , Butler JW , Ridout DA , Hogrel J-Y , Emira A , Morrow JM , Reilly MM , Hanna MG , Janiczek RL , Matthews PM , Yousry TA , Muntoni F , Thornton JS . Upper limb evaluation in Duchenne muscular dystrophy: Fat-water quantification by MRI, Muscle force and function define endpoints for clinical trials. PLoS ONE. (2016) ;11: (9):e0162542. |
[213] | Gaeta M , Messina S , Mileto A , Vita GL , Ascenti G , Vinci S , Bottari A , Vita G , Settineri N , Bruschetta D , Racchiusa S , Minutoli F . Muscle fat-fraction and mapping in Duchenne muscular dystrophy: Evaluation of disease distribution and correlation with clinical assessments. Skeletal Radiol. 2nd ed. (2011) ;41: (8):955–61. |
[214] | Diao K-Y , Yang Z-G , Xu H-Y , Liu X , Zhang Q , Shi K , Jiang L , Xie L-J , Wen L-Y , Guo Y-K . Histologic validation of myocardial fibrosis measured by T1 mapping: A Systematic review and meta-analysis. J Cardiovasc Magn Reson. Journal of Cardiovascular Magnetic Resonance. (2016) ;18: (1):1–11. |
[215] | Witschey WR , Zsido GA , Koomalsingh K , Kondo N , Minakawa M , Shuto T , McGarvey JR , Levack MA , Contijoch F , Pilla JJ , Gorman JH , Gorman RC . In vivo chronic myocardial infarction characterization by spin locked cardiovascular magnetic resonance. J Cardiovasc Magn Reson. (2012) ;14: (1):37. |
[216] | Aguor ENE , Arslan F , van de Kolk CWA , Nederhoff MGJ , Doevendans PA , van Echteld C , Pasterkamp G , Strijkers GJ . Quantitative T2* assessment of acute and chronic myocardial ischemia/reperfusion injury in mice. Magn Reson Mater Phy. (2012) ;25: (5):369–79. |
[217] | Xu L , Hayashi D , Roemer FW , Felson DT , Guermazi A . Magnetic resonance imaging of subchondral bone marrow lesions in association with osteoarthritis. Seminars in Arthritis and Rheumatism. (2012) ;42: (2):105–18. |
[218] | Csapo R , Malis V , Sinha U , Du J , Sinha S . Age-associated differences in triceps surae muscle composition and strength—an MRI-based cross-sectional comparison of contractile, adipose and connective tissue. BMC Musculoskelet Disord. (2014) ;15: :209. |
[219] | Briguet A , Courdier-Fruh I , Foster M , Meier T , Magyar JP . Histological parameters for the quantitative assessment of muscular dystrophy in the mdx-mouse. Neuromuscular Disorders. (2004) ;14: (10):675–82. |
[220] | Porcari P , Hall MG , Clark CA , Greally E , Straub V , Blamire AM . The Effects of ageing on mouse muscle microstructure: A Comparative study of time-dependent diffusion MRI and histological assessment. NMR Biomed. (2018) ;31: (3):e3881–13. |
[221] | Amthor H , Egelhof T , McKinnell I , Ladd ME , Janssen I , Weber J , Sinn H , Schrenk H-H , Forsting M , Voit T , Straub V . Albumin targeting of damaged muscle fibres in the mdx mouse can be monitored by MRI. Neuromuscular Disorders. (2004) ;14: (12):791–6. |
[222] | Straub V , Rafael JA , Chamberlain JS , Campbell KP . Animal models for muscular dystrophy show different patterns of sarcolemmal disruption. J Cell Biol. (1997) ;139: (2):375–85. |
[223] | Tanner JE . Self diffusion of water in frog muscle. Biophys J. (1979) ;28: (1):107–16. |
[224] | Sigmund EE , Novikov DS , Sui D , Ukpebor O , Baete S , Babb JS , Liu K , Feiweier T , Kwon J , McGorty K , Bencardino J , Fieremans E . Time-dependent diffusion in skeletal muscle with the random permeable barrier model (RPBM): Application to normal controls and chronic exertional compartment syndrome patients. NMR Biomed. (2014) ;27: (5):519–28. |
[225] | Karampinos DC , King KF , Sutton BP , Georgiadis JG . In vivo study of cross-sectional skeletal muscle fiber asymmetry with diffusion-weighted MRI. Conf Proc IEEE Eng Med Biol Soc. IEEE. (2007) ;2007: :327–30. |
[226] | Kim S , Chi-Fishman G , Barnett AS , Pierpaoli C . Dependence on diffusion time of apparent diffusion tensor of ex vivo calf tongue and heart. Magn Reson Med. (2005) ;54: (6):1387–96. |
[227] | Winters KV , Reynaud O , Novikov DS , Fieremans E , Kim SG . Quantifying myofiber integrity using diffusion MRI and random permeable barrier modeling in skeletal muscle growth and Duchenne muscular dystrophy model in mice. Magn Reson Med. (2018) ;4: :774. |
[228] | Yablonskiy DA , Sukstanskii AL . Theoretical models of the diffusion weighted MR signal. NMR Biomed. (2010) ;23: (7):661–81. |
[229] | Hall MG , Clark CA . Diffusion in hierarchical systems: A Simulation study in models of healthy and diseased muscle tissue. Magn Reson Med. (2016) :1–12. |
[230] | Barnouin Y , Butler-Browne G , Voit T , Reversat D , Azzabou N , Leroux G , Behin A , McPhee JS , Carlier PG , Hogrel J-Y . Manual segmentation of individual muscles of the quadriceps femoris using MRI: A Reappraisal. J Magn Reson Imaging. (2013) ;40: (1):239–47. |
[231] | Ogier A , Sdika M , Fouré A , Le Troter A , Bendahan D . Individual muscle segmentation in MR images: A 3D propagation through 2D non-linear registration approaches. IEEE. (2017) :317–20. |
[232] | Baudin P-Y , Goodman D , Kumrnar P , Azzabou N , Carlier PG , Paragios N , Kumar MP . Discriminative parameter estimation for random walks segmentation. Medical image computing and computer-assisted intervention: MICCAI International Conference on Medical Image Computing and Computer-Assisted Intervention. (2013) ;16: (Pt 3):219–26. |
[233] | Baudin PY , Azzabou N , Carlier PG , Paragios N . Prior knowledge, random walks and human skeletal muscle segmentation. Medical image computing and computer-assisted intervention: MICCAI International Conference on Medical Image Computing and Computer-Assisted Intervention. (2012) ;15: (Pt 1):569–76. |
[234] | Gilles B , Magnenat-Thalmann N . Musculoskeletal MRI segmentation using multi-resolution simplex meshes with medial representations. Med Image Anal. (2010) ;14: (3):291–302. |
[235] | Prescott JW , Best TM , Swanson MS , Haq F , Jackson RD , Gurcan MN . Anatomically anchored template-based level set segmentation: Application to quadriceps muscles in MR images from the osteoarthritis initiative. J Digit Imaging. (2010) ;24: (1):28–43. |
[236] | Ahmad E , Yap MH , Degens H , McPhee JS . Atlas-registration based image segmentation of MRI human thigh muscles in 3D space. MI. SPIE. (2014) ;9037: :12. |
[237] | Karlsson A , Rosander J , Romu T , Tallberg J , Grönqvist A , Borga M , Dahlqvist Leinhard O . Automatic and quantitative assessment of regional muscle volume by multi-atlas segmentation using whole-body water-fat MRI. J Magn Reson Imaging. (2014) ;41: (6):1558–69. |
[238] | Le Troter A , Fouré A , Guye M , Confort-Gouny S , Mattei J-P , Gondin J , Salort-Campana E , Bendahan D . Volume measurements of individual muscles in human quadriceps femoris using atlas-based segmentation approaches. Magn Reson Mater Phy. (2016) ;29: (2):245–57. |
[239] | Hollingsworth KG , Higgins DM , McCallum M , Ward L , Coombs A , Straub V . Investigating the quantitative fidelity of prospectively undersampled chemical shift imaging in muscular dystrophy with compressed sensing and parallel imaging reconstruction. Magn Reson Med. (2013) ;72: (6):1610–9. |
[240] | Hollingsworth KG . Reducing acquisition time in clinical MRI by data undersampling and compressed sensing reconstruction. Phys Med Biol. (2015) ;60: (21):R297–R322. |
[241] | Motaal AG , Coolen BF , Abdurrachim D , Castro RM , Prompers J , Florack LMJ , Nicolay K , Strijkers GJ . Accelerated high-frame-rate mouse heart cine-MRI using compressed sensing reconstruction. NMR Biomed. (2013) ;26: (4):451–7. |
[242] | Motaal AG , Noorman N , de Graaf WL , Hoerr V , Florack LMJ , Nicolay K , Strijkers GJ . Functional imaging of murine hearts using accelerated self-gated UTE cine MRI. Int J Cardiovasc Imaging. (2015) ;31: (1):83–94. |
[243] | Florian A , Ludwig A , Rosch S , Yildiz H , Sechtem U , Yilmaz A . Myocardial fibrosis imaging based on T1-mapping and extracellular volume fraction (ECV) measurement in muscular dystrophy patients: Diagnostic value compared with conventional late gadolinium enhancement (LGE) imaging. European Heart Journal—Cardiovascular Imaging. (2014) ;15: (9):1004–12. |
[244] | Marty B , Coppa B , Carlier PG . Fast, precise, and accurate myocardial T 1mapping using a radial MOLLI sequence with FLASH readout. Magn Reson Med. (2017) ;79: (3):1387–98. |
[245] | Marty B , Coppa B , Carlier PG . Monitoring skeletal muscle chronic fatty degenerations with fast T1-mapping. Eur Radiol. Springer Berlin Heidelberg. (2018) ;22: (Suppl 2):S54–7. |
[246] | Sinha S , Hodgson JA , Finni T , Lai AM , Grinstead J , Edgerton RV . Muscle kinematics during isometric contraction: Development of phase contrast and spin tag techniques to study healthy and atrophied muscles. J Magn Reson Imaging. (2004) ;20: (6):1008–19. |
[247] | Niitsu M , Campeau NG , Holsinger-Bampton AE , Riederer SJ , Ehman RL . Tracking motion with tagged rapid gradient-echo magnetization-prepared MR imaging. J Magn Reson Imaging. (1992) ;2: (2):155–63. |
[248] | Ceelen KK , Stekelenburg A , Mulders JLJ , Strijkers GJ , Baaijens FPT , Nicolay K , Oomens CWJ . Validation of a numerical model of skeletal muscle compression with MR tagging: A Contribution to pressure ulcer research. J Biomech Eng. (2008) ;130: (6):061015. |
[249] | Moerman KM , Sprengers AMJ , Simms CK , Lamerichs RM , Stoker J , Nederveen AJ . Validation of SPAMM tagged MRI based measurement of 3D soft tissue deformation. Med Phys. (2011) ;38: (3):1248–60. |
[250] | Moerman KM , Sprengers AMJ , Simms CK , Lamerichs RM , Stoker J , Nederveen AJ . Validation of continuously tagged MRI for the measurement of dynamic 3D skeletal muscle tissue deformation. Med Phys. (2012) ;39: (4):1793–810. |
[251] | Wentland AL , McWalter EJ , Pal S , Delp SL , Gold GE . Muscle velocity and inertial force from phase contrast MRI. J Magn Reson Imaging. (2014) ;42: (2):526–32. |
[252] | Shin DD , Hodgson JA , Edgerton RV , Sinha S . In vivo intramuscular fascicle-aponeuroses dynamics of the human medial gastrocnemius during plantarflexion and dorsiflexion of the foot. Journal of Applied Physiology. (2009) ;107: (4):1276–84. |
[253] | Sinha U , Malis V , Csapo R , Moghadasi A , Kinugasa R , Sinha S . Age-related differences in strain rate tensor of the medial gastrocnemius muscle during passive plantarflexion and active isometric contraction using velocity encoded MR imaging: Potential index of lateral force transmission. Magn Reson Med. (2014) ;73: (5):1852–63. |
[254] | Deligianni X , Pansini M , Garcia M , Hirschmann A , Schmidt-Trucksäss A , Bieri O , Santini F . Synchronous MRI of muscle motion induced by electrical stimulation. Magn Reson Med. (2016) ;77: (2):664–72. |
[255] | Zhong X , Epstein FH , Spottiswoode BS , Helm PA , Blemker SS . Imaging two-dimensional displacements and strains in skeletal muscle during joint motion by cine DENSE MR. Journal of Biomechanics. (2008) ;41: (3):532–40. |
[256] | Prompers J , Jeneson JAL , Drost MR , Oomens CCW , Strijkers GJ , Nicolay K . Dynamic MRS and MRI of skeletal muscle function and biomechanics. NMR Biomed. (2006) ;19: (7):927–53. |
[257] | Asakawa DS , Nayak KS , Blemker SS , Delp SL , Pauly JM , Nishimura DG , Gold GE . Real-time imaging of skeletal muscle velocity. J Magn Reson Imaging. (2003) ;18: (6):734–9. |
[258] | Csapo R , Malis V , Sinha U , Sinha S . Mapping of spatial and temporal heterogeneity of plantar flexor muscle activity during isometric contraction: Correlation of velocity-encoded MRI with EMG. Journal of Applied Physiology. (2015) ;119: (5):558–68. |
[259] | Mazzoli V , Gottwald LM , Peper ES , Froeling M , Coolen BF , Verdonschot N , Sprengers AM , van Ooij P , Strijkers GJ , Nederveen AJ . Accelerated 4D phase contrast MRI in skeletal muscle contraction. Magn Reson Med. (2018) ;38: :657–13. |
[260] | Pappas GP , Asakawa DS , Delp SL , Zajac FE , Drace JE . Nonuniform shortening in the biceps brachii during elbow flexion. Journal of Applied Physiology. (2002) ;92: (6):2381–9. |
[261] | Finni T , Hodgson JA , Lai AM , Edgerton RV , Sinha S . Nonuniform strain of human soleus aponeurosis-tendon complex during submaximal voluntary contractions in vivo. Journal of Applied Physiology. (2003) ;95: (2):829–37. |
[262] | Blemker SS , Pinsky PM , Delp SL . A 3D model of muscle reveals the causes of nonuniform strains in the biceps brachii. Journal of Biomechanics. (2005) ;38: (4):657–65. |
[263] | Englund EK , Elder CP , Xu Q , Ding Z , Damon BM . Combined diffusion and strain tensor MRI reveals a heterogeneous, planar pattern of strain development during isometric muscle contraction. American Journal of Physiology-Regulatory, Integrative and Comparative Physiology. (2011) ;300: (5):R1079–90. |
[264] | Malis V , Sinha U , Csapo R , Narici M , Sinha S . Relationship of changes in strain rate indices estimated from velocity-encoded MR imaging to loss of muscle force following disuse atrophy. Magn Reson Med. (2017) ;79: (2):912–22. |
[265] | Gindre J , Takaza M , Moerman KM , Simms CK . A Structural model of passive skeletal muscle shows two reinforcement processes in resisting deformation. J Mech Behav Biomed Mater. (2013) ;22: :84–94. |
[266] | Takaza M , Moerman KM , Gindre J , Lyons G , Simms CK . The Anisotropic mechanical behaviour of passive skeletal muscle tissue subjected to large tensile strain. J Mech Behav Biomed Mater. (2013) ;17: :209–20. |
[267] | Bolsterlee B , D’Souza A , Gandevia SC , Herbert RD . How does passive lengthening change the architecture of the human medial gastrocnemius muscle? Journal of Applied Physiology. (2017) ;122: (4):727–38. |
[268] | Heemskerk AM , Sinha TK , Wilson KJ , Ding Z , Damon BM . Repeatability of DTI-based skeletal muscle fiber tracking. NMR Biomed. (2010) ;23: (3):294–303. |
[269] | Damon BM , Heemskerk AM , Ding Z . Polynomial fitting of DT-MRI fiber tracts allows accurate estimation of muscle architectural parameters. Magn Reson Imaging. (2012) ;30: (5):589–600. |
[270] | Karampinos DC , King KF , Sutton BP , Georgiadis JG . Myofiber ellipticity as an explanation for transverse asymmetry of skeletal muscle diffusion MRI in vivo signal. Annals of Biomedical Engineering. (2009) ;37: (12):2532–46. |
[271] | Vandenberghe S , Marsden PK . PET-MRI: A Review of challenges and solutions in the development of integrated multimodality imaging. Phys Med Biol. (2015) ;60: (4):R115–54. |
[272] | Behera D , Jacobs KE , Behera S , Rosenberg J , Biswal S . (18)F-FDG PET/MRI can be used to identify injured peripheral nerves in a model of neuropathic pain. J Nucl Med. (2011) ;52: (8):1308–12. |
[273] | Lee SH , Seo HG , Oh B-M , Choi H , Cheon GJ , Lee S-U . Increased (18)F-FDG uptake in the trapezius muscle in patients with spinal accessory neuropathy. Journal of the Neurological Sciences. (2016) ;362: :127–30. |
[274] | Priola AM , Priola SM . Imaging of thymus in myasthenia gravis: From thymic hyperplasia to thymic tumor. Clin Radiol. (2014) ;69: (5):e230–45. |
[275] | Haddock B , Holm S , Poulsen JM , Enevoldsen LH , Larsson HBW , Kjær A , Suetta C . Assessment of muscle function using hybrid PET/MRI: Comparison of 18F-FDG PET and T2-weighted MRI for quantifying muscle activation in human subjects. Eur J Nucl Med Mol Imaging. (2017) ;44: (4):704–11. |
[276] | |
[277] | Programme Committee. Imaging in Neuromuscular Disease 2017: First international conference on imaging in neuromuscular disease, 19th-21st November 2017, Berlin, Germany. JND. (2017) ;4: (s1):S1–S63. |


