
Skeletal Muscle Quantitative Nuclear Magnetic Resonance Imaging and Spectroscopy as an Outcome Measure for Clinical Trials
Abstract
Recent years have seen tremendous progress towards therapy of many previously incurable neuromuscular diseases. This new context has acted as a driving force for the development of novel non-invasive outcome measures. These can be organized in three main categories: functional tools, fluid biomarkers and imagery. In the latest category, nuclear magnetic resonance imaging (NMRI) offers a considerable range of possibilities for the characterization of skeletal muscle composition, function and metabolism. Nowadays, three NMR outcome measures are frequently integrated in clinical research protocols. They are: 1/ the muscle cross sectional area or volume, 2/ the percentage of intramuscular fat and 3/ the muscle water T2, which quantity muscle trophicity, chronic fatty degenerative changes and oedema (or more broadly, “disease activity”), respectively. A fourth biomarker, the contractile tissue volume is easily derived from the first two ones. The fat fraction maps most often acquired with Dixon sequences have proven their capability to detect small changes in muscle composition and have repeatedly shown superior sensitivity over standard functional evaluation. This outcome measure will more than likely be the first of the series to be validated as an endpoint by regulatory agencies. The versatility of contrast generated by NMR has opened many additional possibilities for characterization of the skeletal muscle and will result in the proposal of more NMR biomarkers. Ultra-short TE (UTE) sequences, late gadolinium enhancement and NMR elastography are being investigated as candidates to evaluate skeletal muscle interstitial fibrosis. Many options exist to measure muscle perfusion and oxygenation by NMR. Diffusion NMR as well as texture analysis algorithms could generate complementary information on muscle organization at microscopic and mesoscopic scales, respectively. 31P NMR spectroscopy is the reference technique to assess muscle energetics non-invasively during and after exercise. In dystrophic muscle, 31P NMR spectrum at rest is profoundly perturbed, and several resonances inform on cell membrane integrity. Considerable efforts are being directed towards acceleration of image acquisitions using a variety of approaches, from the extraction of fat content and water T2 maps from one single acquisition to partial matrices acquisition schemes. Spectacular decreases in examination time are expected in the near future. They will reinforce the attractiveness of NMR outcome measures and will further facilitate their integration in clinical research trials.
LIST OF ACRONYMS
NMR | nuclear magnetic resonance |
NMRI | nuclear magnetic resonance imaging |
UTE | Ultra-short TE sequences |
CT | computed tomography |
EMA | European Medicines Agency |
FDA | U.S. Food and Drug Administration |
DMD | Duchenne muscular dystrophy |
GRMD | Golden retriever muscular dystrophy |
T1w, T2w, DWI | T1, T2 and diffusion weighted NMR images |
TR, TE | repetition and echo times |
IDEAL | Iterative Decomposition of water and fat with Echo Asymmetry and Least-square estimation NMRI sequence |
CPMG | Carr-Purcell-Meiboom-Gill sequence |
EPG | Extended Phase Graphs |
B1 or B1+, B0 | Radio-frequency transmit and main magnetic fields |
WMS | World Muscle Society |
BMD | Becker muscular dystrophy |
ISIS | Image-selected in vivo spectroscopy |
ASL | arterial spin labeling |
BOLD | blood oxygen level dependent |
COST | European Cooperation in Science and Technology |
SSFP | Steady state free precession |
IR-bSSFP | inversion recovery balanced SSFP |
TESS | triple echo steady state |
THE MOTIVATION FOR USING NMR AS AN OUTCOME MEASURE IN NEURO-MUSCULAR DISORDERS
The medical approach to neuro-muscular diseases has radically changed during the last two decades or so. A majority of these diseases is of genetic origin and were so far impossible to cure. Treatments were essentially supportive and palliative. With no exception, they are rare disorders. This fact contributed to their confinement far aside from the main avenues of research of the pharmaceutical industry. Rare diseases are now receiving full attention, with major structural programs launched and funded bypublic institutions at a multi-national level. And, more important than any other consideration, the progress of gene therapy and pharmacogenetics has or is about to revolutionize the course of many of these diseases [7, 23, 32, 33, 45, 62, 76, 174, 184, 217, 248, 256].
Because of these innovative therapies, new needs have emerged over a relatively short period of time, with the necessity to monitor muscle response to interventions. To this end, novel tools had to be developed. In an ideal world, they should be non-invasive, quantitative, cost effective and generate results that are simple to interpret. They can be grouped in 3 main categories: the functional tools, the biological fluid biomarkers and the imagery. The functional tools occupy the foreground, with a variety of devices and protocols, many optimized for the investigation of specific movements, but also with others aiming at a global evaluation of the patient activity [54, 109, 158, 167– 169, 171, 191, 216, 218– 220]. These ones belong to a rapidly growing new discipline, named actimetry, and offer the exclusive possibility to evaluate the patient in his personal environment over extended periods of time. The biological fluids constitute also a new class of biomarkers, with promising results, in particular since the discovery and now use of μRNAs. Imaging, the third main player, is increasingly being used as an outcome measure. It requires expensive equipment, high-end ultrasound devices making no exception to this. In addition, tomographic methods, computed tomography (CT) and nuclear magnetic resonance (NMR), suffer from absence of portability. Nevertheless, NMR is the only technique that can assess individual muscle anatomy, composition and function in a single examination. These unique properties are more and more largely understood and appreciated at their exact value, as illustrated by the imaging requirements issued by the regulatory authorities, EMA and FDA, for new drug registration.
With this review, the authors tried to offer a comprehensive overview of the data currently published on the use of muscle NMR as an outcome measure, in actuality or as a potential tool for future studies. Instead of listing studies in an objective but impersonal mode, they chose deliberately to insert comments and express opinions with the main goal of guiding and helping readers who might have in mind the introduction of quantitative imaging in their practice. The authors acknowledge the subjective nature of parts of this review.
QUANTITATION IS A PREREQUISITE TO THE USE OF NMR AS A BIOMARKER
To be utilized as a biomarker [233, 250], any surrogate indicator of disease or condition status must be expressed as a quantified measure and demonstrate its capacity to reflect specific pathological events with accuracy and precision. To fulfill these requirements, medical imaging had to go through a long evolution, adding a quantitative dimension to the standard qualitative description of pathology. This was possible thanks to a steady flow of technological innovation, which has resulted in spectacular improvements in hardware stability and versatility, and thanks also to the patient and careful development of dedicated protocols [244]. This process, which has affected all systems and organs, was no exception for muscle imaging. For muscle disorders as for other ailments, the benefits of quantitative imaging are multiple: a better appreciation of disease severity, the possibility to monitor pathological changes over time and, most importantly, to evaluate skeletal muscle responses to therapeutic intervention.
Similarly to what was achieved in most organs, NMR has become a key-player for quantitative imaging of the skeletal muscle [112]. Quantitative variables and indices derived from NMR imaging but also spectroscopy constitute the most serious imaging candidates as biomarkers or outcome measures in clinical trials focusing on musclepathology.
NMR OUTCOME MEASURES CURRENTLY AVAILABLE
NMR imaging and spectroscopy can generate a wealth of information on skeletal muscle anatomy, structure and composition, physiology and biochemistry. While a great many NMR variables are being tested and have their potential role as biomarkers being investigated, only 3 NMR imaging outcome measures are widely accepted, if not fully validated, for skeletal muscle longitudinal monitoring. They are almost systematically included in the setting of new clinical trials. They aim at:
# evaluating muscle trophicity by measurements of the muscle surface and volume,
# assessing the extent of chronic degenerative changes in muscles by the percentage of fat signal infiltrating muscle,
# estimating disease activity with muscle water T2 relaxation time as an index in pathologies known to be progressive.
SKELETAL MUSCLE TROPHICITY
Due to the combination of high spatial resolution, good contrast, 3D capabilities, and efficient correction algorithms for source of distortions, mainly gradient non-linearities, NMR imaging is the reference method for measuring organs volume and dimensions [120, 125, 177, 277]. The statement applies to skeletal muscle at least as much as to other organs. Accuracy is seldom assessed because it requires autopsy specimens but was excellent when it could be performed [178]. Furthermore, reproducibility and discriminant power have systematically been reported as very high [19, 80, 241, 257], at least as good as with ultrasound [68] or computed tomography [231] and with the advantage of superior tissue characterization (see § below). The following examples illustrate NMR capability to identify subtle changes in muscle trophicity. After botulinic toxin injection into a gastrocnemius muscle of children with cerebral palsy, a 4% decrease in mass was measured, compensated by an increase of 4% of the soleus [268]. Forearm muscles volume determination was repeated with coefficient of variation comprised between 0.8 and 5.7% for the different muscles [227]. The effect of detraining after weeks of flow-restricted concentric and eccentric exercise protocols were evaluated, revealing different responses to detraining depending on the training protocol [282].
In most instances, muscle trophicity rather than volume is the variable of interest. When volumes are determined, normalization to muscle length, and more often to adjacent bone length is performed in order to obtain trophicity indices.
In diseased muscle, true muscle mass and not total muscle volume is a preferred trophicity index. For this reason, the contractile mass index is calculated as the muscle volume (or cross-sectional area)×(1– fat fraction), with the fat fraction taken from the water-fat image analysis (see next §) [273].
In DMD boys, individual muscle contractile volume determination has revealed complex relation with strength decrements. It was proportional to the muscle loss in the quadriceps but it was found considerably more important than expected from the contractile tissue loss in the hamstrings and in the tibialis anterior [273].
In normal muscle or when disease affects homogeneously the muscle, cross-sectional areas measured at well-selected levels, f.i. mid-distance of the thigh, will provide pertinent trophicity indices [110, 183, 234] while considerably shortening acquisition and post-processing steps. However, this approach implies rigorous positioning relative to anatomical landmarks. These landmarks can be identified externally, such as the superior iliac spine or the upper border of patella, or in scout scans acquired prior to the actual measurement [81]. Preference is usually given to external landmarks because of possible complexities in determining the scanner table position when switching between coil configurations. However, correction for slice mis-positioning on successive exams is much easier when the bony structures have been entirely scanned. Better inter-scan reproducibility of cross sectional area determination has been reported with scout-image than with external anatomical landmarks [81] When pattern of muscle destruction by disease is known to be peculiar, f.i. progressing from proximal to distal or when it is simply unknown, the acquisition of entire volumes or at least thick stacks of slices spanning most of the muscle length is highly preferable.
The pediatric population poses additional problems related to the growth process itself. On examinations repeated at intervals allowing growth effects to manifest, it is not easy to decide how slice registration has to be adapted. For lack of better solution, slice registration is usually adjusted in proportion to the length increment. For 3D acquisitions, it can be done during the data processing step. When stacks of 2D slices are acquired, slice gaps have to be increased also in proportion to the measured growth and this is often skipped because it requires an intervention at the time of the acquisition itself.
In practice, except for specific studies, thorough evaluation of muscle trophicity has been very seldom performed so far. It requires patient contouring of each individual muscle that, to this date, has to be performed manually. The task is long, tedious and little rewarding, which explains why the evaluation of muscle trophicity is most often left aside. Very few longitudinal studies of muscle trophicity are available for neuromuscular patients. A positive effect of enzyme replacement therapy on lower limb muscle volume was observed in Pompe patients already after 6 months of treatment [204]. After a one-year observation period, calf muscle cross sectional area of inclusion body myositis patients lost 6.5% while it did not change in Charcot-Marie-Tooth 1A patients [181]. In a small population sample, and using an arguable methodology, no change in muscle trophicity was detected in the lower limbs of spinal muscular atrophy patients [228].
Attempts have been made to develop software for automatic segmentation of muscle images. Very few of the proposed solutions have been able to generate reliable results, and particularly no solution has yet been successful when diseased, fatty infiltrated muscles have to be analyzed. Very recently, a model-based automatic segmentation software was reported to generate results in close agreement with those of manual segmentation [130]. The naive suggestion has been made to determine global estimates of muscle mass based on intensity histogram of entire segments of limbs [166]. It would offer little advantage over simple external measurements and ignores the fact that usually not all muscles are affected simultaneously by disease. In the thigh of GRMD dogs, depending on the muscle considered, trophicity estimated by the muscle volume normalized to body mass was found to increase, stay normal, or decrease with age [138]. Focusing attention on the ones that are moderately to severely affected but not destroyed will increase the capacity to detect inflexion in disease progression whilst global measurement by a dilution effect over less affected muscles would decrease the capacity to detect changes. A more realistic approach seems to turn to interactive software solutions. Here, operator contribution remains mandatory, but it is also the case in practice when using automatic methods with the need to scroll through the segmented volume to check for errors. At least one of such software is under development and is based on the random-walker algorithm [42]. With this method, the operator has just to strike each muscle not on all but only every five to ten slides. In case contours are incorrectly detected by the algorithm, the operator can immediately apply a correction by another pencil strike in the erroneously assigned region. Tests performed on thigh muscles show comparable results to manual segmentation, in terms of muscle volume determination and of inter-operator variability, with the advantage of a processing time cut by a factor of ten at least. This can be further accelerated by optimizing the software reactivity to intervention, also possibly by injecting some prior knowledge of muscle shapes and relativepositions.
The difficulty in segmenting muscle images and the main raison for failure of automatic detection is the frequent absence of visible muscle contours on part of their circumference. This is particularly true with standard T1w or T2w spin echo sequences. One way to improve situation is to perform the segmentation on images that present an improved contrast between muscle tissue and fascia, as it is the case on gradient echo images, acquired at specific echo times when water and fat signals are in opposed phases (see below). In our laboratory, trophicity measurements are systematically performed on this type of images. Attempts to further reinforce contrast of fascia and aponeuroses, with dedicated susceptibility imaging sequences, have so far been unsuccessful.
Another motivation for a fine assessment of muscle trophicity is the frequent absence of fatty degenerative changes in neuromuscular pediatric patients at the first stage of disease. It has been hypothesized by pediatric neurologists that relatively subtle alteration of muscle trophicity might be an early indicator of muscle involvement (Robert Carlier and Susana Quijano-Roy, personal communication). It remains to be proven and the availability of fast, user-friendly segmentation methods will allow thorough testing of this idea.
CHRONIC DEGENERATIVE CHANGES
Chronic damages to myocytes as well as long-lasting fiber structural anomalies will at some point result in contractile tissue replacement by fat and/or connective tissue. Imaging of fibrosis remains a challenging issue, which will be discussed in another paragraph. To the contrary, fatty degenerative changes are easily detected and quantified, taking advantage of the differences in resonance frequencies (chemical shift) and also possibly in T2, or even in T1, relaxation rates between water and lipids hydrogen components. For a comprehensive technical review, read Bley et al. or Hu and Kan [24, 119].
Visual grading of fat infiltration on T1w spin echo images, for example the Lamminen-Mercuri scale [140], is satisfactory for muscle diagnostic purposes but is absolutely inappropriate to monitor the more subtle chronic degenerative changes progression. Supposing that the human eye would be good enough to classify lesions between 1 and 4 without error, which is certainly not the case, a change in classification would happen on average for a 17.6% increase in fat fraction. Even the most severe forms of dystrophy do not achieve such an annual rate of muscle destruction. Failure of Lamminen-Mercuri grading to assess adult limb-girdle muscle dystrophy type I progression was patent in the recent study of Willis et al. It is sometimes proposed as a solution to perform on the same screen a head to head comparison of series of T1w images acquired at different points in time during follow up. Looking that way at repeated series of images certainly helps to detect changes but remains highly observer dependent, with unknown sensitivity threshold and without the indispensable quantitation needed to compare patients or interventions. Trying to take advantage of the apparent simplicity of the approach, attempts have been made quite some time ago [148] and more recently [166, 198] to separate water and fat by a threshold applied to routine T1w images. Some earlier efforts have tried to take into account the possible coexistence of fat and water in the same voxel and have calculated the fat fraction using a linear combination of pure fat and pure muscle signals [148]. The latest studies have just operated a binary separation between fat and muscle voxels, which is totally inadequate for the evaluation of fatty infiltrated muscles in the context of chronic muscle diseases [166, 198]. All these approaches based on standard T1w image analysis assume perfect or almost perfect transmitter and receiver homogeneity, which is never the case. It was possibly an acceptable postulate when it was common to work with low field systems, 0.5T; it is not the case anymore, and certainly wrong at high field, 3T and more, or when reception is made by multiple arrays of surface coils. Until technical solutions are found and implemented to guarantee very high homogeneity of transmitter and receiver fields and/or perfect post-processing corrections of imperfections, one should discourage intensity-based separation of muscle and fat, which is particularly misleading for the non-experts who can be abused by the apparent simplicity of the method.
\spaceskip =.22em plus.1em minus.1emFor the monitoring of muscle chronic degenerative changes, preference is nowadays largely given to water-fat imaging sequences, most often referred to as Dixon sequences [159]. They take advantage of the phase shift that progressively develops during the evolution time of a gradient echo to separate the water and fat resonances. The major advantage of this approach is that the separation between water and fat is to the second order independent of the main magnetic field homogeneity and, as a consequence, extended fields of view covering large volumes can be investigated.
In the standard Dixon version, only the methylene resonance of lipids is considered and two or, better, three images with fat and water successively in-phase and out-of-phase are acquired and allow extraction of the water and fat components. Two-point (extended) Dixon may generate satisfactory results in the liver. However, for muscle applications, swaps between water and fat components can occur between limbs or inside limb segments, the latter being considerably more of a problem [112]. Three-point Dixon is almost always immune to this issue.
Ignoring the other lipid resonances introduces some degree of inaccuracy [271]. This can be improved by a better modelling of the lipid spectrum, usually 3 or 4 main resonances, which requires the collection of 6 echoes and relatively intensive computation [118]. This approach, known as Iterative Decomposition of water and fat with Echo Asymmetry and Least-square estimation (IDEAL) and T2*-IDEAL, is currently the most advance method for water-fat imaging. The multiple echo acquisition implies relatively long echo collection and repetition time, with the need of T2* effect corrections. The IDEAL method measures more accurately the hydrogen fat fraction and has the potential to identify differences in the lipid spectrum, which might be caused by nutrition or disease. There is little evidence of this in the skeletal muscle, or if present, there are likely to be of small amplitude and hardly detectable in routine conditions.
If the relative intensities of the lipid spectrum infiltrating the muscle can be considered as being independent of the patient condition, which seems a reasonable assumption, there is no need to go through a 6-echo acquisition. A linear correction factor can be applied to the fat signal and accurate fat fraction will be obtained from standard 3-point measurement. The correction factor was determined in our lab to be 1.82 [14].
How the muscle fat content is expressed can also vary. One can simply look at the percentage of the actual NMR signal in the voxel or in the muscle that can be attributed to fat. Depending on the image repetition time and echo times chosen, corrections for T1 and T2* effects can be applied. One can go further and try to express the fat content as g of lipids per unit muscle mass or volume. Such procedures have been developed for the liver and require additional assumptions or measurements of the tissue lipid composition [155].
As already stressed, consistency is key to success in clinical trials. Simplicity is a vital factor to ensure consistency. Bearing this in mind, at the time of this writing, we recommend 3-point, 3D when possible, Dixon, with proton density weighting (for example, TR of 10 ms and flip angle of 3°) for water-fat imaging of diseased muscle [112]. The standardized correction factor for lipid spectrum may or not be applied and simple percentage of fat signal parametric maps generated. Accuracy may be slightly affected but not precision nor discriminant power, which is what matters in the context of longitudinal studies, with or without intervention.
When intramuscular fat content is low, there is no need to deploy convoluted hazardous processes [12, 136]. Lipid detection can easily be sensitized by shortening TR in 2D Dixon or increasing the flip angle in 3D Dixon while exactitude of relative fraction will be preserved by applying correction factors for water saturation.
While water-fat separation based on chemical shift differences is the accepted state-of-the-art method to evaluate fatty infiltration of tissues, many clinical groups are still measuring the muscle mono-exponential T2 decay [83, 92, 134, 135, 267]. In absence of mobile lipids in the tissue, an elevated T2 points towards inflammatory, oedematous changes. The T2 increase due to inflammation or oedema rarely exceeds 5 to 10 ms. But when fatty degenerative changes are present, because of the much longer T2 of lipids as compared to water, the mono-exponential fit of T2 decay is largely driven by the degree of fat infiltration and the muscle global T2 becomes essentially a measure of tissue lipid content [37], as demonstrated by the tight correlation between global T2 and fat fraction calculated from Dixon images [14] or lipid fraction measured by 1H localized spectroscopy [135].
Either based on true water-fat separation or estimated from global T2 changes, a large body of evidence indicates that muscle chronic degenerative changes can be very precisely assessed, disease progression and response to therapy can be finely monitored. It has been demonstrated in a number of neuro-muscular diseases.
In the thigh of Duchenne patients, average fat deposition was reported to be 5% /year, with 50% of fat total content being predictor of loss of ambulation in the year to come [80]. In a small cohort of 3 adult Becker patients, thigh fatty infiltration rate was measured at 3.7% /year [27]. Combining percentage of fat maps with manual segmentation of muscle, contractile cross-sectional areas were determined in Duchenne patients [273]. Confrontation of percentage of fat maps with Lamminen grading showed a systematic overestimation of the fatty degenerative changes with the qualitative methods [271].
Forearm investigation revealed more severe involvement of flexor than extensor muscles, and a much faster progression of fatty infiltration in non-ambulant than in ambulant Duchenne patients [111, 263].
One year administration of corticosteroids to young Duchenne boys stopped the fatty infiltration process in the thighs and legs while fatty infiltration rate was respectively of 7% and 3% in non-treated children [10]. The severity of the disease allowed the identification of fatty degenerative changes over 18 months, based only on T1-weighted signal intensity measures, with the demonstration of inter-individual and inter-muscle variability [113]. Such an imaging approach is obsolete according to current standards of quantitative imaging and cannot be recommended for future investigation. The same method had been used earlier, in combination with global T2 measurements, to describe differential involvement of muscles in five Duchenne patients [92].
A one-year follow up multi-centric study of LGMDI patients unambiguously established the superiority of quantitative water-fat imaging, pinpointing statistically significant fat content differences of 1 to 4% in lower limb muscles, whilst Lamminen-Mercuri gradings did not detect any trend and standard functional assessment fail to reach statistical significance, to the exception of the respiratory function tests [269].
Quantitative water-fat imaging revealed a peculiar bimodal distribution of fatty degenerative changes across muscles of fascio-scapulo-humeral dystrophy patients, as well as a distal to proximal progression within affected muscles [123].
In oculo-pharyngeal muscular dystrophy patients, lower limb fat content increased by 1.5% over 13 months, while it was unchanged in age-matched control subjects [79]. Neither standard extensive functional evaluation (MFM), nor visual grading did show any change during the same observation period.
The high sensitivity of Dixon methods was demonstrated in adult Pompe patients, most of them presenting with a disease with much slower progression than dystrophinopathies. In the lower limb of these patients, the average annual infiltration rate was less than 1% but was detected with a high degree of statistical significance [39].
Whole muscle fat fraction increased significantly during the 12-month follow-up at calf level (1.2% ) but not thigh level (0.2% ) in patients with Charcot-Marie- Tooth disease 1A, and at calf level (2.6% ) and thigh level (3.3% ) in patients with inclusion body myositis [181].
In patients with rotator cuff lesions, quantitative assessment of fatty degenerative changes more than muscle atrophy in affected muscles showed a strong relation with the extent of the muscle tears [185, 188].
It has also been reported in conditions affecting secondarily the skeletal muscle.
In patients with amyotrophic lateral sclerosis, leg global T2 measurements increased significantly over a 4-month observation period, signing the progression of the fatty degenerative changes and was correlated with the decline in foot dorsiflexion maximal voluntary isometric contraction [30].
While leg muscle total fat content was unaffected, type 2 diabetic patients displayed a preferential distribution of lipids intramuscularly [127].
Whole-body Dixon identified an increased fat content in muscles of hyperkalemic periodic paralysis [146].
Changes in skeletal muscle composition have been systematically and consistently found in elderly subjects, even though they are of limited amplitude until a very advanced age. Percentage of intramuscular lipid signal typically doubles, from 2 to 4% , between the second and the seventh decade [3, 13, 46, 182, 214]. For its largest part, it represents a true increase in muscle fat content and it only marginally reflects the contractile tissue loss with aging [46].
In a diseased muscle, the intramuscular fat content can be seen as an integrator of the damages sustained by the tissue over the patient life time, which makes it a robust biomarker. One would then like to use the increase or the levelling-off of fatty infiltration over a defined period of time as a quantitative index of disease progression or response to treatment. In muscle dystrophy, and particularly in Duchenne boys, disease severity can be extremely variable from one patient to another, which translates in annual fatty transformation rates ranging between 3 and 15+ percent [26, 80, 263]. This will seriously complicate interpretation of any therapeutic intervention. If a 5 percent increase in fat content is measured after one year of treatment, does it have to be interpreted as a positive response in a particularly severely affected patient or as a negative response in a mildly affected patient? At a group level, one could obtain the answer by conducting a standard placebo controlled study. Such classical approach still would not resolve the question at an individual level and raise ethical consideration on delaying a potentially effective treatment in a group of patients suffering from a deadly disease. One could also propose to use each patient as its own control and, after an observation period, determine if the slope of the fatty degenerative progression abates after treatment is initiated. It would allow to appreciate each patient’s response but would cause the same ethical dilemma. Because the intramuscular fat content is a cumulative index of all damages to the muscle over the patient’s life span, it is in itself a potent indicator of disease severity if the age of the subjects is taken into consideration. At a particular age, the higher the fat content, the higher will be the anticipated fatty transformation rate.
Even though limited in number, forearm data from the Genethon DMD natural history study support this contention [262]. References tables could be built by pooling all data collected in the different natural history studies.
Along the same line, a strong correlation was observed between the actual fat content in a muscle and the annual intramuscular fat increase in a population sample of adult Pompe patients, who have a relatively mild and homogenous disease course, but also a scattered distribution of fatty degenerative changes across the lower limb muscles [39].
The relation between fat fraction and its progression will inevitably plateau for high levels of fat fraction. One cannot expect fact fraction to increase by 15 percent when fatty replacement reaches 80% , even though it was the case when it was only 40% . A simple solution to circumvent the sigmoid relation between fat fraction and its progression, is to normalize the fatty replacement progression to the remaining contractile fraction, i.e the true muscle transformation rate into fat. Taking the example above, the 15 percent fat increase when contractile tissue was 60 % would, if disease severity remains constant, correspond to a 5% increase when contractile tissue was down to 20% .
DISEASE “ACTIVITY”
More than two decades ago, animal studies have identified that skeletal muscle tissue of mouse models of muscular dystrophy had an elevated T2 [172, 235]. The same observation was made in a larger animal model, the GRMD dog [238, 239, 260]. Interestingly, muscle T2 normalized when gene therapy was successful [190, 259, 283].
Recent reports have confirmed and expanded our knowledge on the muscle T2 alterations in animals with muscle dystrophy. Temporal changes of muscle T2 was precisely determined in mdx mice with a peak between 4 and 8 months of ages, then progressively declining [104, 201, 254], T2 abnormalities were described in other models of dystrophy [163, 252], with different patterns of intra-muscle distributions in Large and in mdx mice. The particular sensitivity of dystrophic muscle to eccentric exercise was illustrated by the higher elevation of T2 in mdx mice submitted to downhill running [165].
When response to micro-dystrophin gene expression was assessed in mdx mice, T2 mapping showed superior discriminant capacity over magnetization transfer ratio and diffusion tensor imaging [192]. Successful U7-exon skipping in GRMD dogs was associated with a decrease in T2 of the treated limbs [142]. Losartan treatment normalized muscle T2 of laminin deficient congenital muscular dystrophy mice [252].
The T2 or the spin-spin relaxation time of muscle water can be interpreted as an indicator of disease activity in the skeletal muscle. Disease activity is a purposively vague designation because a change in T2 is a non-specific event that can be caused by many mechanisms, inflammation, necrosis, muscle dystrophy, acute denervation, any circumstance that can create an intracellular oedema, extracellular oedema or a combination of both. This has been extensively demonstrated in animals [31, 99, 101, 272] and in humans. Physical exercise of moderate to high intensity will increase muscle T2 through intra-myocytic fluid accumulation in contracting myocytes. The process is transient and should recess within hours as opposed to pathological increases of T2. It is important to realize that it may bias the evaluation of patients if they are examined shortly after exercise. For this reason, we recommend to perform imaging before the functional evaluation studies, and this particularly for patients with muscles fragilized by disease.
As mentioned in the previous section, animal models of muscle disorders in general do not develop fatty degenerative changes that infiltrate their musculature and a global increase in muscle T2 as measured via a mono-exponential fit to the NMR signal decay will unambiguously indicate an increase in myocytic water T2. In humans however, fatty replacement of myocytes is a frequent outcome in chronic neuromuscular disorders. Since lipids have a much longer T2 than intra-myocytic T2, a few percent of intramuscular fat content will push mono-exponential T2 up to values comparable to the ones measured in an inflamed or damaged muscle tissue.
Many groups have measured the mono-exponential T2 decay of fatty infiltrated muscles and have reported that it was increasing with age in muscles of Duchenne boys [9, 83, 92, 134, 135, 267]. Others, to the contrary, have observed a decrease of muscle T2 of Duchenne patients over time [83, 263], as observed in animal models. These apparently contradictory results can confuse the reader. In the first instance, global T2 was determined and the increase in T2 reflected the progression of the fatty degenerative changes. The information is redundant with the one provided by Dixon sequences and results obtained with the two techniques are tightly correlated [14]. In the second case, muscle water T2 was specifically measured and the progressive decrease in T2 might either be related to growth since it can be observed in normal subjects, at least in the dog [238], or to the progressive exhaustion of the muscle inflammatory and regenerative capacities.
For the sake of clarity, we advocate for the use of precise denominations: muscle global T2, whose alterations reflect mainly the fatty degenerative changes and muscle water T2, which assesses the involvement of the muscle tissue itself by the pathological processes [37]. Because it mixes information that can be obtained separately, we, and these are personal views of the writers, recommend to abandon global T2 measurements of fatty infiltrated muscles. It generates too much confusion, that can be avoided by more elaborated analysis of the muscle T2 decay (see below § on new developments).
The use of muscle water T2 as in indicator of disease activity is not only possible in humans, it is a highly relevant variable, at least as much as in animal models. Water T2 is abnormally elevated in muscles of Duchenne boys [9, 83, 263], but not in Becker patients [274]. In late-onset Pompe patients, water T2 was found moderately abnormal in approximately one third of all muscles examined [39]. In inflammatory myopathies, muscle T2, as a general rule, is increased [161, 193, 279]. In diagnostic imaging, this is classically detected using fat-saturated (STIR) T2w sequences [55, 258]. In patients with fascio-scapulo-humeral muscular dystrophy, a proportion of muscles are STIR positive and have signs of inflammation at biopsy [236]. However, with this qualitative approach, one looks visually for contrast between abnormal and normal muscles or areas. If all muscles in a segment are inflamed, the examination will likely be considered falsely negative. Such situation was encountered in juvenile dermatomyositis patients [38]. For this reason, and even if not widely accepted by the medical community yet, we systematically use quantitative water T2 maps for the assessment of inflammatory myopathies, particularly for the evaluation of the response to treatment.
Besides the lack of specificity of the muscle water T2 changes, there remain uncertainties concerning the exact temporal relation between the pathological events and the T2 changes. It is unclear whether there is a delay and how long it could be. Discrepancies exist between muscle T2 and clinical status in some patients with inflammatory myopathies. Natural fluctuation of T2 in the course of muscular dystrophy is not documented at all.
Interestingly, muscle water T2 can be found elevated in some congenital myopathies, at least in animal models of nebulin, ACTA1 or dynamin gene mutations [93– 95, 162]. This suggests that a certain degree of cellular disorganization can affect intracellular mobility enough to modify T2. The possibility of abnormal muscle T2 in stable myopathies introduces a restriction to the generalization of the use of muscle water T2 as an absolute indicator of disease activity. Also, muscle water T2 changes after denervation is due to the relative increase in extracellular space that accompanies the muscle tissue atrophy [82, 129, 199] and reflects more the structural reorganization of the muscle than disease activity stricto sensu.
It might then be wiser to restrain the use of muscle water T2 for monitoring disease activity to conditions known for being affected by destructive pathological processes at least during certain periods of their evolution. When it is the case, the determination of muscle water T2 appears to be a powerful biomarker of disease progression or response to intervention. What was clearly demonstrated in animal models, is now supported by several studies in humans. The T2 level has been found to predict the progression rate of the chronic degenerative changes. In young Duchenne boys, after initiation of steroid treatment, leg muscle T2 rapidly decreased by a few ms, this reduction was maintained over time and was associated with a blockade of the fatty infiltration process [10]. As already mentioned, in adult Pompe patients, one third of all lower limb muscles investigated presented a mild to moderate elevation of water T2 in at least one of two scans at one year interval. Those muscles experienced a faster progression of the degenerative changes, approximately 35% faster, than the muscles with normal T2 [39]. For the different muscles, there was a significant correlation between mean T2 value and mean fat infiltration rate. In patients suffering from fascio-scapulo humeral dystrophy, it was shown that muscles with hyperintensities on T2w images would subsequently display significant fatty degenerative changes on later follow up scans [84, 123]. Such observations are pivotal in establishing the utility of muscle water T2 as a biomarker of disease activity in neuromuscular diseases.
Many questions remain to be addressed. One of the most intriguing is the muscle water T2 response to dystrophin expression in Duchenne patients already under steroids. Steroids bring water T2 back close to normal values and it is uncertain whether some degree of dystrophin expression as obtained currently with exon skipping will be able to further decrease T2. Some preliminary observation suggests that it might be difficult to detect (author’s personal observation).
Methodological issues make the exact determination of muscle water T2 challenging. We discussed in detail the difficulties generated by fatty infiltration and replacement. Full suppression of the lipid signal is extremely challenging to obtain and residuals of only a few percent will impact on the water T2 estimate. Preference is nowadays given to methods that do not attempt to minimize the lipid signal but rather to separate the water and fat signals, based on chemical shift or T2 differences, during the acquisition itself or by subsequent processing. There are not many and the most frequently used are based on multiple spin-echo collection, in CPMG regime and covering a large range of echo-times. The Dixon water-fat separation scheme has been incorporated in a multi spin echo diagram, giving birth to the IDEAL-CPMG sequence [122]. Another option is to perform a tri-exponential fitting to the signal decay of a multi spin echo sequence. Taking advantage of the large difference in T2 between water and fat, this method was shown to efficiently separate the two components [14]. Since this is obtained by post-processing exclusively, and the sequence used is standard on most NMR scanners, this approach can easily be implemented in multi-center trials and this is actually the case.
Accurate measurement of T2 is very demanding. In a multi spin echo sequence, excitation and refocusing pulses have to be exactly set tot 90° and 180°. Otherwise, the signal decay will be too fast, if efficient gradient spoiling is available, which is rarely the case on clinical systems, or too slow if unspoiled signal arising from stimulated echoes adds to the spin echo [112]. A practical approach has been to complement the multi TE spin echo sequence with another sequence that maps the B1 field, and gives the exact flip angle experienced by each voxel [280]. When it departs from the prescribed value, the voxel in question is withdrawn from the T2 map [14]. It is simple, efficient, but eliminates a significant proportion of voxels in areas of poor B1 homogeneity. Better solutions exist and are in the process of being implemented for clinical research studies. Instead of fitting exponentials to the signal decay, models following a more exact trajectory of both spin echoes and stimulated echoes can be implemented and suppress the need for B1 map. For example, the Extended Phase Graphs (EPG) formalism is a powerful tool to depict and understand the magnetization response of an arbitrary multi-pulse MR sequence, under different T1 and T2 relaxation constraints. Recently, Lebel and Wilman have proposed to model the MSME signal using the EPG formalism for precise T2 relaxometry [143]. Rooney et al. have suggested that EPG modeling could be used to improve agreement and accuracy of muscle T2 mapping across multiple sites [209].
Accuracy is important in clinical research but, what counts most, is the discriminant power of a technique. What is reassuring with water T2 measurements, is that, even if the measurement is inaccurate because of pollution by stimulated echoes, it remains sensitive to the effect of pathologies and interventions. That was the case in a clinical study where the measured control T2 value was almost twice the real one, but the effect of inflammation and its reversal by steroids was nevertheless properly captured [161].
RELATIONS BETWEEN FUNCTIONAL AND NMR OUTCOME MEASURES
A most frequent and recurrent question is the relation between the standard functional outcome measures for the skeletal muscle and the imaging ones. When a clinical investigator is short of imagination, it seems to have become a favorite proposal: does NMR correlate with function and to which extent? The answer is always known in advance: yes, there is a correlation between the two classes of tools, and the correlation coefficient is typically around 0.7. It is indeed obvious that muscle performance depends for a significant part on muscle mass and composition. It was already patent in early studies using qualitative indices of fatty degenerative changes in Duchenne patients [153]. This has been systematically confirmed [80, 91, 134, 246, 253, 273, 275]. Recent additional evidence was obtained for myotonic dystrophy type I [106], Charcot-Marie-Tooth 1a and inclusion-body myositis patients [181] as well as for rotator cuff lesions [185] and aging [46]. Very logically, muscle strength correlates better with residual contractile mass [273] than with the percentage of fat infiltration [275].
An example of complementarity between imaging and function is the use of the contractile cross sectional area to determine whether a decreased muscle strength or torque is due only to muscle hypotrophy and wasting or if intrinsic contractile defects intervene. In Duchenne boys, the decreased muscle strength remained abnormally low when normalized for the remaining contractile tissue mass, pointing to contraction anomalies of the dystrophic muscle [253, 273].
There are other relevant questions. What is the temporal relation between muscle composition changes and the functional alterations? Data from the Imaging-DMD consortium, presented at a WMS meeting [255] but yet unpublished, showed that leg muscles fat fractions increased up to 60% without major impact on the 6 min walk test in DMD boys, indicating that imaging changes might be a good predictor of clinical prognosis. This is of utmost importance and needs to be confirmed. Other studies, also in DMD patients, indicate, that decline in muscle strength occurs in parallel with the progression of fatty degenerative changes [253, 273], or might even precedes them in the forearms [110].
Another important question is the discriminant power of outcome measures. How do biomarkers compare in terms of their capacity to detect the effect of an intervention, for the smallest possible change in the smallest population sample? Because they are independent of subject’s volition, most NMR imaging quantitative indices have superior reproducibility performance and have been proposed as best candidates to detect and monitor effect of therapy [26, 107]. This conclusion relied on the assumption that therapeutic agent will induce changes of identical amplitude for all outcome measures, which is unlikely. The question remains open but, even if not eliminated, the lesser dependence of NMR outcome measures towards patient’s collaboration constitutes a major asset.
Our enthusiasm must be tempered by the skepticism opposed by the FDA to the use of NMR as an outcome measure to assess the response of dystrophic muscle to exon 51 skipping with drisapersen. The regulatory agency expressed concerns on the impact of imaging platforms diversity, but also of differences in imaging schemes and acquisition parameters, and image analysis procedures on the estimated NMR variables. There were also remarks on insufficient quality control of system stability and assessment of reproducibility. It was objected that the expected effect of treatment might be on the same order as the variability of the technique. Small sizes of population samples were also criticized. Uncertainties on the relation between NMR variables and functional measurements were also stressed. Interestingly, there was again some confusion in this report between global muscle T2 and muscle water T2. The FDA request of a complete harmonization of procedures across sites is unrealistic from a technical standpoint. The only way to reassure regulatory agencies on the value of the NMR measurements will be the careful validation of the processes that generate parametric maps and the demonstration of the independence of the output relative to differences in acquisition conditions.
A definitive advantage in favor of NMR would be the identification of biomarkers that would be able to predict the future clinical outcome very early on, and before any functionally or anatomically detectable response. In oncology, NMR spectroscopic indices have been shown to reveal positive response to treatment before any morphological sign of tumor regression [147, 206, 221]. Similar markers have yet to be identified for neuromuscular diseases. Muscle phosphodiester level is a candidate for muscle dystrophy, where it is elevated in relation with the increased membrane phospholipid turnover [69, 132, 262, 272], and seems to respond very early on when dystrophin is expressed [142].
There is a whole lot of reasons to pursue confrontations between functional and imaging biomarkers in patients with muscular disorders. As a general rule, these are the discrepancies and the deviations from tight correlations that should generate interest. Unravelling their mechanisms will advance knowledge whilst the contemplation of perfect agreement is reassuring but is essentially sterile.
THE ROLE OF 31P NMR SPECTROSCOPY AS AN OUTCOME MEASURE
In vivo NMR spectroscopy is a very powerful tool to investigate skeletal muscle energy metabolism non-invasively via 1H, 31P, 13C nuclei, to name the most important ones [25]. 31P NMR spectroscopy identifies and quantifies key energy metabolites, phosphocreatine, ATP, inorganic phosphate [131]. It measures intracellular pH. Free cytosolic ADP concentration and oxidative and non-oxidative ATP production can be determined. With the relatively simple use of surface coils positioned directly on the segment of interest, it has generated a wealth of invaluable information on skeletal muscle energetics, its regulation during exercise and its disturbances by diseases [8, 44, 102]. So far, NMR spectroscopy has not played a significant role as an outcome measure in neuro-muscular diseases, to the exception of muscle dystrophy.
Years before dystrophin was identified and dystrophin mutations were recognized as the cause of Duchenne muscular dystrophy, striking anomalies were described in the 31P spectra of Duchenne boys [44, 69, 187]. Interestingly, they are present at rest, which notably facilitates their identification, and they point towards anomalies at different subcellular levels, the mitochondria, the contractile apparatus and most importantly, the sarcoplasmic membrane [130, 247, 262, 284]. Total amount of P-compounds is low, as a consequence of muscle atrophy and adiposity, phosphocreatine/ATP is low, indicating a loss in contractile tissue, inorganic phosphate/phosphocreatine is elevated, reflecting higher ADP level at rest, which in turn reveals a dysregulation of the mitochondrial oxidative phosphorylation control and/or an abnormal energy demand to maintain ionic homeostasis despite leaky cell membranes; intracellular pH is alkaline, more precisely there is a prominent pool of inorganic phosphate at a higher pH, coming from damaged dystrophic cells and/or an expanded interstitial compartment related to fibrosis [265]; last but not least, the phospho-diester resonance, mainly composed of glycerophosphocholine, is elevated, an indicator of an accelerated membrane phospholipid turnover in dystrophic myocytes.
Dynamic investigation of muscle energetics with 31P NMR seems to have never been performed in DMD boys. In BMD and in DMD/BMD carriers, anomalies of pH regulation during and after exercise have been reported, however not pointing systematically in the same direction [16– 18, 132, 247]. Both increased or defective glycolytic activity has been noted, while oxidative phosphorylation was most often normal [132, 154, 246, 247]. Globally, exercise results were considerably more scattered and did not show the high degree of consistency observed at rest.
The severity of the 31P spectral anomalies at rest has been shown to correlate with disease severity, being already detectable in DMD female carriers, present in Becker patients and patent in Duchenne boys [132]. In the fingers flexors of DMD patients, spectral anomalies were shown to be more intense in non-ambulant than in ambulant patients and to relate to the number of years after loss of ambulation [262]. In patients with fascio-scapulo-humeral dystrophy, PCr/ATP ratio was found to decrease at the same time as the muscle entered a phase of rapid destruction and replacement by adipocytes [123].
Again in the fingers flexors of Duchenne patients, the progression of these anomalies was monitored over a one-year period and was significant in the non-ambulant boys [110]. In the GRMD dogs, the forelimbs treated by an adenovirus associated virus mediated U7 exon-skipping, saw the elevated phosphodiester peak resume normal levels [142]. While still relatively anecdotal, these observations strongly suggest that 31P spectroscopy and in particular the phosphodiester resonance may provide useful biomarkers of dystrophic muscle response to dystrophin expression. Since 31P spectroscopy assesses the sarcoplasmic membrane integrity and stability, it will, by adding some degree of specificity, complement the more global information given by fat fraction and T2 maps. Very interestingly, PDE/ATP was recently reported to be elevated in muscles of BMD patients without any significant increase in fat infiltration [272], suggesting that it might be a very early biomarker of dystrophic processes, whilst water T2 did not seem to be in the same population sample [274].
NMR IMAGING OUTCOME MEASURES IN DEVELOPMENT
Current developments are being pursued in two directions
- either to identify NMR variables that would reflect important histological, physiological or biochemical changes that cannot be monitored by current standard approaches, e.g., fibrosis, microvascular dysregulation
- or to apply existing or novel NMR contrasts to further characterize diseased skeletal muscle, e.g., T1 or diffusion measurements.
10.1Fibrosis
Replacement of striated skeletal muscle by connective tissue, mainly collagen, is the other main class of degenerative change that affect muscles chronically damaged by disease [133, 137, 276]. More than fatty infiltration, whose deleterious effect is indirect through the associated loss in contractile tissue, fibrosis directly impacts on muscle function. Endomysial fibrosis tightly correlates with loss of motor function in Duchenne patients [56]. This is the justification of the therapeutic research aiming at blocking or reversing pathological deposits of connective tissues [288]. For the evaluation of efficacy of anti-fibrotic agents, imaging biomarkers of fibrosis would be of considerable help. Unfortunately, while fatty replacement is easily imaged and quantified by NMR techniques, it remains an unmet challenge to evaluate interstitial fibrosis with NMR. The many proposals that have been put forward to detect fibrosis by NMR essentially indicate that none is so far entirely satisfactory.
Collagen and other macromolecules of the interstitium but also their hydration water molecules have very short T2s, in the range of 1 to a few hundred μs [70, 226]. On standard or fast imaging with TEs of 1 to several ms, the NMR signal of these spins is totally phased out and do not contribute to the image. Dense connective tissue, like in tendons or scars, appear as a signal void, readily detected on routine imaging. Interstitial fibrosis ought to decrease voxel signal intensity in proportion to the fractional volume occupied. On standard images, these fluctuations, which should typically be in the range of a few percent, appear to be hidden by the spatial dependence of tissue NMR signal to voxel position relative to arrays of surface receiver coils. Attempts to correct for these, even though visually satisfactory, have not so far permitted the quantification of the signal loss generated by connective tissue deposit. It may tough contribute to the abnormal distribution of signal intensities observed in muscles profoundly remodeled by disease, with fibrosis being most often an essential component of this remodeling. Muscle signal heterogeneity, particularly on T2w images, is to our knowledge a constant feature in dystrophic muscle and likely reflects local fibrosis, to an extent that remains difficult to determine at this moment [197, 238, 262].
Tissue T2 signal decay is a complex multi-exponential process. When the T2 decay was sampled at a very high rate, it was possible in animal models to generate T2 spectra revealing a very short component attributed to tissue macromolecules [210, 211]. When transposed to humans, the technique, known ISIS-CPMG, identifies intra and extracellular components but has so far failed to detect this very short T2 pool of spins [6].
Magnetization transfer experiments are tailored to study spin exchanges, either through dipole-dipole interaction or true chemical exchange, between mobile and semi-mobile pools of spins. Applied to biological tissues, they measure exchanges rates between free water and macromolecules, as well as the relative sizes of these pools [104, 180]. In the past, there were many attempts to relate magnetization transfer contrast to tissue collagen content, particularly in the liver, with mitigated results. Very recently, fast imaging with optimized saturation schemes generated encouraging results, with a good correlation between magnetization transfer contrast and fibrosis in the liver [281]. Magnetization transfer contrast is high in the skeletal muscle and its origin and mechanisms have been studied by several groups in normal, aging and diseased muscles, with a particular attention but yet poorly understood link to fibrosis [151, 152, 182, 214, 224, 225]. Particularly puzzling was the unexpected negative correlation between magnetization transfer contrast and aging in a group of normal subjects, however for one particular frequency offset and irradiation power, whose results cannot be extrapolated for other saturation conditions [182]. The negative effect of fat infiltration on magnetization transfer was stressed [151]. Magnetization transfer has been combined with double quantum filtering and ultra-short TE (UTE) imaging in an attempt to improve specificity towards collagen [72, 139]. Results are encouraging but must be regarded as preliminary.
Quasi ignored until it became a most effective and popular way to detect and quantify myocardial fibrosis, the replacement of myocytes by connective tissue is accompanied by a parallel expansion of the interstitial space. It can easily be quantified after intravenous injection of a low molecular gadolinium (Gd)-labelled contrast agent, like Gd-DTPA or Gd-DOTA that rapidly diffuses in the interstitium, where its concentration equilibrates with the plasma concentration. Minutes after injection, at the transient pseudo-steady state phase of the Gd-contrast agent distribution, the increase in the myocardium T1 relaxation rate relative to the increase in T1 relaxation rate in the plasma, is a measure of the tissue fractional extracellular volume [176, 179]. Though indirect, this is a most powerful technique to quantify pathological connective tissue deposit in the myocardium. A prerequisite to the use of the method to quantify fibrosis is the absence of extracellular oedema or cellular anomaly that may result in Gd contrast agent accumulation or penetration into the myocytes, such as necrosis, inflammation, dystrophy. In these instances, or when they are suspected to co-occur with a structural remodeling, the volume of distribution of the Gd contrast agent cannot be used anymore as a surrogate marker of fibrosis.
The same method and principle might be applied to evaluate indirectly interstitial fibrosis in the skeletal muscle but seems not to have been attempted yet. Some difficulties may be expected in relation with the lesser extracellular space of skeletal muscle, the lesser degree of fibrosis usually in diseased muscles and the lack of a blood reference signal as easily available as in the ventricular cavity.
For the same reason, and because sodium concentration is more than 10 times higher in the extracellular space than in the cells, global myocardial Na concentration increases in case of fibrosis and 23Na NMR imaging can be used to detect it [116]. Because the evaluation is indirect and based on changes devoid of specificity, the same reservations as formulated for the gadolinium contrast agent apply in case sodium concentration in tissues increases for other reasons, with a list of confounding circumstances superimposable to the one for the Gd contrast agents [160].
The NMR signal can be sensitized to motion even at a sub-millimetric level and can be used to track pressure wave propagation. In short, the speed of pressure wave propagation increases with tissue stiffness. Hence, it can be used to estimate the visco-elastic properties of a tissue [96]. This is the base of NMR elastography, which is a validated method to quantify liver fibrosis. The technique has been transposed to the skeletal muscle and a number of circumstances have been evaluated [207]. The skeletal muscle is a highly differentiated structure in a complex environment. It does not seem trivial to relate wave velocity exclusively to the underlying muscle tissue from the same voxel. The whole environment of contractile and non-contractile elements must contribute and control the wave velocity at any particular point in the muscle. In particular, the effect of fatty deposits and infiltration is likely to be non-negligible. The same holds for oedema and inflammation [170]. So, again specificity issues may arise. One also has to keep in mind that tissue elastography can also be evaluated using ultra-sound methods, with comparable results and a clear advantage to ultrasound in terms of implementation [63].
A more direct detection of fibrosis has been proposed, which makes use of small peptides labelled with Gd and having a high affinity for collagen [35]. Results presented were convincing [36, 90] but administration and toxicity issues will probably restrict their use to animal models, this explaining the very limited impact of this approach so far.
By far, the most promising way to image fibrosis is the introduction of “ultra short TE” sequences, which operate at a TE very close to 0 and are able to collect the NMR signal of spins with a very short T2, of 1ms and less [249]. These sequences have the potential to visualize fibrosis directly, which would represent a major advantage over all methods relying on indirect link with fibrosis. The short T2 components can be revealed either by direct subtraction of a standard reference image with longer TE, dual band saturation, adiabatic inversion [150] or better by extracting the short T2 fraction from multi-exponential fitting of multiple gradient echoes acquisitions covering a range of TEs, with reconstruction of parametric maps that correct not only for T2* decay effects but also for lipids interferences [34, 261].
UTE imaging has been shown to reveal unambiguously cortical bones, deep layers of cartilages, ligaments, tendons, aponeuroses [64, 65, 208]. Direct demonstration of myocardial infarct scars has also been demonstrated [50]. Visualization of skeletal muscle connective tissue and attempts to quantify it have been reported in normal subjects, in elderly people and in myopathic patients [34, 46, 251]. Many issues remain to be solved, in particular about the possible superimposition with fat signals components. The greatest challenge, however, will be to isolate the fraction of the short T2 molecules pool to attribute to connective tissue. The same question holds for other approaches, in particular for magnetization transfer, with a significant part of the contrast generated by contractile proteins. As already mentioned, the combination of double quantum filtering, magnetization transfer and UTE imaging might be a way to extract more specifically the signal related to collagen [72, 139].
Perfusion and oxygenation
Functional NMR imaging has established itself as the gold standard for the non-invasive investigation of brain physiopathology in neurological diseases but also for cognitive studies in neurosciences [58, 189]. Very similar approaches have been developed and successfully applied to the skeletal muscle [40, 195]. Tissue perfusion can be measured non-invasively with a group of techniques called arterial spin labeling (ASL), that tag magnetically the arterial blood upstream of the tissue of interest. This results in a change in tissue magnetization proportional to perfusion. Because ASL does not require any contrast agent injection, perfusion measurements can be repeated very rapidly, every few seconds, and this indefinitely [205, 212]. This is particularly advantageous for the study of muscle perfusion, which can vary over a range of 1 to 20 and more in dozen of seconds. The ASL perfusion contrast to noise is low and easily polluted by motion. Most ASL studies have measured perfusion post-exercise or post-ischemia. However, if a sacrifice on temporal resolution is accepted, muscle perfusion at rest can be measured if the ASL signal is averaged during a few minutes [21, 40]. The BOLD (blood oxygen level dependent) contrast [189], famous for its ability to detect brain activation, can sense capillary and venous blood oxygenation in the skeletal muscle as well and provides semi-quantitative estimates of blood oxygen saturation [121, 124]. In contrast to most brain applications, skeletal muscle BOLD contrast can be negative, in case of deeper oxygen desaturation, as well as positive, when tissue oxygen extraction decreased [15, 48, 59, 144, 175]. Blood, and capillary blood volume impacts on the BOLD signal and complicates its interpretation [67]. Muscle oxygen consumption can be calculated, following Fick’s principle, as the product of tissue perfusion times oxygen arterio-venous difference. Perfusion is determined with ASL while large vessels oxygen content is derived from blood T2 or susceptibility measurements [53, 73, 286].
Several conditions affecting the skeletal muscle have been investigated by functional NMR, in particular acute and chronic ischemia [11, 74, 98, 145], but also diabetes [287], systemic sclerosis [194] and compartment syndrome [5].
With regard to neuromuscular diseases, the use of functional NMR imaging has been so far very limited. An unexpected contribution of muscle hypoperfusion to the defective mitochondrial oxidative phosporylation in glycogenosis type 3 patients was identified by combined dynamic functional and spectroscopic NMR measurements [264].
Much more can be expected in the future. One of the consequence of fibrosis when it also develops around arterioles is to encroach on vasodilation reserve. In a study of leg muscles of hypertensive animals, it has been shown that ASL can precisely quantify this phenomenon [20]. Altered perfusion is a pathological feature in Duchenne muscular dystrophy [240], in part related to defective nitric oxide production [117, 186], in part due to fibrotic changes [137]. Having the possibility to measure non-invasively in clinical research skeletal muscle perfusion dynamics in Duchenne patients would be of interest, in particular when it comes to assess the efficacy of vasodilatory or anti-fibrotic drugs [23, 75, 288].
T1 – pre and post-gadolinium
Kinetics of T1 relaxivity changes after standard low-molecular weight gadolinium contrast agent injection can be processed in order to obtain quantitative estimates of gadolinium contrast agent transfer from the vascular space to the interstitium, or more precisely to the accessible extravascular compartment and the volume of this extravascular compartment [141, 243, 245]. Ideally, the arterial input function must be recorded at the same time as the tissue signal enhancement. In practice, it can reasonably be assumed, which considerably facilitates data acquisition. Ischemia, necrosis, inflammation, fibrosis can nicely be evaluated from the associated changes in gadolinium contrast agent transfer rate and volume of distribution: slow rate and normal volume, slow rate and expanded volume, fast rate and increased volume, normal rate and increased volume, respectively. In the canine model, the dystrophic muscle is characterized by a parallel increase in gadolinium transfer rate and volume of distribution, which manifests by an increased peak enhancement with no shift in enhancement timing [239].
Even though the injection procedure is minimally invasive and perfectly safe, with the contrast agents offering the highest stability, the method is losing popularity. Despite the added value of the information generated as compared to T2 mapping, it is nowadays seldom implemented, because of the associated cost, the acquisition time needed to sample the enhancement curve adequately and the reluctance towards injection of any sort to paediatric patients.
Prolonged remanence of albumin targeting gadolinium contrast agent in dystrophic muscle of mdx mice was a most promising way to characterize membrane leakiness and myocytic damages [4, 232]. It remained confined to pre-clinical experimentation.
More recently, an interest has appeared for the “pre-gadolinium”, probably better named the native or the intrinsic T1 of skeletal muscle, which had long been neglected on the ground that in the early days of NMR imaging striated muscle had been shown to be unchanged by inflammation or necrosis. In reality, the methods of the time lacked sensitivity. The native or intrinsic T1 of dystrophic muscle was shown to be moderately but significantly elevated in GRMD dogs [238]. Dilated and hypertrophic cardiomyopathies display increased native T1, which seems to reflect more myocardial cell damages than interstitial fibrosis [49, 85, 108]. The observation is corroborated by the T1 shortening measured in collagen gels (Caldas de Araujo, personal communication). These leads have to be further explored before a clear role can be attributed to intrinsic T1 for the characterization of the skeletal muscle. There is reasonable room for optimism because of the robustness and speed of T1 measurement on modern scanners.
Diffusion
Diffusion weighted imaging (DWI) has been widely applied in various medical and non-medical fields since its first description by Stejskal and Tanner in 1965 [229], ranging from solid material, phantom and animal experiments to human tissue studies. The ability to assess displacement of water protons in vitro and in vivo using diffusion-sensitizing pulsed-field gradients has motivated its use to probe microstructural information beyond the resolution of conventional NMR imaging, i.e. in the range of several microns. Depending on the pulsed-field diffusion gradient scheme and strategy for analysis of the acquired DWI data, different parameters can be estimated from the investigated object: the apparent diffusion coefficient and the directional diffusivity, the displacement probability, the sizes of the diffusion-restricting boundaries (e.g. pore or cell diameter), and the transition probability between compartments delimited by semi-permeable boundaries.
It is about two decades ago that DWI has started to be applied to investigate the skeletal muscle. The vast majority of studies conducted in muscle tissue were based on single-shot, diffusion-weighted echo-planar imaging pulse sequences. For encoding the diffusion process, mainly mono- or bi-polar diffusion gradients in a spin-echo sequence type were used. Only few studies have been conducted in skeletal muscle using a stimulated-echo sequence type. There are also several challenges to cope with when applying DWI to skeletal muscle: in order to get reproducible and reliable diffusion parameters, a robust fat suppression needs to be achieved. While most available techniques (spectral selective fat suppression, inversion recovery based fat suppression) suppress efficiently the main fat peak, the olefinic fat peak close to the water peak contributes to disturbing artefacts in DWI. Furthermore, DWI lacks a high signal-to-noise ratio due to the fat suppression method, the application of diffusion-sensitizing gradients, and relatively long echo times (TE) compared to the short T2 relaxation time of muscle water protons. Many of the DWI sequence parameters have an important influence on the results, which has led to a wide range of reported values of the different DWIparameters.
Despite these technical particularities, potentially interesting quantitative parameters from DWI might emerge as new outcome measurements in skeletal muscle pathology, as many of these parameters correlate to structural muscle properties not accessible using other NMR techniques. Apparent diffusion coefficient, fractional anisotropy, and directions of the main eigenvector can be calculated in a straight forward manner from the diffusion tensor on a voxel-by-voxel basis, and have been reported in several studies in lower and upper extremities and trunk [86, 215, 278]. Especially the assessment of muscle fiber orientation using diffusion tensor imaging has been reported to correlate well with the expected muscle architecture [47, 86, 128]. Using more elaborate mathematical models to predict the diffusion process assessed by NMR muscle fiber size and diffusion properties of boundaries have been evaluated as well [222, 223]. The robustness of DWI parameters in skeletal muscle has also been addressed recently by optimizing DWI sequence parameters and post-processing procedures for more reliable repeat measurements and DWI parameter calculation [87, 89, 100] Depending on the diffusion encoding scheme, parameters correlating with perfusion and microvasculature in skeletal muscle can be assessed as well [78, 129].
While most studies of DWI in skeletal muscle were conducted in healthy volunteers, DWI has also been applied in few muscle pathologies [200, 203, 222, 223, 285] to assess DWI derived quantitative parameters as biomarkers or outcome measures. The apparent diffusion coefficient has repeatedly been shown to be elevated in inflammatory myopathies, with inconsistent results on the fractional anisotropy [1, 88]. However, longitudinal assessment of disease activity and treatment response have not been reported yet. In a study of Duchenne muscular dystrophy, DWI parameters correlated with clinical and other NMR biomarkers of disease severity [200], however, no clear additional value of the DWI parameters over the other NMR biomarkers were reported, nor a longitudinal assessment in respect to disease progression. The changes in diffusion coefficient and in fractional anisotropy in the Duchenne patients reflected mainly the degree of fatty infiltration. In another recent study, also in Duchenne boys, where the effects of fat and signal-to-noise were taken into account, this time, an increase in diffusion coefficient and in the eigenvalue, λ3, was revealed but only in the tibialis anterior [115]. In a murine model of muscular dystrophy, genetic treatment effects have been monitored by multi-parametric NMR, including DWI parameters [192]. However, the added value of DWI to other NMR parameters were not assessed in this study. In the opinion of the authors, a possible future application of DWI as biomarker or outcome measure seems to be promising in early stages of disease by addressing statistically the disturbance of normally ordered muscle fiber architecture.
Image texture
Image texture analysis is a research field on its own, a niche for specialists with little impact so far on muscle tissue characterization in diseases. Muscle fat fraction and T2 changes are sensitive biomarkers but very much non-specific in terms of the relation to the underlying disease or disease mechanism. It is conceivable that subtle patterns of signal intensity distribution in particular muscles contain additional information that the human eye cannot perceive and texture analysis algorithms might reveal.
In a dystrophic muscle, complex pathological mechanisms take place, which result in a progressive tissue disorganization. This loss of normal muscle structure seems to be reflected by an abnormal dispersion of muscle NMR signal intensities. Signal heterogeneity in a dystrophic muscle was first noticed in the hypertrophied and failing myocardium of a hamster model of gamma-sarcoglycanopathy [196]. Larger than normal muscle signal fluctuations revealed by an increased coefficient of variation may be viewed as a zero order texture anomaly, with a random spatial distribution. Similar observations were reported in the skeletal muscle of GRMD dogs [238] and of Duchenne boys [9, 262]. As mentioned earlier, they may at least in part reflect muscle fibrosis which is a significant component of the dystrophic muscle disorganization. To a much lesser extent, normal aging is associated to a small but significant increase in skeletal muscle signal heterogeneity [13], which suggests that this index may be a sensitive one. Interestingly, T2w imaging combined with simple texture analysis algorithms was able to discriminate muscle dystrophies linked to different gene mutations in mice models [163].
Muscle images of patients with centronuclear congenital myopathies seem to present a particular texture, already detected at visual inspection (R.Y Carlier, personal communication). A working group has been constituted within the European Cooperation in Science and Technology (COST) action MyoMRI (www.myo-mri.eu), with the specific objective of identifying abnormal patterns of texture that may possibly be present in dystrophic and congenital myopathies. Positive results have already been obtained with images of GRMD dogs [43, 149]. In this study it was shown that co-occurrence matrices are more effective descriptors of local texture in comparison to features based on momentums, run-length matrices or local anisotropy. Similar results could be found in other trials on NMR image texture analysis [29]. It should be noted that co-occurrence matrices are sensitive to the number and volume in voxels of samples. This aspect was quite an issue in the above-mentioned study. The added value of texture analysis to the characterization of skeletal muscles anomalies over time has to be determined.
An obstacle to the use of texture analysis in multi-center trials is the extreme dependency of the texture results on acquisition parameters and platform specificities. Let just mention the impact of the image spatial resolution on texture that will appear radically different depending on the voxel size: if too large, texture might simply be wiped out, if too small, noise level might obscure the underlying texture. Rigorous control and harmonization of acquisition parameters will be a requisite to any future use of texture analysis as an outcome measure.
RECENT TECHNICAL DEVELOPMENTS AND THEIR IMPACT ON THE USE OF NMR AS OUTCOME MEASURE
Muscle imaging, and NMR imaging in particular, is increasingly used as an outcome measure. It still constitutes a relatively young discipline certainly offering a great potential but with a need to grow, and this in several directions. Broadening the range of tools available to further characterize normal and diseased muscles is one of the priority and several of the main options were discussed in the previous paragraphs. Developing protocols dedicated to the investigation of specific muscles, in particular targets located deep in tissues, will also gain importance. Very little has yet been proposed to evaluate diaphragm structure and composition in vivo [237]. Anatomical conformation as well as respiratory motion make diaphragm investigation challenging but its functional role and implication in numerous diseases justify efforts [173]. Another example among many others is the cell therapy for oculo-pharyngeal muscular dystrophy patients [197], with an interest to perform high resolution imaging of laryngeal muscles injected with homologous myoblasts and monitor, if not directly the fate of the grafted cells, at least the possible impact on the degenerative changes progression.
The wealth of additional information on muscle structure and function that NMR will provide in future, and is already largely able to provide, and the multiple anatomical sites to investigate create a major problem, the time required to perform these advanced investigation. The issue is both economical, the examination cost, and practical and ethical, the patient compliance to scans lasting more than one hour. The latter is of course a major concern with pediatric patients. To minimize this problem, a great deal of efforts has been devoted and will continue 1/ to speed up image acquisitions, 2/ to collect several NMR variables, and potentially biomarkers, in one acquisition. The two approaches can in many instances be combined.
Faster acquisitions
To speed up acquisitions, parallel imaging makes uses of the spatial information captured by arrays of receiver coils to allow for a decrease in the number of line acquisitions, with a proportional reduction in acquisition time. Various schemes of parallel imaging have been proposed almost two decades ago [57, 97, 202], are frequently but yet not systematically implemented. More recently, but already one decade ago, a new concept was introduced, known as compressed sensing [60, 157]. The idea is to take advantage of either spatial or temporal redundancies in some representations of the underlying target, and of the incoherence of the artifacts created by non-regular sampling, in order to skip a large part of the acquisition matrix but still reconstruct images with a minimal loss in quality. Application to muscle Dixon imaging was recently demonstrated including in Becker patients with acceleration factors up to 6 as compared to standard imaging schemes [114, 156]. When combined with non-Cartesian acquisition, like radial sampling, acceleration factor of 10 and more can be obtained with almost no penalty on image quality [77].
More specifically about water T2 mapping, novel acquisitions which are based on steady-state free precession (SSFP) sequences, have been recently proposed [22, 51, 106]. One of these approaches is based on the partially spoiled steady state free precession technique proposed by Bieri et al. [22]. This method allows water-selective, fast 3D mapping of skeletal muscle T2 and it can reasonably easily be installed on commercial scanners [51]. A new fast T2 mapping method using triple echo steady state (TESS) was recently introduced to mitigate the intrinsic motion sensitivity that generally accompanies all unbalanced steady state methods, including T2-pSSFP [106]. TESS-T2 is not only free of the typical T1/T2 bias common to all mono-parametric steady state methods, but also shows a high insensitivity to B1-field inhomogeneities. Those novel methods are of course compatible with parallel imaging and compressed sensing.
Simultaneous acquisitions of variables
The concept of acquiring several NMR variables of interest in a single sequence is not a novel one [28, 71, 242]. It was perhaps pushed to its limit with the simultaneous collection of functional imaging, perfusion and oxygenation, and dynamic 1H and 31P spectroscopy of skeletal muscle [66]. This approach not only saved time but it allowed the combination of dynamic variables that would be illicit if these variables had been acquired separately, this due to far from perfect reproducibility of exercise bout repetitions. It was subsequently shown that muscle oxygen extraction can be derived from such multi-parametric functional NMR protocols [41]. Such multi-parametric tools identified abnormal perfusion to contribute to the decreased oxidative phosphorylation capacity in glycogenosis type III patients [264].
For muscle characterization, simultaneous multi-parametric mapping is a promising way to further accelerate quantitative evaluations. Our team has investigated the feasibility of fast (2 sec per imaging slice) multi-parametric inversion recovery balanced SSFP (IR-bSSFP) imaging, to track rapid physiological adaptations in skeletal muscle during stress or activation [52]. This sequence consists of an inversion pulse followed by the acquisition of several balanced SSFP images as the signal time course approaches the steady state [213]. T1, T2 and M0 (relative proton density) can then be obtained from a mono-exponential 3-parameter fit to the series of images. IR-bSSFP time course signal can be more accurately modeled by the Bloch Equations or by the EPG formalism to take into account instrumental errors (B1+ and B0 inhomogeneities, inversion efficiency, non-ideal slice profile) [105, 163, 266] and tissue composition (water/fat components).
Fat fraction and T2 maps are the two NMR imaging biomarkers that are the most mature and appear to be currently the most useful for muscle studies. Collecting in one sequence the information needed to generate both the fat fraction and the T2 maps will represent a major leap forward.
A method called IDEAL-CPMG that combines IDEAL algorithm with a Carr– Purcell– Meiboom– Gill– sequence was recently proposed [120]. The acquisition results in water and fat separated images at each echo time. It then uses exponential fitting of each signal decay for water T2 and fat T2 quantification. Fat fractions are derived from fat and water proton density images obtained using the IDEAL reconstruction method. Nevertheless, non-ideal RF pulse shape and RF field non-uniformity may lead to the generation of stimulated echoes and render T2 determination highly unreliable using simple exponential models. Moreover, the design of this pulse sequence imposes using higher readout bandwidth and consequently lowers the image signal to noise ratio.
Another approach to simultaneously measure water T2 and fat fraction is to use multi-component fitting of the standard MSME sequence by taking advantage of the differences in T1 and T2 relaxivities between fat and water protons. Exponential models can be used to describe the MSME signal decay like in the work of Azzabou et al. [14]. Our team recently proposed to use only the MSME sequence and EPG-based fitting to simultaneously extract both fat fraction and water T2 (Marty et al., NMR Biomed, in press). Validation of this solution against standard separate acquisitions is underway and will hopefully justify its implementation in protocols with a cut in acquisition time of approximately 50% .
CONCLUSIONS
Despite elevated costs, impossibility of bedside operation, technological complexity and sometimes challenging interpretation, NMR imaging and spectroscopy are progressively conquering a significant role as outcome measures for muscle studies. The role of imaging as an outcome measure in muscle studies may still be perceived as lagging behind as compared to the imaging contribution to the evaluation of other organs, like the brain. This situation is largely circumstantial, related to the lesser incidence of muscle disorders, the poor availability of scanners and the lack of therapeutic perspectives. The latter two obstacles are gradually being lifted. Parametric maps of muscle fat fraction and of muscle water T2 provide non-invasive and quantitative measures of skeletal muscle degenerative changes and of disease activity, respectively. They are by far the two NMR biomarkers that are the most widely used in muscle protocols. The perceived added value of such tissue characterization has, despite the limitations and constraints listed above, has prompted the progressive and now quasi systematic integration of NMR imaging as an outcome measure in new therapeutic trials. Current technical developments aim at shortening the sequence acquisitions and at collecting the fat fraction and T2 variables at once and will spectacularly reduce the examination time. Their implementation in multi-center trials can be expected in the next months and years and will significantly improve the NMR examination acceptance by the patients, in particular the pediatric ones. Alternatively, speeding up the acquisition of the fat fraction and T2 maps will free up time to include the determination of other biomarkers in clinical protocols, for instance, the phosphodiester level by 31P spectroscopy, muscle perfusion with arterial spin labeling and/or interstitial fibrosis with UTE sequences. The capability to investigate skeletal muscles, either superficially or profoundly located, and to characterize muscle anatomy, structure, biochemistry and function non-invasively and potentially simultaneously is unique to NMR. Thanks to the steady flow of technological innovation, these properties shall be more and more exploited even in a clinical context in the near future and will reinforce the role of NMR as an outcome measure in skeletal muscle clinical trials.
ACKNOWLEDGMENTS
This work was supported by the COST Action BM1304, “Applications of MR imaging and spectroscopy techniques in neuromuscular disease: collaboration on outcome measures and pattern recognition for diagnostics and therapy development” (http://myo-mri.eu/).
REFERENCES
[1] | Ai T , Yu K , Gao L , et al. Diffusion tensor imaging in evaluation of thigh muscles in patients with polymyositis and dermatomyositis. Br J Radiol. (2014) ;87: (1043):20140261. |
[2] | Alexander Matthew S , Kunkel , et al. Skeletal Muscle MicroRNAs: Their diagnostic and therapeutic potential in human muscle disease. J Neuromuscul Dis. (2015) ;2: :1–11. |
[3] | Alizai H , Nardo L , Karampinos DC , et al. Comparison of clinical semi-quantitative assessment of muscle fat infiltration with quantitative assessment using chemical shift-based water/fat separation in MR studies of the calf of post-menopausal women. Eur Radiol. (2012) ;22: :1592–600. |
[4] | Amthor H , Egelhof T , McKinnell I , et al. Albumin targeting of damaged muscle fibres in the mdx mouse can be monitored by MRI. Neuromuscul Disord. (2004) ;14: :791–6. |
[5] | Andreisek G , White LM , Sussman MS , et al. T2*-weighted and arterial spin labeling MRI of calf muscles in healthy volunteers and patients with chronic exertional compartment syndrome: Preliminary experience. Am J Roentgenol. (2009) ;193: :327–33. |
[6] | Araujo ECA , Fromes Y , Carlier PG . New Insights on Human Skeletal Muscle Tissue Compartments Revealed by In Vivo T2 NMR Relaxometry. Biophys J. (2014) ;106: :2267–74. |
[7] | Arechavala-Gomeza V , Anthony K , Morgan J , Muntoni F . Antisense oligonucleotide-mediated exon skipping for Duchenne muscular dystrophy: Progress and challenges. Curr Gene Ther. (2012) ;12: :152–60. |
[8] | Argov Z , Löfberg M , Arnold DL . Insights into muscle diseases gained by phosphorus magnetic resonance spectroscopy. Muscle Nerve. (2000) ;23: :1316–34. |
[9] | Arpan I , Forbes SC , Lott DJ , et al. T2 mapping provides multiple approaches for the characterization of muscle involvement in neuromuscular diseases: A cross-sectional study of lower leg muscles in 5-15-year-old boys with Duchenne muscular dystrophy. NMR Biomed. (2013) ;26: :320–8. |
[10] | Arpan I , Willcocks RJ , Forbes SC , et al. Examination of effects of corticosteroids on skeletal muscles of boys with DMD using MRI and MRS. Neurology. (2014) ;83: :974–80. |
[11] | Aschwanden M , Partovi S , Jacobi B , et al. Assessing the end-organ in peripheral arterial occlusive disease-from contrast-enhanced ultrasound to blood-oxygen-level-dependent MR imaging. Cardiovasc Diagn Ther. (2014) ;4: :165–72. |
[12] | Azzabou N , Carlier PG . Fat quantification and T2 measurement. Pediatr Radiol. (2014) ;44: :1620–1. |
[13] | Azzabou N , Hogrel J-Y , Carlier PG . NMR based biomarkers to study age-related changes in the human quadriceps. Exp Gerontol. (2015) a;70: :54–60. |
[14] | Azzabou N , Loureiro de Sousa P , Caldas E , Carlier PG . Validation of a generic approach to muscle water T2 determination at 3T in fat-infiltrated skeletal muscle. J Magn Reson Imaging. (2015) b;41: :645–53. |
[15] | Baligand C , Wary C , Ménard JC , et al. Measuring perfusion and bioenergetics simultaneously in mouse skeletal muscle: A multiparametric functional-NMR approach. NMR Biomed. (2011) ;24: :281–90. |
[16] | Barbiroli B , Funicello R , Ferlini A , et al. Muscle energy metabolism in female DMD/BMD carriers: A 31P-MR spectroscopy study. Muscle Nerve. (1992) a;15: :344–8. |
[17] | Barbiroli B , Funicello R , Iotti S , et al. 31P-NMR spectroscopy of skeletal muscle in Becker dystrophy and DMD/BMD carriers. Altered rate of phosphate transport. J Neurol Sci. (1992) b;109: :188–95. |
[18] | Barbiroli B , McCully KK , Iotti S , et al. Further impairment of muscle phosphate kinetics by lengthening exercise in DMD/BMD carriers. An in vivo 31P-NMR spectroscopy study. J Neurol Sci. (1993) ;119: :65–73. |
[19] | Barnouin Y , Butler-Browne G , Voit T , et al. Manual segmentation of individual muscles of the quadriceps femoris using MRI: A reappraisal. J Magn Reson Imaging. (2014) ;40: :239–47. |
[20] | Bertoldi D , Parzy E , Fromes Y , et al. New insight into abnormal muscle vasodilatory responses in aged hypertensive rats by in vivo nuclear magnetic resonance imaging of perfusion. J Vasc Res. (2006) ;43: :149–56. |
[21] | Bertoldi D , Loureiro de Sousa P , Fromes Y , et al. Quantitative, dynamic and non-invasive determination of skeletal muscle perfusion in mouse leg by NMR arterial spin-labeled imaging. Magn Reson Imaging. (2008) ;26: :1259–65. |
[22] | Bieri O , Scheffler K , Welsch GH , et al. Quantitative mapping of T2 using partial spoiling. Magn Reson Med. (2011) ;66: :410–8. |
[23] | Blat Y , Blat S . Drug discovery of therapies for duchenne muscular dystrophy. J Biomol Screen. (2015) ;10: :1189–203. Epub 2015 May 14. |
[24] | Bley TA , Wieben O , François CJ , et al. Fat and water magnetic resonance imaging. J Magn Reson Imaging. (2010) ;31: :4–18. |
[25] | Boesch C . Musculoskeletal spectroscopy. J Magn Reson Imaging. (2007) ;25: :321–38. |
[26] | Bonati U , Hafner P , Schädelin S , et al. Quantitative muscle MRI: A powerful surrogate outcome measure in Duchenne muscular dystrophy. Neuromuscul Disord. (2015) a;25: :679–85. |
[27] | Bonati U , Schmid M , Hafner P , et al. Longitudinal 2-point dixon muscle magnetic resonance imaging in becker muscular dystrophy. Muscle Nerve. (2015) b;51: :918–21. |
[28] | Brillault-Salvat C , Giacomini E , Jouvensal L , et al. Simultaneous determination of muscle perfusion and oxygenation by interleaved NMR plethysmography and deoxymyoglobin spectroscopy. NMR Biomed. (1997) ;10: :315–23. |
[29] | Brown AM , Nagala S , McLean MA , et al. Multi-institutional validation of a novel textural analysis tool for preoperative stratification of suspected thyroid tumors on diffusion-weighted MRI. Magn Reson Med. (2015) . doi: 10.1002/mrm.25743 |
[30] | Bryan WW , Reisch JS , McDonald G , et al. Magnetic resonance imaging of muscle in amyotrophic lateral sclerosis. Neurology. (1998) ;51: :110–3. |
[31] | Bryant ND , Li K , Does MD , et al. Multi-parametric MRI characterization of inflammation in murine skeletal muscle. NMR Biomed. (2014) ;27: :716–25. |
[32] | Bushby K , Finkel R , Wong B , et al. Ataluren treatment of patients with nonsense mutation dystrophinopathy. Muscle Nerve. (2014) ;50: :477–87. |
[33] | Buyse GM , Voit T , Schara U , et al. Efficacy of idebenone on respiratory function in patients with Duchenne muscular dystrophy not using glucocorticoids (DELOS): A double-blind randomised placebo-controlled phase 3 trial. Lancet. (2015) ;385: :1748–57. |
[34] | Caldas de A Araujo E , Azzabou N , Vignaud A , et al. Quantitative NMR imaging of the short-T2 components in the SKM tissue: Alterations observed in myopathic patients. In: ISMRM 23rd Annual Meeting & Exhibition. Toronto, Ontario, Canada, (2015) , p. 251. |
[35] | Caravan P , Das B , Dumas S , et al. Collagen-targeted MRI contrast agent for molecular imaging of fibrosis. Angew Chem Int Ed Engl. (2007) ;46: :8171–3. |
[36] | Caravan P , Yang Y , Zachariah R , et al. Molecular magnetic resonance imaging of pulmonary fibrosis in mice. Am J Respir Cell Mol Biol. (2013) ;49: :1120–6. |
[37] | Carlier PG . Global T2 versus water T2 in NMR imaging of fatty infiltrated muscles: Different methodology, different information and different implications. Neuromuscul Disord. (2014) ;24: :390–2. |
[38] | Carlier PG , Azzabou N , de Sousa PL , et al. P.14.4 Diagnostic role of quantitative NMR imaging exemplified by 3 cases of juvenile dermatomyositis. Neuromuscul Disord. (2013) ;23: :814. |
[39] | Carlier PG , Azzabou N , de Sousa PL , et al. Skeletal muscle quantitative nuclear magnetic resonance imaging follow-up of adult Pompe patients. J Inherit Metab Dis. (2015) ;38: :565–72. |
[40] | Carlier PG , Bertoldi D , Baligand C , et al. Muscle blood flow and oxygenation measured by NMR. NMR Biomed. (2006) ;19: :954–67. |
[41] | Carlier PG , Brillault-Salvat C , Giacomini E , et al. How to investigate oxygen supply, uptake, and utilization simultaneously by interleaved NMR imaging and spectroscopy of the skeletal muscle. Magn Reson Med. (2005) ;54: :1010–3. |
[42] | Carlier PG , Shukelovich A , Baudin PY , et al. Fast, precise, interactive segmentation of skeletal muscle NMR images. Neuromuscul Disord. (2014) ;24: :836–37. |
[43] | Certaines JD De , Larcher T , Duda D , et al. Application of texture analysis to muscle MRI: 1-What kind of information should be expected from texture analysis?. EPJ Nonlinear Biomed Phys. (2015) ;1-3: :1–14. |
[44] | Chance B , Younkin DP , Kelley R , et al. Magnetic resonance spectroscopy of normal and diseased muscles. Am J Med Genet. (1986) ;25: :659–79. |
[45] | Cirak S , Arechavala-Gomeza V , Guglieri M , et al. Exon skipping and dystrophin restoration in patients with Duchenne muscular dystrophy after systemic phosphorodiamidate morpholino oligomer treatment: An open-label, phase 2, dose-escalation study. Lancet. (2011) ;378: :595–605. |
[46] | Csapo R , Malis V , Sinha U , et al. Age-associated differences in triceps surae muscle composition and strength - an MRI-based cross-sectional comparison of contractile, adipose and connective tissue. BMC Musculoskelet Disord. (2014) ;15: :209. Epub 2014 Jun 17. |
[47] | Damon BM , Heemskerk AM , Ding Z . Polynomial fitting of DT-MRI fiber tracts allows accurate estimation of muscle architectural parameters. Magn Reson Imaging. (2012) ;30: :589–600. |
[48] | Damon BM , Wadington MC , Hornberger JL , Lansdown DA . Absolute and relative contributions of BOLD effects to the muscle functional MRI signal intensity time course: Effect of exercise intensity. Magn Reson Med. (2007) ;58: :335–45. |
[49] | Dass S , Suttie JJ , Piechnik SK , et al. Myocardial tissue characterization using magnetic resonance noncontrast T1 mapping in hypertrophic and dilated cardiomyopathy. Circ Cardiovasc Imaging. (2012) ;5: :726–33. |
[50] | de Jong S , Zwanenburg JJ , Visser F , et al. Direct detection of myocardial fibrosis by MRI. J Mol Cell Cardiol. (2011) ;51: :974–9. |
[51] | de Sousa PL , Vignaud A , Caldas de Almeida Araújo E , Carlier PG . Factors controlling T2 mapping from partially spoiled SSFP sequence: Optimization for skeletal muscle characterization. Magn Reson Med. (2012) ;67: :1379–90. |
[52] | de Sousa PL , Vignaud A , Fleury S , Carlier PG . Fast monitoring of T(1), T(2), and relative proton density (M(0)) changes in skeletal muscles using an IR-TrueFISP sequence. J Magn Reson Imaging. (2011) ;33: :921–30. |
[53] | Decorte N , Buehler T , Caldas de Almeida Araujo E , et al. Noninvasive estimation of oxygen consumption in human calf muscle through combined NMR measurements of ASL perfusion and T2 oxymetry. J Vasc Res. (2014) ;51: :360–8. |
[54] | Decostre V , Canal A , Ollivier G , et al. Wrist flexion and extension torques measured by highly sensitive dynamometer in healthy subjects from 5 to 80 years. BMC Musculoskelet Disord. (2015) ;16: :4. Epub 2015 Jan 31. |
[55] | Degardin A , Morillon D , Lacour A , et al. Morphologic imaging in muscular dystrophies and inflammatory myopathies. Skeletal Radiol. (2010) ;39: :1219–27. |
[56] | Desguerre I , Mayer M , Leturcq F , et al. Endomysial Fibrosis in Duchenne Muscular Dystrophy. J Neuropathol Exp Neurol. (2009) ;68: :762–73. |
[57] | Deshmane A , Gulani V , Griswold MA , Seiberlich N . Parallel MR imaging. J Magn Reson Imaging. (2012) ;36: :55–72. |
[58] | Detre JA , Wang J . Technical aspects and utility of fMRI using BOLD and ASL. Clin Neurophysiol. (2002) ;113: :621–34. |
[59] | Donahue KM , Van Kylen J , Guven S , et al. Simultaneous gradient-echo/spin-echo EPI of graded ischemia in human skeletal muscle. J Magn Reson Imaging. (1998) ;8: :1106–13. |
[60] | Donoho DL . Compressed sensing. IEEE Trans Inf Theory. (2006) )1289–1306. |
[61] | Dowling P , Holland Ashling , Ohlendieck K . Mass spectrometry-based identification of muscle-associated and muscle-derived proteomic biomarkers of dystrophinopathies. J Neuromuscul Dis. (2014) ;1: :15–40. |
[62] | Douglas AGL , Wood MJA . Splicing therapy for neuromuscular disease. Mol Cell Neurosci. (2013) ;56: :169–85. |
[63] | Drakonaki EE , Allen GM , Wilson DJ . Ultrasound elastography for musculoskeletal applications. Br J Radiol. (2012) ;85: :1435–45. |
[64] | Du J , Bydder M , Takahashi AM , et al. Short T2 contrast with three-dimensional ultrashort echo time imaging. Magn Reson Imaging. (2011) ;29: :470–82. |
[65] | Du J , Takahashi AM , Chung CB . Ultrashort TE spectroscopic imaging (UTESI): Application to the imaging of short T2 relaxation tissues in the musculoskeletal system. J Magn Reson Imaging. (2009) ;29: :412–21. |
[66] | Duteil S , Bourrilhon C , Raynaud JS , et al. Metabolic and vascular support for the role of myoglobin in humans: A multiparametric NMR study. Am J Physiol Regul Integr Comp Physiol. (2004) ;287: :R1441–9. |
[67] | Duteil S , Wary C , Raynaud JS , et al. Influence of vascular filling and perfusion on BOLD contrast during reactive hyperemia in human skeletal muscle. Magn Reson Med. (2006) ;55: :450–4. |
[68] | e Lima KMM , da Matta TT , de Oliveira LF . Reliability of the rectus femoris muscle cross-sectional area measurements by ultrasonography. Clin Physiol Funct Imaging. (2012) ;32: :221–6. |
[69] | Edwards RH , Dawson MJ , Wilkie DR , et al. Clinical use of nuclear magnetic resonance in the investigation of myopathy. Lancet. (1982) ;725–30. |
[70] | Edzes H , Samulski ET . The measurement of cross-relaxation effects in the proton NMR spin-lattice relaxation of water in biological systems: Hydrated collagen and muscle. J Magn Reson. (1978) ;31: :207–29. |
[71] | Eleff SM , Schnall MD , Ligetti L , et al. Concurrent measurements of cerebral blood flow, sodium, lactate, and high-energy phosphate metabolism using 19F, 23Na, 1H, and 31P nuclear magnetic resonance spectroscopy. Magn Reson Med. (1988) ;7: :412–24. |
[72] | Eliav U , Komlosh ME , Basser PJ , Navon G . Collagen composition and content-dependent contrast in porcine annulus fibrosus achieved by using double quantum and magnetization transfer filtered UTE MRI. Magn Reson Med. (2014) ;71: :388–93. |
[73] | Englund EK , Langham MC , Li C , et al. Combined measurement of perfusion, venous oxygen saturation, and skeletal muscle T2* during reactive hyperemia in the leg. J Cardiovasc Magn Reson. (2013) ;15: :70. |
[74] | Englund EK , Langham MC , Ratcliffe SJ , et al. Multiparametric assessment of vascular function in peripheral artery disease: Dynamic measurement of skeletal muscle perfusion, blood-oxygen-level dependent signal, and venous oxygen saturation. Circ Cardiovasc Imaging. (2015) . doi: 10.1161/CIRCIMAGING.114.002673 |
[75] | Ennen JP , Verma M , Asakura A . Vascular-targeted therapies for Duchenne muscular dystrophy. Skelet Muscle. (2013) ;3-9: :1–12. |
[76] | Erriquez D , Perini G , Ferlini A . Non-coding RNAs in muscle dystrophies. Int J Mol Sci. (2013) ;14: :19681–704. |
[77] | Feng L , Grimm R , Block KT , et al. Golden-angle radial sparse parallel MRI: Combination of compressed sensing, parallel imaging, and golden-angle radial sampling for fast and flexible dynamic volumetric MRI. Magn Reson Med. (2013) ;72: :707–17. |
[78] | Filli L , Boss A , Wurnig MC , et al. Dynamic intravoxel incoherent motion imaging of skeletal muscle at rest and after exercise. NMR Biomed. (2015) ;28: :240–6. |
[79] | Fischmann A , Hafner P , Fasler S , et al. Quantitative MRI can detect subclinical disease progression in muscular dystrophy. J Neurol. (2012) ;259: :1648–54. |
[80] | Fischmann A , Hafner P , Gloor M , et al. Quantitative MRI and loss of free ambulation in Duchenne muscular dystrophy. J Neurol. (2013) ;260: :969–74. |
[81] | Fischmann A , Morrow JM , Sinclair CDJ , et al. Improved anatomical reproducibility in quantitative lower-limb muscle MRI. J Magn Reson Imaging. (2014) ;39: :1033–8. |
[82] | Fleckenstein JL , Watumull D , Conner KE , et al. Denervated human skeletal muscle: MR imaging evaluation. Radiology. (1993) ;187: :213–8. |
[83] | Forbes SC , Willcocks RJ , Triplett WT , et al. Magnetic resonance imaging and spectroscopy assessment of lower extremity skeletal muscles in boys with Duchenne muscular dystrophy: A multicenter cross sectional study. PLoS One. (2014) ;9: :e106435. |
[84] | Friedman SD , Poliachik SL , Otto RK , et al. Longitudinal features of stir bright signal in FSHD. Muscle Nerve. (2014) ;49: :257–60. |
[85] | Friedrich MG . Myocardial T The Rise of a Novel Biomarker Continues*. JACC Cardiovasc Imaging. (2015) ;8: :47–9. |
[86] | Froeling M , Nederveen AJ , Heijtel DFR , et al. Diffusion-tensor MRI reveals the complex muscle architecture of the human forearm. J Magn Reson Imaging. (2012) ;36: :237–48. |
[87] | Froeling M , Nederveen AJ , Nicolay K , Strijkers GJ . DTI of human skeletal muscle: The effects of diffusion encoding parameters, signal-to-noise ratio and T2 on tensor indices and fiber tracts. NMR Biomed. (2013) ;26: :1339–52. |
[88] | Froeling M , Oudeman J , Strijkers GJ , et al. Muscle changes detected with diffusion-tensor imaging after long-distance running. Radiology. (2015) ;274: :548–62. |
[89] | Froeling M , Oudeman J , van den Berg S , et al. Reproducibility of diffusion tensor imaging in human forearm muscles at 3.0 T in a clinical setting. Magn Reson Med. (2010) ;64: :1182–90. |
[90] | Fuchs BC , Wang H , Yang Y , et al. Molecular MRI of collagen to diagnose and stage liver fibrosis. J Hepatol. (2013) ;59: :992–8. |
[91] | Gaeta M , Messina S , Mileto A , et al. Muscle fat-fraction and mapping in Duchenne muscular dystrophy: Evaluation of disease distribution and correlation with clinical assessments. Preliminary experience. Skeletal Radiol. (2012) ;41: :955–61. |
[92] | Garrood P , Hollingsworth KG , Eagle M , et al. MR imaging in Duchenne muscular dystrophy: Quantification of T1-weighted signal, contrast uptake, and the effects of exercise. J Magn Reson Imaging. (2009) ;30: :1130–8. |
[93] | Gineste C , De Winter JM , Kohl C , et al. In vivo and in vitro investigations of heterozygous nebulin knock-out mice disclose a mild skeletal muscle phenotype. Neuromuscul Disord. (2013) a;23: :357–69. |
[94] | Gineste C , Duhamel G , Le Fur Y , et al. Multimodal MRI and (31)P-MRS investigations of the ACTA1(Asp286Gly) mouse model of nemaline myopathy provide evidence of impaired in vivo muscle function, altered muscle structure and disturbed energy metabolism. PLoS One. (2013) b;8: :e72294. |
[95] | Gineste C , Le Fur Y , Vilmen C , et al. Combined MRI and 31P-MRS investigations of the ACTA1(H40Y) mouse model of nemaline myopathy show impaired muscle function and altered energy metabolism. PLoS One. (2013) c;8: :e61517. |
[96] | Glaser KJ , Manduca A , Ehman RL . Review of MR elastography applications and recent developments. J Magn Reson Imaging. (2012) ;36: :757–74. |
[97] | Griswold MA , Jakob PM , Heidemann RM , et al. Generalized autocalibrating partially parallel acquisitions (GRAPPA). Magn Reson Med. (2002) ;47: :1202–10. |
[98] | Grözinger G , Pohmann R , Schick F , et al. Perfusion measurements of the calf in patients with peripheral arterial occlusive disease before and after percutaneous transluminal angioplasty using MR arterial spin labeling. J Magn Reson Imaging. (2013) ;40: :980–7. |
[099] | Ha D-H , Choi S , Kang E-J , Park HT . Diffusion tensor imaging and T2 mapping in early denervated skeletal muscle in rats. J Magn Reson Imaging. (2015) ;42: :617–23. |
[100] | Heemskerk AM , Sinha TK , Wilson KJ , et al. Repeatability of DTI-based skeletal muscle fiber tracking. NMR Biomed. (2010) ;23: :294–303. |
[101] | Heemskerk AM , Strijkers GJ , Drost MR , et al. Skeletal muscle degeneration and regeneration after femoral artery ligation in mice: Monitoring with diffusion MR imaging. Radiology. (2007) ;243: :413–21. |
[102] | Heerschap A , Houtman C , in ’t Zandt HJ , et al. Introduction to in vivo 31P magnetic resonance spectroscopy of (human) skeletal muscle. Proc Nutr Soc. (1999) ;58: :861–70. |
[103] | Heier CR , Guerron AD , Korotcov A , et al. Non-invasive MRI and spectroscopy of mdx mice reveal temporal changes in dystrophic muscle imaging and in energy deficits. PLoS One. (2014) ;9: :e112477. |
[104] | Henkelman RM , Stanisz GJ , Graham SJ . Magnetization transfer in MRI: A review. NMR Biomed. (2001) ;14: :57–64. |
[105] | Hennig J , Weigel M , Scheffler K . Calculation of flip angles for echo trains with predefined amplitudes with the extended phase graph (EPG)-algorithm: Principles and applications to hyperecho and TRAPS sequences. (2004) ;49: :527–35. |
[106] | Heule R , Ganter C , Bieri O . Triple echo steady-state (TESS) relaxometry. Magn Reson Med. (2014) ;71: :230–7. |
[107] | Hiba B , Richard N , Hébert LJ , et al. Quantitative assessment of skeletal muscle degeneration in patients with myotonic dystrophy type 1 using MRI. J Magn Reson Imaging. (2012) ;35: :678–85. |
[108] | Hinojar R , Foote L , Arroyo Ucar E , et al. Native T1 in discrimination of acute and convalescent stages in patients with clinical diagnosis of myocarditis. JACC Cardiovasc Imaging. (2015) ;8: :37–46. |
[109] | Hogrel J-Y , Allenbach Y , Canal A , et al. Four-year longitudinal study of clinical and functional endpoints in sporadic inclusion body myositis: Implications for therapeutic trials. Neuromuscul Disord. (2014) ;24: :604–10. |
[110] | Hogrel J-Y , Barnouin Y , Azzabou N , et al. NMR imaging estimates of muscle volume and intramuscular fat infiltration in the thigh: Variations with muscle, gender, and age. Age. (2015) ;37: (3):9798. |
[111] | Hogrel JY , Wary C , Moraux A , et al. Longitudinal functional and NMR assessment of upper limbs in Duchenne muscular dystrophy. Neurology. (2016) : epub ahead of print. |
[112] | Hollingsworth KG , de Sousa PL , Straub V , Carlier PG . Towards harmonization of protocols for MRI outcome measures in skeletal muscle studies: Consensus recommendations from two TREAT-NMD NMR workshops, 2 May Stockholm, Sweden, 1-2 October Paris, France. Neuromuscul Disord. (2012) ;22: (Suppl 2):S54–67. |
[113] | Hollingsworth KG , Garrood P , Eagle M , et al. Magnetic resonance imaging in Duchenne muscular dystrophy: Longitudinal assessment of natural history over 18 months. Muscle Nerve. (2013) a;48: :586–8. |
[114] | Hollingsworth KG , Higgins DM , McCallum M , et al. Investigating the quantitative fidelity of prospectively undersampled chemical shift imaging in muscular dystrophy with compressed sensing and parallel imaging reconstruction. Magn Reson Med. (2013) b;72: :1016–19. |
[115] | Hooijmans MT , Damon BM , Froeling M , et al. Evaluation of skeletal muscle DTI in patients with duchenne muscular dystrophy. NMR Biomed. (2015) ;28: :1589–97. |
[116] | Horn M . 23Na magnetic resonance imaging for the determination of myocardial viability: The status and the challenges. Curr Vasc Pharmacol. (2004) ;2: :329–33. |
[117] | Hörster I , Weigt-Usinger K , Carmann C , et al. The L-arginine/NO pathway and homoarginine are altered in Duchenne muscular dystrophy and improved by glucocorticoids. Amino Acids. (2015) ;47: :1853–63. |
[118] | Hu HH , Börnert P , Hernando D , et al. ISMRM workshop on fat-water separation: Insights, applications and progress in MRI. Magn Reson Med. (2012) ;68: :378–88. |
[119] | Hu HH , Kan HE . Quantitative proton MR techniques for measuring fat. NMR Biomed. (2013) ;26: :1609–29. |
[120] | Hunter DJ , Zhang W , Conaghan PG , et al. Systematic review of the concurrent and predictive validity of MRI biomarkers in OA. Osteoarthr Cartil. (2011) ;19: :557–88. |
[121] | Jacobi B , Bongartz G , Partovi S , et al. Skeletal muscle BOLD MRI: From underlying physiological concepts to its usefulness in clinical conditions. J Magn Reson Imaging. (2012) ;35: :1253–65. |
[122] | Janiczek RL , Gambarota G , Sinclair CDJ , et al. Simultaneous T2 and lipid quantitation using IDEAL-CPMG. Magn Reson Med. (2011) a;66: :1293–302. |
[123] | Janssen BH , Voet NBM , Nabuurs CI , et al. Distinct disease phases in muscles of facioscapulohumera dystrophy patients identified by MR detected fat Infiltration. PLoS One. (2014) ;9: :e85416. |
[124] | Jordan BF , Kimpalou JZ , Beghein N , et al. Contribution of oxygenation to BOLD contrast in exercising muscle. Magn Reson Med. (2004) ;52: :391–6. |
[125] | Jovicich J , Marizzoni M , Sala-Llonch R , et al. Brain morphometry reproducibility in multi-center 3T MRI studies: A comparison of cross-sectional and longitudinal segmentations. Neuroimage. (2013) ;83: :472–84. |
[126] | Kamath S , Venkatanarasimha N , Walsh MA , Hughes PM . MRI appearance of muscle denervation. Skeletal Radiol. (2008) ;37: :397–404. |
[127] | Karampinos DC , Baum T , Nardo L , et al. Characterization of the regional distribution of skeletal muscle adipose tissue in type 2 diabetes using chemical shift-based water/fat separation. J Magn Reson Imaging. (2012) ;35: :899–907. |
[128] | Karampinos DC , King KF , Sutton BP , Georgiadis JG . Myofiber ellipticity as an explanation for transverse asymmetry of skeletal muscle diffusion MRI in vivo signal. Ann Biomed Eng. (2009) ;37: :2532–46. |
[129] | Karampinos DC , King KF , Sutton BP , Georgiadis JG . Intravoxel partially coherent motion technique: Characterization of the anisotropy of skeletal muscle microvasculature. J Magn Reson Imaging. (2010) ;31: :942–53. |
[130] | Karlsson A , Rosander J , Romu T , et al. Automatic and quantitative assessment of regional muscle volume by multi-atlas segmentation using whole-body water-fat MRI. J Magn Reson Imaging. (2015) ;41: :1558–69. |
[131] | Kemp GJ , Meyerspeer M , Moser E . Review Article Absolute quantification of phosphorus metabolite concentrations in human muscle in vivo by 31 PMRS: A quantitative review. NMR Biomed. (2007) ;20: :555–65. |
[132] | Kemp GJ , Taylor DJ , Dunn JF , et al. Cellular energetics of dystrophic muscle. J Neurol Sci. (1993) ;116: :201–6. |
[133] | Kharraz Y , Guerra J , Pessina P , et al. Understanding the process of fibrosis in Duchenne muscular dystrophy. BioMed Res Int. (2014) . doi: 10.1155/2014/965631 |
[134] | Kim HK , Laor T , Horn PS , et al. T2 mapping in Duchenne muscular dystrophy: Distribution of disease activity and correlation with clinical assessments. Radiology. (2010) ;255: :899–908. |
[135] | Kim HK , Serai S , Lindquist D , et al. Quantitative Skeletal Muscle MRI: Part 2, MR Spectroscopy and T2 Relaxation Time Mapping-Comparison Between Boys With Duchenne Muscular Dystrophy and Healthy Boys. Amer J of Roentgenol. (2015) ;205: :216–23. |
[136] | Kim HK , Serai S , Merrow AC , et al. Objective measurement of minimal fat in normal skeletal muscles of healthy children using T2 relaxation time mapping (T2 maps) and MR spectroscopy. Pediatr Radiol. (2014) ;44: :149–57. |
[137] | Klingler W , Jurkat-Rott K , Lehmann-Horn F , Schleip R . The role of fibrosis in Duchenne muscular dystrophy. Acta Myol. (2012) ;31: :184–95. |
[138] | Kornegay JN , Bogan JR , Bogan DJ , et al. Canine models of Duchenne muscular dystrophy and their use in therapeutic strategies. Mamm Genome. (2012) ;23: :85–108. |
[139] | Kusmia S , Eliav U , Navon G , Guillot G . DQF-MT MRI of connective tissues: Application to tendon and muscle. Magma. (2013) ;26: :203–14. |
[140] | Lamminen AE . Magnetic resonance imaging of primary skeletal muscle diseases: Patterns of distribution and severity of involvement. Br J Radiol. (1990) ;63: :946–50. |
[141] | Lavini C , de Jonge MC , van de Sande MGH , et al. Pixel-by-pixel analysis of DCE MRI curve patterns and an illustration of its application to the imaging of the musculoskeletal system. Magn Reson Imaging. (2007) ;25: :604–12. |
[142] | Le Guiner C , Montus M , Servais L , et al. Forelimb treatment in a large cohort of dystrophic dogs supports delivery of a recombinant AAV for exon skipping in Duchenne patients. Mol Ther. (2014) ;22: :1923–35. |
[143] | Lebel RM , Wilman AH . Transverse relaxometry with stimulated echo compensation. Magn Reson Med. (2010) ;64: :1005–14. |
[144] | Lebon V , Brillault-Salvat C , Bloch G , et al. Evidence of muscle BOLD effect revealed by simultaneous interleaved gradient-echo NMRI and myoglobin NMRS during leg ischemia. Magn Reson Med. (1998) ;40: :551–8. |
[145] | Ledermann H-P , Schulte A-C , Heidecker H-G , et al. Blood oxygenation level-dependent magnetic resonance imaging of the skeletal muscle in patients with peripheral arterial occlusive disease. Circulation. (2006) ;113: :2929–35. |
[146] | Lee YH , Lee HS , Lee HE , et al. Whole-body muscle MRI in patients with hyperkalemic periodic paralysis carrying the SCN4A mutation T704M: Evidence for chronic progressive myopathy with selective muscle involvement. J Clin Neurol. (2015) ;11: :331–8. |
[147] | Leong KM , Lau P , Ramadan S . Utilisation of MR spectroscopy and diffusion weighted imaging in predicting and monitoring of breast cancer response to chemotherapy. J Med Imaging Radiat Oncol. (2015) ;59: :268–77. |
[148] | Leroy-Willig A , Willig TN , Henry-Feugeas MC , et al. Body composition determined with MR in patients with Duchenne muscular dystrophy, spinal muscular atrophy, and normal subjects. Magn Reson Imaging. (1997) ;15: :737–44. |
[149] | Lerski RA , de Certaines JD , Duda D , et al. Application of texture analysis to muscle MRI: 2 – technical recommendations. EPJ Nonlinear Biomed Phys. (2015) ;3: :1–20. |
[150] | Li C , Magland JF , Rad HS , et al. Comparison of optimized soft-tissue suppression schemes for ultrashort echo time MRI. Magn Reson Med. (2012) ;68: :680–9. |
[151] | Li K , Dortch RD , Kroop SF , et al. A rapid approach for quantitative magnetization transfer imaging in thigh muscles using the pulsed saturation method. Magn Reson Imaging. (2015) ;33: :709–17. |
[152] | Li K , Dortch RD , Welch EB , et al. Multi-parametric MRI characterization of healthy human thigh muscles at 3.0 T - relaxation, magnetization transfer, fat/water, and diffusion tensor imaging. NMR Biomed. (2014) ;27: :1070–84. |
[153] | Liu G-C , Jong Y-J , Chiang C-H , Jaw T-S . Duchenne muscular Dystrophy: MR grading system with functional correlation. Radiology. (1993) ;186: :475–80. |
[154] | Lodi R , Kemp GJ , Muntoni F , et al. Reduced cytosolic acidification during exercise suggests defective glycolytic activity in skeletal muscle of patients with Becker muscular dystrophy. An in vivo 31P magnetic resonance spectroscopy study. Brain. (1999) ;122: :121–30. |
[155] | Longo R , Pollesello P , Ricci C , et al. Proton MR spectroscopy in quantitative in vivo determination of fat content in human liver steatosis. J Magn Reson Imaging. (1995) ;5: :281–85. |
[156] | Loughran T , Higgins DM , McCallum M , et al. Improving highly accelerated fat fraction measurements for clinical trials in muscular dystrophy: Origin and quantitative effect of R2* changes. Radiology. (2015) ;275: :570–78. |
[157] | Lustig M , Donoho DL , Santos JM , Pauly JM . Compressed sensing MRI. IEEE Signal Processing Magazine. (2008) ;25: :72–85. |
[158] | Lynn S , Aartsma-Rus A , Bushby K , et al. Measuring clinical effectiveness of medicinal products for the treatment of Duchenne muscular dystrophy. Neuromuscul Disord. (2015) ;25: :96–105. |
[159] | Ma J . Dixon techniques for water and fat imaging. J Magn Reson Imaging. (2008) ;28: :543–58. |
[160] | Madelin G , Regatte RR . Biomedical applications of sodium MRI in vivo . J Magn Reson Imaging. (2013) ;38: :511–29. |
[161] | Maillard SM , Jones R , Owens C , et al. Quantitative assessment of MRI T2 relaxation time of thigh muscles in juvenile dermatomyositis. Rheumatology (Oxford). (2004) ;43: :603–8. |
[162] | Martins Bach A , Matot B , Wary C , et al. Non-invasive NMR study of the mouse model for centronuclear myopathy with mutation in the dynamin-2 gene. Neuromuscul Disord. (2015) ;25: :275. |
[163] | Martins-Bach AB , Malheiros J , Matot B , et al. Quantitative T2 combined with texture analysis of nuclear magnetic resonance images identify different degrees of muscle involvement in three mouse models of muscle dystrophy: mdx, Largemyd and mdx/Largemyd. PLoS One. (2015) ;10: :e0117835. |
[164] | Marty B , Vignaud A , Greiser A , et al. BLOCH equations-based reconstruction of myocardium t1 maps from modified look-locker inversion recovery sequence. PLoS One. (2015) ;10: :e0126766. |
[165] | Mathur S , Vohra RS , Germain SA , et al. Changes in muscle T2 and tissue damage after downhill running in mdx mice. Muscle Nerve. (2011) ;43: :878–86. |
[166] | Mattei JP , Le Fur Y , Cuge N , et al. Segmentation of fascias, fat and muscle from magnetic resonance images in humans: The DISPIMAG software. Magn Reson Mater Physics, Biol Med. (2006) ;19: :275–9. |
[167] | Mayhew A , Mazzone ES , Eagle M , et al. Development of the Performance of the Upper Limb module for Duchenne muscular dystrophy. Dev Med Child Neurol. (2013) ;55: :1038–45. |
[168] | Mazzone E , De Sanctis R , Fanelli L , et al. Hammersmith functional motor scale and motor function measure-20 in non ambulant SMA patients. Neuromuscul Disord. (2014) ;24: :347–52. |
[169] | Mazzone ES , Vasco G , Palermo C , et al. A critical review of functional assessment tools for upper limbs in Duchenne muscular dystrophy. Dev Med Child Neurol. (2012) ;54: :879–85. |
[170] | McCullough MB , Domire ZJ , Reed AM , et al. Evaluation of muscles affected by myositis using magnetic resonance elastography. Muscle Nerve. (2011) ;43: :585–90. |
[171] | McDonald CM , Henricson EK , Abresch RT , et al. The 6-minute walk test and other clinical endpoints in duchenne muscular dystrophy: Reliability, concurrent validity, and minimal clinically important differences from a multicenter study. Muscle Nerve. (2013) ;48: :357–68. |
[172] | McIntosh LM , Baker RE , Anderson JE . Magnetic resonance imaging of regenerating and dystrophic mouse muscle. Biochem Cell Biol. (1998) ;76: :532–41. |
[173] | Mead AF , Petrov M , Malik AS , et al. Diaphragm remodeling and compensatory respiratory mechanics in a canine model of Duchenne muscular dystrophy. J Appl Physiol. (2014) ;116: :807–15. |
[174] | Mercuri E , Muntoni F . Muscular dystrophy: New challenges and review of the current clinical trials. Curr Opin Pediatr. (2013) ;25: :701–7. |
[175] | Meyer RA , Towse TF , Reid RW , et al. BOLD MRI mapping of transient hyperemia in skeletal muscle after single contractions. NMR Biomed. (2004) ;17: :392–8. |
[176] | Miller CA , Naish JH , Bishop P , et al. Comprehensive validation of cardiovascular magnetic extracellular volume. Circ Cardiovasc Imaging. (2013) ;6: :373–83. |
[177] | Mills KL , Tamnes CK . Methods and considerations for longitudinal structural brain imaging analysis across development. Dev Cogn Neurosci. (2014) ;9: :172–90. |
[178] | Mitsiopoulos N , Baumgartner RN , Heymsfield SB , et al. Cadaver validation of skeletal muscle measurement by magnetic resonance imaging and computerized tomography. J Appl Physiol. (1998) ;85: :115–22. |
[179] | Moon JC , Messroghli DR , Kellman P , et al. Myocardial T1 mapping and extracellular volume quantification: A Society for Cardiovascular Magnetic Resonance (SCMR) and CMR Working Group of the European Society of Cardiology consensus statement. J Cardiovasc Magn Reson. (2013) ;15: :92–103. |
[180] | Morrison C , Henkelman RM . A model for magnetization transfer in tissues. Magn Reson Med. (1995) ;33: :475–82. |
[181] | Morrow JM , Sinclair CDJ , Fischmann A , et al. MRI biomarker assessment of neuromuscular disease progression: A prospective observational cohort study. Lancet Neurol. (2015) ;4422: :1–13. |
[182] | Morrow JM , Sinclair CDJ , Fischmann A , et al. Reproducibility, and age, body-weight and gender dependency of candidate skeletal muscle MRI outcome measures in healthy volunteers. Eur Radiol. (2014) ;24: :1610–20. |
[183] | Morse CI , Degens H , Jones DA . The validity of estimating quadriceps volume from single MRI cross-sections in young men. Eur J Appl Physiol. (2007) ;100: :267–74. |
[184] | Muntoni F , Wood MJA . Targeting RNA to treat neuromuscular disease. Nat Rev Drug Discov. (2011) ;10: :621–37. |
[185] | Nardo L , Karampinos DC , Lansdown DA , et al. Quantitative assessment of fat infiltration in the rotator cuff muscles using water-fat MRI. J Magn Reson Imaging. (2014) ;39: :1178–85. |
[186] | Nelson MD , Rader F , Tang X , et al. PDE5 inhibition alleviates functional muscle ischemia in boys with Duchenne muscular dystrophy. Neurology. (2014) ;82: :2085–91. |
[187] | Newman RJ , Bore PJ , Chan L , et al. Nuclear magnetic resonance studies of forearm muscle in Duchenne dystrophy. Br Med J (Clin Res Ed). (1982) ;284: :1072–74. |
[188] | Nozaki T , Tasaki A , Horiuchi S , et al. Quantification of fatty degeneration within the supraspinatus muscle by using a 2-point dixon method on 3-T MRI. Amer J Roentgenol. (2015) ;205: :116–22. |
[189] | Ogawa S , Lee TM , Kay AR , Tank DW . Brain magnetic resonance imaging with contrast dependent on blood oxygenation. Proc Natl Acad Sci U S A. (1990) ;87: :9868–72. |
[190] | Pacak CA , Walter GA , Gaidosh G , et al. Long-term skeletal muscle protection after gene transfer in a mouse model of LGMD-2D. Mol Ther. (2007) ;15: :1775–81. |
[191] | Pane M , Mazzone ES , Sormani MP , et al. 6 Minute walk test in Duchenne MD patients with different mutations: 12 month changes. PLoS One. (2014) ;9: :e83400. |
[192] | Park J , Wicki J , Knoblaugh SE , et al. Multi-parametric MRI at 14T for muscular dystrophy mice treated with AAV vector-mediated gene therapy. PLoS One. (2015) ;10: :e0124914. |
[193] | Park JH , Vansant JP , Kumar NG , et al. Dermatomyositis: Correlative MR imaging and P-31 MR spectroscopy for quantitative characterization of inflammatory disease. Radiology. (1990) ;177: :473–9. |
[194] | Partovi S , Schulte A-C , Aschwanden M , et al. Impaired skeletal muscle microcirculation in systemic sclerosis. Arthritis Res Ther. (2012) ;14: :R209. |
[195] | Partovi S , von Tengg-Kobligk H , Bhojwani N , et al. Advanced noncontrast MR imaging in musculoskeletal radiology. Radiol Clin North Am. (2015) ;53: :549–67. |
[196] | Parzy E , Fromes Y , Thiaudiere E , Carlier PG . Rapid communication refinement of cardiac NMR imaging in awake hamsters: Proof of feasibility and characterization of cardiomyopathy. NMR Biomed. (2007) ;20: :615–23. |
[197] | Périé S , Trollet C , Mouly V , et al. Autologous myoblast transplantation for oculopharyngeal muscular dystrophy: A phase I/IIa clinical study. Mol Ther. (2014) ;22: :219–25. |
[198] | Pichiecchio A , Uggetti C , Egitto MG , et al. Quantitative MR evaluation of body composition in patients with Duchenne muscular dystrophy. Eur Radiol. (2002) ;12: :2704–9. |
[199] | Polak JF , Jolesz FA , Adams DF . Magnetic resonance imaging of skeletal muscle. Prolongation of T1 and T2 subsequent to denervation. Invest Radiol. (1988) ;23: :365–9. |
[200] | Ponrartana S , Ramos-Platt L , Wren TAL , et al. Effectiveness of diffusion tensor imaging in assessing disease severity in Duchenne muscular dystrophy: Preliminary study. Pediatr Radiol. (2015) ;45: :582–9. |
[201] | Pratt SJ , Xu S , Mullins RJ , Lovering RM . Temporal changes in magnetic resonance imaging in the mdx mouse. BMC Res Notes. (2013) ;6: :262. |
[202] | Pruessmann KP , Weiger M , Scheidegger MB , Boesiger P . SENSE: Sensitivity encoding for fast MRI. Magn Reson Med. (1999) ;42: :952–62. |
[203] | Qi J , Olsen NJ , Price RR , et al. Diffusion-weighted imaging of inflammatory myopathies: Polymyositis and dermatomyositis. J Magn Reson Imaging. (2008) ;27: :212–7. |
[204] | Ravaglia S , Pichiecchio A , Ponzio M , et al. Changes in skeletal muscle qualities during enzyme replacement therapy in late-onset type II glycogenosis: Temporal and spatial pattern of mass vs. strength response. J Inherit Metab Dis. (2010) ;33: :737–45. |
[205] | Raynaud JS , Duteil S , Vaughan JT , et al. Determination of skeletal muscle perfusion using arterial spin labeling NMRI: Validation by comparison with venous occlusion plethysmography. Magn Reson Med. (2001) ;46: :305–11. |
[206] | Redmond OM , Stack JP , O’Connor NG , et al. 31P MRS as an early prognostic indicator of patient response to chemotherapy. Magn Reson Med. (1992) ;25: :30–44. |
[207] | Ringleb SI , Bensamoun SF , Chen Q , et al. Applications of magnetic resonance elastography to healthy and pathologic skeletal muscle. J Magn Reson Imaging. (2007) ;25: :301–9. |
[208] | Robson MD , Bydder GM . Clinical ultrashort echo time imaging of bone and other connective tissues. NMR Biomed. (2006) ;19: :765–80. |
[209] | Rooney WD , Pollaro JR , Forbes SC , et al. Application of the Extended Phas e Graph Technique to Improve T2 Quantitation Across Sites. (2011) . In: Proceedings ISMRM 5419. |
[210] | Saab G , Thompson RT , Marsh GD . Effects of exercise on muscle transverse relaxation determined by MR imaging and in vivo relaxometry. J Appl Physiol. (2000) ;88: :226–33. |
[211] | Saab G , Thompson RT , Marsh GD . Multicomponent T 2 relaxation of in vivo skeletal muscle. Magn Reson Med. (1999) ;157: :150–7. |
[212] | Schewzow K , Fiedler GB , Meyerspeer M , et al. Dynamic ASL and T2*-weighted MRI in exercising calf muscle at 7 T: A feasibility study. Magn Reson Med. (2014) ;73: :1190–5. |
[213] | Schmitt P , Griswold MA , Jakob PM , et al. Inversion recovery TrueFISP: Quantification of T(1), T(2), and spin density. Magn Reson Med. (2004) ;51: :661–7. |
[214] | Schwenzer NF , Martirosian P , Machann J , et al. Aging effects on human calf muscle properties assessed by MRI at 3 Tesla. J Magn Reson Imaging. (2009) a;29: :1346–54. |
[215] | Schwenzer NF , Steidle G , Martirosian P , et al. Diffusion tensor imaging of the human calf muscle: Distinct changes in fractional anisotropy and mean diffusion due to passive muscle shortening and stretching. NMR Biomed. (2009) b;22: :1047–53. |
[216] | Scott E , Eagle M , Mayhew A , et al. Development of a functional assessment scale for ambulatory boys with Duchenne muscular dystrophy. Physiother Res Int. (2012) ;17: :101–9. |
[217] | Scotter EL , Shaw CE . Neuromuscular disease: New insights and avenues for therapy. Lancet Neurol. (2013) ;12: :13–5. |
[218] | Seferian AM , Moraux A , Annoussamy M , et al. Upper limb strength and function changes during a one-year follow-up in non-ambulant patients with Duchenne Muscular Dystrophy: An observational multicenter trial. PLoS One. (2015) a;10: :e0113999. |
[219] | Seferian AM , Moraux A , Canal A , et al. Upper limb evaluation and one-year follow up of non-ambulant patients with spinal muscular atrophy: An observational multicenter trial. PLoS One. (2015) b;10: :e0121799. |
[220] | Servais L , Deconinck N , Moraux A , et al. Innovative methods to assess upper limb strength and function in non-ambulant Duchenne patients. Neuromuscul Disord. (2013) ;23: :139–48. |
[221] | Shin HJ , Baek H-M , Ahn J-H , et al. Prediction of pathologic response to neoadjuvant chemotherapy in patients with breast cancer using diffusion-weighted imaging and MRS. NMR Biomed. (2012) ;25: :1349–59. |
[222] | Sigmund EE , Novikov DS , Sui D , et al. Time-dependent diffusion in skeletal muscle with the random permeable barrier model (RPBM): Application to normal controls and chronic exertional compartment syndrome patients. NMR Biomed. (2014) ;27: :519–28. |
[223] | Sigmund EE , Sui D , Ukpebor O , et al. Stimulated echo diffusion tensor imaging and SPAIR T2 -weighted imaging in chronic exertional compartment syndrome of the lower leg muscles. J Magn Reson Imaging. (2013) ;38: :1073–82. |
[224] | Sinclair CDJ , Morrow JM , Miranda MA , et al. Skeletal muscle MRI magnetisation transfer ratio reflects clinical severity in peripheral neuropathies. J Neurol Neurosurg Psychiatry. (2012) ;83: :29–32. |
[225] | Sinclair CDJ , Samson RS , Thomas DL , et al. Quantitative magnetization transfer in in vivo healthy human skeletal muscle at 3 T. Magn Reson Med. (2010) ;64: :1739–48. |
[226] | Siu AG , Ramadeen A , Hu X , et al. Characterization of the ultrashort-TE (UTE) MR collagen signal. NMR Biomed. (2015) ;28: :1236–44. |
[227] | Smeulders MJC , van den Berg S , Oudeman J , et al. Reliability of in vivo determination of forearm muscle volume using 3.0 T magnetic resonance imaging. J Magn Reson Imaging. (2010) ;31: :1252–5. |
[228] | Sproule DM , Montgomery MJ , Punyanitya M , et al. Thigh muscle volume measured by magnetic resonance imaging is stable over a 6-month interval in spinal muscular atrophy. J Child Neurol. (2011) ;26: :1252–9. |
[229] | Statland J , Donlin-Smith CM , Tapscott SJ , Van der Maarel S , Tawil R . Multiplex screen of serum biomarkers in facioscapulohumeral muscular mystrophy. J Neuromuscul Dis. (2014) ;1: :181–90. |
[230] | Stejskal EO , Tanner JE . Spin diffusion measurements: Spin echoes in the presence of a time-dependant field gradient. J Chem Phys. (1965) ;42: :288–92. |
[231] | Strandberg S , Wretling M-L , Wredmark T , Shalabi A . Reliability of computed tomography measurements in assessment of thigh muscle cross-sectional area and attenuation. BMC Med Imaging. (2010) ;10: :18. |
[232] | Straub V , Donahue KM , Allamand V , et al. Contrast agent-enhanced magnetic resonance imaging of skeletal muscle damage in animal models of muscular dystrophy. Magn Reson Med. (2000) ;44: :655–9. |
[233] | Strimbu K , Tavel JA . What are biomarkers? Curr Opin HIV AIDS. (2010) ;5: :463–6. |
[234] | Tanaka NI , Kanehisa H . Applicability of single muscle CSA for predicting segmental muscle volume in young men. Int J Sports Med. (2014) ;35: :608–14. |
[235] | Tardif-de Géry S , Vilquin J , Carlier P , et al. Muscular transverse relaxation time measurement by magnetic resonance imaging at 4 Tesla in normal and dystrophic dy/dy and dy(2j)/dy(2j) mice. Neuromuscul Disord. (2000) ;10: :507–13. |
[236] | Tasca G , Pescatori M , Monforte M , et al. Different molecular signatures in magnetic resonance imaging-staged facioscapulohumeral muscular dystrophy muscles. PLoS One. (2012) ;7: :e38779. |
[237] | Thibaud J , Matot B , Barthélémy I , et al. Diaphragm structural abnormalities revealed by NMR imaging in the dystrophic dog. Neuromuscul Disord. (2013) ;23: :809–10. |
[238] | Thibaud J-L , Azzabou N , Barthelemy I , et al. Comprehensive longitudinal characterization of canine muscular dystrophy by serial NMR imaging of GRMD dogs. Neuromuscul Disord. (2012) ;22: (Suppl 2):85–99. |
[239] | Thibaud J-L , Monnet A , Bertoldi D , et al. Characterization of dystrophic muscle in golden retriever muscular dystrophy dogs by nuclear magnetic resonance imaging. Neuromuscul Disord. (2007) ;17: :575–84. |
[240] | Thomas GD . Functional muscle ischemia in Duchenne and Becker muscular dystrophy. Front Physiol. (2013) ;4: :381–6. |
[241] | Thomas MS , Newman D , Leinhard OD , et al. Test-retest reliability of automated whole body and compartmental muscle volume measurements on a wide bore 3T MR system. Eur Radiol. (2014) ;24: :2279–91. |
[242] | Thulborn K , Soffe N , Kadda G . Simultaneous in vivo measurement of oxygen utilization and high-energy phosphate metabolism in rabbit skeletal muscle by multinuclear 1H and 31P NMR.; J Magn Reson. (1981) ;45: :362–66. |
[243] | Tofts PS . Modeling tracer kinetics in dynamic Gd-DTPA MR imaging. J Magn Reson Imaging. (1997) ;7: :91–101. |
[244] | Tofts PS . Quantitative MRI of the brain: Measuring changes caused by disease. John Wiley, (2003) . |
[245] | Tofts PS , Brix G , Buckley DL , et al. Contrast-wnhanced T 1 -weighted MRI of a diffusable tracer: Standardized quantities and symbols. J Magn Reson Imaging. (1999) ;232: :223–32. |
[246] | Torriani M , Townsend E , Thomas BJ , et al. Lower leg muscle involvement in Duchenne muscular dystrophy: An MR imaging and spectroscopy study. Skeletal Radiol. (2012) ;41: :437–45. |
[247] | Tosetti M , Linsalata S , Battini R , et al. Muscle metabolic alterations assessed by 31-phosphorus magnetic resonance spectroscopy in mild Becker muscular dystrophy. Muscle Nerve. (2011) ;44: :816–9. |
[248] | Touznik A , Lee JJA , Yokota T . New developments in exon skipping and splice modulation therapies for neuromuscular diseases. Expert Opin Biol Ther. (2014) ;14: :809–19. |
[249] | Tyler DJ , Robson MD , Henkelman RM , et al. Magnetic resonance imaging with ultrashort TE (UTE) PULSE sequences: Technical considerations. J Magn Reson Imaging. (2007) ;25: :279–89. |
[250] | Vasan RS . Biomarkers of cardiovascular disease: Molecular basis and practical considerations. Circulation. (2006) ;113: :2335–62. |
[251] | Vignaud A , Guillot G , Caldas de Almeida Araújo E , Carlier PG . NMR imaging of short T2-components in skeletal muscle tissue. Neuromuscul Disord. (2014) ;24: :837. |
[252] | Vohra R , Accorsi A , Kumar A , et al. Magnetic resonance imaging is sensitive to pathological amelioration in a model for laminin-deficient congenital muscular dystrophy (MDC1A). PLoS One. (2015) a;10: :e0138254. |
[253] | Vohra RS , Lott D , Mathur S , et al. Magnetic resonance assessment of hypertrophic and pseudo-hypertrophic changes in lower leg muscles of boys with duchenne muscular dystrophy and their relationship to functional measurements. PLoS One. (2015) b;10: :e0128915. |
[254] | Vohra RS , Mathur S , Bryant ND , et al. Age-related T2 changes in hindlimb muscles of mdx mice. Muscle Nerve. (2015) c;53: (1):84–90. |
[255] | Voit T . The challenge of making therapies happen for neuromuscular diseases. Neuromuscul Disord. (2014) ;24: :918–9. |
[256] | Voit T , Topaloglu H , Straub V , et al. Safety and efficacy of drisapersen for the treatment of Duchenne muscular dystrophy (DEMAND II): An exploratory, randomised, placebo-controlled phase 2 study. Lancet Neurol. (2014) ;13: :987–96. |
[257] | Wagner KR , Fleckenstein JL , Amato AA , et al. A phase I/IItrial of MYO-029 in adult subjects with muscular dystrophy. Ann Neurol. (2008) ;63: :561–71. |
[258] | Walker UA . Imaging tools for the clinical assessment of idiopathic inflammatory myositis. Curr Opin Rheumatol. (2008) ;20: :656–61. |
[259] | Walter G , Cordier L , Bloy D , Sweeney HL . Noninvasive monitoring of gene correction in dystrophic muscle. Magn Reson Med. (2005) ;54: :1369–76. |
[260] | Wang J , Fan Z , Vandenborne K , et al. A computerized MRI biomarker quantification scheme for a canine model of Duchenne muscular dystrophy. Int J Comput Assist Radiol Surg. (2013) ;8: (5):763–74. |
[261] | Wang K , Yu H , Brittain J . k space water fat decomposition with T2* estimation and multifrequency fat spectrum modeling for ultrashort echo time imaging. J Magn Reson Imaging. (2010) ;31: (4):1027–34. |
[262] | Wary C , Azzabou N , Giraudeau C , et al. Quantitative NMRI and NMRS identify augmented disease progression after loss of ambulation in forearms of boys with Duchenne muscular dystrophy. NMR Biomed. (2015) a;28: :1150–62. |
[263] | Wary C , Azzabou N , Giraudeau C , et al. Quantitative NMRI and NMRS identify augmented disease progression after loss of ambulation in forearms of boys with Duchenne muscular dystrophy. NMR Biomed. (2015) b;28: :1150–62. |
[264] | Wary C , Nadaj-Pakleza A , Laforêt P , et al. Investigating glycogenosis type III patients with multi-parametric functional NMR imaging and spectroscopy. Neuromuscul Disord. (2010) ;20: :548–58. |
[265] | Wary C , Naulet T , Thibaud J-L , et al. Splitting of Pi and other 31P NMR anomalies of skeletal muscle metabolites in canine muscular dystrophy. NMR Biomed. (2012) ;25: :1160–9. |
[266] | Weigel M . Extended phase graphs: Dephasing, RF pulses, and echoes - pure and simple. J Magn Reson Imaging. (2014) . |
[267] | Willcocks RJ , Arpan I A , Forbes SC , et al. Longitudinal measurements of MRI-T2 in boys with Duchenne muscular dystrophy: Effects of age and disease progression. Neuromuscul Disord. (2014) ;24: :393–401. |
[268] | Williams SA , Reid S , Elliott C , et al. Muscle volume alterations in spastic muscles immediately following botulinum toxin type-A treatment in children with cerebral palsy. Dev Med Child Neurol. (2013) ;55: :813–20. |
[269] | Willis T a , Hollingsworth KG , Coombs A , et al. Quantitative muscle MRI as an assessment tool for monitoring disease progression in LGMD2I: A multicentre longitudinal study. PLoS One. (2013) ;8: :e70993. |
[270] | Wishnia A , Alameddine H , Tardif de Gery S , Leroy-Willig A . Use of magnetic resonance imaging for noninvasive characterization and follow-up of an experimental injury to normal mouse muscles. Neuromuscul Disord. (2001) ;11: :50–5. |
[271] | Wokke BH , Bos C , Reijnierse M , et al. Comparison of dixon and T1-weighted MR methods to assess the degree of fat infiltration in duchenne muscular dystrophy patients. J Magn Reson Imaging. (2013) ;38: :619–24. |
[272] | Wokke BH , Hooijmans MT , van den Bergen JC , et al. Muscle MRS detects elevated PDE/ATP ratios prior to fatty infiltration in Becker muscular dystrophy. NMR Biomed. (2014) a;27: :1371–7. |
[273] | Wokke BH , van den Bergen JC , Versluis MJ , et al. Quantitative MRI and strength measurements in the assessment of muscle quality in Duchenne muscular dystrophy. Neuromuscul Disord. (2014) b;24: :409–16. |
[274] | Wokke BH , van den Bergen JC , Hooijmans MT , et al. T2 relaxation times are increased in skeletal muscle of DMD but not BMD patients. Muscle Nerve. (2016) ;53: :38–43. |
[275] | Wren TA , Bluml S , Tseng-Ong L , Gilsanz V . Three-point technique of fat quantification of muscle tissue as a marker of disease progression in Duchenne muscular dystrophy: Preliminary study Amer J Roentgenol. W. (2008) ;190: :8–12. |
[276] | Wynn TA . Cellular and molecular mechanisms of fibrosis. J Pathol. (2008) ;214: :199–210. |
[277] | Xi W , Perdanasari AT , Ong Y , et al. Objective breast volume, shape and surface area assessment: A systematic review of breast measurement methods. Aesthetic Plast Surg. (2014) ;38: :1116–30. |
[278] | Yanagisawa O , Shimao D , Maruyama K , et al. Diffusion-weighted magnetic resonance imaging of human skeletal muscles: Gender-, age- and muscle-related differences in apparent diffusion coefficient. Magn Reson Imaging. (2009) ;27: :69–78. |
[279] | Yao L , Gai N . Fat-corrected T2 measurement as a marker of active muscle disease in inflammatory myopathy. Am J Roentgenol. (2012) ;198: :475–81. |
[280] | Yarnykh VL . Actual flip-angle imaging in the pulsed steady state: A method for rapid three-dimensional mapping of the transmitted radiofrequency field. Magn Reson Med. (2007) ;57: :192–200. |
[281] | Yarnykh VL , Tartaglione E V , Ioannou GN . Fast macromolecular proton fraction mapping of the human liver in vivo for quantitative assessment of hepatic fibrosis. NMR Biomed. (2015) ;28: :1716–25. |
[282] | Yasuda T , Loenneke JP , Thiebaud RS , Abe T . Effects of detraining after blood flow-restricted low-intensity concentric or eccentric training on muscle size and strength. J Physiol Sci. (2015) ;65: :139–44. |
[283] | Yokota T , Lu Q-L , Partridge T , et al. Efficacy of systemic morpholino exon-skipping in Duchenne dystrophy dogs. Ann Neurol. (2009) ;65: :667–76. |
[284] | Younkin DP , Berman P , Sladky J , et al. 31P NMR studies in Duchenne muscular dystrophy: Age-related metabolic changes. Neurology. (1987) ;37: :165–9. |
[285] | Zaraiskaya T , Kumbhare D , Noseworthy MD . Diffusion tensor imaging in evaluation of human skeletal muscle injury. J Magn Reson Imaging. (2006) ;24: :402–8. |
[286] | Zheng J , An H , Coggan AR , et al. Noncontrast skeletal muscle oximetry. Magn Reson Med. (2013) ;71: :318–25. |
[287] | Zheng J , Hasting MK , Zhang X , et al. A pilot study of regional perfusion and oxygenation in calf muscles of individuals with diabetes with a non-invasive measure. J Vasc Surg. (2014) ;59: :419–26. |
[288] | Zhou L , Lu H . Targeting fibrosis in Duchenne muscular dystrophy. J Neuropathol Exp Neurol. (2010) ;69: :771–6. |
Figures and Tables
Fig.1
Skeletal muscle tissue characterization by NMR imaging. Comparison of qualitative and quantitative approaches. CSA: cross-sectional area; UTE: ultra-short echo time; DEMRI: delayed enhancement MRI; Fat Sat: fat saturation.
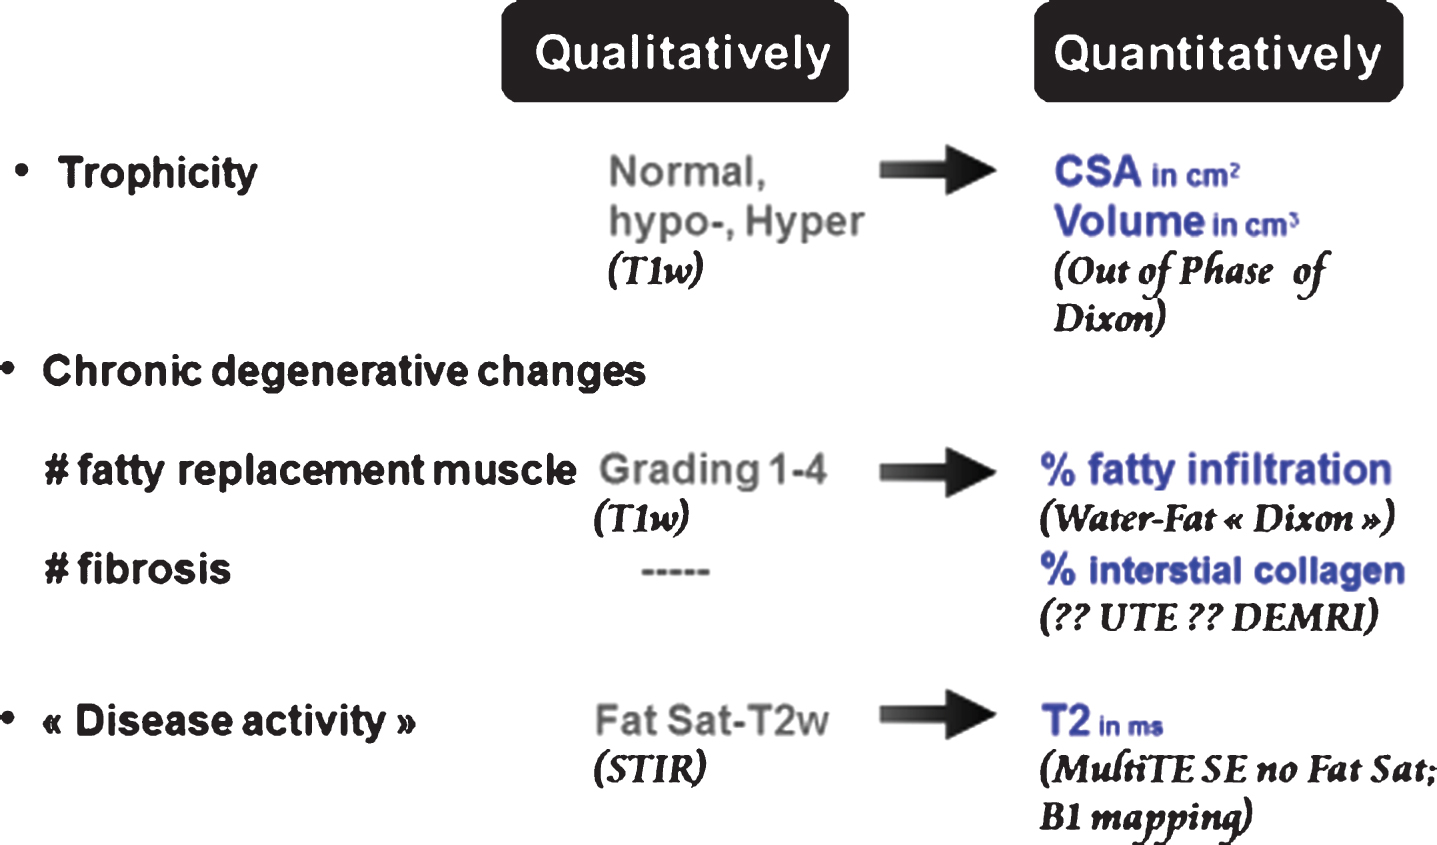
Fig.2
Failure of monoexponential fit of muscle T2 decay to distinguish between inflammatory and fatty degenerative changes. Both will result in an increased skeletal muscle global T2. To separate inflammation from fatty infiltration, specific sequences (with fat saturation) or processes (tri-exponential fit) need to be applied.
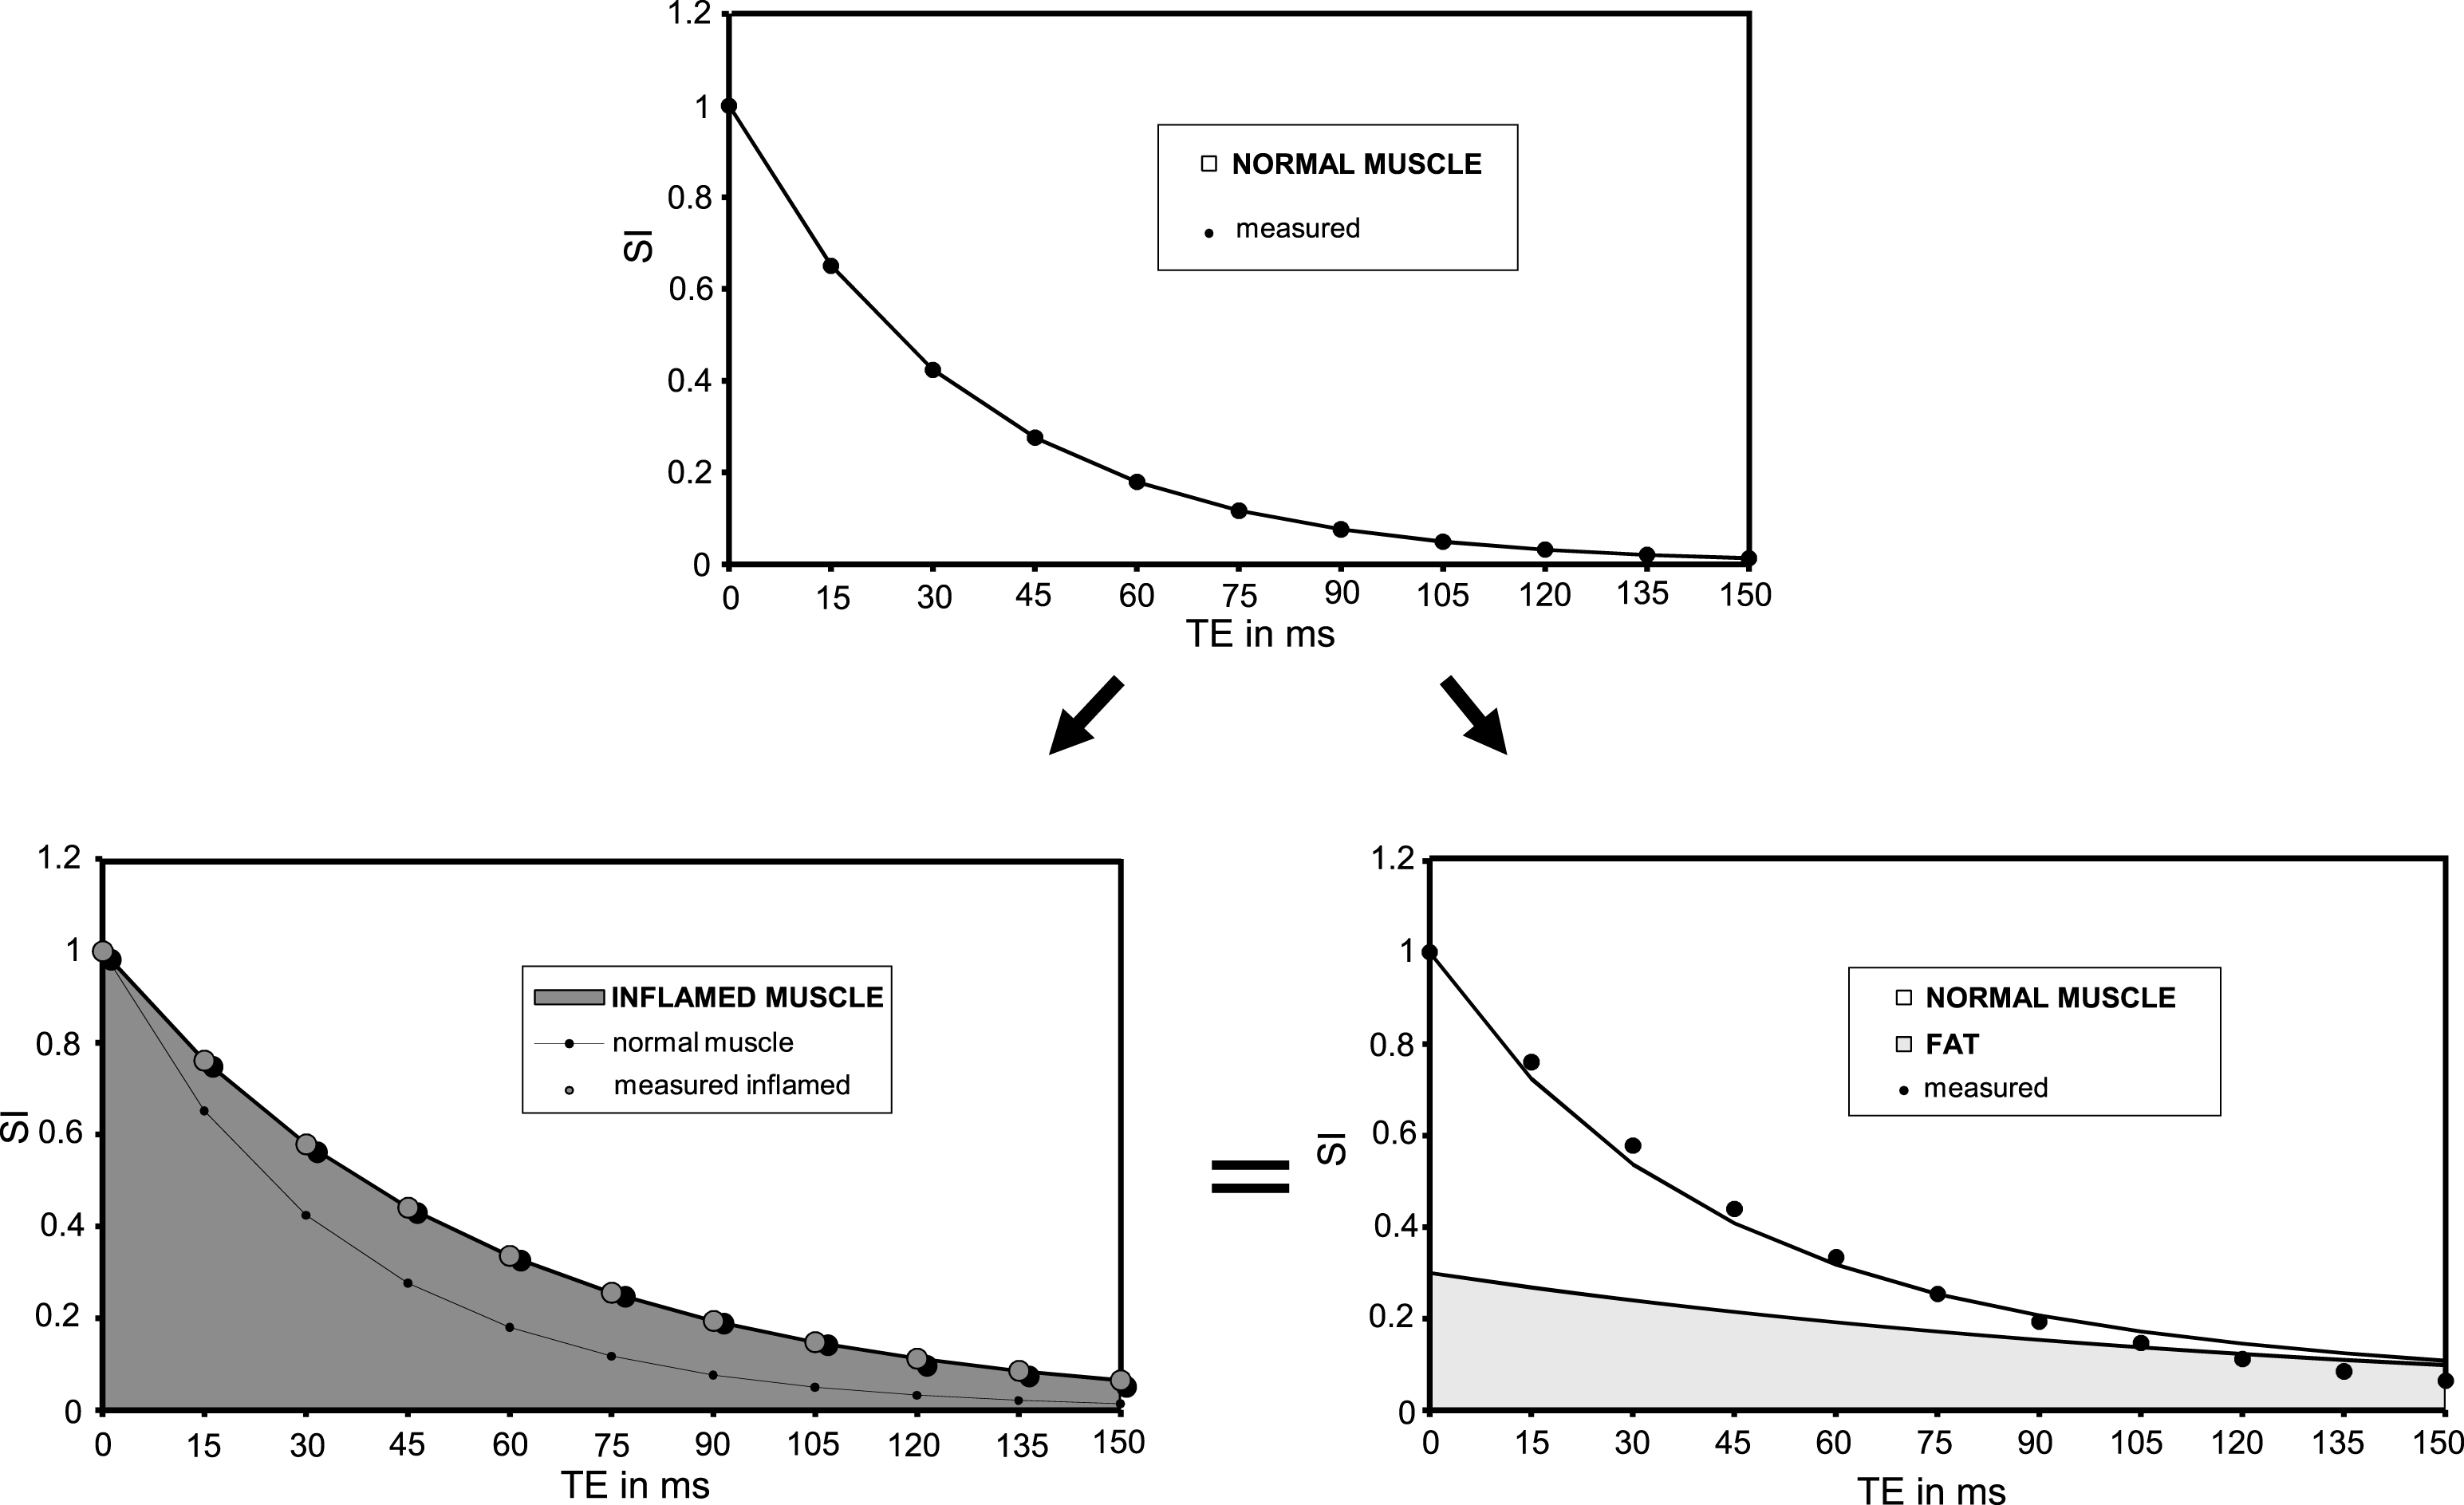
Table 1
Key-features of global and water T2
| Muscle T2 | Global | Water |
| Chemical origin | water and fat | water only |
| Responsive to | slow, long term changes | fast, short term changes |
| Indicative of | mainly chronic fatty | < < disease activity > > |
| degenerative changes | ||
| Methodological | Dixon imaging | requires optimized |
| issues | to be preferred | sequences or |
| processing tools |
Explanation of the risk of confusion between detection of inflammation and monitoring of fatty infiltration by T2 measurements.


