
Psychometric Properties of the Quantitative Myasthenia Gravis Score and the Myasthenia Gravis Composite Scale
Abstract
Background: The Quantitative Myasthenia Gravis Score and the Myasthenia Gravis Composite are two commonly used outcome measures in Myasthenia Gravis. So far, their measurement properties have not been compared, so we aimed to study their psychometric properties using the Rasch model.
Methods: 251 patients with stable myasthenia gravis were assessed with both scales, and 211 patients returned for a second assessment. We studied fit to the Rasch model at the first visit, and compared item fit, thresholds, differential item functioning, local dependence, person separation index, and tests for unidimensionality. We also assessed test-retest reliability and estimated the Minimal Detectable Change.
Results: Neither scale fit the Rasch model (X2 p < 0.05). The Myasthenia Gravis Composite had lower discrimination properties than the Quantitative Myasthenia Gravis Scale (Person Separation Index: 0.14 and 0.7). There was local dependence in both scales, as well as differential item functioning for ocular and generalized disease. Disordered thresholds were found in 6(60%) items of the Myasthenia Gravis Composite and in 4(31%) of the Quantitative Myasthenia Gravis Score. Both tools had adequate test-retest reliability (ICCs >0.8). The minimally detectable change was 4.9 points for the Myasthenia Gravis Composite and 4.3 points for the Quantitative Myasthenia Gravis Score.
Conclusions: Neither scale fulfilled Rasch model expectations. The Quantitative Myasthenia Gravis Score has higher discrimination than the Myasthenia Gravis Composite. Both tools have items with disordered thresholds, differential item functioning and local dependency. There was evidence of multidimensionality in the QMGS. The minimal detectable change values are higher than previous studies on the minimal significant change. These findings might inform future modifications of these tools.
INTRODUCTION
The Myasthenia Gravis Score (QMGS) and the Myasthenia Gravis Composite (MGC) are two commonly used outcome measures for Myasthenia Gravis (MG). Both measures are aimed at quantifying disease severity, based on impairments of body functions and structures, as defined by the International Classification of Disability and Health (ICF) [1]. Both measures differ on the impairments measured; the QMGS has several items aimed at measuring fatigability, and is fully examination-based. The MGC includes some patient reported items, to reflect those impairments not easily observed in a clinical visit.
The QMGS was developed by Besinger [2], and modified by Tindall [3] and again by Barohn [4]. The latter version is the one actually in use, and consists of 13 items that assess ocular, bulbar and limb function. Out of the 13 items, 6 are timed tests of endurance measured in seconds. These, as well as continuous data on grip strength and % of predicted forced vital capacity (FVC) are transformed to ordinal scores. Each item has a possible score from 0–3, however there is no clear description of how those cut-points were chosen [2, 4]. The total possible score is 39, where higher scores indicate more severe impairments. The QMGS has demonstrated construct validity [5], inter-rater reliability [4] and responsiveness in clinical trials in myasthenia [6]. However, in a positive RCT of IVIG vs. placebo, only 6/13 items were responsive to treatment and not-responsive items had marked floor effects, suggesting that some items could be improved [6, 7].
The MGC was developed more recently [8], and has 10 items combining examination and patient reported items. The 2 ocular items are derived from the QMGS. It has 3 items on muscle strength (deltoids, hip flexors and neck flexors or extensors) and 4 items on bulbar function (swallowing, chewing, breathing and speech functions), based on the clinical history. Each item is scored on an ordinal scale with 4 possible categories, but the items are weighted, whereby bulbar impairments weigh more than ocular ones. The weights were obtained through experts’ input, and the maximum possible score is 50, with higher scores reflecting more severe impairments. The MGC demonstrated construct validity, inter-rater reliability and responsiveness in a cohort of myasthenia patients, [9] and it has been proposed as the main outcome measure in clinical trials in MG. However, to our knowledge there are no published RCTs using the MGC as a primary outcome.
Neither the QMGS nor the MGC have test-retest reliability studies, all reliability studies have been inter-rater. Therefore the error around repeated measurement through time is not known.
So far, the studies on measurement properties of these scales have been based on Classical Test Theory (CTT). CTT is centered on the observed scores, which are defined as the true score plus error of measurement [10–12]. However, in this approach the data of the individual items tend to be lost in the sum-scores. Further, many measures developed through CTT result in ordinal-level scales, where interpretation of change scores is difficult since there is not a fixed unit throughout the scale’s range and where the use of parametric statistics has been questioned [11–13]. The Rasch model is a probabilistic approach to measurement, based on a model-expected frequency of response of persons to items [5, 14]. In this model, the probability that an individual endorses a given item depends exclusively on his/her location on a continuum of the construct of interest (i.e. latent trait) and on the difficulty of the item. Therefore, persons with higher amounts of the trait (e.g. disease severity), are more likely to endorse items that reflect increasing impairments [15, 16] (Fig. 1). The Rasch model has several assumptions including unidimensionality, sample and item independence [15, 16]. These are described in depth in the supplementary document. When all the assumptions are met, the raw ordinal scores can be transformed into an interval-level scale, where the distance between score units can be considered equal across the scale.
Even when full fit to the Rasch model is not intended, studying the assumptions of the model aid to the understanding of the measure structure. For example, Rasch analysis can shed light on the dimensionality of a measure [17] and the performance of the items, including how well the items reflect the underlying construct. This information on the strengths and limitations of a measure provides insight for potential modifications. For example it has been used to modify the Medical Research Council Muscle strength score by rescoring items with disordered thresholds [18]. Clinically this can translate in changes that make a measure better at discriminating between patients and at assessing change, which can directly affect the interpretation of clinical trials.
There is only one published study using the Rasch model on the MGC [9, 19]. That study was focused on one aspect of the model (individual item fit) and did not include overall fit statistics and analysis of thresholds, differential item functioning (DIF) or local independence. Further, there have not been any direct comparisons of the psychometric properties between the QMGS and the MGC, and there are no test-retest reliability studies. The aim of this study was to test whether the MGC and the QMGS fit the assumptions of the Rasch model. Additionally, we aimed at improving our knowledge of their discrimination and reliability properties, as well as the quality of their individual items.
METHODS
The University Health Network Research Ethics Board approved this study and all patients provided written consent. The study was conducted at the Neuromuscular Unit, Toronto General Hospital.
Assessments
251 consecutive patients with MG from our database agreed to participate in this study. Since one of the aims was to assess reliability through time, mostly stable patients (based on their clinical records and declared by the patients to the best of their ability) were included and were reassessed 2 weeks later. Demographic data including age, sex, MGFA status, MG localization, and thymoma were recorded. The second assessment was blinded to the results of the first visit, and performed by a different assessor. Two weeks were deemed enough to prevent any recall of the 4 patient-reported items of the MGC, but not too long to risk major clinical change.
Statistical analysis
The demographic data were analyzed by means/medians (continuous data) or proportions (categorical data). The distributions of the total scores were plotted on histograms for each scale.
Rasch analysis
The data from the first visit of all patients were used. The partial credit model was used, and the analyses were conducted with the Rasch Unidimensional Measurement Model Software (RUMM2030) [9, 20]. The MGC has weighted items, but the partial credit model calculates the thresholds between adjacent responses independently of the given score, so the data were rescored to a 0–3 pattern, with exception of the facial item that has a 0–2 pattern. A sample size of approximately 250 patients is required to obtain 99% confidence with item calibration within 0.5 logits [21].
Fit statistics
For the whole model, a chi squared statistic was used, where a non-significant p value (>0.05) indicates good fit to the model. Global item and persons mean locations and standard deviations (SD) were also computed, where means are expected to be around 0 and SD around 1 [15]. Deviations from those values indicate poor targeting of the tool on the study population.
Individual item fit was assessed through standardized residuals, whereby residuals < ± 2.5 are considered markers of good fit. Additionally, ANOVA fit statistics were used, where significant p-values are markers of poor fit. Correction for multiple testing according to Bonferroni was used [22], with a cut-point for significance of 0.0038 for the QMGS and 0.005 for the MGC.
Threshold evaluation
The thresholds are the locations on the underlying trait (i.e severity), where the probabilities of endorsing two adjacent categories are equal, and these should be ordered (Supplementary Figure 6). When disordered thresholds are found, it indicates that the respondents do not use the response categories consistently with the level of the trait being measured [15], usually reflecting confusing wording or too many response alternatives [23]. Threshold curves were visually analyzed for each item, and disordered thresholds were identified.
Internal consistency and discrimination
Cronbach’s alpha was calculated as a measure of internal consistency, and the person separation index (PSI) was calculated as a measure of discrimination. For both, values of 0.7 are considered the minimum required, with values >0.8 good for group use and >0.9 appropriate for individual use [13, 24].
Local Dependence (LD)
This occurs when the response to certain items depends on response to other(s). This affects the overall fit of the scale and also inflates reliability coefficients. We analyzed the correlations between the item residuals, where a value >0.2 on each correlation was considered indicative of local dependence [25].
Differential Item Functioning (DIF)
DIF occurs when different populations have different response patterns to the same item. The Rasch model assumes sample independence, meaning that items should work in the same way across different populations. We studied DIF by visually comparing item curves for subgroups of patients for each item, and also by ANOVA statistics, using Bonferroni correction for significance. The person factors analyzed were age (<or ≥50 years-old), sex, type of myasthenia (ocular versus generalized) and the presence of thymoma.
Unidimensionality
When taking the Rasch factor out after Principal Component Analysis (PCA), the residuals shouldn’t have any meaningful patterns. This was tested by comparing the most negative and positive values of the first component by a series of t-tests, where less than 5% of significant t-tests (p < 0.05), supports unidimensionality [13].
Test-retest reliability
This was studied in those patients who returned for a second visit and reported no clinical change. Given proper fit to the Rasch model, this was done by demonstrating consistency of the hierarchy of item difficulty and patient ability locations. If no fit to the model, test-retest reliability was assessed by calculating the ICCs for the total scores, using Fleiss’ formula 2,1 [26], considering the raters as random effects. Those calculations were done with the psych package for R [27]. ICC values >0.8 are considered good for groups and >0.9 appropriate for individual use [24]. Using the ICCs, we calculated the minimally detectable change (MDC), which is the minimal change that is beyond error of measurement. The MDC with a 95% CI, is equal to 1.96 * √2 * SEM, where SEM = SD *√(1-ICC)[28, 29].
RESULTS
In total, 251 patients were enrolled and all their data were analyzed to obtain the Rasch model parameters. 142(56.6%) patients were female and the mean age was 57 ± 16.6 years. 209 (83.3%) of patients had generalized disease. Details of the demographic characteristics can be seen in Table 1. There were no missing data for either scale. The mean score of the QMGS was 7.6 ± 4.6 (median: 6, IQR: 6, range: 0–23) and the MGC had a mean of 3.9 ± 4.3 (median 3, IQR: 6, range:0–28).
Rasch model and item fit
The person distributions were skewed towards the left (lower scores, less impairment), but this was more evident in the case of the MGC. This was also reflected in the mean person locations, which were –3.16 ± 0.83 for the MGC and –2.48 ± 0.9 for the QMGS, where mean values are expected to be close to 0. Figure 2 shows the person-item threshold map for each scale, depicting the skewing of the persons’ scores in both scales and also several gaps in between the thresholds, showing poor targeting of both tools in this population.
The global fit chi squared statistic was significant, indicating poor fit in both scales (MGC p = 0.02 and QMGS p < 0.0001). Table 2 provides a summary of global fit parameters for both scales.
The analysis of item fit in the QMGS, revealed that the items for diplopia, ptosis, FVC as well as head, arm and leg lift had poor fit based on the residuals and/or p values. There were disordered thresholds in 4(31%) of the items of the QMGS: diplopia, ptosis, speech and left hand grip. In the case of the MGC, there was no misfit of the items based on residuals or p values, however, 6(60%) items had disordered thresholds: ptosis, diplopia, chewing, swallowing, arm abduction and hip flexors. Table 3 shows the individual item fit statistics, and Fig. 3 provides an example of ordered and disordered thresholds for each scale.
The item locations didn’t follow the expected difficulty order. For example, in the QMGS the breathing item was the one indicating less severity. In the MGC, the breathing item reflected less severity than the speech item, and in both tools, the eye closure item reflected more severe impairment than other bulbar or limb impairments. A map of the item locations can be found in Fig. 4.
Internal consistency, discrimination and local dependence
Cronbach’s α values were 0.66 for the MGC and 0.74 for the QMGS. Discrimination assessed by the PSI, showed values of 0.14 for the MGC and 0.70 for the QMGS. Local dependence was present in both scales. In the QMGS there were high (>0.2) correlations of the residuals between the arms, legs and head items. In the MGC, there were high correlations between the neck, shoulder abduction and hip flexors, and also between the talking, chewing and swallowing items (Supplementary Table 2).
Differential item functioning
This was also evident in both scales, both when visually analyzing plots and by ANOVA. In the MGC, the ocular and bulbar items had DIF on type of MG (ocular/generalized, p < 0.005). For the QMGS, there was evidence of DIF for type of MG in the ocular and arm items (p < 0.0038). Additionally, there was DIF in handgrip (p < 0.0038) for person factor sex and for the handgrip and facial items (p < 0.0038) for person factor age. Supplementary Figures 8 and 9 depict items with and without DIF.
Unidimensionality
The percentage of significant t-tests of the principal component analysis of the residuals was 2.8% for the MGC and 12% for the QMGS, indicating uni and multidimensionality respectively.
Reliability
Test-retest reliability was studied in 209 stable patients, out of 211 who returned for a second visit. The ICCs were calculated for the total scores and were 0.88 for the QMGS (95% CI: 0.85–0.91) and 0.82 for the MGC (95% CI: 0.77–0.85). MDC values were 4.3 for the QMGS and 4.9 for the MGC.
DISCUSSION
In this study, we found that neither the MGC nor the QMGS fit all the assumptions of the Rasch model. In the QMGS, we found evidence of multidimensionality, poor item fit, disordered thresholds, local dependence and DIF. In the MGC we found disordered thresholds, DIF, local dependence and low discrimination properties.
The presence of local dependence is not surprising, as certain impairments tend to go together, however removal of an item on one body region (e.g. arm endurance) would reduce content validity. Because in both measures all items are conceptually relevant for the underlying construct and are not interchangeable, these measures are likely formative rather than reflective in nature [30]. If that is the case, these measures should be considered more as health indices than scales [30]. This paired with the heterogeneous characteristics of MG where there might not be a clear hierarchy of the impairments and the evidence of multidimensionality, explains the lack of global fit to the Rasch model. Therefore it is possible that measures of MG impairment can’t conceptually fit the Rasch model as a whole. In this light, we have used the findings to understand what aspects of these measures can be improved and not expecting to obtain global fit to the model.
We found that several items had disordered thresholds. While this might be due to factors such as dimensionality, it also suggests poor discrimination of physicians or patients between response options. An example is the MGC chewing item, where the options “fatigue with soft food” and “fatigue with solid food” might generate confusion by combining both the concept of fatigue and type of food, acting as a double-barrelled question. In the previous psychometric study of the MGC [19], the mean locations for each item response category were ordered with exception of the ocular items, but the thresholds were not reported so we cannot directly compare our findings.
In the case of the QMGS, there were also items with disordered thresholds and several items had statistical misfit. For example the item for speech, which measures time-to-dysarthria, had disordered thresholds. Even though that item is originally based on continuous data, the transformation to ordinal scores results in a bimodal distribution, where most patients either had dysarthria at onset or didn’t develop dysarthria at all. Therefore, this item does not discriminate well between different degrees of speech articulation fatigability, and in fact it has been shown to have severe floor effect and poor responsiveness [7, 31]. Additionally, there is always loss of information when converting continuous data to ordinal data and this might account for the disordered thresholds of some items of the QMGS that are originally continuous in nature.
Another important finding is the very low value of the PSI in the MGC, indicating low discrimination properties. While discrimination parameters can be affected by the relative homogeneity of the sample, the marked difference between both scales in the same population indicates a specific problem of the MGC. This can be visualized in the person-threshold map (Fig. 2), where most patients are clustered around lower levels of disease severity. A possible explanation is the lack of measures of fatigability in the MGC compared to the QMGS. In fact, when comparing the corresponding items on arm function in the 209 patients with generalized disease, 186(89%) scored 0 on the MGC (deltoid strength), compared to 117 (56%) in the QMGS (arm endurance). This difference in the prevalence of endurance impairments compared to absolute strength has been previously reported in MG [32]. Therefore adding measures of fatigability could improve the discriminative properties of the MGC, by reducing the marked floor effect of those items that reflect muscle strength in a fixed point in time.
In both measures, the hierarchy of the items did not follow what would have been expected clinically. Most experts agree that respiratory dysfunction is the most severe impairment in MG. However, the breathing item of the QMGS, which measures absolute % of FVC, was the one reflecting lesser impairment. Therefore, it does not accurately reflect the breathing impairments in MG. Further, previous studies have shown that this item is not responsive to change [7, 31], therefore alternative items to measure breathing function should be researched. In the MGC, the breathing item (patient-reported) was more appropriately located, reflecting higher severity of impairment. In this scale the breathing item reflects endurance/fatigability. Therefore, fatigability can successfully be assessed through patient-reported items, and might better reflect the everyday impairments.
In both measures, the eye closure item reflected more severe impairment than other bulbar or limb impairments and this was also found in the previous Rasch study of the MGC [19]. However, this impairment is usually considered as mild in terms of severity and in fact, eye closure weakness is the only sign accepted in patients in remission [33]. Considering that previous studies have shown that eye closure weakness is not responsive to change [7], this item could be removed form these measures since it doesn’t seem to add to the overall quantification of disease severity.
The evidence of DIF between generalized and purely ocular patients is not unexpected, as patients with pure ocular disease will have low bulbar and limb scores, regardless of increasing severity of their impairments. Further, even when intuitively one would categorize ocular items as being in the lower end of the severity spectrum, they don’t necessarily follow a hierarchical order with the rest of the impairments. Linking this to our finding of multidimensionality in the QMGS, it is reasonable to suppose that the ocular items represent a different dimension than the generalized items. This could be addressed in practice by sub-scores (e.g. ocular/generalized), which could solve both the dimensionality and DIF problems. This also makes sense from a clinical perspective, whereby pure ocular patients could be assessed with the ocular domain alone. While we did not find evidence of multidimensionality in the MGC based on the statistical testing, it is possible that it also represents different dimensions. The same argument for an ocular domain applies as for the QMGS, but additionally, the patient-reported items might represent a dimension on its own, and this should be explored in the future. Additionally, patients should be engaged by incorporating their input on patient-reported items, for example in terms of item relevance and their relationship with overall disease severity. This would follow current guidelines on patient-reported outcome development [34].
This is the first published study of test-retest reliability for the QMGS and MGC, and we found acceptable ICCs for both. Given that different raters assessed the patients on the 2 visits, it is possible that some error was introduced than if using the same assessor. However, high inter-rater reliability has been demonstrated for both scales (ICCs: 0.91 for the QMGS and 0.98 for the MGC) [9, 35]. It also must be kept in mind that local dependence might inflate the ICCs, so these cannot be taken at face value. The MDC values of 4.3 and 4.9 for the QMGS and MGC are slightly higher than previously reported values of significant change for these tools [9, 36]. The MDC is defined as the smallest change in score that is beyond error of measurement reflecting “true change”, but it does not necessarily reflect clinical significance [37]. Previous studies have estimated the minimal clinically important difference (MCID), which is the minimal change that is clinically relevant [36]. Therefore, the MCID and the MDC reflect different concepts and the different values are not surprising. However, for the interpretation of change scores at the individual patient level, the MCID should be higher than the MDC, otherwise the change observed could be due to error [37]. Our findings suggest that current values of the MCID may fall within error of measurement so they might not be reliable at the individual patient level (e.g. to define a responder). If using the values of MDC from this study to estimate sample size for clinical trials, the resulting samples would be smaller than current cut-points because it takes fewer patients to detect a larger difference [38]. However, because the MCID and the MDC depend on baseline characteristics [37], further studies are needed in different populations to confirm our findings.
This study is not without limitations. Mostly mild to moderately affected patients were enrolled, so these results might not be extrapolated to a more severely affected population. However, the sample size and the severity distribution (MGFA class) are similar to previous cohorts where MG measures have been studied [9]. The relative homogeneity of the sample will have the most impact on the reliability and internal consistency statistics. Additionally, in the current study responsiveness was not studied. We aimed at studying the scoring and item structure and reliability of these scales. Further, comparison of responsiveness should occur with a defined intervention, ideally with a control group, and was not part of the scope of the current study.
The Rasch model has gained strength in medicine as a way to develop scales that better reflect the construct of interest, reducing error of measurement and producing scores that can be easily interpreted [12]. This has been used particularly in the development of patient reported outcomes. By using testing the Rasch model assumptions in the QMGS and the MGC, we have identified some shortcomings affecting their discriminative properties, which can also affect their ability to detect change. Therefore, our findings might inform future modifications to these tools, for example by modifying or replacing those items with poor fit or disordered thresholds. It is likely that more items are needed, especially in the MGC, to improve the discrimination properties. Additionally, our findings suggest that these measures could be divided in sub-scores reflecting the ocular and generalized domains. Such modifications might result in measures that are better at discriminating among different degrees of severity, more reliable and possibly more responsive. This can have a direct impact in clinical decision-making and in the interpretation of clinical trials, two scenarios where these measures are commonly used.
COMPETING INTERESTS
1. Dr. Barnett received a clinical fellowship award by the American Brain Foundation and American Academy of Neurology.
2. Dr. Merkies served on a scientific advisory board for CSL Behring, Novartis, and LFB; has received funding for travel from Talecris Biotherapeutics; and has received research support from the GBS/CIDP International Foundation, the Talents Program foundation, and the Peripheral Nerve Society.
3. Dr. Katzberg received honoraria for travel and speaking from CSL Behring, Genzyme and Grifols Pharmaceuticals, unrestricted grants from CSL Behring and Grifols for investigator initiated research and research funding from the Myasthenia Gravis Foundation of America.
4. Dr. Bril has acted as consultant for Grifols, CSL, Bionevia, Lilly, Pfizer, Dainippon Sumitomo, Eisai and has received research grant support from all of these.
FUNDING
This research received no specific grant from any funding agency in the public, commercial or not-for-profit sector.
AUTHORS’ CONTRIBUTIONS
1. Dr. Barnett contributed with the design of the study, as well as statistical analysis and writing the manuscript and final approval.
2. Dr. Merkies contributed to the conception and design of the study, as well as the analyses and revising the manuscript with final aproval.
3. Dr. Katzberg contributed with the conception of the study, acquisition of data, and revising the manuscript with final approval.
4. Dr. Bril contributed with the conception and design of the study, acquisition of data and revising the manuscript with final approval.
Appendices
The supplementary table and figure are available in the electronic version of this article: http://dx.doi.org/10.3233/JND-150082.
REFERENCES
1 | World Health Organization. International Classification of Functioning, Disability and Health (ICF). 1st edition. World Health Organization; 2001. Available: http://www.who.int/classifications/icf/en/ Accessed: Aug 20th 2013. |
2 | Besinger UA, Toyka KV, Homberg M, Heininger K, Hohlfeld R, Fateh-Moghadam A(1983) Myasthenia gravis: Long-termcorrelation of binding and bungarotoxin blocking antibodies against acetylcholine receptors with changes indisease severityNeurology33: 1013161321 |
3 | Tindall RS, Rollins JA, Phillips JT, Greenlee RG, Wells L, Belendiuk G(1987) Preliminary results of a double-blind, randomized, placebo-controlled trial of cyclosporine in myasthenia gravisN Engl J Med316: 12719724 |
4 | Barohn RJ, McIntire D, Herbelin L, Nations S, Wolfe GI, Bryan WW(1998) Reliability testing of the quantitativemyasthenia gravis scoreAnn N Y Acad Sci841: 769772 |
5 | Barnett C, Katzberg H, Nabavi M, Bril V(2012) The quantitative myasthenia gravis score: Comparison with clinical,electrophysiological, and laboratory markersJ Clin Neuromuscul Dis13: 4201205 |
6 | Zinman L, Ng E, Bril V(2007) IV immunoglobulin in patients with myasthenia gravis: A randomized controlled trialNeurology68: 11837841 |
7 | Barnett TC, Bril V, Davis AM(2013) Performance of individual items of the quantitative myasthenia gravis scoreNeuromuscul Disord23: 5413417 |
8 | Burns TM, Conaway MR, Cutter GR, Sanders DBMuscle Study Group(2008) Construction of an efficient evaluative instrument for myasthenia gravis: The MG compositeMuscle Nerve38: 615531562 |
9 | Burns TM, Conaway M, Sanders DBMG Composite and MG-QOL15 Study Group(2010) The MG Composite: A valid and reliable outcome measure for myasthenia gravisNeurology74: 1814341440 |
10 | Wilson M(2005) Constructing measures: An item response modeling approach8788New JerseyRoutledge Academic |
11 | DeVellis RF(2006) Classical test theoryMed Care44: 11 Suppl 3S50S59 |
12 | Hobart JC, Cano SJ, Zajicek JP, Thompson AJ(2007) Rating scales as outcome measures for clinical trials in neurology: Problems, solutions, and recommendationsThe Lancet Neurology6: 1210941105 |
13 | Tennant A, Conaghan PG(2007) The Rasch measurement model in rheumatology: What is it and why use it? When should it be applied, and what should one look for in a Rasch paper?Arthritis Rheum57: 813581362 |
14 | Rasch G(1981) Probabilistic models for some intelligence and attainment testsUniv of Chicago Pr (Tx)1 |
15 | Pallant JF, Tennant A(2010) An introduction to the Rasch measurementmodel: An example using the Hospital Anxiety and Depression Scale(HADS)Br J Clin Psychol46: 1118 |
16 | Rasch G(1966) An item analysis which takes individual differences into accountBr J Math Stat Psychol19: 14957 |
17 | Franchignoni F, Mora G, Giordano A, Volanti P, Chio A(2013) Evidence of multidimensionality in the ALSFRS-R Scale: Acritical appraisal on its measurement properties using Rasch analysisJ Neurol Neurosurg Psychiatry.0: 16 |
18 | Vanhoutte EK, Faber CG, van Nes SI, Jacobs BC, van Doorn PA, van Koningsveld R, Cornblath DR, van der Kooi AJ, Cats EA, van denBerg LH, Notermans NC, van der Pol WL, Hermans MCE, van derBeek NAME, Gorson KC, Eurelings M, Engelsman J, Boot H, Meijer RJ, Lauria G, Tennant A, Merkies ISJon behalf of the PeriNomS Study Group(2012) Modifying the medical research council grading system through rasch analysesBrain135: 516391649 |
19 | Sadjadi R, Conaway M, Cutter G, Sanders DB, Burns TMMG Composite MG-QOL15 Study Group(2012) Psychometric evaluation of the myasthenia gravis composite using Rasch analysisMuscle Nerve45: 6820825 |
20 | Andrich D, Sheridan B, Luo G(2010) Rasch models for measurement: RUMM2030RUMM Laboratory |
21 | Linacre JM(1994) Sample size and item calibration stabilityRasch Measurement Transactions7: 4328 |
22 | Bland JM, Altman DG(1995) Multiple significance tests: TheBonferroni methodBMJ310: 6973170 |
23 | Andrich D(1996) Category ordering and their utilityRasch Measurement Transactions9: 464465 |
24 | Nunnally JCJr(1967) Psychometric TheorySecond EditionNew YorkMcGraw-Hill |
25 | Lundgren Nilsson Å, Tennant A(2011) Past and present issues in Rasch analysis: The functional independence measure (FIMtrademark) revisitedJ Rehabil Med43: 10884891 |
26 | Portney LG, Watkins MP(2009) Foundations of clinical researchSecond EditionPrentice Hall |
27 | Revelle W. Procedures for psychological, psychometric and personality research: Package “psych,” version 1.3.2. 2013. |
28 | Beaton DE, Bombardier C, Katz JN, Wright JG(2001) A taxonomy for responsivenessJ Clin Epidemiol.54: 1212041217 |
29 | de Vet HC, Terwee CB, Ostelo RW, Beckerman H, Knol DL, Bouter LM(2006) Minimal changes in health statusquestionnaires: Distinction between minimally detectable change and minimally important changeHealth Qual Life Outcomes4: 154 |
30 | De Vet HCW, Terwee CB, Mokkink LB, Knol DL(2011) Measurement in MedicineFirst EditionCambridge University Press |
31 | Wolfe GI, Barohn R, Sandres D, McDermott M(2008) Comparison of outcomemeasures from a trial of Mycophenolate mofetil in myastheniagravisMuscle Nerve38: 514291433 |
32 | Leonardi M, Raggi A, Antozzi C, Confalonieri P, Maggi L, Cornelio F, Mantegazza R(2009) Identification of international classification of functioning, disability and health relevant categories to describe functioning and disability of patients with myasthenia gravisDisabil Rehabil31: 2420412046 |
33 | Jaretzki A, Barohn RJ, Ernstoff RM, Kaminski HJ, Keesey JC, Penn AS, Sanders DB(2000) Myasthenia gravis: Recommendations for clinical research standards. Task force of the medical scientific advisory board of the myasthenia gravis foundation of americaNeurology55: 11623 |
34 | U.S. Department of Health and Human Services FDA Center for Drug Evaluation and Research, U.S. Department of Health and Human Services FDA Center for Biologics Evaluation and Research, U.S. Department of Health and Human Services FDA Center for Devices and Radiological Health. Guidance for industry: Patient-reported outcome measures: Use in medical product development to support labeling claims: Draft guidance. Health Qual Life Outcomes. 2006;4:79. |
35 | Sharshar T, Chevret S, Mazighi M, Chillet P, Huberfeld G, Berreotta C, Houfani M, Gajdos P(2000) Validity andreliability of two muscle strength scores commonly used as endpoints in assessing treatment of myasthenia gravisJ Neurol247: 4286290 |
36 | Katzberg HD, Barnett C, Merkies ISJ, Bril V(2014) Minimal clinicallyimportant difference in myasthenia gravis: Outcomes from arandomized trialMuscle Nerve49: 5661665 |
37 | King MT(2011) A point of minimal important difference (MID): A critique of terminology and methodsExpert Rev Pharmacoecon Outcomes Res11: 2171184 |
38 | Geoffrey R, Streiner DLN(2008) Biostatistics : The Bare EssentialsB.C. Decker |
Figures and Tables
Fig.1
The rasch model. In this figure, the ruler represents a continuum of the trait being measured, in this example disease severity expressed through impairments. By definition the ruler is centered at 0 logits and both the persons and the items are aligned in this metric. With higher severity, more affected persons are located towards the right. The items should follow a hierarchy, were items representing less impairments are closer to the left and severe impairments closer to the right. For each item there is a characteristic curve for their expected scores. As severity increases, the probability of having a higher score in each item increases. Therefore, the probability of achieving a given score on a specific item depends on the persons’ location on the severity scale being related to the severity of the item of interest. When all the assumptions of the Rasch model are met, the scores on the logit scale are considered to be at the interval level, where one unit is the same acrossthe continuum.
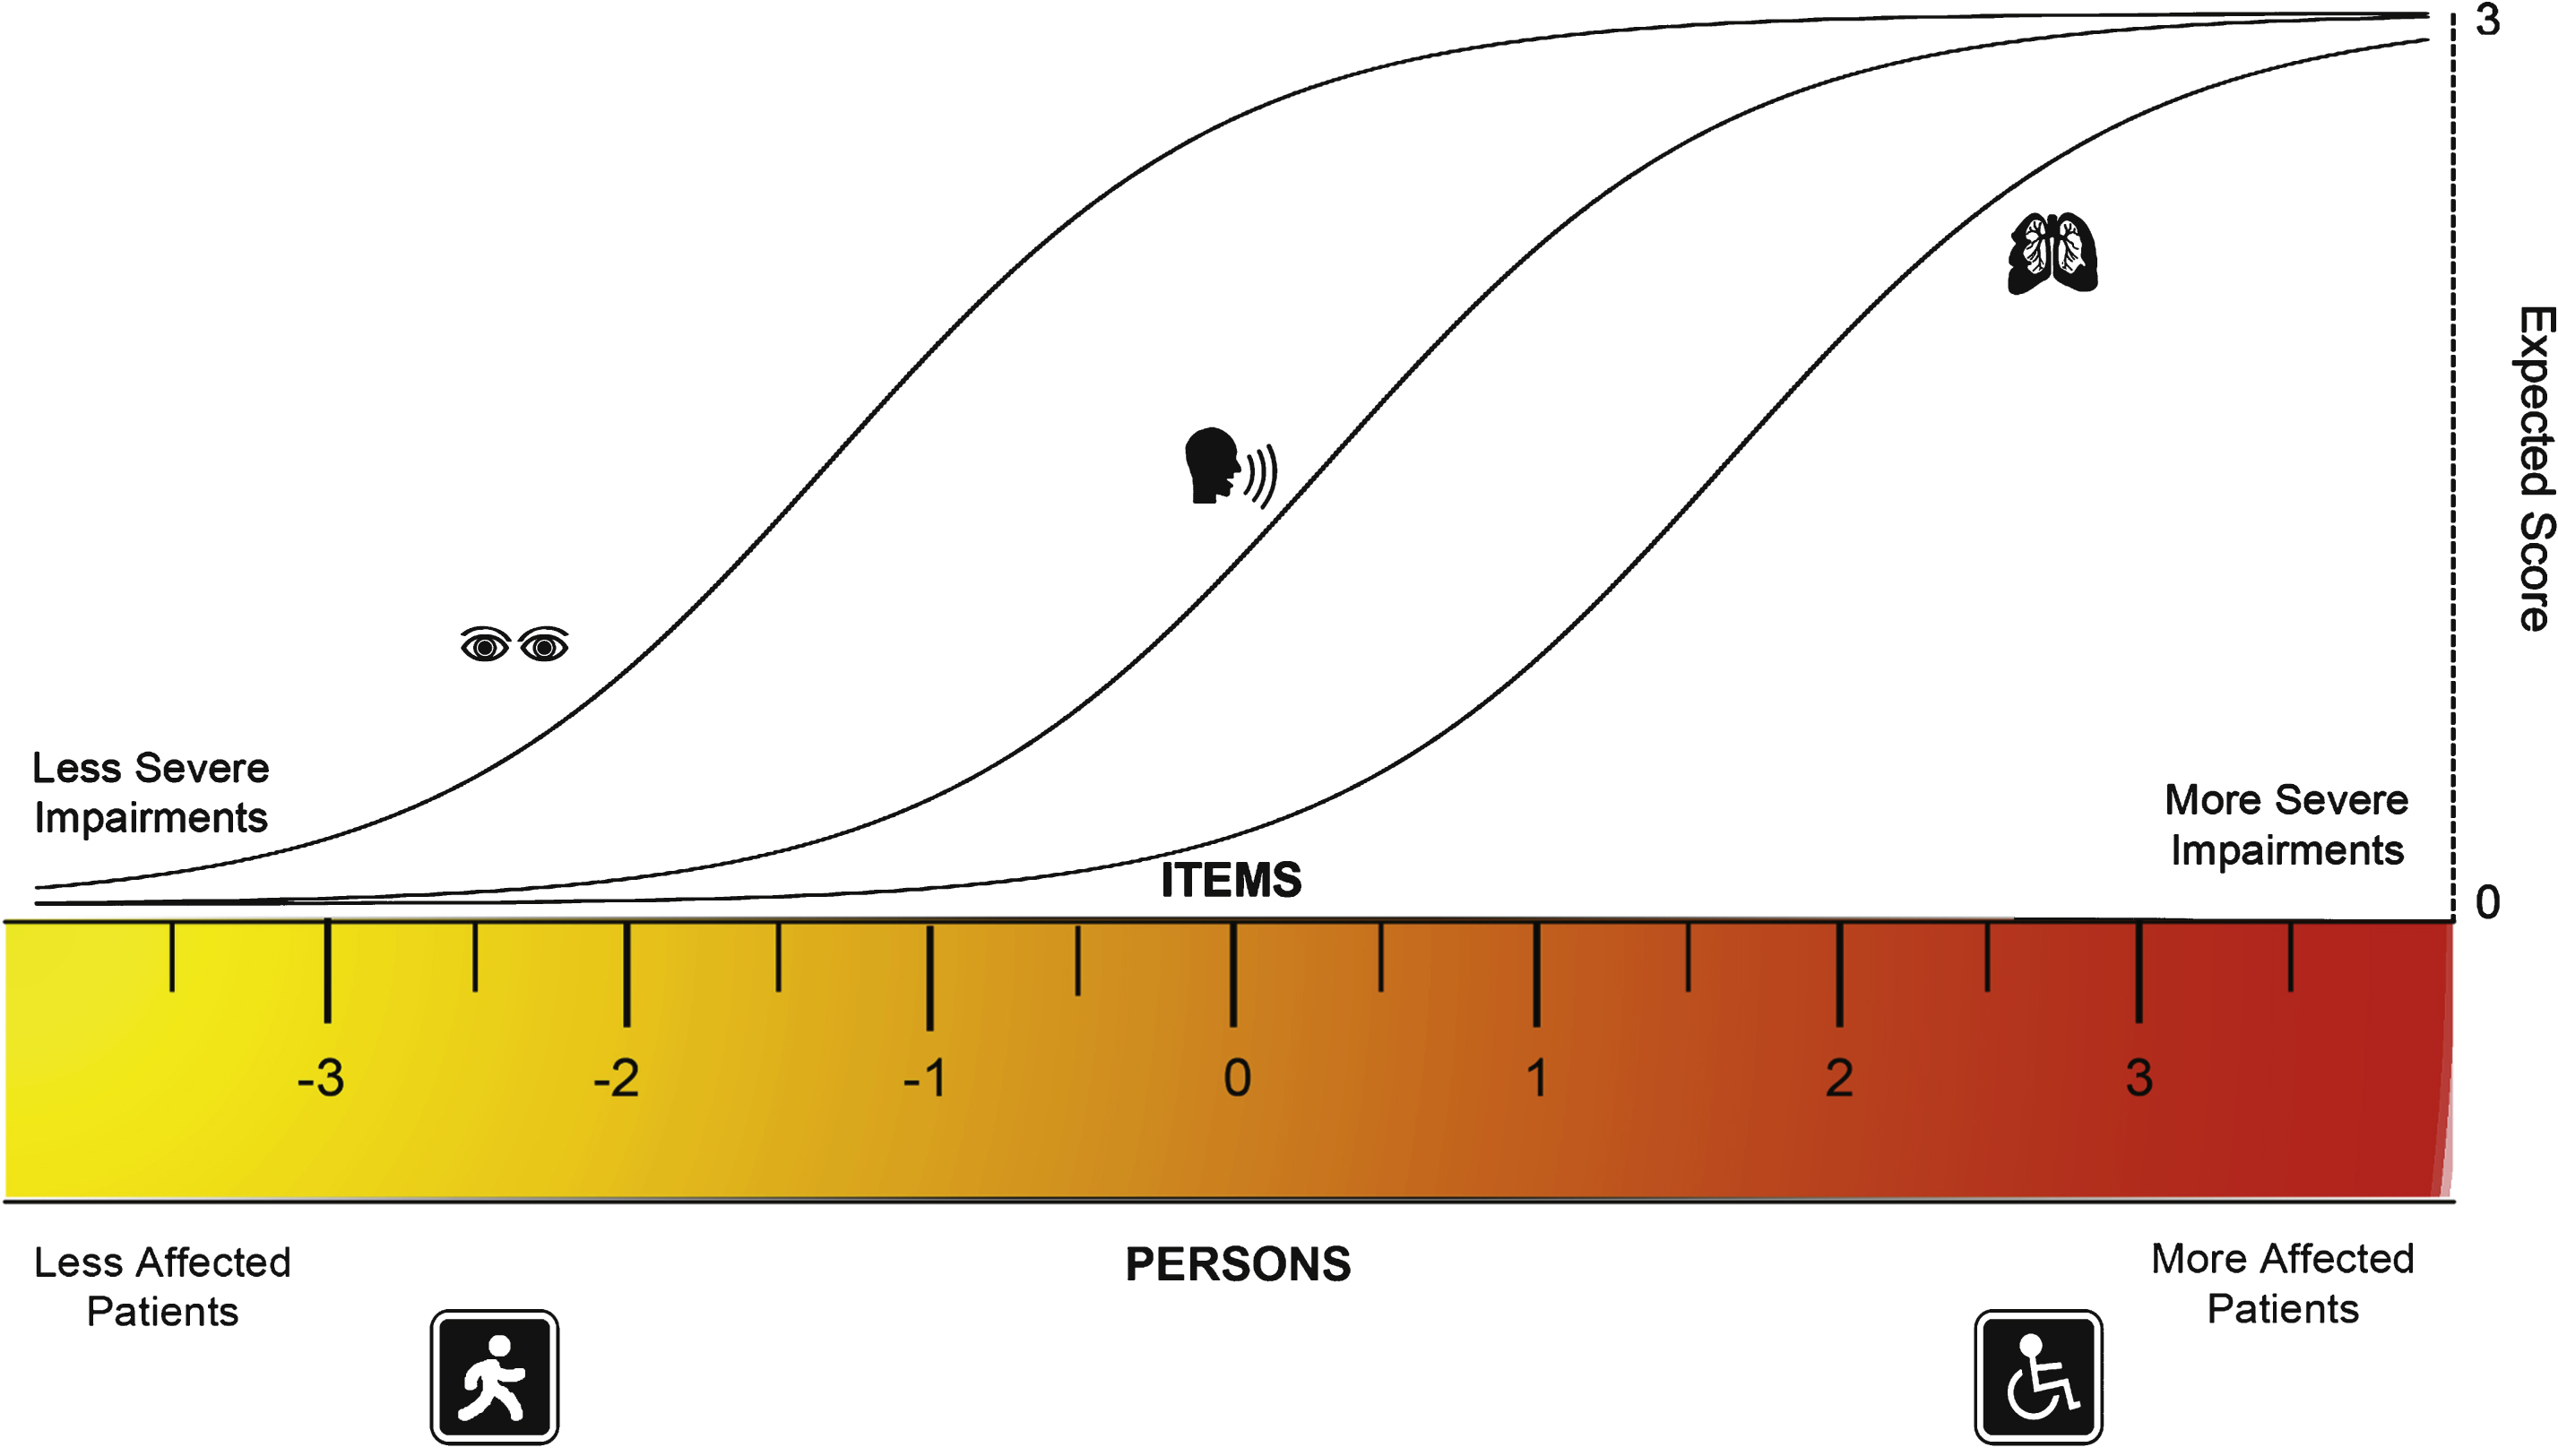
Fig.2
Person-item threshold distributions for the QMGS and the MGC. Figures 2A and 2B depict the person-item threshold distributions for both scales, with persons distribution on top (magenta) and thresholds at the bottom (blue). In a well-targeted tool, the persons should be centered on 0 logits. In both the MGC and QMGS, the persons are skewed to the left (lower scores indicating less severity). This is caused by a sample of patients who predominantly have mild to moderate disease and few severely affected patients, suggesting that both tools are aimed at slightly more affected patients. However, the MGC has more skewed scores than the QMGS, suggesting that the MGC is worse in targeting this population of MG patients. This correlates with the marked difference in person separation index (0.14 for the MGC and 0.70 for the QMGS), suggesting almost no strength to differentiate between groups of patients with various degrees of illness. In an ideal setting, there shouldn’t be gaps between the thresholds along the severity continuum. In both the QMGS and MGC, there is no gradual distribution of the thresholds, demonstrated by the presence of several gaps between them. This is especially evident in the case of more difficult items or items discriminating between more severely affected patients, indicating lack of items and thresholds that accurately reflect those levels of severity.
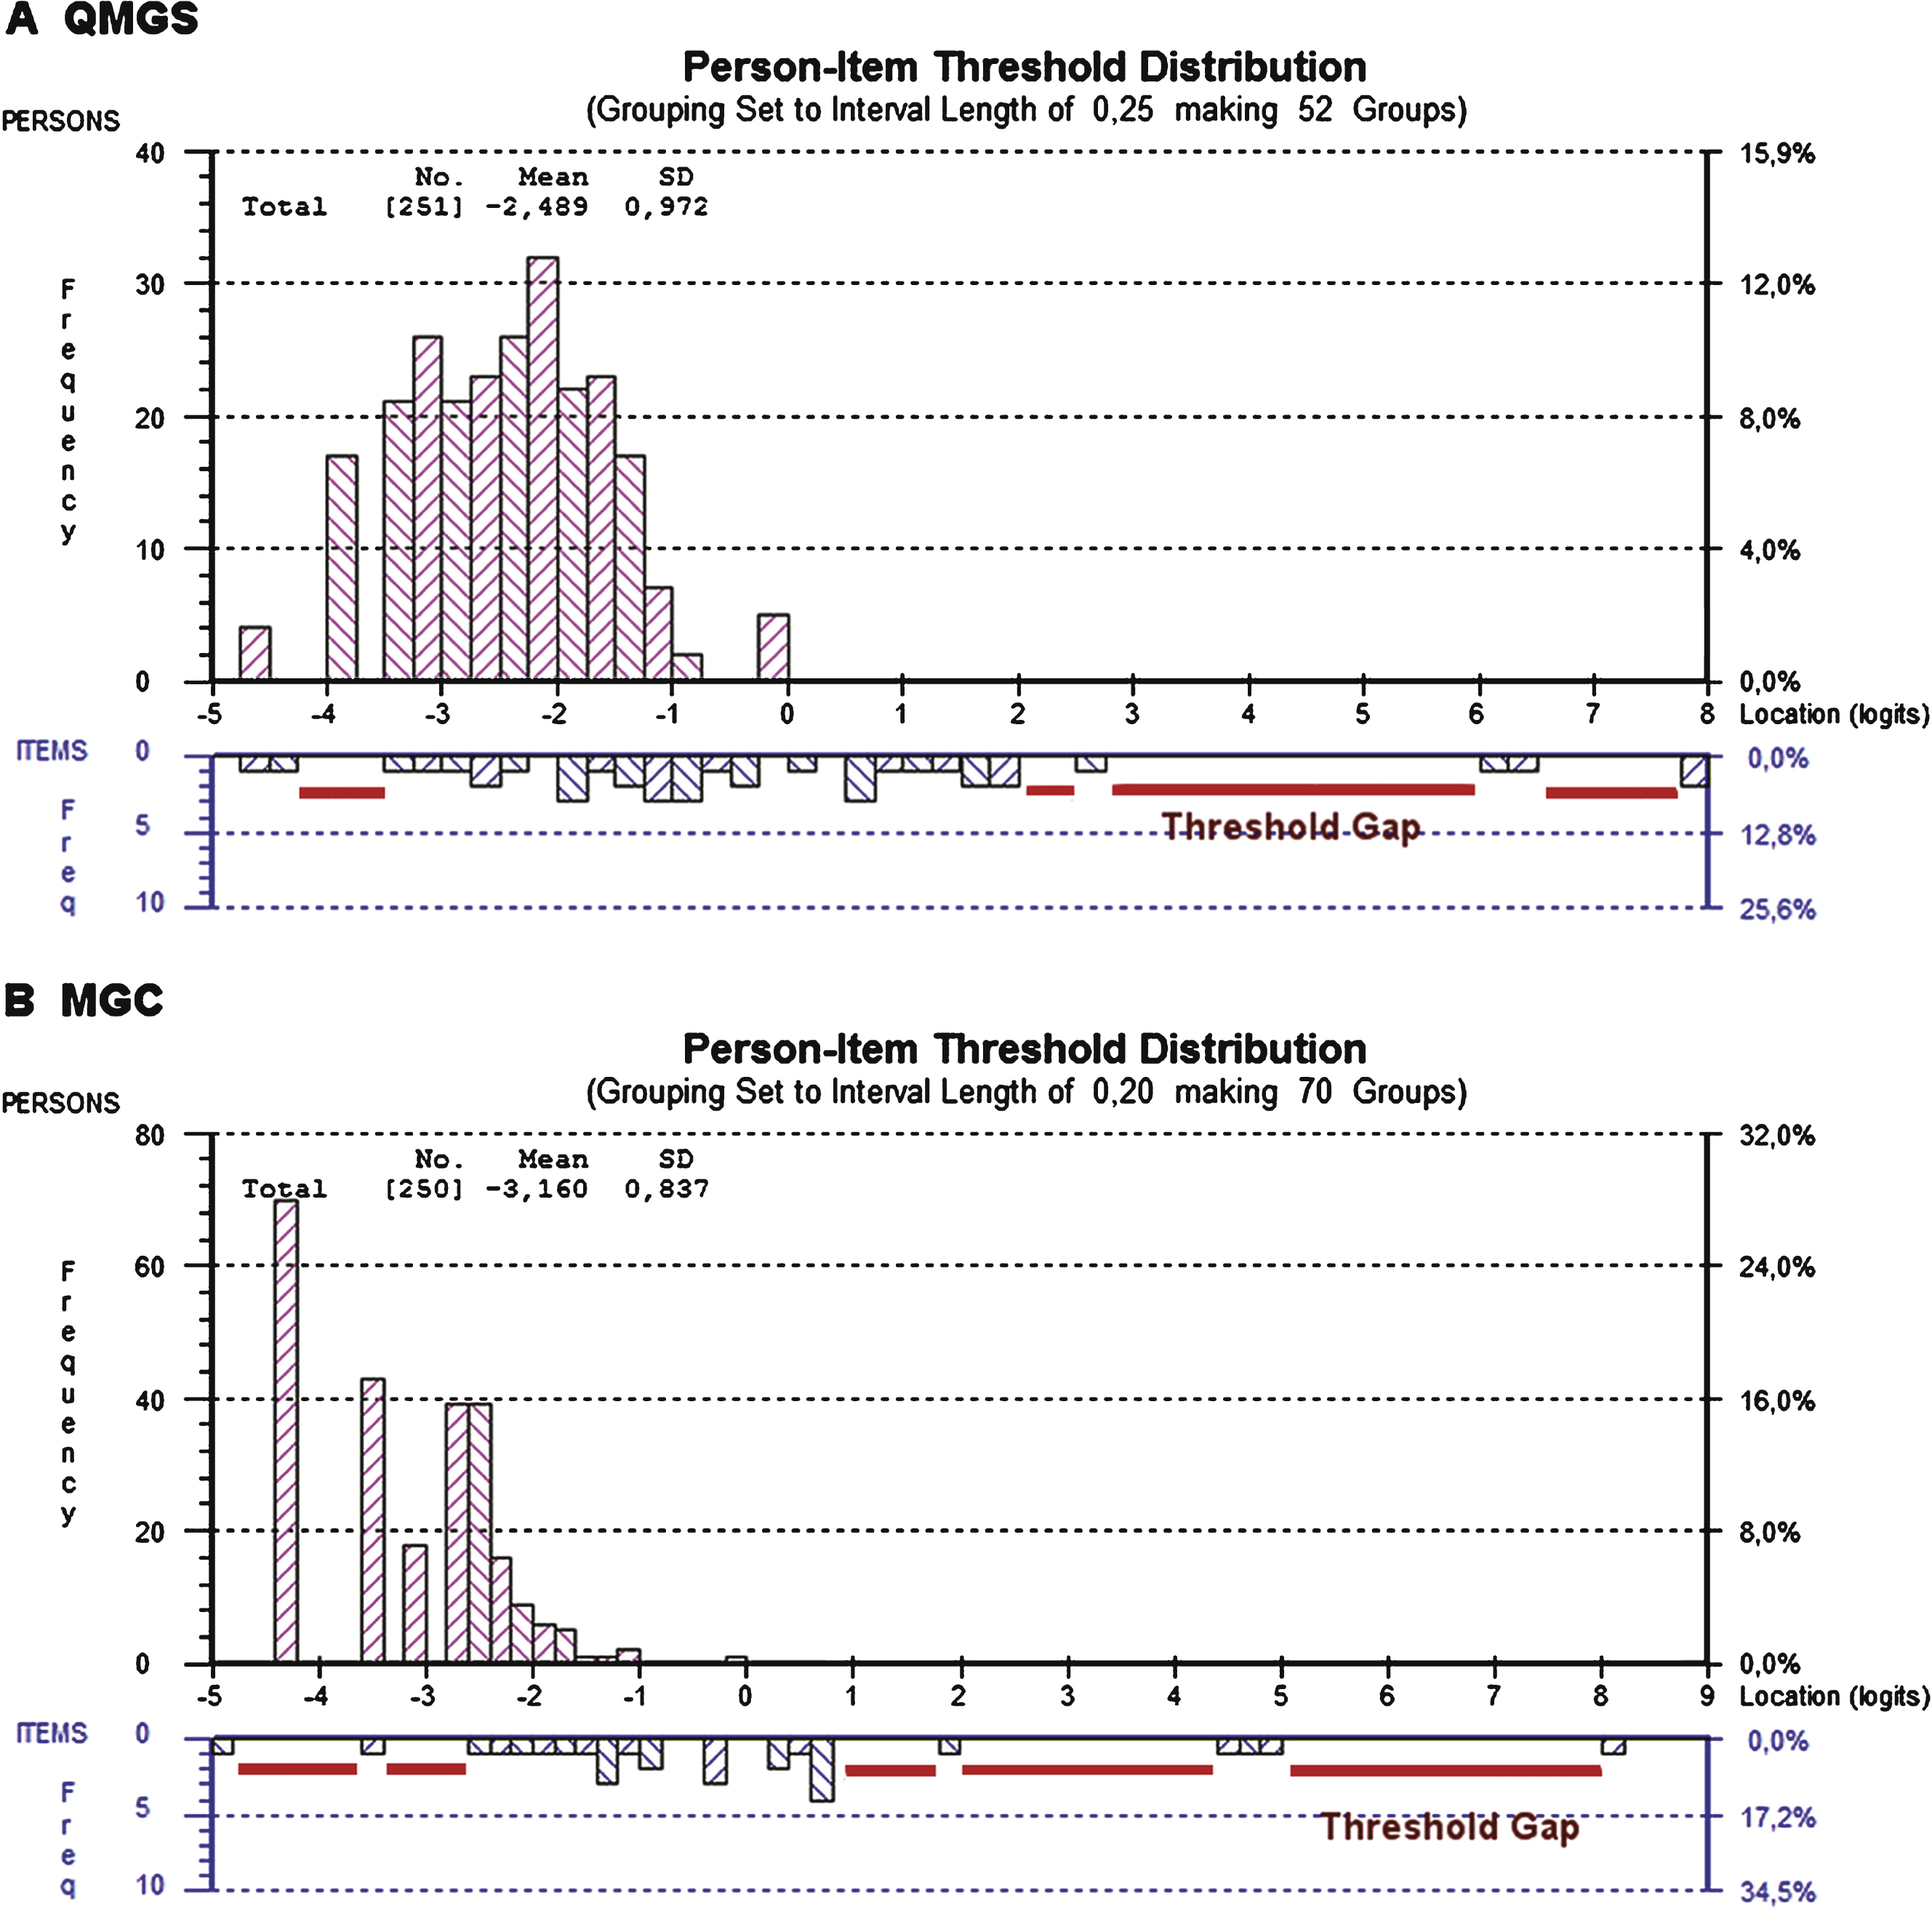
Fig.3
Example of ordered and disordered thresholds for the QMGS and the MGC. Figs. 2A and 2C demonstrate ordered thresholds (T1 < T2 < T3) for items of the QMGS and MGC respectively. In Figs. 2B and 2C, the thresholds don’t follow the expected order. This suggests that either the physicians are not good at discriminating between responses (e.g. QMGS speech item), or that the patients cannot discriminate between response options (e.g. MGC chewing item). T1 = Thresholds between scores 0 and 1. T2 = Thresholds between scores 1 and 2. T3 = Threshold between scores 2 and 3.
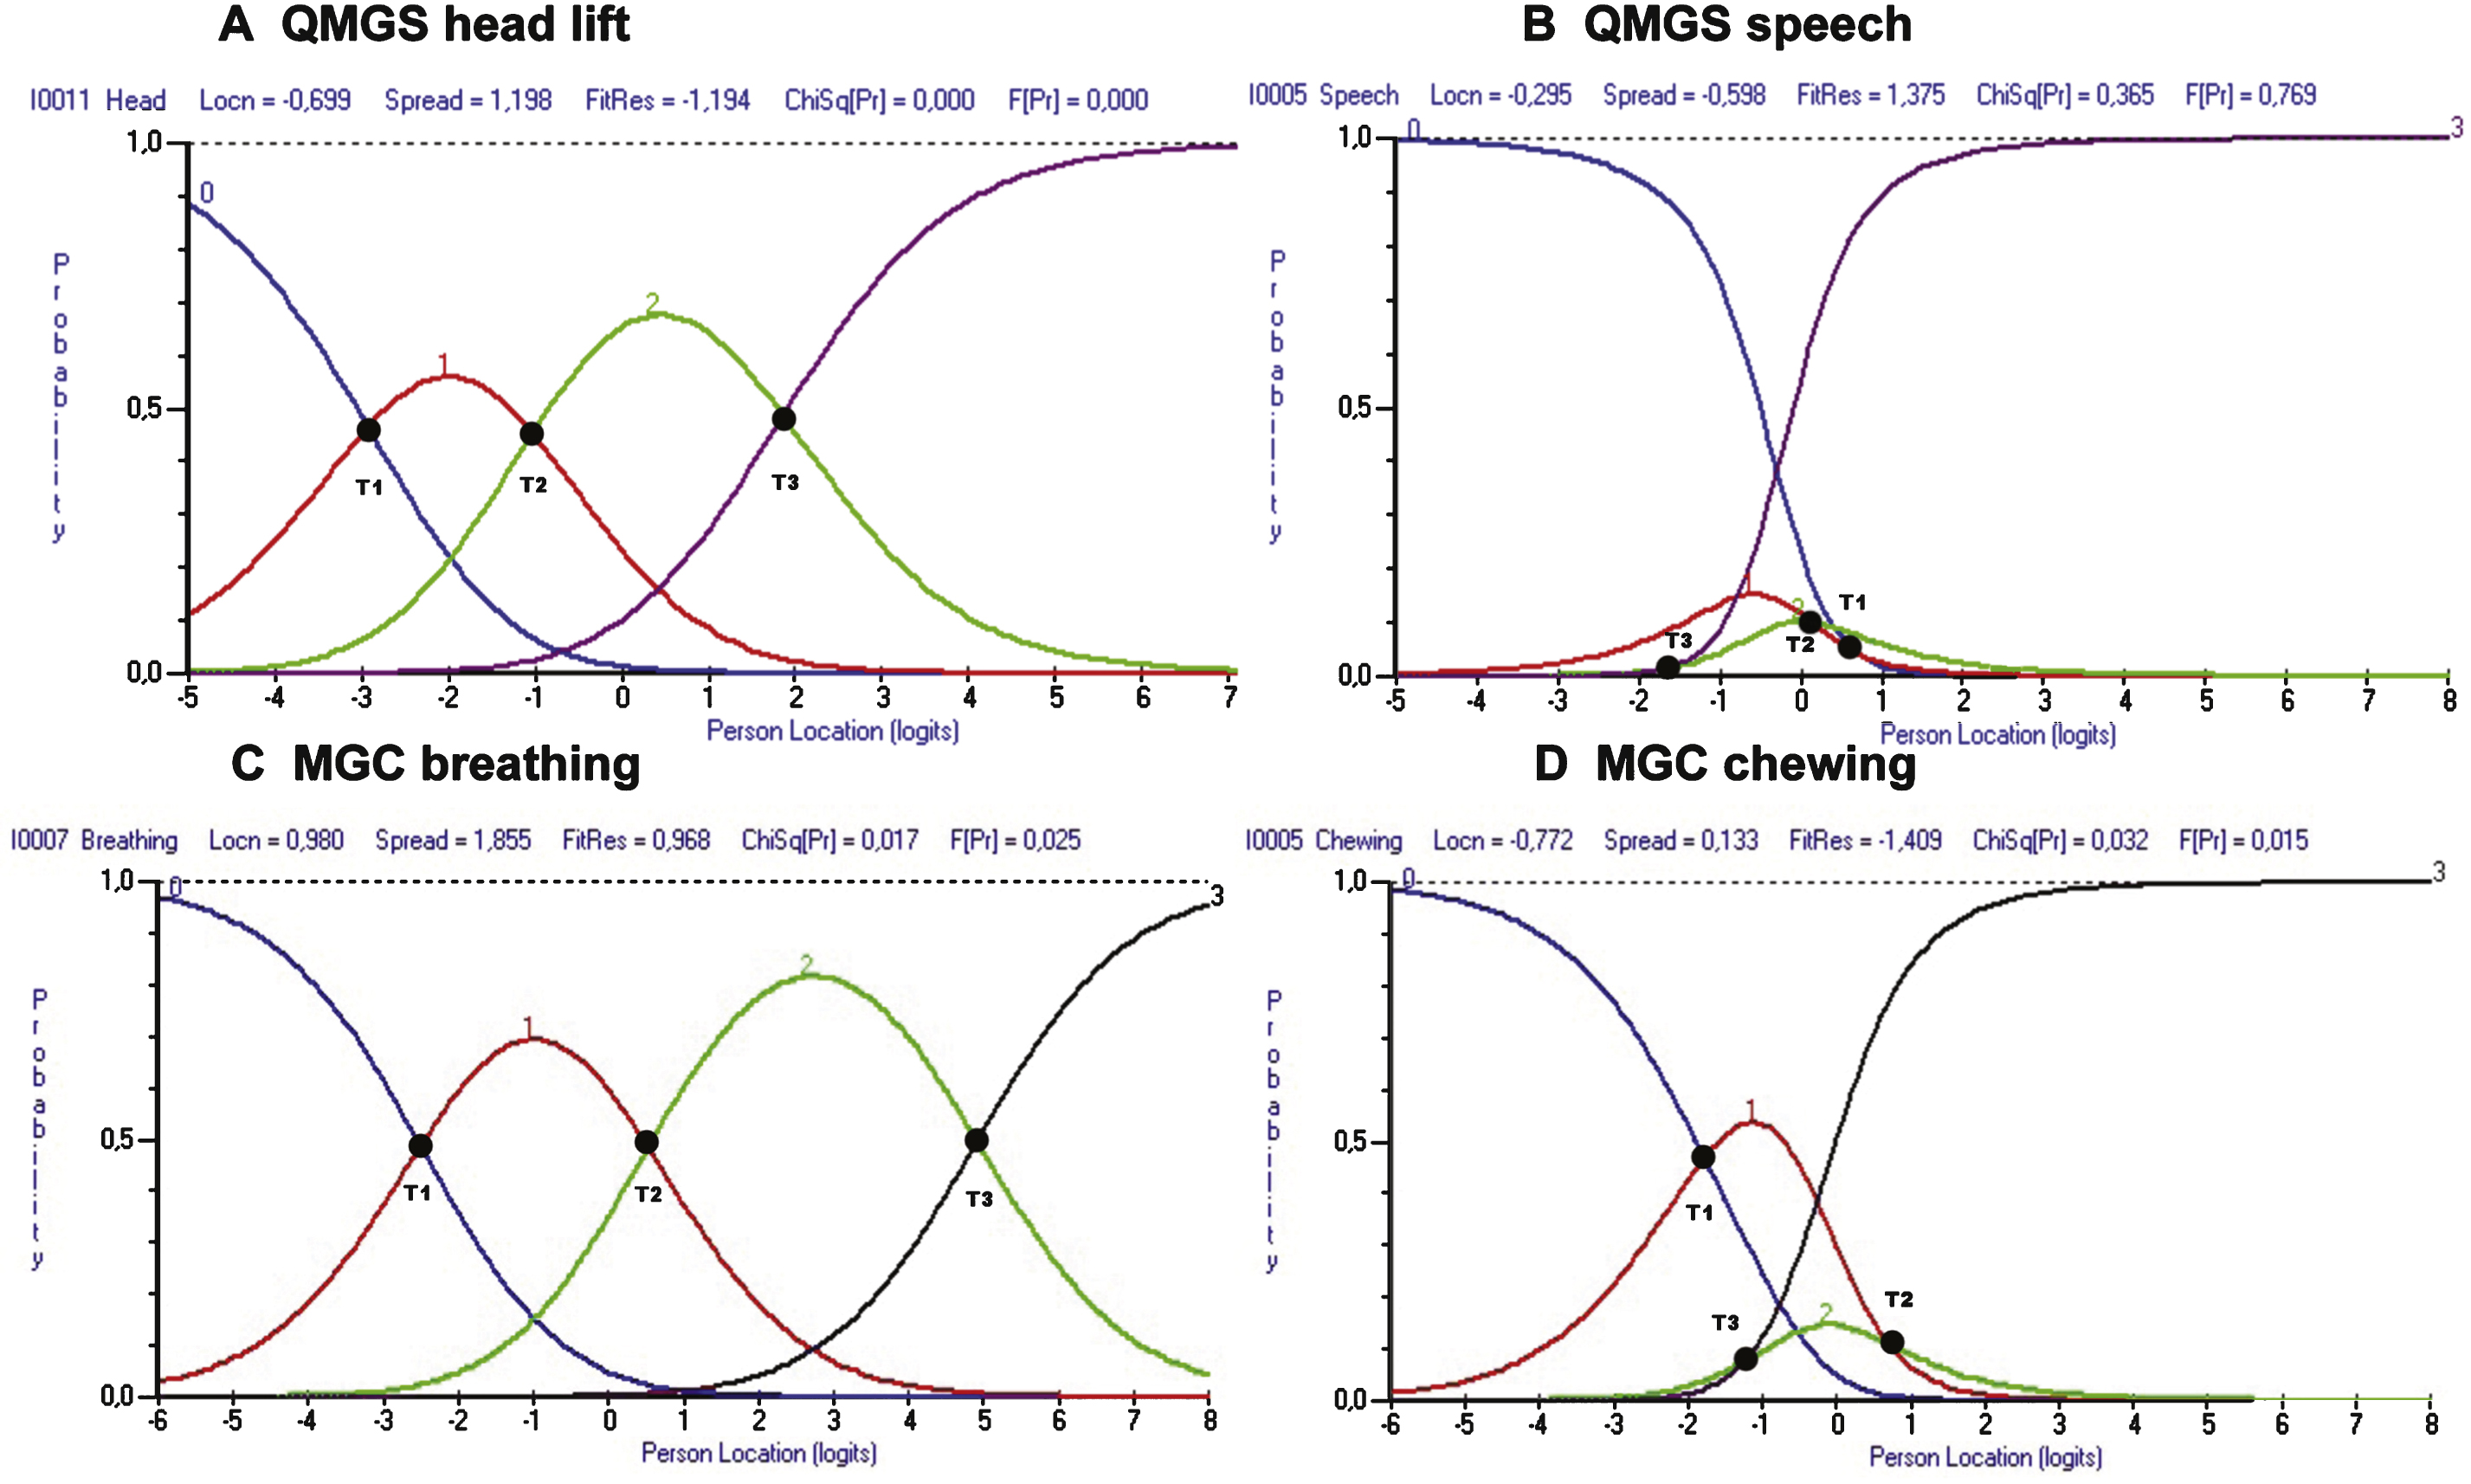
Fig.4
Item hierarchy. The item locations don’t follow the expected order. For example in the MGC, the eye closure item is representing more disease severity than chewing, swallowing and hip flexors strength. In the QMGS, the breathing item is the one representing the least disease severity.
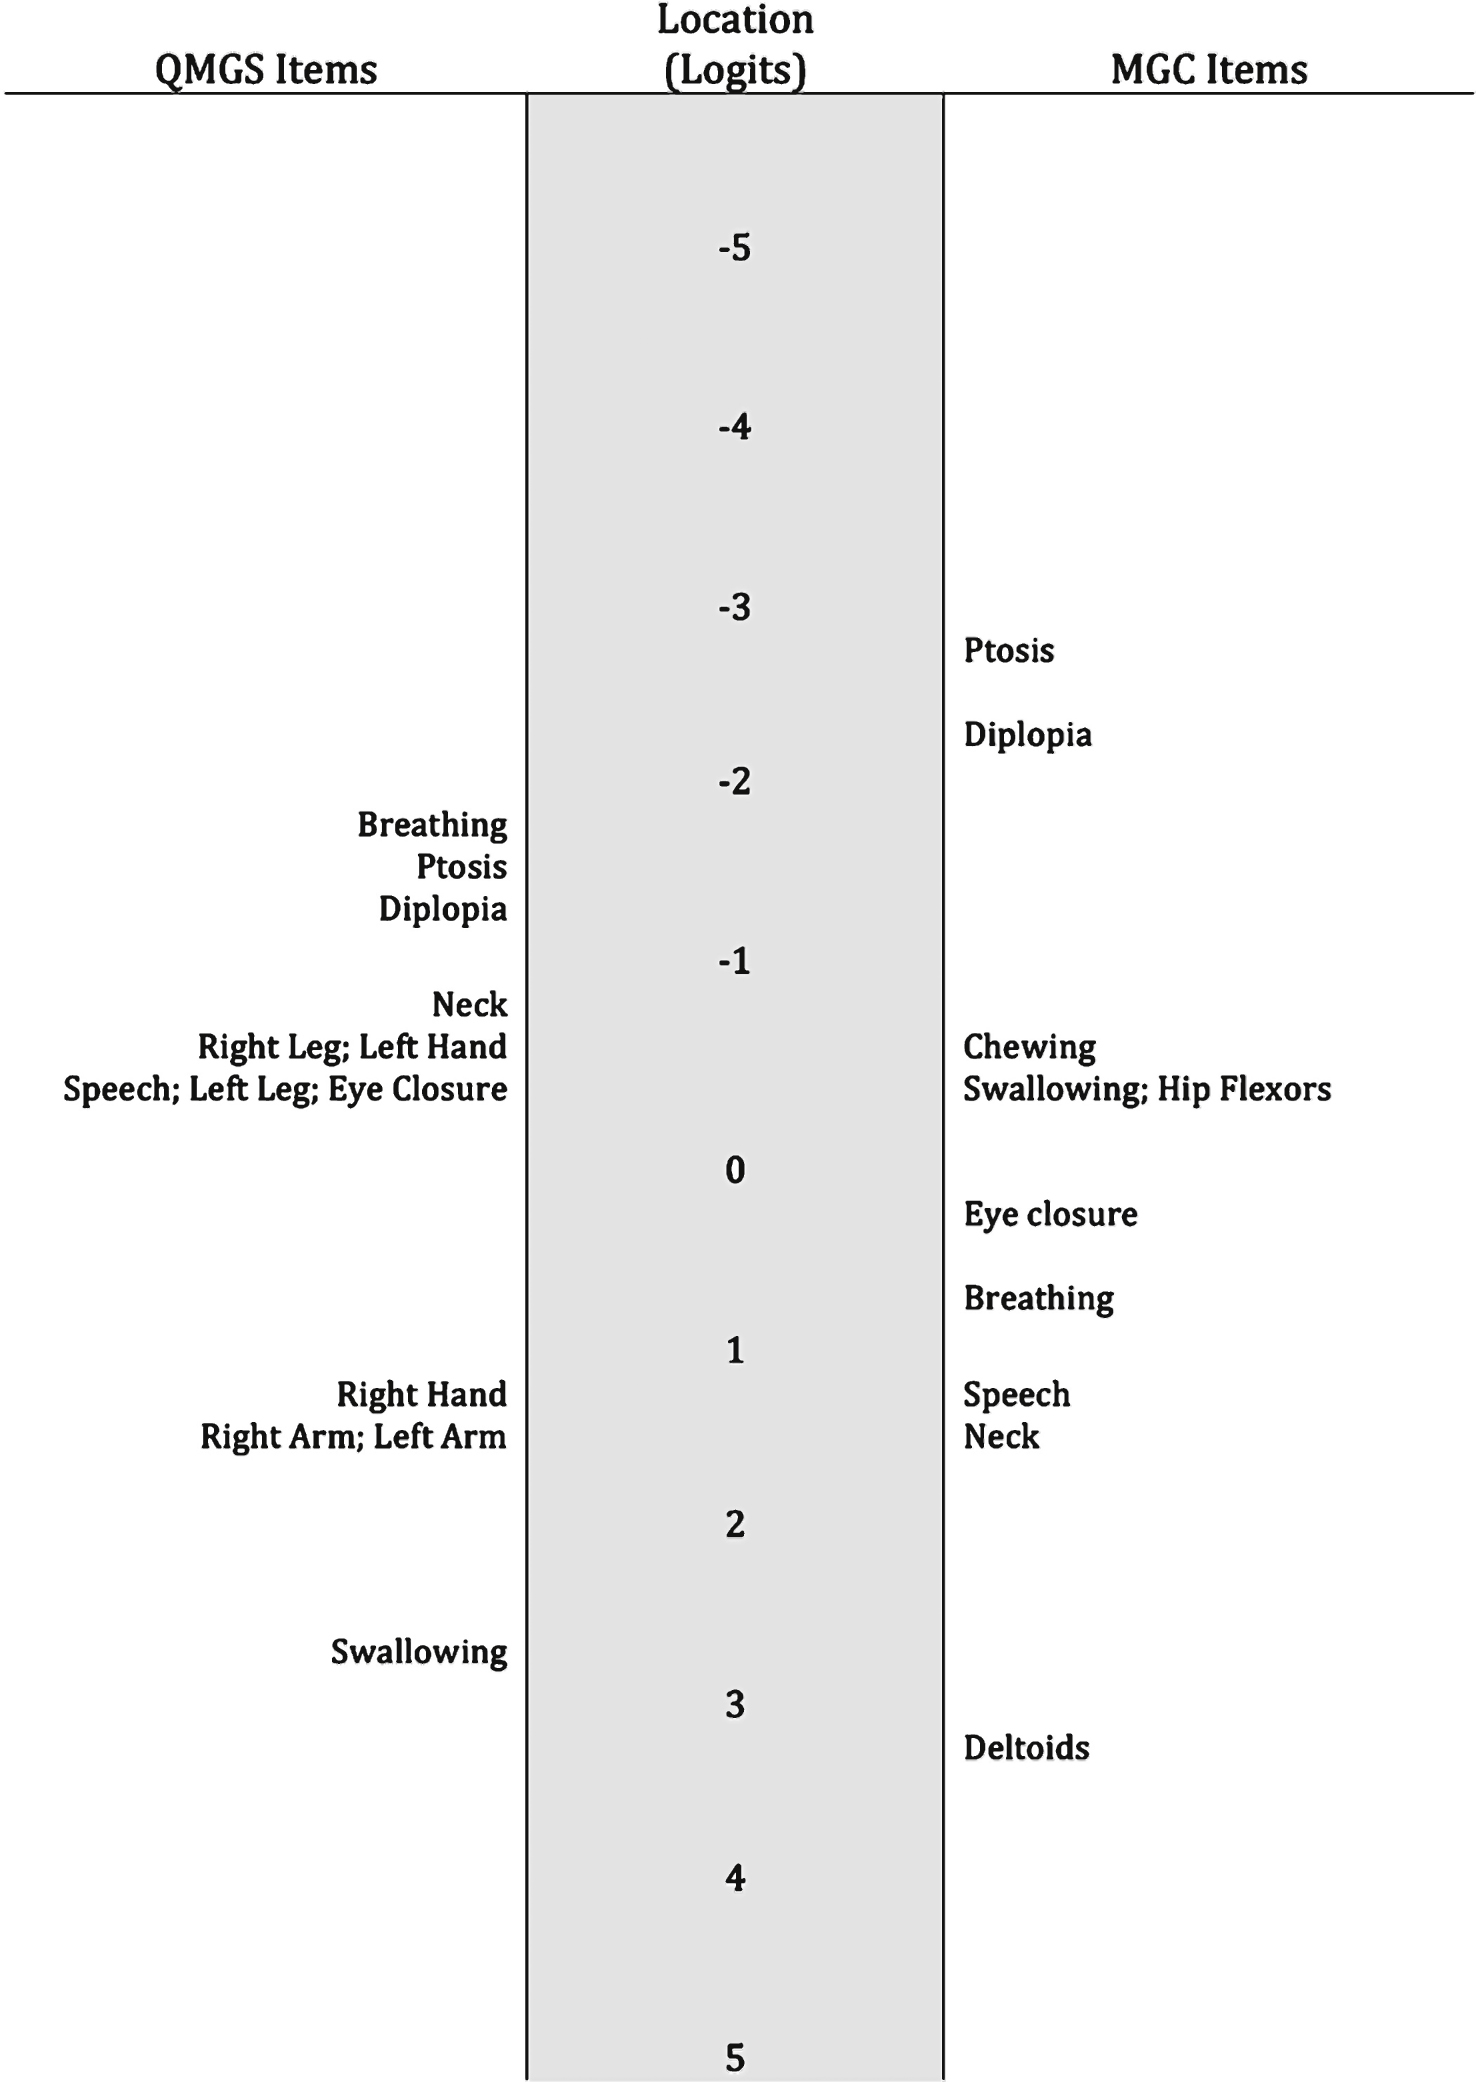
Table 1
Demographic Characteristics of 251 patients with Myasthenia Gravis assessed with the QMGS and the MGC
| Variable | Mean ± SD or n(%) |
| Sex (Female/Male) | 142(56.6%)/109(43.4%) |
| Age (years) | 57 ± 16.6 |
| Type (Ocular/Generalized) | 42(16.7%)/209(83.3%) |
| MGFA Remission | 9(3.6%) |
| MGFA MM | 12(4.8%) |
| MGFA I | 52(20.7%) |
| MGFA II | 145(57.8%) |
| MGFA III | 29(11.5%) |
| MGFA IV | 4(1.6%) |
| Disease Duration (months) | 103 ± 105 |
| Thymoma | 61(24.3%) |
| Thymectomy | 115(45.8%) |
| AchRAb (n = 90) | 63(70%) |
| QMGS total score | 7.6 ± 4.6 |
| MGC total score | 3.9 ± 4.3 |
MGFA: Myasthenia Gravis Foundation of America. MM: Minimal manifestation status. AchRAb: Acetylcholine receptor antibodies. QMGS: Quantitative Myasthenia Gravis Score. MGC: Myasthenia Gravis Composite.
Table 2
Summary statistics of global model fit for the QMGS and the MGC
| QMGS | MGC | |
| Chi squared p value | <0.0001 * | 0.02 * |
| Persons Location (Mean ± SD) | –2.48 ± 0.9§ | –3.16 ± 0.86§ |
| Persons Fit Residuals (Mean ± SD) | –0.23 ± 0.73 | –0.14 ± 0.84 |
| Items Location (Mean ± SD) | 0 ± 1.7 | 0 ± 1.47 |
| Items Fit Residuals (Mean ± SD) | –0.3 ± 0.66 | 0.08 ± 2.4 |
| Person Separation Index | 0.70 | 0.14 † |
| Cronbach’s alpha | 0.74 | 0.66 |
| Test of Unidimensionality | 12%Ω | 2.80% |
*Significant p-values of the chi-squared test indicate poor fit to the Rasch model. §The mean persons locations should be around 0. It is skewed towards lower severity in both scales, indicating poor targeting. †The Person Separation Index (PSI) should have a minimum of 0.7, although values of 0.8 are suggested for use in groups and 0.9 for individuals. The low PSI indicates poor discrimination of the MGC in this population. Ω A value >of 5% of significant t-tests of the principal component analysis is indicative of multidimensionality.
Table 3
Item fit statistics
| QMGS | MGC | |||
| Item | Residuals | P value | Residuals | P value |
| Ptosis | 2.59 # | <0.0001 * | –0.048 | 0.75 |
| Diplopia | 2.56 # | <0.0001 * | –0.007 | 0.17 |
| Facial | 1.06 | 0.69 | 0.026 | 0.21 |
| Swallowing | –0.36 | 0.38 | –0.09 | 0.18 |
| Speech | 1.38 | 0.35 | –0.32 | 0.42 |
| Chewing | – | – | –1.4 | 0.03 |
| Breathing | 4.33 # | <0.0001 * | 0.96 | 0.01 |
| Neck | –1.16. | 0.00003 * | –0.54 | 0.58 |
| Deltoid | – | – | –1.18 | 0.19 |
| R arm | –2.77 # | <0.0001 * | – | – |
| L arm | –3.09 # | <0.0001 * | – | – |
| Hip Flexors | – | – | –0.37 | 0.26 |
| R Leg | –2.4 | <0.0001 * | – | – |
| L Leg | –2.4 | <0.0001 * | – | – |
| R grip | 0.86 | 0.08 | – | – |
| L grip | 1.37 | 0.12 | – | – |
# Indicates residuals outside the –2.5/2.5 range, indicating item misfit. *Indicates significant p-value for ANOVA test. Using Bonferroni correction, significance to detect misfit is <0.0038 for the QMGS and <0.005 for the MGC.


