
Spinal Muscular Atrophy Biomarker Measurements from Blood Samples in a Clinical Trial of Valproic Acid in Ambulatory Adults
Abstract
Background: Clinical trials of therapies for spinal muscular atrophy (SMA) that are designed to increase the expression the SMN protein ideally include careful assessment of relevant SMN biomarkers.
Objective: In the SMA VALIANT trial, a recent double-blind placebo-controlled crossover study of valproic acid (VPA) in ambulatory adult subjects with SMA, we investigated relevant pharmacodynamic biomarkers in blood samples from SMA subjects by direct longitudinal measurement of histone acetylation and SMN mRNA and protein levels in the presence and absence of VPA treatment.
Methods: Thirty-three subjects were randomized to either VPA or placebo for the first 6 months followed by crossover to the opposite arm for an additional 6 months. Outcome measures were compared between the two treatments (VPA and placebo) using a standard crossover analysis.
Results: A significant increase in histone H4 acetylation was observed with VPA treatment (p = 0.005). There was insufficient evidence to suggest a treatment effect with either full length or truncated SMN mRNA transcript levels or SMN protein levels.
Conclusions: These measures were consistent with the observed lack of change in the primary clinical outcome measure in the VALIANT trial. These results also highlight the added benefit of molecular and pharmacodynamic biomarker measurements in the interpretation of clinical trial outcomes.
INTRODUCTION
Spinal muscular atrophy (SMA) is a leading genetic cause of death in infants and exhibits a wide range of clinical severity [1]. Clinically, SMA is characterized by skeletal muscle weakness and, in a substantial majority, respiratory insufficiency and premature death. SMA is caused by homozygous deletion or mutation in the SMN1 (survival motor neuron 1) gene, which results in reduced expression levels of full-length SMN protein [2]. In humans, a nearly identical gene, SMN2 (survival motor neuron 2), is present at the same genomic region and differs from SMN1 by a single nucleotide substitution that results in the exclusion of exon 7 in approximately 90% of SMN transcripts [3, 4]. The mRNA that results, SMNΔ7, produces a truncated protein that is non-functional and targeted for degradation [5]. Copy number of SMN2 correlates inversely with clinical severity in humans as well as motor function and survival in murine SMA models [6–9]. The principle function of the SMN protein is in the assembly of spliceosomal small nuclear ribonucleoprotein (snRNP) complexes that ultimately may cause disease by altering the transcriptome of motor neurons and other relevant cells [10].
Drug development for SMA has focused on the discovery of agents that increase the expression of SMN. Valproic acid (VPA) is a histone deacetylase inhibitor (HDACi) used primarily in the treatment of epilepsy and headache disorders and has been shown to increase the expression of full-length SMN protein in SMA patient fibroblasts [9, 11–13], blood samples [9, 14] and in SMA mouse models [15]. Several open-label and double-blind clinical trials to assess the efficacy of VPA in SMA patients have failed to clearly demonstrate a benefit, although ongoing controversy remains as to whether individuals or subgroups of patients may be responding in terms of improved motor function [16–19]. The term, “responder” has also been applied to individuals who demonstrate an increase in SMN mRNA in response to VPA administration and it is estimated that ∼33% of enrolled subjects in these studies are “responders” by this definition [20–22]. However, no single trial has as yet demonstrated a clear correlation between improved motor outcomes and a measurable and correlated change in an SMN related biomarker.
Recently, a phase 3 prospective, randomized, placebo-controlled crossover trial of VPA in ambulant adults with SMA (VALIANT) demonstrated a lack of clinical efficacy as measured by a change in maximum voluntary isometric contraction testing (MVICT) (ClinicalTrials.gov identifier NCT00481013) [16]. In that study, subjects with SMA type 3 were randomized to Group 1, who received VPA for 6 months followed by placebo for 6 months, and Group 2 who received placebo for 6 months and then VPA for 6 months. Because the study involved adults, it was possible to obtain a larger volume of blood during the study than is practical in infants or children. This provided the opportunity to investigate whether oral VPA had the intended pharmacodynamic effects in circulating peripheral blood mononuclear cells (PBMCs) during the course of the trial. It was expected that VPA would lead to increased expression of full-length SMN mRNA transcripts and protein via an inhibition of histone deacetylation activity, and that an increase in SMN expression would lead to an increase in an SMN-dependent activity, snRNP assembly.
We show here that, although VPA did significantly alter the acetylation pattern of the major histone H4 in PBMCs, there was insufficient evidence to suggest a significant effect on either SMN full-length mRNA, SMNΔ7 mRNA or SMN protein levels in this crossover design study. We also attempted to measure the SMN-dependent snRNP assembly capacity in PBMC samples. These results are consistent with the lack of a positive clinical outcome in the VALIANT trial and provides, for the first time, evidence that VPA did not have the expected molecular effects in humans.
MATERIALS AND METHODS
Patient demographics and sample collection
Thirty-three patients were enrolled in the VALIANT Study (ClinicalTrials.gov identifier NCT00481013). Two patients terminated the study early after visit 2 (V2); therefore, longitudinal samples existed for 31 patients. The mean age was 37.2 years (range: 19.9–55.3 years). The VALIANT study employed a crossover design where subjects were randomized to either receive oral VPA or placebo at the baseline visit, V2. The crossover occurred six months later at visit 4, V4. After an additional six months, subjects were evaluated for the last time at visit 6, V6. Blood samples for this study were collected at V2, V4 and V6 (Fig. 1).
Peripheral blood samples were processed within five hours of collection and stored until the end of the clinical trial. A total of ∼27 ml of blood were collected at each visit without complication. The average number of PBMCs from a single CPT tube (8 ml capacity) was 4.86×10⁶ cells (Range: 3×10⁵–1.36×10⁷ cells). Blood draws for SMN mRNA quantification were collected using PAXgene Blood RNA tubes (BD Diagnostics) during visit V2, V4, and V6. RNA was prepared as previously described [23]. RNA quantity and quality was monitored using Nanodrop ND-1000 (Thermo Scientific, Wilmington, DE). Blood draws to determine HDAC activity and SMN protein levels were collected during visit 2, 4 and 6 using BD Vacutainer Cell Preparation Tubes (CPT) with heparin. Three tubes were drawn (∼8 ml of blood/tube) and transported to the lab within 3 hours of the blood draw. The peripheral mononuclear blood cells (PBMCs) were extracted from the whole blood sample, washed in phosphate-buffered saline (PBS), resuspended in freezing media (20% FBS and 10% DMSO), aliquoted into three separate cryopreservation tubes, then stored in liquid nitrogen [24]. Prior to each assay, cryopreserved PBMC samples were thawed in a 37°C water bath for 2 minutes, washed in PBS and counted with an automated NucleoCounter ® cell counter (New Brunswick Scientific). The average cell viability was 88.8% (SD = 8.7% ) on the day of the assay.
Serum VPA levels were measured separately, drawn two to three weeks after the initiation of the study at visits V2, V4, and V6, and until therapeutic levels were obtained (target: 50 μg/ml–100 μg/ml). The average VPA level throughout the trial, from both Group 1 and Group 2 was 58.5 μg/ml (SD = 16.7 μg/ml).
The study was approved by the institutional review board at the Ohio State University Wexner Medical Center, and written informed consent was obtained from all subjects.
Nuclei isolation and histone extraction
Histones were extracted from PBMCs as described by Ren et al. and Wang et al. [25, 26]. Approximately 1×10⁷ cells were pelleted at 200×g and placed in 1 ml of NP-40 extraction buffer (10 mM Tris-HCL pH 7.4, 10 nM NaCl, 3 mM MgCl2, 0.5% NP-40, 0.15 mM Spermine, 0.5 mM Spermidine (aq) supplemented with a cocktail of protease inhibitors (catalog #: 11-836-170-001, Roche Diagnostics, Manheim, Germany) for ten minutes on ice. Nuclei were pelleted and washed in ice-cold PBS. Histones were extracted from chromatin by the addition of 400 μl of 0.4 N H2SO4 then placed on ice for 30 minutes. Denatured proteins were pelleted by centrifugation in a microcentrifuge for 10 minutes. Histones were precipitated from the supernatant overnight at −20°C with acetone. Pellets were washed with acetone and resuspended in HPLC-grade water.
Liquid chromatography mass spectrometry (LC-MS)
Extracted histones were subject to a modification of the LC-MS method as previously described [27, 28]. HPLC separation was performed on a Dionex Ultimate 3000 capillary/nano HPLC (Dionex, Waltham, MA) in line with an amaZon ETD (Brucker, Billerica, MA) mass spectrometer. Approximately 100 ng of extracted histones were separated on a 0.3×150 mm Magic C8 column (5 μm, 300 Å, Michrom Bioresources, Auburn, CA). Mobile phases were HPLC water (J.T. Baker, Center Valley, PA) and acetonitrile (EMD Millipore, Billerica, MA) each supplemented with 0.5% formic acid (v/v Acros Oeganics, Waltham, MA). Starting at 20% B for 5 minutes, the gradient increased to 30% B at 25 minutes and 35% B at 65 minutes each with a convex curvature of 2. From 65 to 78 minutes, the gradient increased from 35% to 48% B with a convex curvature of 4. The column was equilibrated back to 20% B 12 minutes. Blank injections of the same gradient were made between each sample injection. The ion chromatogram of the 1131.7 Da ion of histone H4 was extracted from the histone H2A and H4 co-elution peak (RT: ∼43–49 minutes). Deconvolution of the mass spectral data was conducted across the largest extracted ion chromatographic peak. MaxEnt deconvolution and data analysis of peak areas was conducted using the Bruker ESI Compass Data Analysis 1.3 software for amaZon (ver 4.0 SP4, Bruker, Billerica, MA).
SMN mRNA measurements
Absolute quantification of full-length SMN, SMNΔ7, as well as GAPDH transcripts was determined as described by Tiziano et al. [29]. RNA was extracted from patient whole blood samples using PAXgene vacutainer tubes (BD) and Kit (QIAGEN) using the QIAGEN protocol. Extracted RNA was quantified using the NanoDrop 2000 spectrophotometer (Thermo Scientific) and subsequently stored at −80°C until all samples were collected. 1 μg of total RNA was converted to cDNA using High Capacity cDNA Reverse Transcription Kit (ABI) and the company’s protocol. Total cDNA were diluted 1:4 (representing ∼10 ng of cDNA per quantification). Published TAQMAN probes were used for the SMN transcript assays run on the ABI 7500 Real-Time PCR System (Applied Biosystems) [29]. Quantification of GAPDH transcripts was done to monitor the quality of the RNA/cDNA preparations and amplification reactions. Standard curves, prepared from plasmid stock solutions for FL-SMN, SMN2Δ7 and GAPDH plasmids, were used for absolute quantification of patient RNA samples.
SMN protein ELISA
The SMN ELISA Kit (Enzo Life Sciences; catalog # ADI-900-209) was used to quantify human SMN protein levels from PBMCs. Cryo-preserved PBMCs were thawed, washed in PBS, and lysed using an extraction reagent provided by the manufacturer. Proteins were isolated and quantified using the Bradford assay (Bio-Rad, catalog: 5000-00006). 200 ng of total protein was processed in triplicate for each sample in 96-well SMN ELISA plates according to the manufacturers instructions. All samples were processed on the same day using four 96-well SMN ELISA plates by a blinded investigator (SRR). Absorbance measurements were made using a Tecan Infinite F200 microplate reader. The standard curve of recombinant SMN protein was measured on each plate and ranged from 50 to 3200 pg/ml. The coefficient of variation (CV) was calculated using the following equations:
Intra-assay CV = ([mean of the standard deviationsof the meanstriplicates]/[mean of the meanstriplicates])×100 Inter-assay CV = ([mean of the standard devi-ation of the meanscontrol sample]/[mean of the meanstriplicates])×100
SMN cell immunoassay
Cell immunoassays were performed as previously reported [24]. White, clear-bottomed 96-well plates were pre-coated with poly-ornithine (Sigma) and left at 37°C. 5×10⁴ cells/well were added to the plate and centrifuged at 700×g for 5 minutes at room temperature. The cells were then fixed to the plate with 4% paraformaldehyde for 15 min and washed with PBS using a Biotek ELX405 automatic plate washer. Cells were permeabilized with 0.1% Triton for 5 min and blocked with 20% FBS for 30 minutes. The antibodies used for this assay were SMN (monoclonal antibody 8/SMN) (1:500) BD Transduction LaboratoriesTM) and Y12 (anti - sm Ab-1 Thermo Scientific) (1:1000). The plates were washed and bound antibodies were detected using peroxidase-conjugated (goat anti-mouse IgG Millipore 12-349) and Supersignal ® ELISA Femto Maximum Sensitivity Substrate (Thermo Scientific). Human control PBMCs (Astarte Biologics, Redmond, WA) were processed in triplicate on each plate to monitor inter-assay CV. The luminescent intensity within each well was measured using the Tecan Infinite F200 microplate reader. SMN protein levels are expressed as the ratio of the SMN signal to the Y12 signal.
snRNP assembly assay
snRNP assembly assays were performed using a magnetic bead assay with biotinylated U4 or U4ΔSm snRNAs essentially as described in [30]. Briefly, HeLa cytoplasmic cell extracts were prepared as described [31]. Control PBMC pellets (Astarte Biologics, 5-10 million cells) were resuspended in lysis buffer (20 mM Tris, pH 8.0; 50 mM KCl; 5 mM MgCl2; 0.1% NP-40). PBMCs were then sonicated three times for 5 sec, centrifuged at 15,000×g for 20 min at 4°C and the supernatant was then used to measure snRNP assembly. snRNAs were prepared by in-vitro transcription in the presence of biotin-UTA as described [30]. For the assembly reactions, 12.5 or 25 μg extracts were incubated with 10 nM biotinylated snRNA at 30°C for 1 hour in buffer (20 mM Tris, pH 8.0; 50 mM KCl; 5 mM MgCl2; 0.25 μg/ μl tRNA, 2.5 mM ATP, 1 μg/ μl RNaseOUT, 0.01% NP-40). Magnetic beads(Invitrogen) with immobilized Y12 antibody (Lab Vision) were then added to immunoprecipitate Sm cores. Beads were washed extensively with RSB-500 (10 mM Tris, pH 7.4; 500 mM NaCl; 2.5 mM MgCl2) with 0.1% NP-40. High Sensitivity NeutrAvidin-HRP (Pierce) was then added 1:25,000 into the wash buffer and incubated again at 30°C for 1 hour. The beads were washed extensively with the same buffer and resuspended in Supersignal ELISA Femto Substrate (Pierce). The plates were then read with the Tecan Infinite F200. The background signal from an assembly reaction lacking snRNA was subtracted from all readings.
Statistics
For the 2-period 2-treatment crossover study, outcomes collected at the end of each period were analyzed using a standard crossover analysis of the outcomes at months 6 and 12. Linear mixed effects models were applied to the data including fixed effects for sequence (group), visit and treatment and a random effect at the subject level [32]. For modeling purposes, log-transformation was applied to the ELISA and cell immunoassays along with the FL-SMN and SMNΔ7 RNA outcomes due to the skewed nature of the data. Exploratory analyses were performed including using responder classification and copy number as covariates. Patients were arbitrarily classified as a ‘responder’ based on their Mass Spectrometry Area Ratio (MS AR) values. A patient is classified as a responder if their percent change from baseline VPA use is at least 15% . Additional summary statistics were generated for all variables of interest by time andgroup.
Results
Histone H4 acetylation is increased by VPA in PBMCs
VPA alters gene expression via inactivation of histone deacetylases that results in an increase in the acetylation of major histone proteins in the nucleus. The major histone H4 provides a reliable readout of HDAC activity and has been used to confirm the activity of HDAC inhibition (HDACi) in clinical trials [33, 34]. To confirm the HDACi activity of VPA in the VALIANT trial, we directly measured the acetylation pattern of histone H4 in PBMCs by LC-MS. The typical LC-MS spectra of histone H4 shows that the bulk of this histone is found in two distinct peaks (Fig. 2A). The most abundant form (11,307 Da) represents di-methylated H4 that is modified on lysine 20. The second most abundant peak (11,349 Da) represents H4 that is di-methylated and mono-acetylated. The average area ratio of the 11,349 Da peak/11,307 Da peak in peripheral blood samples was altered by VPA. In Group 1 (VPA/Placebo) the mean MS area ratio (MS AR) decreased from 0.70 (SD = 0.08) at V4 to 0.62 (SD = 0.12) at V6. In Group 2 (Placebo/VPA) the mean MS AR increased from 0.60 (SD = 0.10) at V4 to 0.68 (SD = 0.09) at V6. Treatment with VPA had a significant effect on MS AR in the presence of visit and group (p = 0.005) (Fig. 2B).
As an exploratory analysis to account for the possibility that some subjects may be insensitive to HDAC inhibition at therapeutic VPA serum levels, we compared the MS AR for all subjects before and after 6 months of VPA (V2 – V4 period in Group 1 and V4 - V6 period in Group 2). We arbitrarily defined “Responder” as a subject whose MS AR increased by at least 15% after 6 months of VPA. This increase is well above the test-retest variability of 3% to 5% that we have reported for a standard bovine histone standard run on the same instrument [35]. Twelve patients could not be classified as a “Responder/Non-Responder” due to missing data. Of those patients who were classified 15 (71% ) were considered a “Responder” while 6 (29% ) were considered a “Non-Responder” (Fig. 3).
Peripheral blood SMN mRNA expression was not significantly altered by VPA
To determine the effect of VPA on SMN expression, we analyzed whole blood SMN mRNA transcripts by qRT-PCR. The average total RNA yield collected was 78 ng/ μl (Range: 6 ng/ μl–214 ng/ μl). VPA did not have a significant treatment effect on FL-SMN mRNA levels (p = 0.790) (Table 1 and Fig. 4). In Group 1 (VPA/Placebo) the mean FL-SMN mRNA was 405.2 (SD = 218.3) mol/ng at V4 and 433.9 (SD = 195.5) mol/ng at V6. In Group 2 (Placebo/VPA) the mean FL-SMN mRNA increased from 343.3 (SD = 103.9) mol/ng at V4 to 424.2 (SD = 256.2) at V6; however this change was not statistically significant. Furthermore, there appears to be no significant relationship between the magnitude of HDACi activity response and increase in FL-SMN mRNA (Supplementary Figure 1A). To determine the overall effect of VPA on SMN2 gene transcription in PBMCs, we also measured SMNΔ7 mRNA levels and similarly found no significant treatment effect of VPA (p = 0.268). Taken together, VPA did not have a statistically significant treatment effect on SMN mRNA transcripts levels in VALIANT trial subjects.
SMN protein levels were not altered by VPA in PBMCs
To measure SMN protein levels in PBMCs, we used the commercially available SMN ELISA Kit from Enzo Life Sciences. The assay was performed using four 96-well plates each with a purified SMN protein titration standard curve and a control PBMC sample to measure plate-to-plate variability. Each standard curve was reproducible (slope range: 0.0005–0.0009 OD/(pg/ml), N = 4) and had r2 values above 0.988. Using the SMN ELISA as an outcome, VPA did not have a significant treatment effect on SMN protein levels (p = 0.5446) (Table 2 and Fig. 5A and B). In Group 1 (VPA/Placebo) the mean SMN protein level was 442.8 (SD = 260.7) pg/ml at V4 and 402.4 (SD = 311.5) pg/ml at V6. In Group 2 (Placebo/VPA) the mean SMN protein level was 438.1 (SD = 254.3) pg/ml at V4 and 372.2 (SD = 182.1) pg/ml at V6. The Inter-Assay CV was 5.94% (N = 4 plates) and the intra-assay CV was 9.65% for the SMN ELISA. SMN2 copy number was included as a covariate in the mixed model using SMN protein as an outcome and was statistically significant (p = 0.005). This indicates that, in general, SMN protein levels were higher in patients with 4-5 SMN2 copies (N = 8) vs subjects with 2-3 SMN2 copies (N = 12).
Because of the large degree of variability in these measurements, we performed a secondary analysis on SMN protein levels using only the subjects who we had defined previously as “Responders”. Despite this refinement, VPA still did not have a significant treatment effect on SMN protein levels (p = 0.709). As with the SMN FL-SMN mRNA levels, there appears to be no significant relationship between magnitude of HDACi activity and increase in SMN protein levels in PBMCs (Supplementary Figure 1B).
SMN protein levels were also determined using an SMN cell immunoassay previously described [8, 24]. The immunoassay was performed using six 96-well plates each with a control PBMC sample to measure plate-to-plate variability. Consistent with the ELISA data, VPA did not have a significant crossover effect of SMN protein levels when measured by the SMN cell immunoassay (p-value = 0.9087) (Table 2 and Fig. 5C). The Inter-Assay CV was 27.75% (N = 6 plates) for the SMN immunoassay and the intra-assay CV was 30.04% for the SMN immunoassay.
SMN-dependent snRNP assembly capacity was not detected in PBMCs
The primary established biochemical activity of SMN is the assembly of Sm-protein cores on snRNAs. Consequently, it would be extremely useful to determine if Sm core assembly activity was increased in PBMCs from VPA-treated patients. A quantitative assay for SMN activity was developed by Dreyfuss and co-workers [30] and is based on quantitative detection of the incorporation of biotinylated snRNAs into snRNPs. Assay conditions were optimized to accurately quantitate and detect differences in snRNP assembly in HeLa cell extracts resulting from the reduction of SMN by RNAi. Under these conditions, we readily detected SMN activity in HeLa extract, however we were unable to detect significant SMN activity from extracts derived from PBMCs. SMN-dependent snRNP assembly activity in PBMCs was approximately 35-fold lower than in HeLa cells, was not linear with extract amount, and was not significantly higher than the negative control reactions with U4ΔSm (Fig. 6A). As expected, Western blot of SMN protein expression was significantly lower in control PBMC extract compared to the same amount of HeLa extract (Fig. 6B, C). We conclude that the current snRNP assembly assay is not sensitive enough to measure SMN-dependent snRNP assembly activity in PBMCs.
DISCUSSION
The putative mechanism of VPA and related small fatty acid molecules in the treatment of SMA has been their reliable ability in vitro to increase SMN mRNA expression via HDAC inhibition. A decrease in HDAC activity leads to an increase in the level of acetylation of histones, the primary proteins responsible for the packaging of genomic DNA into chromatin. The increased histone acetylation creates a chromatin structure that is more open and permissive for transcription. One potential drawback of HDAC inhibitors as therapeutics is that the effect on histone acetylation occurs throughout the genome and they cannot be used to alter the expression of a specific gene, such as SMN2. To date, several clinical trials have failed to demonstrate clinical benefit utilizing longitudinal assessments of motor function. There are a number of possible explanations for why VPA might fail to improve motor function outcomes. Motor function is complex and potentially influenced by age and clinical heterogeneity among subgroups of enrolled subjects. In the VALIANT trial, we minimized this issue by using a double-blind placebo-controlled crossover design in which each subject serves as his or her own control. However, several additional possible reasons for failure exist. A first possibility is that the VPA levels achieved failed to inhibit its molecular target, HDACs, in vivo. However, novel to this study, we confirmed statistically significant HDAC inhibition did occur in PBMCs of VALIANT participants at the serum VPA levels achieved. A second explanation is that SMN expression levels did not increase in vivo in response to VPA-induced HDAC inhibition. Our data support the latter explanation and may explain the lack of clinical improvement in the VALIANT trial. While it is possible that in vivo alterations in SMN expression levels in PBMCs are not indicative of similar changes in motor neurons, this seems unlikely since VPA easily crosses the blood brain barrier. However, it is conceivable that serum VPA levels, duration of treatment or the degree of change in HDAC inhibition were insufficient to elicit a significant alteration on motor neuron histone acetylation and SMN expression in vivo. Additionally, some patients may be resistant to VPA-induced increases in SMN expression. A recent report indicated that the expression of fatty translocase CD36 correlated with an absence of increased SMN expression in response to VPA and supports the idea that subpopulations of individuals are resistant to the SMN-inducing effects of VPA making CD36 an interesting biomarker for trials of HDAC inhibitors [21].
While the SMN mRNA levels clearly show no change in response to VPA in this study, the absolute SMN mRNA full-length transcript levels detected in this study were higher than the absolute levels of SMNΔ7 transcripts and consistently exceeded those previously reported in the literature [16, 36]. Because of batch differences in the establishment of standard curves for FL-SMN and SMNΔ7, data analysis was restricted to the assessment of changes compared to baseline transcript levels. Consequently, our data can only be used to assess changes in SMA transcript levels in the presence and absence of VPA. Inter-laboratory differences underscore the need for a standardized, commercially available, kit for absolute quantification of SMN transcripts.
The crossover design of the VALIANT study necessitated the need to look at group effects. In order for VPA to have a significant effect, the molecular biomarker (ie: SMN full-length mRNA) must not only increase in response to VPA, but it must also decrease after VPA has been withdrawn. We arbitrarily stratified participants according to the magnitude of HDAC inhibition in order to take into account the possibility that some subjects “responded” more than others; however, there was still no significant treatment effect of VPA on SMN protein levels and there appeared to be no correlation between the magnitude of HDACi activity and alterations in SMN mRNA or protein levels. Because of the small number of participants in the VALIANT study, we were unable to perform additional subgroup analyses. Nevertheless, the crossover design analysis employed here has the advantage of reducing the influence of confounding covariates (such as variability in biomarker measurements between individual subjects) because each crossover subject serves as his or her own control.
In our hands, the SMN protein ELISA was superior to the SMN cell immunoassay in terms of inter and intra-plate reliability. Nevertheless, neither protein assay was able to detect an alteration in SMN protein expression in the VALIANT trial, consistent with the absence of significant effect on FL-SMN mRNA. However, it is difficult to interpret these results given great degree of variability seen within groups. SMN protein immunoreactivity is sensitive to storage conditions and duration [37]. We attempted to optimize immunoreactivity by storing samples in liquid nitrogen and thawing only on the day of the assay, however it is unclear what effect this had on our results. Recently, a novel SMN protein assay based on a caged ruthenium electrochemiluminescence platform was reported to have superior sensitivity to the SMN ELISA (Philip Zaworski, personal communication) and future application of such an assay holds great promise for ongoing and future clinical trials.
Finally, our attempt to measure SMN-dependent snRNP assembly activity was thwarted by the sensitivity of the assay. The capacity to assemble biotinylated U1 snRNA into a U1 snRNP was not detectable in 50 μg of PBMC extract. This is likely a function of the relatively low abundance of SMN protein in PBMCs compared to fibroblasts. Using control (non-SMA) PBMCs, we estimate that accurate measurements of snRNP assembly capacity comparable to that observed in HeLa cells would require approximately 25 times the amount of blood collected in the VALIANT study, which is not practical in the setting of a clinical trial. We conclude that this is not a feasible assay for clinical trial use in its current form.
An ideal SMA biomarker would faithfully report the expression levels of SMN protein in motor neurons and other relevant cell types in the nervous system in real time. This study highlights the importance of direct measurement of surrogate molecular biomarkers in SMA clinical trials and illustrates many of the confounders implicit to these measurements. Currently, there are many exciting SMA clinical trials involving antisense oligonucleotide (ASO) and virus-mediated gene transfer technologies in addition to promising small molecules that are ongoing and planned. While the relationship between SMN expression levels in blood and in relevant cell types, such as motor neurons, is not clear, blood samples from individuals in these trials will remain an important source for molecular biomarker analysis. In the case of therapies that are delivered intrathecally, the relevance of SMN expression levels in peripheral blood is likely reduced. Current work to measure SMN levels in cerebrospinal fluid and correlations of these measurements with SMN levels in blood samples will be of great value in ongoing and future SMA clinical trials.
CONFLICT OF INTEREST
The authors have no conflict of interest to report.
ACKNOWLEDGMENTS
We thank Sharon Chelnick for research coordination, Scott Sutton for assistance with sample preparation and Valentina Ly for technical assistance. This project was sponsored by CureSMA. Dr. Kolb also receives support from NINDS (K08NS067282 and U01NS079163) and The Fred F. and Herman M. Dreier Fund. This work was also supported by grant R01GM062970 (M.R.P.) and R01NS077010 (D.J.B.). We thank Dione Kyobashi and the Spinal Muscular Atrophy Foundation for protocol optimization and guidance of the SMN ELISA. SJK had full access to all the data in the study and takes responsibility for the integrity of the data and the accuracy of the data analysis.
Appendices
The supplementary table and figure are available in the electronic version of this article: http://dx.doi.org/10.3233/JND-150081.
REFERENCES
1 | Kolb SJ, Kissel JT(2011) Spinal muscular atrophy: A timely reviewArchives of Neurology68: 8979984 |
2 | Lefebvre S, Burglen L, Reboullet S, Clermont O, Burlet P, Viollet L(1995) Identification and characterization of a spinal muscular atrophy-determining geneCell80: 1155165 |
3 | Lorson CL, Hahnen E, Androphy EJ, Wirth B(1999) A single nucleotide in the SMN gene regulates splicing and is responsible for spinal muscular atrophyProceedings of the National Academy of Sciences of the United States of America96: 1163076311 |
4 | Monani UR, Lorson CL, Parsons DW, Prior TW, Androphy EJ, Burghes AH(1999) A single nucleotide difference that alters splicing patterns distinguishes the SMA gene SMN1 from the copy gene SMN2Human Molecular Genetics8: 711771183 |
5 | Kashima T, Manley JL(2003) A negative element in SMN2 exon 7 inhibits splicing in spinal muscular atrophyNature Genetics34: 4460463 |
6 | Mailman MD, Heinz JW, Papp AC, Snyder PJ, Sedra MS, Wirth B(2002) Molecular analysis of spinal muscular atrophy and modification of the phenotype by SMN2Genet Med4: 12026 |
7 | Monani UR, Sendtner M, Coovert DD, Parsons DW, Andreassi C, Le TT(2000) The human centromeric survival motor neuron gene (SMN2) rescues embryonic lethality in Smn(-/-) mice and results in a mouse with spinal muscular atrophyHuman Molecular Genetics9: 3333339 |
8 | Sumner CJ, Kolb SJ, Harmison GG, Jeffries NO, Schadt K, Finkel RS(2006) SMN mRNA and protein levels in peripheral blood: Biomarkers for SMA clinical trialsNeurology66: 710671073 |
9 | Brichta L, Hofmann Y, Hahnen E, Siebzehnrubl FA, Raschke H, Blumcke I(2003) Valproic acid increases the SMN2 protein level: A well-known drug as a potential therapy for spinal muscular atrophyHuman Molecular Genetics12: 1924812489 |
10 | Workman E, Kolb SJ, Battle DJ(1462) Spliceosomal small nuclear ribonucleoprotein biogenesis defects and motor neuron selectivity in spinal muscular atrophyBrain Research9399 |
11 | Sumner CJ, Huynh TN, Markowitz JA, Perhac JS, Hill B, Coovert DD(2003) Valproic acid increases SMN levels in spinal muscular atrophy patient cellsAnnals of Neurology54: 5647654 |
12 | Kernochan LE, Russo ML, Woodling NS, Huynh TN, Avila AM, Fischbeck KH(2005) The role of histone acetylation in SMN gene expressionHuman Molecular Genetics14: 911711182 |
13 | Harahap IS, Saito T, San LP, Sasaki N, Gunadi , Nurputra DK(2012) Valproic acid increases SMN2 expression and modulates SF2/ASF and hnRNPA1 expression in SMA fibroblast cell linesBrain & Development34: 3213222 |
14 | Piepers S, Cobben JM, Sodaar P, Jansen MD, Wadman RI, Meester-Delver A(2011) Quantification of SMN protein in leucocytes from spinal muscular atrophy patients: Effects of treatment with valproic acidJournal of Neurology, Neurosurgery, and Psychiatry82: 8850852 |
15 | Tsai LK, Tsai MS, Ting CH, Li H(2008) Multiple therapeutic effects of valproic acid in spinal muscular atrophy model miceJournal of molecular medicine (Berlin, Germany)86: 1112431254 |
16 | Kissel JT, Elsheikh B, King WM, Freimer M, Scott CB, Kolb SJ(2014) SMA valiant trial: A prospective, double-blind, placebo-controlled trial of valproic acid in ambulatory adults with spinal muscular atrophyMuscle & Nerve49: 2187192 |
17 | Swoboda KJ, Scott CB, Reyna SP, Prior TW, LaSalle B, Sorenson SL(2009) Phase II open label study of valproic acid in spinal muscular atrophyPloS One4: 5e5268 |
18 | Kissel JT, Scott CB, Reyna SP, Crawford TO, Simard LR, Krosschell KJ(2011) SMA CARNIVAL TRIAL PART II: A prospective, single-armed trial of L-carnitine and valproic acid in ambulatory children with spinal muscular atrophyPloS One6: 7e21296 |
19 | Swoboda KJ, Scott CB, Crawford TO, Simard LR, Reyna SP, Krosschell KJ(2010) SMA CARNI-VAL trial part I: Double-blind, randomized, placebo-controlled trial of L-carnitine and valproic acid in spinal muscular atrophyPloS One5: 8e12140 |
20 | Brichta L, Holker I, Haug K, Klockgether T, Wirth B(2006) In vivo activation of SMN in spinal muscular atrophy carriers and patients treated with valproateAnn Neurol59: 6970975 |
21 | Garbes L, Heesen L, Holker I, Bauer T, Schreml J, Zimmermann K(2013) VPA response in SMA is suppressed by the fatty acid translocase CD36Human Molecular Genetics22: 2398407 |
22 | Also-Rallo E, Alias L, Martinez-Hernandez R, Caselles L, Barcelo MJ, Baiget M(2011) Treatment of spinal muscular atrophy cells with drugs that upregulate SMN expression reveals inter- and intra-patient variabilityEuropean Journal of Human Genetics: EJHG19: 1010591065 |
23 | Simard LR, Belanger MC, Morissette S, Wride M, Prior TW, Swoboda KJ(2007) Preclinical validation of a multiplex real-time assay to quantify SMN mRNA in patients with SMANeurology68: 6451456 |
24 | Kolb SJ, Gubitz AK, Olszewski RFJr, Ottinger E, Sumner CJ, Fischbeck KH(2006) A novel cell immunoassay to measure survival of motor neurons protein in blood cellsBMC Neurology6: 6 |
25 | Ren C, Zhang L, Freitas MA, Ghoshal K, Parthun MR, Jacob ST(2005) Peptide mass mapping of acetylated isoforms of histone H4 from mouse lymphosarcoma cells treated with histone deacetylase (HDACs) inhibitorsJournal of the American Society for Mass Spectrometry16: 1016411653 |
26 | Wang L, Harshman SW, Liu S, Ren C, Xu H, Sallans L(2010) Assaying pharmacodynamic endpoints with targeted therapy: Flavopiridol and 17AAG induced dephosphorylation of histone H1.5 in acute myeloid leukemiaProteomics10: 2342814292 |
27 | You J, Wang L, Saji M, Olesik SV, Ringel MD, Lucas DM(2011) High-sensitivity TFA-free LC-MS for profiling histonesProteomics11: 1633263334 |
28 | Zhang L, Freitas MA, Wickham J, Parthun MR, Klisovic MI, Marcucci G(2004) Differential expression of histone post-translational modifications in acute myeloid and chronic lymphocytic leukemia determined by high-pressure liquid chromatography and mass spectrometryJournal of the American Society for Mass Spectrometry15: 17786 |
29 | Tiziano FD, Pinto AM, Fiori S, Lomastro R, Messina S, Bruno C(2010) SMN transcript levels in leukocytes of SMA patients determined by absolute real-time PCREuropean Journal of Human Genetics: EJHG18: 15258 |
30 | Wan L, Battle DJ, Yong J, Gubitz AK, Kolb SJ, Wang J(2005) The survival of motor neurons protein determines the capacity for snRNP assembly: Biochemical deficiency in spinal muscular atrophyMolecular and Cellular Biology25: 1355435551 |
31 | Siomi MC, Eder PS, Kataoka N, Wan L, Liu Q, Dreyfuss G(1997) Transportin-mediated nuclear import of heterogeneous nuclear RNP proteinsThe Journal of Cell Biology138: 611811192 |
32 | Jones B, Kenward MGDesign and Analysis of Cross-over TrialsSecond ed2003Boca Raton, FloridaChapman and Hall CRC |
33 | Byrd JC, Marcucci G, Parthun MR, Xiao JJ, Klisovic RB, Moran M(2005) A phase 1 and pharmacodynamic study of depsipeptide (FK228) in chronic lymphocytic leukemia and acute myeloid leukemiaBlood105: 3959967 |
34 | Chavez-Blanco A, Segura-Pacheco B, Perez-Cardenas E, Taja-Chayeb L, Cetina L, Candelaria M(2005) Histone acetylation and histone deacetylase activity of magnesium valproate in tumor and peripheral blood of patients with cervical cancer. A phase I studyMolecular Cancer4: 122 |
35 | Su X, Lucas DM, Zhang L, Xu H, Zabrouskov V, Davis ME(2009) Validation of an LC-MS based approach for profiling histones in chronic lymphocytic leukemiaProteomics9: 511971206 |
36 | Tiziano FD, Lomastro R, Pinto AM, Messina S, D’Amico A, Fiori S(2010) Salbutamol increases survival motor neuron (SMN) transcript levels in leucocytes of spinal muscular atrophy (SMA) patients: Relevance for clinical trial designJournal of Medical Genetics47: 12856858 |
37 | Hunter G, Roche SL, Somers E, Fuller HR, Gillingwater TH(2014) The influence of storage parameters on measurement of survival motor neuron (SMN) protein levels: Implications for pre-clinical studies and clinical trials for spinal muscular atrophyNeuromuscular Disorders: NMD24: 11973977 |
Figures and Tables
Fig.1
Study design. Thirty-one patients were enrolled in VALIANT, a double-blind, crossover design study. Subjects were randomized to two groups, Group 1(VPA/placebo) or Group 2 (Placebo/VPA), following a screening visit that occurred at visit 1. Group 1 (13 subjects) was placed on VPA at visit 2 (V2). 6 months later, Group 1 subjects discontinued VPA and began to take placebo at visit 4 (V4). Group 1 subjects continued to take placebo for an additional 6 months until study visit 6 (V6). Group 2 (18 subjects) was given placebo at V2 for 6 months when they discontinued placebo and began taking VPA at V4. Group 2 subjects continued VPA for 6 months until V6.
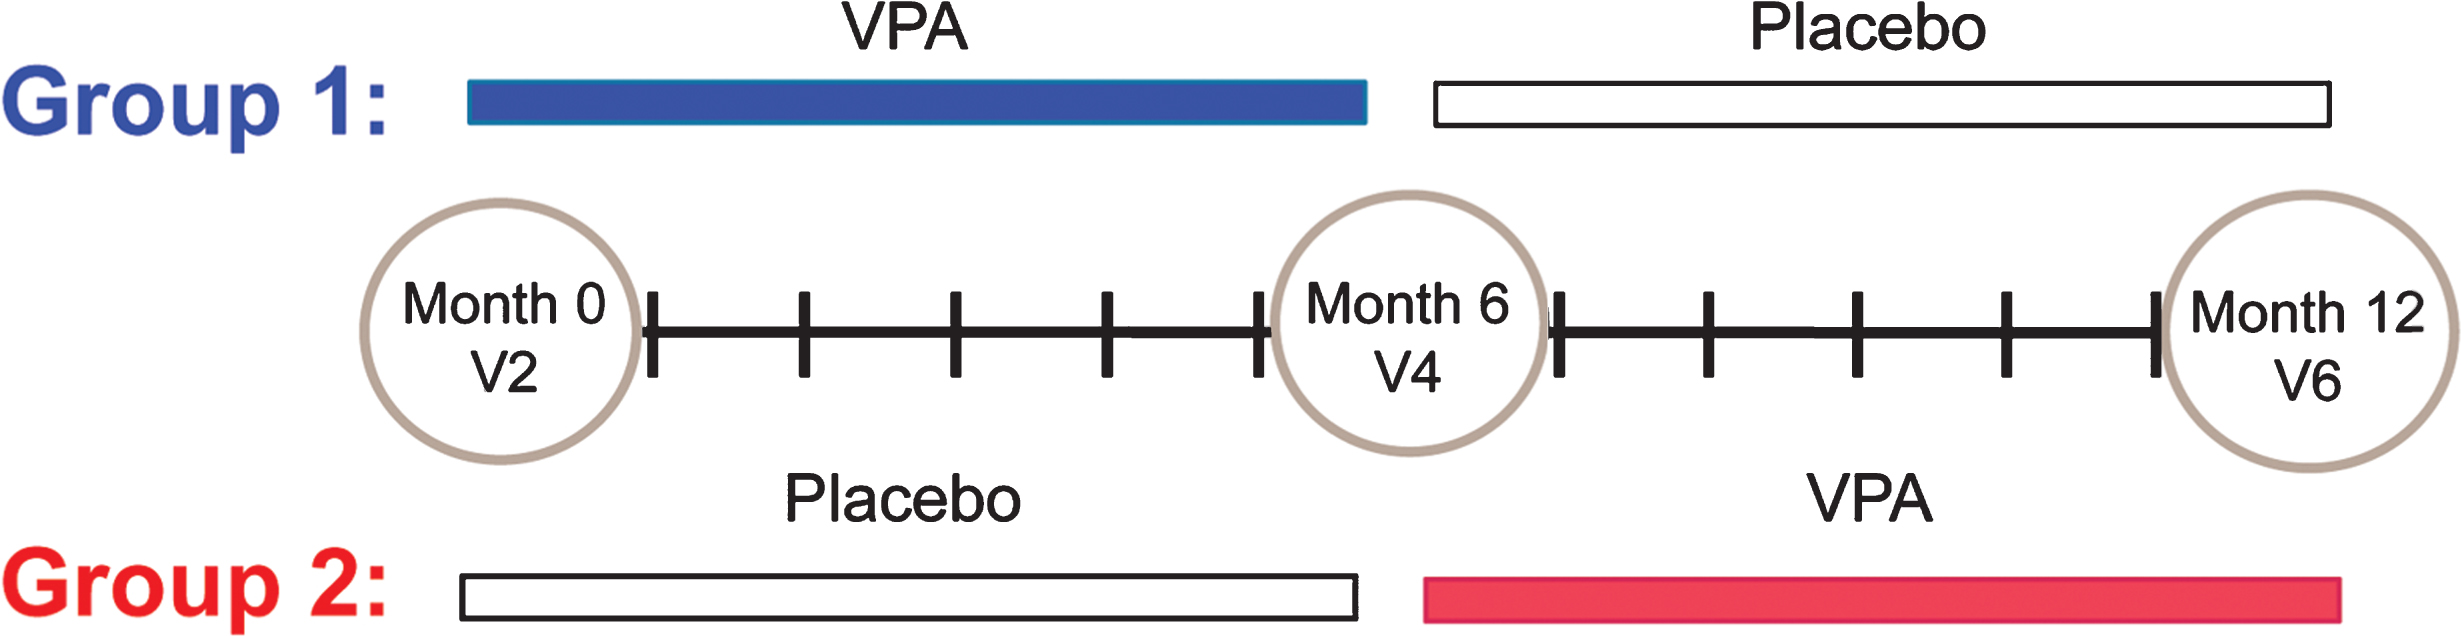
Fig.2
VPA increased the acetylation pattern of histone H4. Representative de-convoluted LC-MS from Group 1 (VPA/Placebo) and Group 2 (Placebo/VPA). Histone H4 was isolated from the chromatin of patient PBMCs. There were two major peaks present, 11,307.2 Da and 11,349.0 Da. These two peaks make up the majority of histone H4. Peak 11,307.2 represents the dimethylated and 11,349.0 thedimethylated/acetylated portion of histone H4. B) Quantification of the change in the histone H4 acetylation was achieved by calculating the ratio of the dimethylated/acetylated over dimethylated histone H4; this data was then averaged by group and visit. Group 1 (VPA/Placebo) had 13 patients analyzed and had group means from 0.695 (±0.080) to 0.616 (±0.121). There were 18 patients analyzed in Group 2 (Placebo/VPA)with a group mean from 0.599 (±0.096) to 0.683 (±0.090).
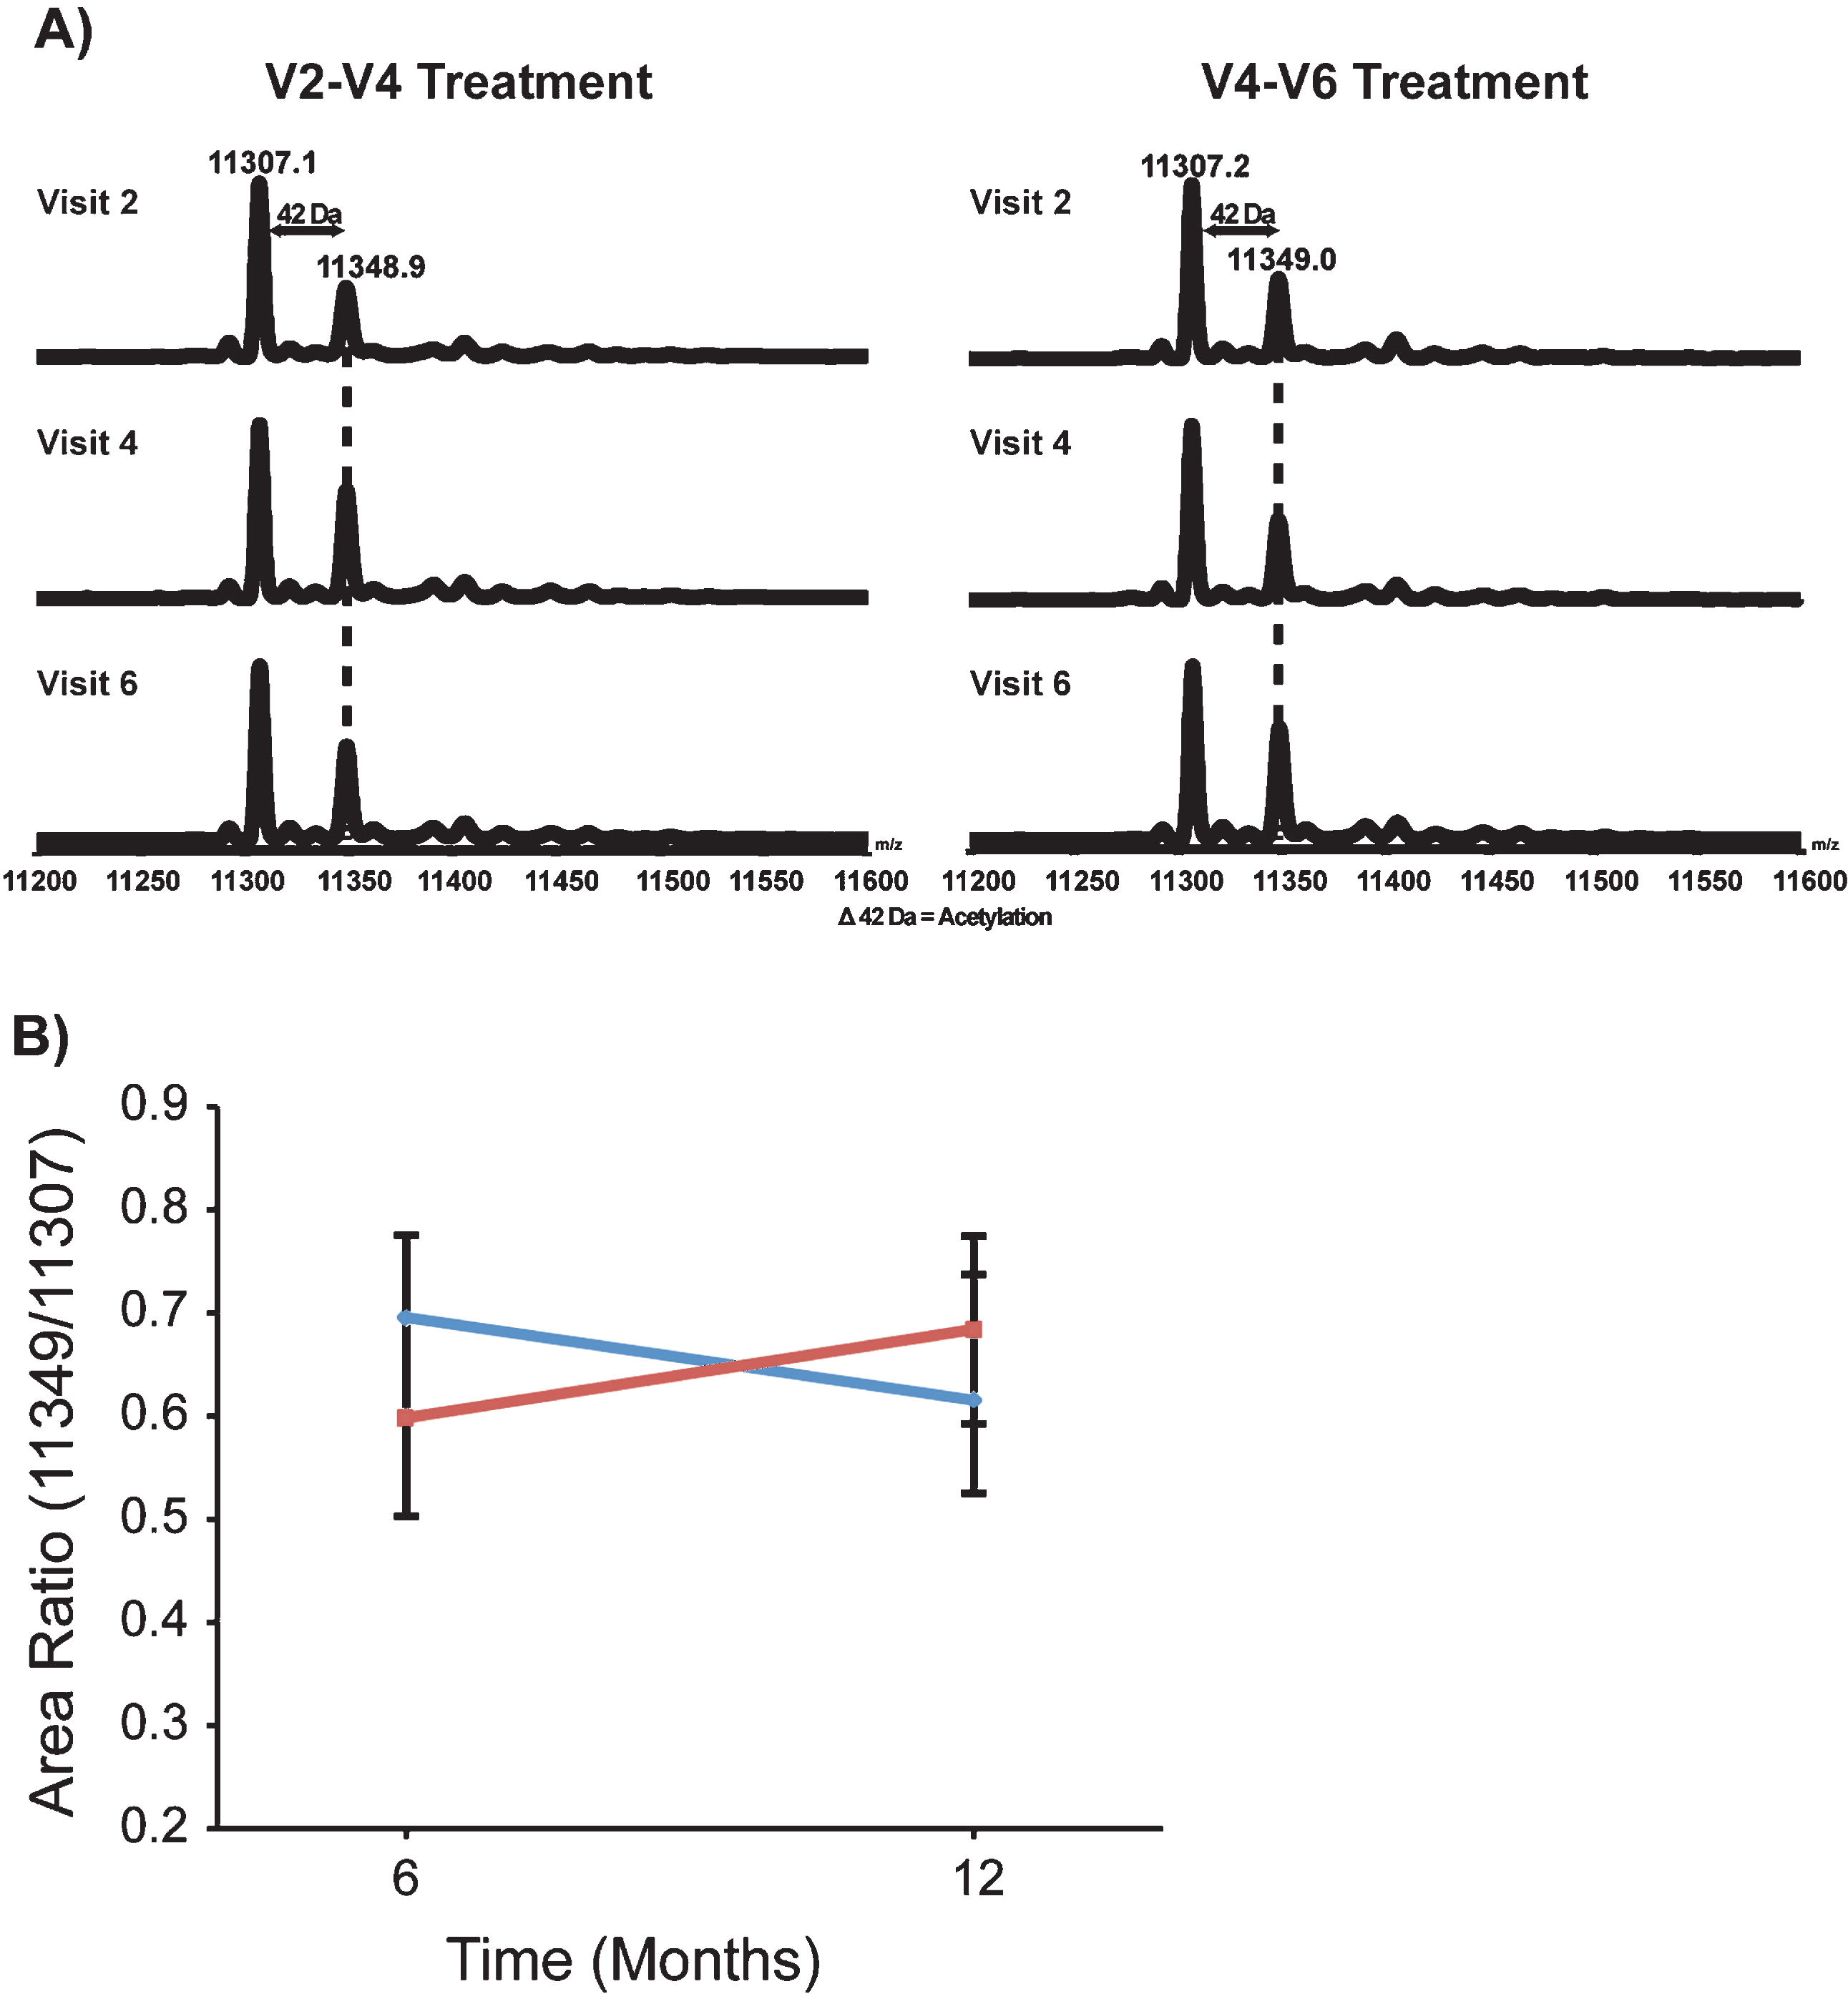
Fig.3
Distribution of the alteration of MS AR in response to VPA. In this study, we have arbitrarily defined “responders” as individuals whose MS AR increased by at least 15% after 6 months of VPA to account for the possibility that a subgroup of individuals in the VALIANT trial might be resistant to the effects of VPA. By this definition, approximately 71% of the subjects wereresponders.
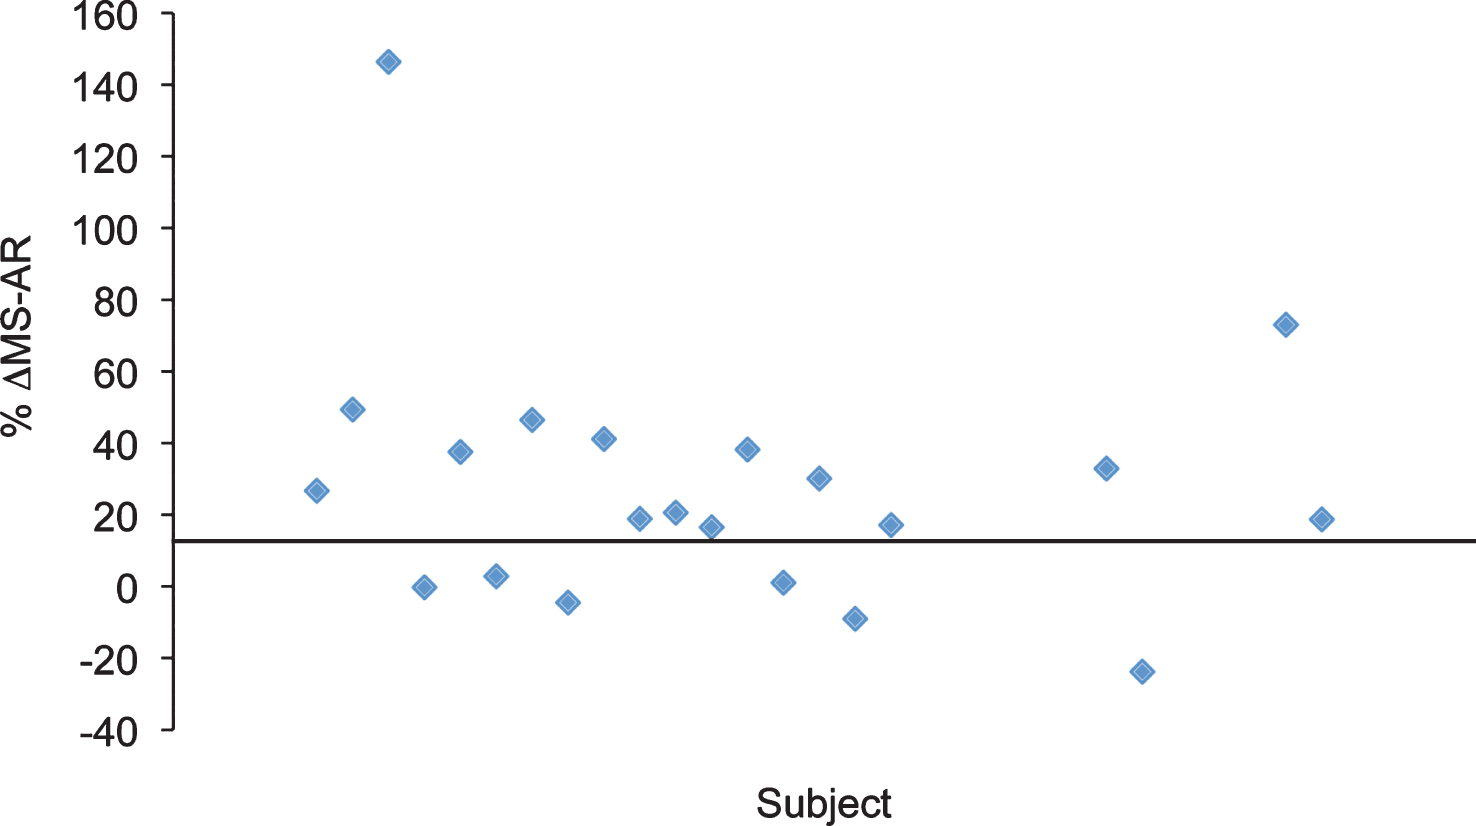
Fig.4
SMN mRNAs were not altered in the presence of VPA or Placebo. mRNAs were isolated from patient whole blood and analyzed using qRT-PCR probing for full length (FL-SMN) and Δ7 (SMN Δ7) mRNAs. A) FL-SMN mRNAs were averaged by group and visit. Group 1 had 13 subjects and Group 2 had 16 subjects. Group 1 (VPA/Placebo) averaged 405.22 (±218.3) to 433.94 (±195.4) molecules of FL-SMN mRNA per ng of total mRNA. The averaged FL-SMN mRNA for Group 2 (Placebo/VPA) increased from 343.32 (±103.9) to 424.24 (±281.3) molecule/ng, p > 0.05. B) SMN Δ7 mRNA was also averaged by group and visit. Group 1 (VPA/Placebo) had an average of 186.31 (±112.1) molecules/ng and moved to 194.47 (±86.63) molecules/ng. Group 2 (Placebo/VPA) averaged 164.31 (±69.37) to 163.32 (±102.94) molecules/ng, p > 0.05.
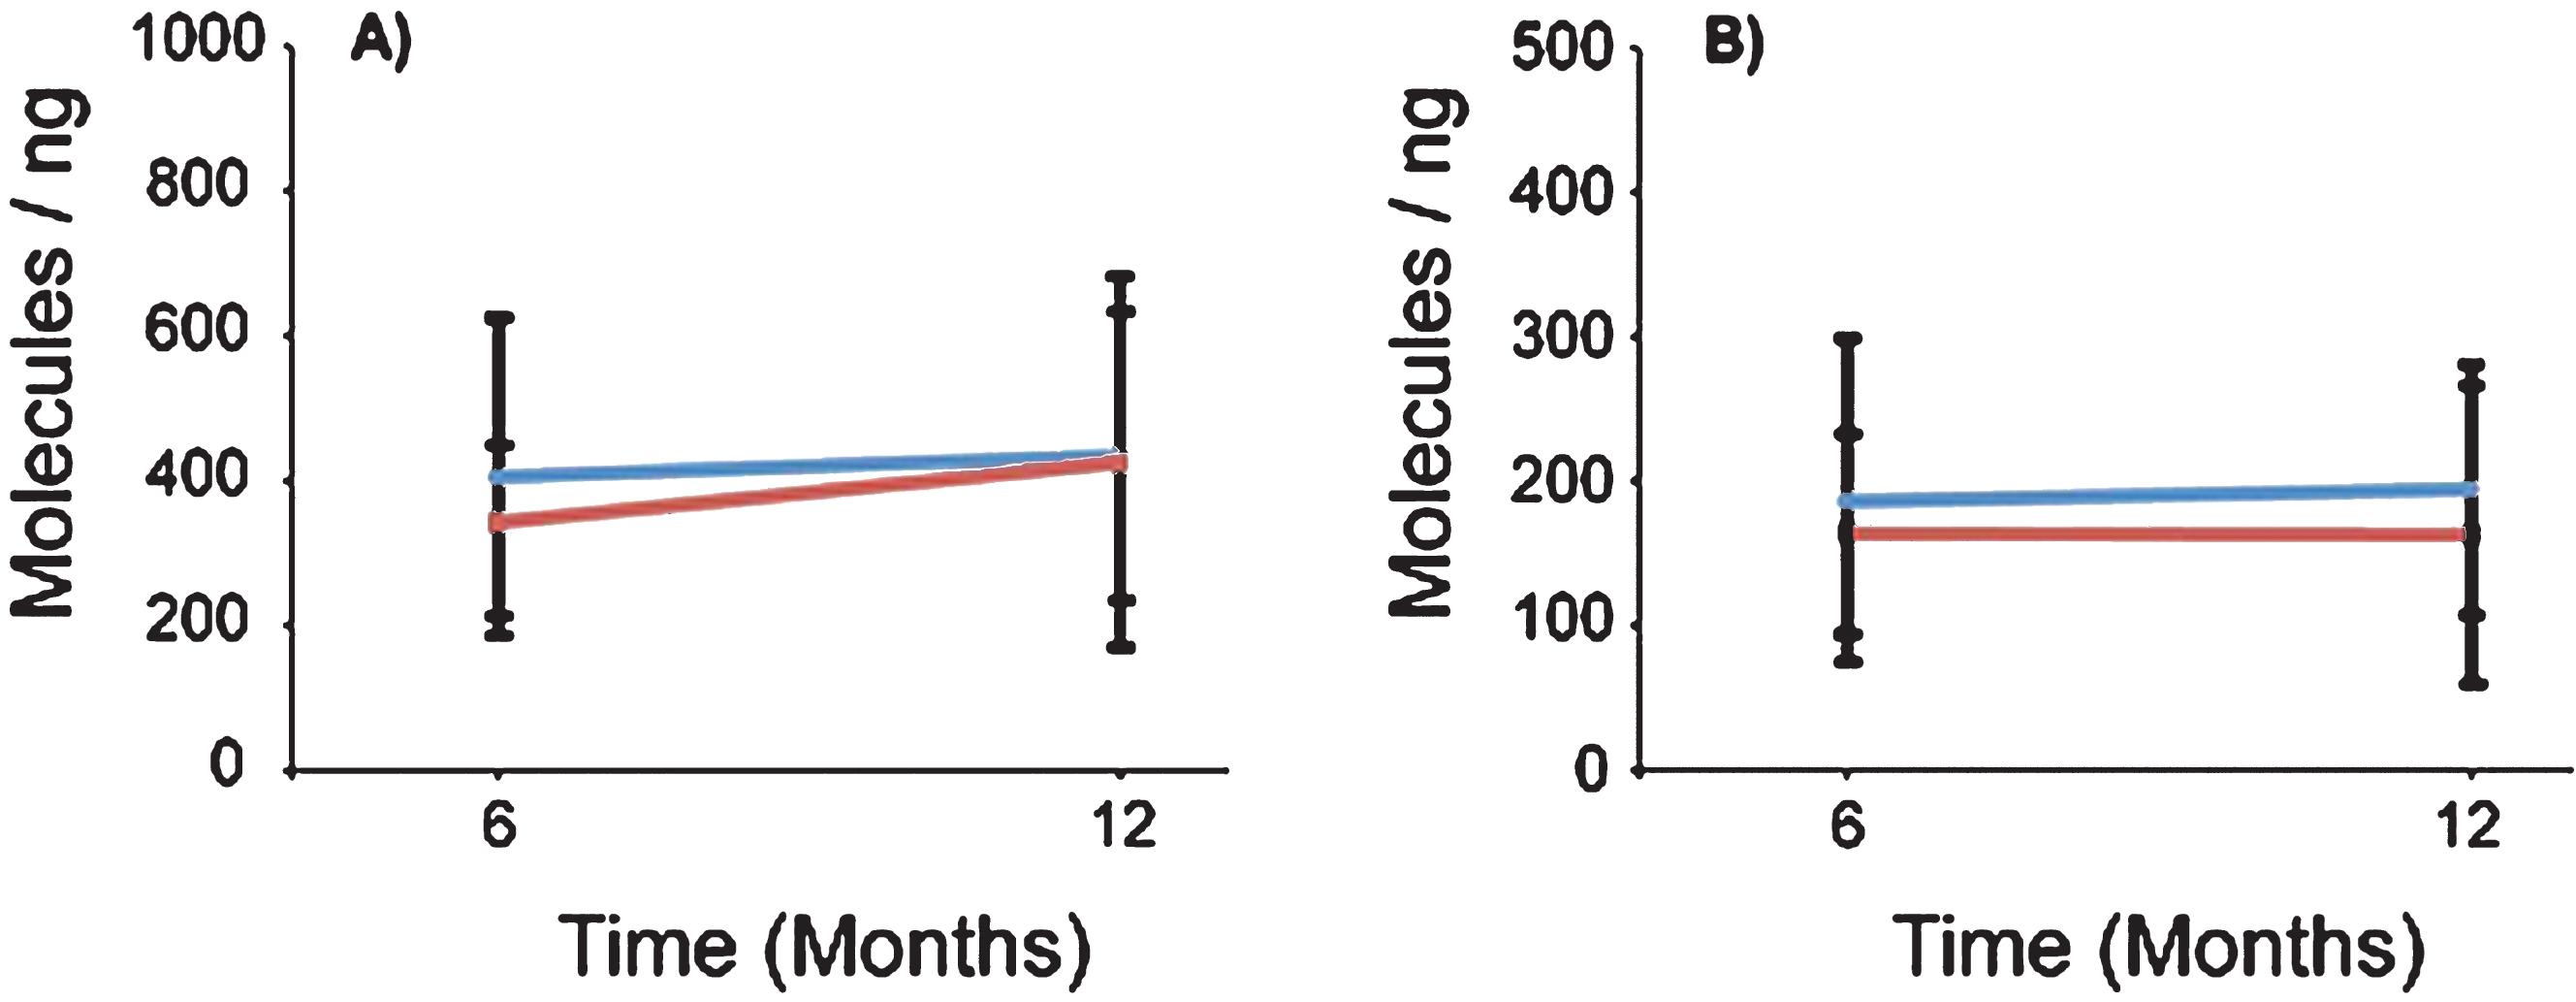
Fig.5
SMN protein concentrations in PBMCs were not altered in the presence of VPA or Placebo. SMN protein was measured using the SMN ELISA and absorbance values were extrapolated from the provided standard curve. A) Both Group 1 and Group 2 mean SMN protein levels were calculated by visit, and 13 and 18 subjects respectively. Group 1 (VPA/Placebo) had mean SMN protein concentrations of 442.8 (±260.7) pg per ml of total protein to 402.39 (±311.5) pg/ml of total protein. Group 2 (Placebo/VPA) had similar concentrations of SMN protein, 438.1 (±254.3) to 372.2 (±182.1) pg/ml of total protein, p > 0.05. B) Representative standard curve from one of the four plates ran for this experiment. Purified SMN protein was loaded on the plate by a serial dilution from 50 pg/ml to 3200 pg/ml, these concentrations correspond to optical densities yielding a linear regression with an r2 value of 0.9987. C) SMN Cell Immunoassay. SMN protein concentrations were standardized by taking a ratio of SMN protein to that of an endogenous protein control, Y12. Group 1 (VPA/Placebo) had an N of 9 and the mean ratios of SMN/Y12 were 0.796 (±0.077) to 0.965 (±0.313) Group 2 (Placebo/VPA) had a 0.965 (±0.313). Group 2 (Placebo/VPA) had an N of 12 and the mean ratios of SMN/Y12 were 0.854 (±0.269) to 0.884 (±0.268), p > 0.05.
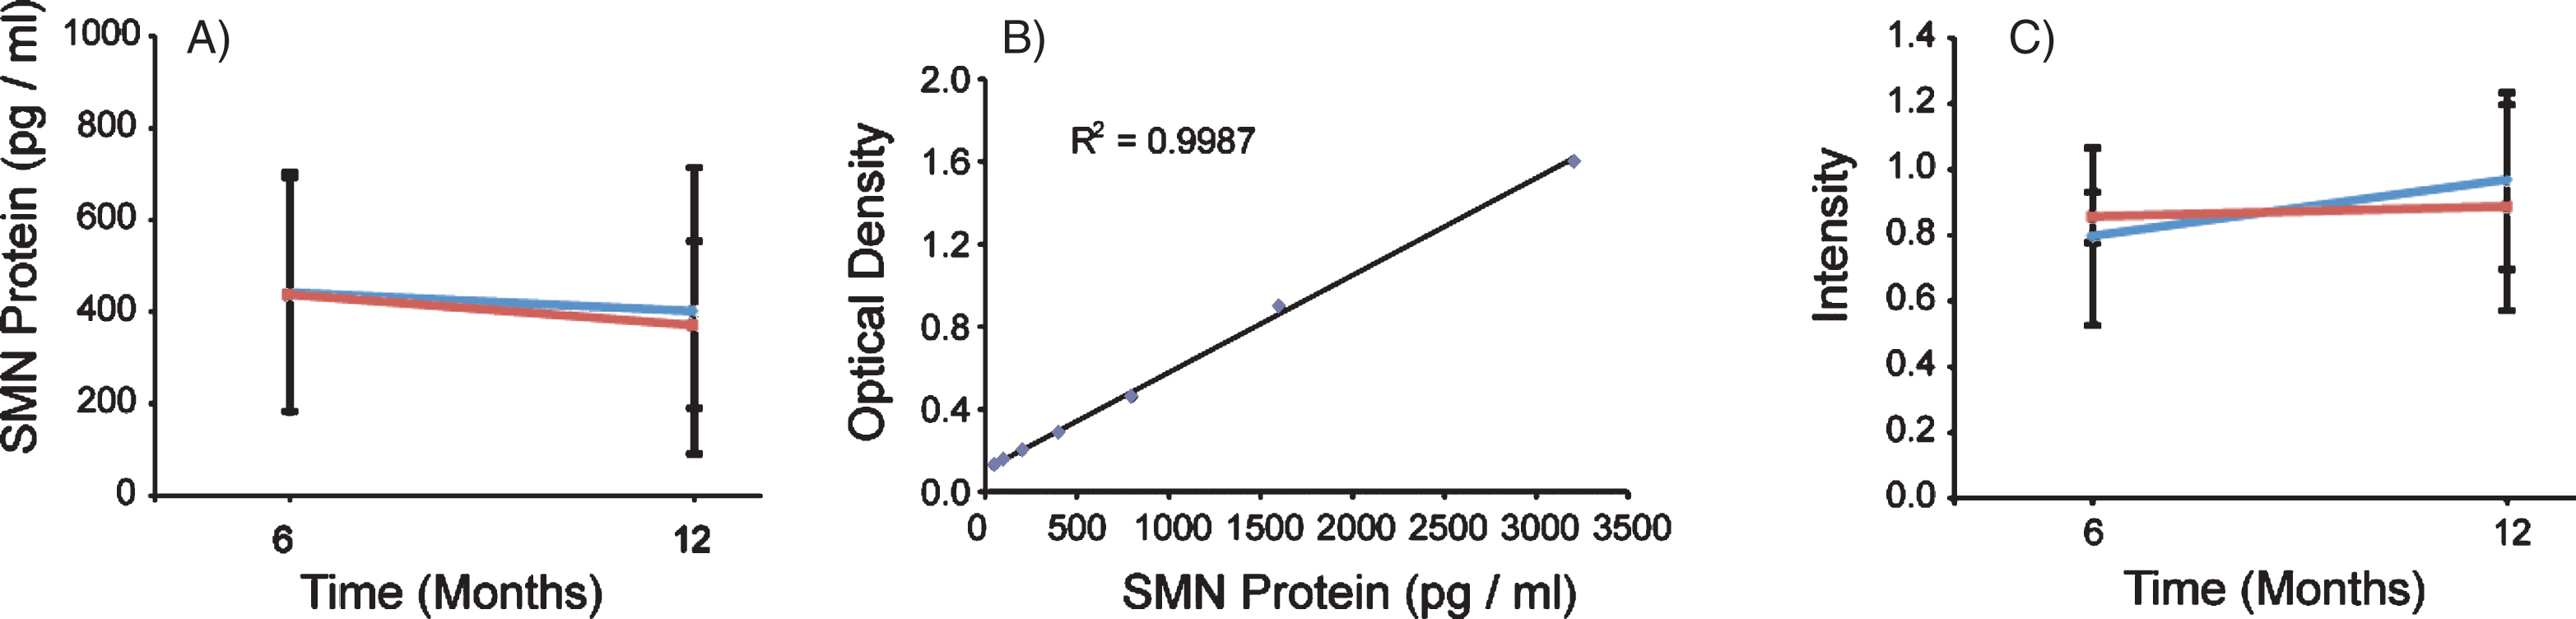
Fig.6
SMN-dependent snRNP assembly activity in PBMCs. A) 12.5 or 25 mg of extract from PBMCs or 25 mg extract from HeLa cells were incubated with biotinylated U4 snRNA or a variant of U4 lacking the Sm site (U4ΔSm) and assayed for Sm core assembly. Assembled Sm cores were isolated by immunoprecipitation with anti-Sm antibodies and detected via luminescence with HRP-coupled streptavidin. The error bars represent the standard deviation from the mean of three independent experiments. B) Representative Western blot for SMN protein in PBMC and HeLa extracts used in snRNP assembly experiments.
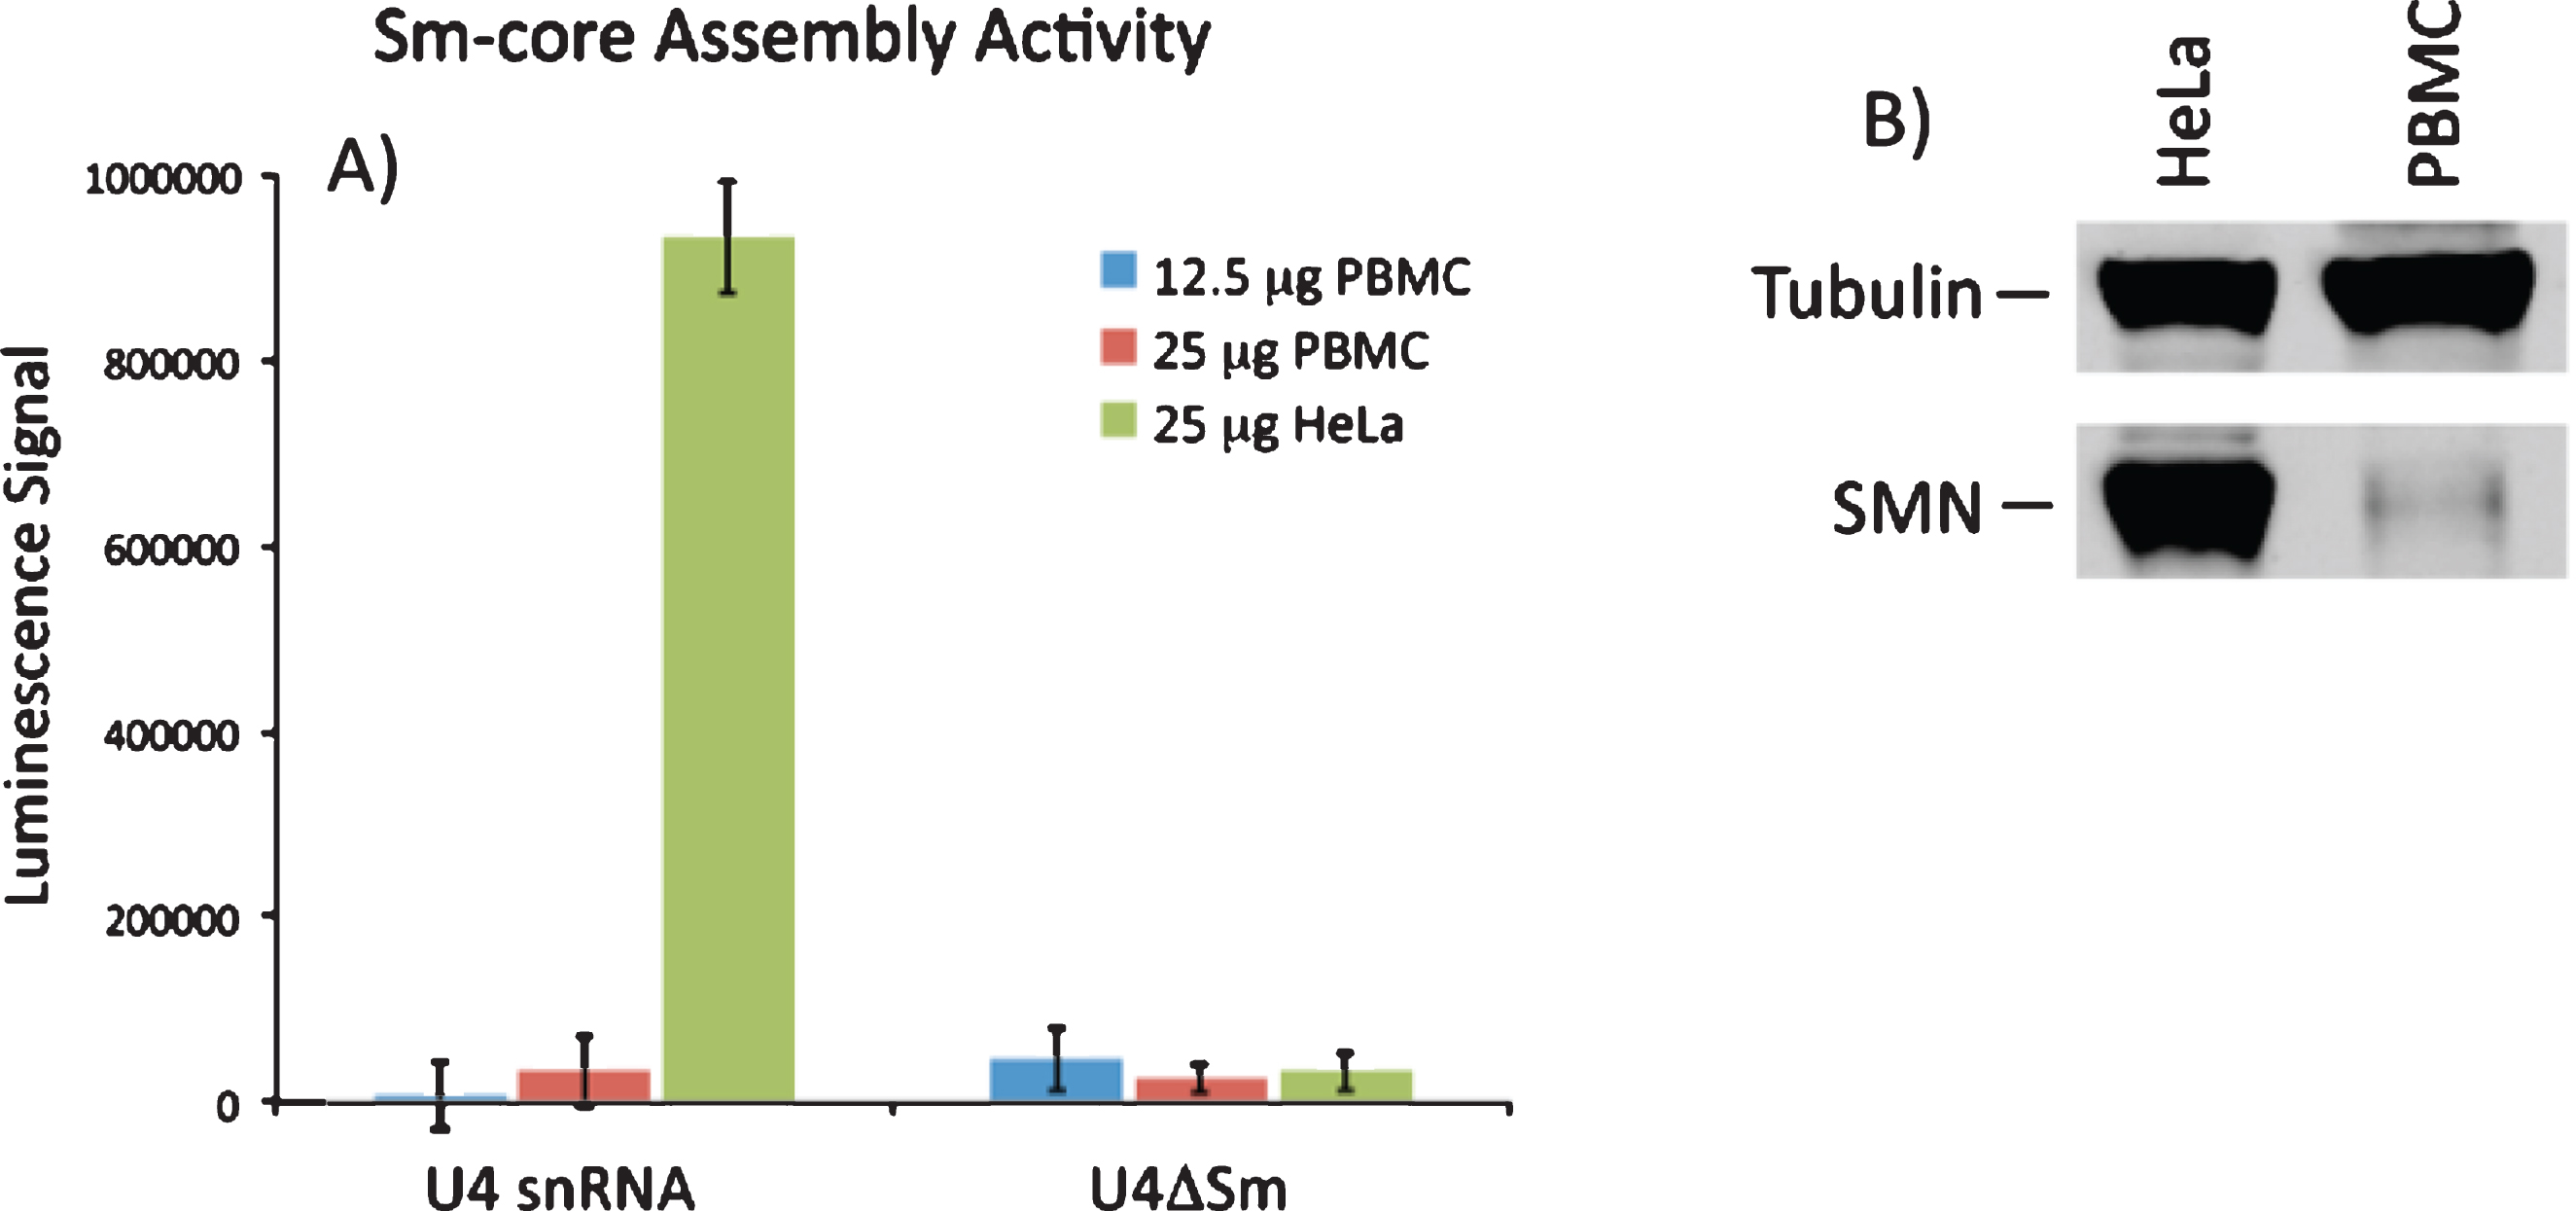
Table 1
Effect of VPA on SMN mRNA levels in the VALIANT Trial
| Group 1 (VPA/Placebo) | Group 2 (Placebo/VPA) | Treatment effect | |||
| V4 | V6 | V4 | V6 | p value | |
| FL-SMN mRNA (mol/ng) | 405.2 (218.3) | 433.9 (195.5) | 343.3 (103.9) | 424.2 (256.2) | 0.790 |
| N | 13 | 13 | 16 | 16 | |
| SMNΔ7 mRNA (mol/ng) | 186.3 (112.1) | 194.5 (86.6) | 153.8 (72.0) | 154.9 (100.1) | 0.268 |
| N | 13 | 13 | 18 | 18 | |
Table 2
Effect of VPA on SMN protein levels in the VALIANT Trial
| Group 1 (VPA/Placebo) | Group 2 (Placebo/VPA) | Treatment effect | |||
| V4 | V6 | V4 | V6 | p value | |
| SMN ELISA (pg/ml) | 442.8 (260.7) | 402.4 (311.5) | 438.1 (254.3) | 372.2 (182.1) | 0.545 |
| N | 11 | 13 | 14 | 18 | |
| SMN Cell Immunoassay | 0.769 (0.077) | 0.965 (0.313) | 0.854 (0.269) | 0.884 (0.268) | 0.909 |
| (SMN/Y12) | (N = 9) | (N = 9) | (N = 12) | (N = 12) | |


