
The Diagnostic Utility of Determining Anti-GM1: GalC Complex Antibodies in Multifocal Motor Neuropathy: A Validation Study
Abstract
Background: Multifocal motor neuropathy (MMN) is associated with IgM antibodies to GM1 ganglioside. The importance of the lipid milieu that might facilitate or inhibit antibody binding to GM1 in immunoassays is well recognised. Existing studies, using a range of different approaches, generally concur that anti-GM1 IgM antibody detection rates are improved by the addition of galactocerebroside (GalC) to the GM1 assay.
Objective: The current study sought to formally evaluate the clinical utility of the GM1:GalC complex assay in the diagnosis of MMN.
Methods: Anti-GM1 and -GM1:GalC antibodies were examined using ELISA and glycoarray (dot blot) in a fully blinded study design, consisting of 100 MMN patients, 100 ALS cases and 100 healthy controls.
Results: The detection of anti-GM1 Abs using glycoarray was 67% sensitive and 85% specific. The addition of GalC to GM1, (1:1 weight to weight ratio), increased the sensitivity to 81% , whilst dropping specificity to 80% . Increasing the GalC content to a 1:5 ratio (or higher) further decreased specificity, and in doing so limited the usefulness of the GM1:GalC assay to the level of GM1 alone. The addition of GalC to the ELISA method also significantly increased sensitivity compared with GM1 alone, albeit with a significant decrease in specificity.
Conclusions: This study indicates that the GM1:GalC assay is an advantageous assay adaptation for detecting anti-GM1 antibodies in MMN, using either glycoarray or ELISA, and warrants introduction into clinical diagnostic practice.
INTRODUCTION
Detection of anti-GM1 IgM antibodies (Abs) is often used as a clinical tool in the differential diagnosis of multifocal motor neuropathy (MMN). However, optimal assay methodology remains uncertain due to wide assay sensitivity and specificity variations, both between and within laboratories [1, 2]. Almost twenty years have passed since the description of galactocerebroside (GalC) as one potential binding enhancer of the anti-GM1 Abs that are present in MMN sera [3]. This original ELISA-based study concluded that the addition of GalC (and sulphated cholesterol) in tenfold ratiometric excess of GM1 unmasked Ab reactivities in a significant number of MMN patients which had been previously characterised as anti-GM1 Ab negative. More recently, three studies have reported similar findings, two using a glycoarray technique [4, 5] and another using ELISA [6]. The study by Galban-Horcajo used a dot blot microarray platform designed as a screening method for anti-lipid antibodies [7]. In this array, GM1 and GalC were premixed at a 1:1 weight to weight ratio and this assay returned a very high sensitivity compared with GM1 alone, albeit in pre-selected MMN clinical cohort [5]. The Nobile-Orazio study, following a similar method to that of Pestronk and co-workers [3] used polystyrene ELISA plates coated with GM1:GalC in a 1:10 weight to weight ratio and also showed increased diagnostic sensitivity for MMN [6]. The Delmont study used a combination of both ELISA and dot blot methods [4]. Existing studies thus conclude that GalC combined with GM1 significantly enhance the detection rate and signal intensity of anti-GM1 Abs, although were not rigourously controlled for selection bias. The current study aimed to validate these findings using a large, unbiased and observer blinded cohort of MMN cases, ALS cases and healthy controls.
MATERIALS AND METHODS
Sera collection and clinical data
Serum samples from 100 patients with MMN, 100 patients with amyotrophic lateral sclerosis (ALS) and 100 healthy controls (HC) were examined. All participants were Dutch caucasians. Diagnostic criteria for MMN and ALS were applied as published previously [8, 9]. Muscle strength was recorded in eleven arm muscle groups and seven leg muscle groups of patients with MMN using the Medical Research Council (MRC) scale, and the MRC sum score was calculated accordingly (maximum 180). Overall disability was determined using the Overall Disability Sum Score (ODSS) [10]. Patients underwent nerve conduction studies following a previously published [11] protocol. The site of onset (i.e. bulbar, cervical, thoracic or lumbosacral region) of weakness in patients with ALS was documented.
Ethical approval was given by the Medical Ethical Committee of the University Medical Center Utrecht and all subjects gave written informed consent.
All 300 samples were randomised and coded prior to commencing the serology screening. The database was then locked until completion of analysis.
Due to limited volumes of some serum samples, patients were excluded from experiments with 1:5 and 1:10 GM1:GalC ratios in glycoarray (3 MMN and 3 controls), and from GM1 alone and 1:10 GM1:GalC in ELISA (4 MMN and 1 control). In such cases, there was a reduction in the total number of comparative samples for intra- and inter-technique comparison, which for some lipid antigens, resulted in altering the sensitivity and specificity (+/- 1% ), which was accompanied by minor change in the area under the curve (AUC ≤0.006).
Lipid source and preparation
The glycolipids screened were GM1, GM2, GM3, GA1, GalC, 3-sulphated galactosylceramide (sulphatide, sulph), sulphated glucuronyl paragloboside (SGPG) and sialosyl-lactoneotetraosylceramide (LM1). Glycolipids were purchased from Sigma, UK except SGPG and LM1 which were provided by RK Yu, Georgia Health Sciences University, USA. Lipid stocks were dissolved in a 2:1 chloroform/methanol solution. Then, 1:1 (weight/weight) complexes were created by mixing equal volumes, at equal concentration, of the component glycolipid solutions. For the preparation of 1:5 and 1:10 GM1:GalC complexes, equal volumes of the two glycolipid solutions were added, although in this case the GalC solution was 5 and 10 times respectively more concentrated than the GM1 solution.
ELISA
For the GM1 and GM1:GalC 1:10 ELISA, the INCAT method was used [12]. The inclusion of GM1:GalC 1:10 heteromeric complex within this methodology was performed as previously described and according to previously published ratios [5]. Polystyrene plates (Immulon 2HB, Dynatech, UK) were coated with 100 ng of GM1 or 1100 ng of GM1:GalC 1:10 glycolipid(s) in methanol (or methanol alone, blank wells) and allowed to evaporate. Plates were blocked with 2% bovine serum albumin (BSA) in phosphate buffered saline (PBS) for 1 h at 4°C. Sera were then diluted in 0.1% BSA/PBS, and 100 μl applied to duplicate wells at 1/100 dilution overnight at 4°C. After washing, peroxidase-labelled anti-human IgM antibody (diluted 1/3000) was applied for 1 h at 4°C. Detection was performed with o-phenylenediamine dihydrochloride and the reaction terminated with 50 μl of 4 M H2SO4. Optical density (OD) was detected at 492 nm using an automated plate reader (SunriseTM, Tecan Group Ltd., Männedorf, Switzerland).
Combinatorial glycoarray
Glycoarray was conducted as previously described [5]. Briefly, 10 ng of single glycolipids or a total weight of 10, 30 or 55 ng of 1:1, 1:5 or 1:10 heteromeric glycolipid ratios respectively, were spotted using an ATS4 TLC autosampler (Camag, Muttenz, Switzerland) onto polyvinyldifluoride (PVDF) membranes affixed to glass slides. Array slides were blocked in 2% BSA/phosphate buffered saline (BSA/PBS), and then incubated for 1 h at 4°C with sera diluted 1/100 in 1% BSA/PBS. After washing, rabbit anti-human IgM horseradish peroxidise conjugated secondary antibody (diluted 1:25000) was applied for 30 min at 4°C. Binding was detected by enhanced chemiluminescence (Pierce ECL Plus Western Blotting Substrate, Thermo scientific, UK). Exposure time was 1 min. Radiographs were digitized by flatbed scanning, and spot intensity calculated using TOTALLAB image analysis software (Nonlinear Dynamics Ltd, Newcastle upon Tyne, UK), expressed as intensity units (IU).
Statistical analysis
ROC analysis was performed in MEDCALC software using Hanley & McNeil methodology. The area under the curve (AUC) was calculated for each lipid antigen, and indicated the average diagnostic accuracy of the test over the entire operating range (threshold-independent). An area under the curve (AUC) value of 0.75 was set as the reference cut-off value for a potentially useful clinical marker, in which a value of 1.0 indicates a perfect test (100% sensitivity, 100% specificity) and a value of 0.5 corresponds to a random chance of separating disease from control groups. The criterion for determining the optimal threshold value, for categorising samples as healthy or diseased, was calculated using Youden index (J) (MEDCALC). This value equates to the point on the ROC curve with maximum difference between sensitivity (true positive rate) and 100-specificity (false positive rate). Comparisons of technique or lipid antigen and their corresponding sensitivity and specificity were performed using the McNemar Chi-squared test [13]. Intensity unit values for glycoarrays were used to produce heat maps and were clustered relative to GM1 intensity (MEV software; Dana-Farber Cancer Institute, Boston, MA, USA). All the remaining graphic representations were produced using GRAPHPAD PRISM 6 software (GraphPad Software Inc., San Diego, CA,USA).
RESULTS
ROC analysis of glycoarray data
Glycoarray binding profiles, from which the quantitative data are derived, illustrate the typical enhancement of binding to GM1 by GalC (Fig. 1a, b). From these raw data, heat maps were generated, here illustrated for GM1, GM2 and GA1 in complex with GalC and alone (Fig. 1c). GM1:GalC 1:1 was the best performing marker for discriminating MMN from both ALS and HC, yielding a value of 0.834 (Table 1). Next, GM1:GalC 1:5 and GM1 alone presented AUCs of 0.777 and 0.764 respectively. The AUC difference between GM1:GalC 1:1 and GM1 alone was significant (0.834 vs 0.764, P = 0.005).). For GM2 and GM2:GalC, antibody binding events are less pronounced overall in all groups but slightly favour MMN, and also appears to be scattered independently of anti-GM1 intensity. For GA1 and GA1:GalC, a relative increase in positive sera is again seen in the MMN group that partly co-segregates in intensity with the anti-GM1 signal intensity; however both the HC and ALS cohorts also show high binding frequency to both GA1 and GA1:GalC. All the glycoarray data for all 300 samples were then subjected to ROC analysis in order to quantitatively assess the diagnostic accuracy obtained using different lipid targets. AUCs were then calculated from the ROC curves. Fig. 1d shows the ROC curves for the six targets shown in the heatmap. Other ROC curves are not shown, but extracted data is tabulated as described below. Other than GM1:SGPG, yielding an AUC of 0.760, no other marker under scrutiny, including both GM2 and GA1, fell above the threshold of acceptance (0.75) for a clinically useful marker.
When analysing the two different groups of controls (ALS and HC) as separate categories, GM1:GalC 1:1 still yields a significantly better diagnostic performance than GM1 alone. Thus, comparing the MMN group against the ALS group yields an AUC of 0.787 for GM1 and 0.858 for GM1:GalC 1:1 (P = 0.009). The same analysis for MMN versus HC yields an AUC of 0.741 for GM1 and 0.809 for GM1:GalC 1:1 (P = 0.012).
Comparative evaluation by glycoarray of GM1 and GM1:GalC ratios
The intensity threshold to best define healthy controls from patients was calculated from the ROC analysis curves for each lipid target (Table 1), and the ability of the assay to correctly categorise samples as MMN (sensitivity) or controls (specificity) was thereby compared at optimal assay thresholds (Table 2). Across all disease and control categories, increasing the ratio of GalC relative to GM1 in the GalC:GM1 complexes resulted in an overall increase in antibody binding intensities, (as illustrated in Fig. 1a,b). This increase included anti-GM1 positive MMN and control samples, and those found to be seronegative for GM1. To compensate for this overall increase in antibody binding with an increasing GalC ratio, threshold cut off values (automatically assigned in the ROC analysis) increased, in order to most favourably delineate healthy and control populations. Only in the case of GM1:GalC 1:1 was the threshold reduced (to zero) compared with the threshold for GM1 (5325 units); a contributing factor being that GM1:GalC complexes contained half as much GM1 lipid antigen (5 ng) as that applied per spot in GM1 alone (10 ng). The addition of GalC to GM1 in a 1:1 ratio yielded a statistically significant improvement in the glycoarray sensitivity (from 67% to 81% , P = 0.003) without a significant loss of specificity (falling from 85% to 80% , P = 0.064), when compared with the current gold standard of GM1 alone (Table 2).
Increasing the ratio of GM1:GalC to 1:5 or 1:10, compared with GM1, did not further improve the assay sensitivity and indeed resulted in a significant reduction in specificity. Increasing the GM1:GalC ratio to 1:10 resulted in a sensitivity significantly worse than either 1:1 or 1:5 (P = 0.001 and P = 0.013 respectively). The assay performance of GM1:GalC 1:1 and 1:5 were broadly similar (sensitivity p = 0.078 and specificity P = 0.233), however as a ratio of 1:5 was not a significant improvement over GM1 alone and both sensitivity and specificity were reduced (albeit, not significantly) compared to a ratio of 1:1, it was concluded that the most suitable lipid target, in this study, for correctly assigning MMN patients as anti-GM1 antibody positive (and control groups as anti-GM1 antibody negative) on glycoarray was GM1:GalC 1:1. The combination of GM1 alone and/or GM1:GalC 1:1 yields a sensitivity of 84% (84/100; 64 positive for both, 3 positive for GM1 alone and 17 positive for GM1:GalC 1:1 alone) and a specificity of 78% (155/200). These data are tabulated in a flow chart for clarity(Fig. 2).
Comparative evaluation by ELISA of GM1 alone and GM1:GalC 1:10
ELISA assays were performed using GM1 alone and GM1:GalC at the 1:10 ratio previously used in other studies, and optimal threshold values were calculated for each target (Table 2). Insufficient sample volumes were available to perform the study at multiple GM1:GalC ratios by ELISA (see methods section). For GM1 alone, applying a threshold of OD >0.19, the assay yielded 51% sensitivity and 91% specificity. When GalC was added in a ratio of 1:10, applying an optimal threshold of OD >0.12, the sensitivity significantly increased to 70% (P = 0.0001). However, this was accompanied by a significant reduction in specificity to 74% (P < 0.0001). When specific thresholds were selected to classify healthy and disease groups, neither lipid antigen resulted in a clear advantage when weighing up assay performance by both sensitivity and specificity. We then assessed the average accuracy of GM1 alone and GM1:GalC 1:10 across all measured values (AUC = 0.752 and 0.769 respectively), and once more, no significant difference was found (P = 0.541), suggesting that both lipid coatings on ELISA performed equally.
Comparative analysis of ELISA and glycoarray data
ELISA and glycoarray techniques were compared using defined sample sets for each lipid antigen, and threshold values previously optimised for each assay (Table 1). For GM1:GalC 1:10, the glycoarray and the ELISA performed similarly (sensitivity = 61% vs 69% , P = 0.23 and specificity = 79% vs 74% , P = 0.253, respectively). These data are also presented in box and whisker plots with outliers (Fig. 3) for ease of comparison, where it is clearly evident that whilst the MMN group harbours a greater proportion of higher intensity samples when assayed by either glycoarray or ELISA, considerable categorical overlap exists at this 1:10 GM1:GalC ratio. In particular, there are an equal number of rare individual samples in all three groups (MMN, ALS and HC) in which antibody signals are very high, lying beyond the limit of the upper interquartile range (i.e. outliers, plotted as individual dots), when assayed by either ELISA orglycoarray.
For GM1 alone, sensitivity was significantly better in the glycoarray than the ELISA (67% vs 51% , P = 0.004). Thus for GM1 alone, 20 ELISA-negative MMN patients were positive on glycoarray, whereas only 5 glycoarray-negative MMN patients were positive on ELISA. The improved sensitivity of glycoarray was at the expense of reduced specificity when compared with ELISA (84% vs 91% P = 0.031). The increase in the diagnostic false positive sampling rate resulted from 22 ELISA-negative controls being positive on glycoarray, in comparison with 9 glycoarray-negative controls being positive on ELISA. In addition, a further 9/199 controls (5% ) were categorised as positive in both techniques, at these specific cut-off values.
Correlation analysis conducted to compare GM1 and GM1:GalC 1:10 ELISA and glycoarray values in any one sample returned correlation coefficients of 0.58 and 0.45 respectively, indicating weak intra-sample concordance across the two techniques, even through overall sensitivity and specificity data were similar.
As there was no statistically clear advantage between techniques at optimal threshold, we compared the average accuracy of glycoarray and ELISA using GM1 alone across all measured values (AUC = 0.762 and 0.752 respectively), and once more, no significant difference was found (P = 0.784), suggesting that both techniques performed equally when the GM1:GalC ratio was set at 1:10. Since the ELISA was only conducted at a GM1:GalC ratio of 1:10, it is not possible to directly compare both methods at 1:1 ratios. However, when comparing the optimally performing array conditions of GM1:GalC 1:1 with the GM1:GalC 1:10 ELISA, improvements in sensitivity (80% vs 70% ) and specificity (80% vs 74% ) were seen, although these did not achieve statistical significance (P = 0.09 and 0.12 respectively).
Association with clinical characteristics
The clinical characteristics of GM1:GalC Ab positive and negative MMN patients are depicted in Table 2. None of the clinical features were significantly different between the two patient groups, although the GM1:GalC positive patients tended to have more pronounced weakness (MRC sum score 164 vs. 170, p = 0.08), in keeping with previous findings [14]. The clinical features of the 17 GM1:GalC positive ALS patients were compared with the antibody negative ALS patients. There was no difference in gender, age at onset, site of onset or upper and lower motor neuron involvement on neurological examination. Furthermore, disease duration and mortality were similar (2.9 vs. 2.8 years p = 0.45 and 88% vs. 90% p = 0.79, respectively).
DISCUSSION
Herein we demonstrate that the addition of GalC to GM1 improves the diagnostic sensitivity of anti-GM1 IgM Ab detection in patients with MMN relative to healthy control and ALS cases, using both glycoarray and ELISA measurement techniques. Our previous studies using glycoarray [5], and a recent study using ELISA [6] have already reinforced the previous findings that GM1 and GalC in complex generate an Ab binding enhancing effect [3]. The distinctive feature of the current study is that it adopts a fully blinded design to test a relatively large number of samples for the effect of GM1-GalC complexes on test characteristics in a diagnostic laboratory independent of the source of clinical material.
Our data indicate that using GalC-GM1 complexes at 1:1 (weight to weight) ratio in glycoarray significantly improves the IgM Ab detection rate (i.e. diagnostic sensitivity), without significantly altering specificity. Further ratiometric increases of GalC up to 1:5 and 1:10 weight to weight ratios relative to GM1 significantly decreased specificity, particularly at the higher ratio of GalC, without any concomitant improvement in sensitivity, and should thus be avoided when designing these assays for clinical diagnostic use. The effect of increasing GalC on reducing specificity appeared more pronounced in ELISA than in glycoarray, but owing to the limited range of GM1:GalC ratios used in ELISA, definite conclusions on the optimal configuration of the ELISA cannot be drawn from this study. In particular, it remains possible that lower GalC ratios and/or introduction of additional lipids such as neutral lipids or cholesterol might yield different sensitivity and specificity data, using either ELISA or glycoarray. However since this study was designed as a validation study of existing reported ratios, further exploration of these variations was not performed.
Although both ELISA and glycoarray register the same phenomenon of GalC-dependent enhancement of anti-GM1 Ab binding, correlation between both their binding intensity levels (i.e. titre or amount) and their diagnostic performances (i.e. positive or negative) with any one sample was inexact. At a given intensity and OD threshold, both techniques returned similar diagnostic scores when considering the sample groups as a whole, with no difference in either sensitivity or specificity. However, individual samples might yield positive results by glycoarray and negative results by ELISA, and vice versa, as borne out by the low correlation coefficients (∼0.5) in regression analysis. This is likely due to clinical samples containing a highly diverse collection of heterogeneous anti-GM1 antibodies of slightly differing specificity and affinity/avidity for the GM1 oligosaccharide. The 2 techniques detect these binding events to varying extents according to the antigen conformation adopted on adherence to the assay surfaces (polystyrene or PVDF) that are biophysically distinct, as has been previously suggested [15]. This does not indicate methodological imprecision, but rathermore, methodological differences. Practically, however, this may confound clinical interpretation since one assay method may produce a positive result on an individual sample that is not recapitulated in a second assay.
In diagnostic testing, it is essential to recognise that the healthy population may possess circulating antibodies with a similar binding profile to the disease category under investigation, as is very evidently the case for anti-GM1 IgM antibodies. Indeed, all anti-glycolipid antibodies vary in their baseline levels within the normal population, which may be related to ethnicity and geographical location. The selection of robust and appropriate control groups is thus a critical factor in assay development. Some anti-glycolipid antibodies, such as anti-GD1a and -GQ1b IgG antibodies, may be so rarely present in the normal population that they represent good biomarkers. In contrast anti-GA1 and anti-sulfatide antibodies are very commonly found, and thus require the establishment of different assay parameters. In such cases, a clear separation of healthy from disease groups is not possible. Application of a cut-off may enable detection of all of the disease patients, however, if the selected threshold value encroaches upon the upper limit of normal in the control samples, there will be a reduction in specificity, and a corresponding increase in diagnostic false positives. This scenario is commonly seen with anti-glycolipid diagnostic assays, and this highlights the reciprocal relationship between sensitivity and specificity.
Whilst it is clear that anti-GM1 and -GM1:GalC IgM antibodies are expanded in MMN relative to normal and disease controls, it is pertinent to ask whether this biomarker has sufficient accuracy to be useful in clinical diagnostics, using either ELISA or glycoarray methods. In a small disease cohort examined under strictly controlled laboratory parameters combined with patient referral bias, such as observed in our recent MMN study [5], it was possible to segregate all MMN patients (100% sensitivity) with minimal detection of diagnostic false positives (4/57, 93% specificity). As the sample size, clinical referral pattern and assay diversity increases, this becomes increasingly difficult to achieve. Thus, if 1000 unselected neuropathy cases seen in routine clinical practice are all referred for anti-GM1 IgM antibody testing, and one assumes an MMN frequency of 0.5% of all neuropathies and an assay sensitivity of 80% and specificity of 80% , then 203 patients will yield a positive anti-GM1 IgM antibody assay result, only 4 of whom will have MMN. Even in specialized motor neuron disease clinics where asymmetric weakness is a common phenotype and where MMN frequency may be tenfold higher (5% ), the vast majority of patients with anti-GM1 antibodies will have MND. This underlines the importance of understanding patient selection criteria in laboratory testing settings.
The finding of IgM antibodies to GM1:GalC in MMN patients previously described as antibody negative which showed no differences in disease phenotype when compared to antibody positive patients, strengthens once again the notion of MMN as an antibody driven neuropathy. The elusive antibody presumed to be present in ‘antibody-negative’ cases remains to be identified. Alternatively the anti-GM1 antibody we measure in serum represents a benign antibody population that frequently but not always co-segregates with a separate population of neurotoxic antibodies whose detection methodology and specificity remains to be determined. This latter view would be consistent with the substantial overlap in finding apparently benign anti-GM1 IgM antibodies in normal and disease control populations.
The pathogenic roles, if any, of anti-GM1:GalC antibodies remain to be explored, although it might be predicted that they would favour the targeting of GM1 in myelin membranes (since GalC is a myelin lipid) rather than GM1 in axolemmal membranes. The findings of substantially elevated antibody levels in a proportion of healthy control and ALS groups suggests that their neurotoxicity may be limited to very specific, as yet poorly understood immunopathological circumstances. With respect to the origin of anti-GM1:GalC antibodies, they may arise from the innate immune repertoire or arise through antigen-driven pathways; this remains to be investigated.
In clinical diagnostic practice, the GM1:GalC 1:1 assay improves sensitivity without significantly affecting specificity and could readily be introduced into ELISA or dot blot assay formats for use in routine testing. Inter-laboratory variation in methods, including commercially-available kits, dictates that GM1:GalC ratios should be optimised in a range-finding study at an individual laboratory or kit manufacturer level.
ACKNOWLEDGMENTS INCLUDING SOURCES OF SUPPORT
This work was supported by a programme grant (092805/Z/10/Z) to HJW from The Wellcome Trust. FG-H was supported by a Lord Kelvin Adam Smith (LKAS) studentship awarded by the University of Glasgow. SKH received an unrestricted educational grant from Baxter USA, administered through the Peripheral Nerve Society (Baxter-PNS award). ED was supported by a travelling fellowship from the European Academy of Neurology. Dr RK Yu (Georgia, Health Sciences University, USA) is thanked for supplying the glycolipids LM1 and SGPG. Dr EA Cats is thanked for providing clinical data.
CONFLICT OF INTEREST
A patent entitled “Detection of interactions between lipid complexes and lipid binding agents” (PCT/GB2009/001665, pending application) covering aspects of the described array technology has been filed by University of Glasgow. The University does not seek to make a commercial return from this technology, which is available to companies under an Easy Access Licence.
REFERENCES
1 | Kuijf ML, van Doorn PA, Tio-Gillen AP, Geleijns K, Ang CW, Hooijkaas H(2005) Diagnostic value of anti-GM1 ganglioside serology and validation of the INCAT-ELISAJ Neurol Sci239: 13744 |
2 | van Schaik IN, Bossuyt PM, Brand A, Vermeulen M(1995) Diagnostic value of GM1 antibodies in motor neuron disorders and neuropathies: A meta-analysisNeurology45: 815701577 |
3 | Pestronk A, Choksi R, Blume G, Lopate G(1997) Multifocal motor neuropathy: Serum IgM binding to a GM1 ganglioside-containing lipid mixture but not to GM1 aloneNeurology48: 411041106 |
4 | Delmont E, Halstead S, Galban-Horcajo F, Yao D, Desnuelle C, Willison H(2015) Improving the detection of IgM antibodies against glycolipids complexes of GM1 and Galactocerebroside in Multifocal Motor Neuropathy using glycoarray and ELISA assaysJ Neuroimmunol278: 159161 |
5 | Galban-Horcajo F, Fitzpatrick AM, Hutton AJ, Dunn SM, Kalna G, Brennan KM(2013) Antibodies to heteromeric glycolipid complexes in multifocal motor neuropathyEur J Neurol20: 16270 |
6 | Nobile-Orazio E, Giannotta C, Musset L, Messina P, Leger JM(2014) Sensitivity and predictive value of anti-GM1/galactocerebroside IgM antibodies in multifocal motor neuropathyJ Neurol Neurosurg Psychiatry85: 7754758 |
7 | Kanter JL, Narayana S, Ho PP, Catz I, Warren KG, Sobel RA(2006) Lipid microarrays identify key mediators of autoimmune brain inflammationNature Medicine12: 1138143 |
8 | Brooks BR, Miller RG, Swash M, Munsat TL(2000) El Escorial revisited: Revised criteria for the diagnosis of amyotrophic lateral sclerosisAmyotroph Lateral Scler Other Motor Neuron Disord1: 5293299 |
9 | Van den Berg-Vos RM, Franssen H, Wokke JH, Van Es HW, van den Berg LH(2000) Multifocal motor neuropathy: Diagnostic criteria that predict the response to immunoglobulin treatmentAnn Neurol48: 691926 |
10 | Merkies IS, Schmitz PI(2006) Getting closer to patients: The INCAT Overall Disability Sum Score relates better to patients’ own clinical judgement in immune-mediated polyneuropathiesJ Neurol Neurosurg Psychiatry77: 8970972 |
11 | van Asseldonk JT, van den Berg LH, Van den Berg-Vos RM, Wieneke GH, Wokke JH, Franssen H(2003) Demyelination and axonal loss in multifocal motor neuropathy: Distribution and relation to weaknessBrain126: Pt 1186198 |
12 | Willison HJ, Veitch J, Swan AV, Baumann N, Comi G, Gregson NA(1999) Inter-laboratory validation of an ELISA for the determination of serum anti-ganglioside antibodiesEur J Neurol6: 17177 |
13 | Trajman A, Luiz RR(2008) McNemar chi2 test revisited: Comparing sensitivity and specificity of diagnostic examinationsScand J Clin Lab Invest68: 17780 |
14 | Cats EA, Jacobs BC, Yuki N, Tio-Gillen AP, Piepers S, Franssen H(2010) Multifocal motor neuropathy Association of anti-GM1 IgM antibodies with clinical featuresNeurology75: 2219611967 |
15 | Townson K, Boffey J, Nicholl D, Veitch J, Bundle D, Zhang P(2007) Solid phase immunoadsorption for therapeutic and analytical studies on neuropathy-associated anti-GM1 antibodiesGlycobiology17: 3294303 |
Figures and Tables
Fig.1
Panel a. Glycoarray grids illustrating that antibody binding to GM1 is enhanced by the presence of GalC. Panel b. Samples sero-negative for GM1 alone are antibody positive at increasing ratios of GM1:GalC. Panel c. Heat map illustration of all 300 serum samples tested by glycoarray. Each sample is colour coded according to the intensity of binding to each target (red represents the strongest down through the rainbow scale to blue which is weakest and black equals no binding), and data has been sorted by decreasing GM1:GalC intensity in the 3 clinical categories (left to right, top row). Each sample in subsequent vertical column is locked to the intensity order assigned by the top row. Visual inspection of the heat map clearly indicates the positive bias towards GM1:GalC and GM1 binding in the MMN population compared with HC and ALS. Panel d. ROC curve plotting sensitivity against 100-specificity of selective lipid markers tested on glycoarray. For each lipid target, an area under the curve (AUC) is calculated, in which the best lipid marker will have an AUC closest to 1. In this example GM1:GalC 1:1 (AUC = 0.834) is determined to be the best discriminator of MMN and control serum samples, and was found to be statistically significant from the second most efficient lipid, GM1 alone (AUC = 0.764, P = 0.0051). (Colours are visible in the online version of the article; http://dx.doi.org/10.3233/JND-150080)
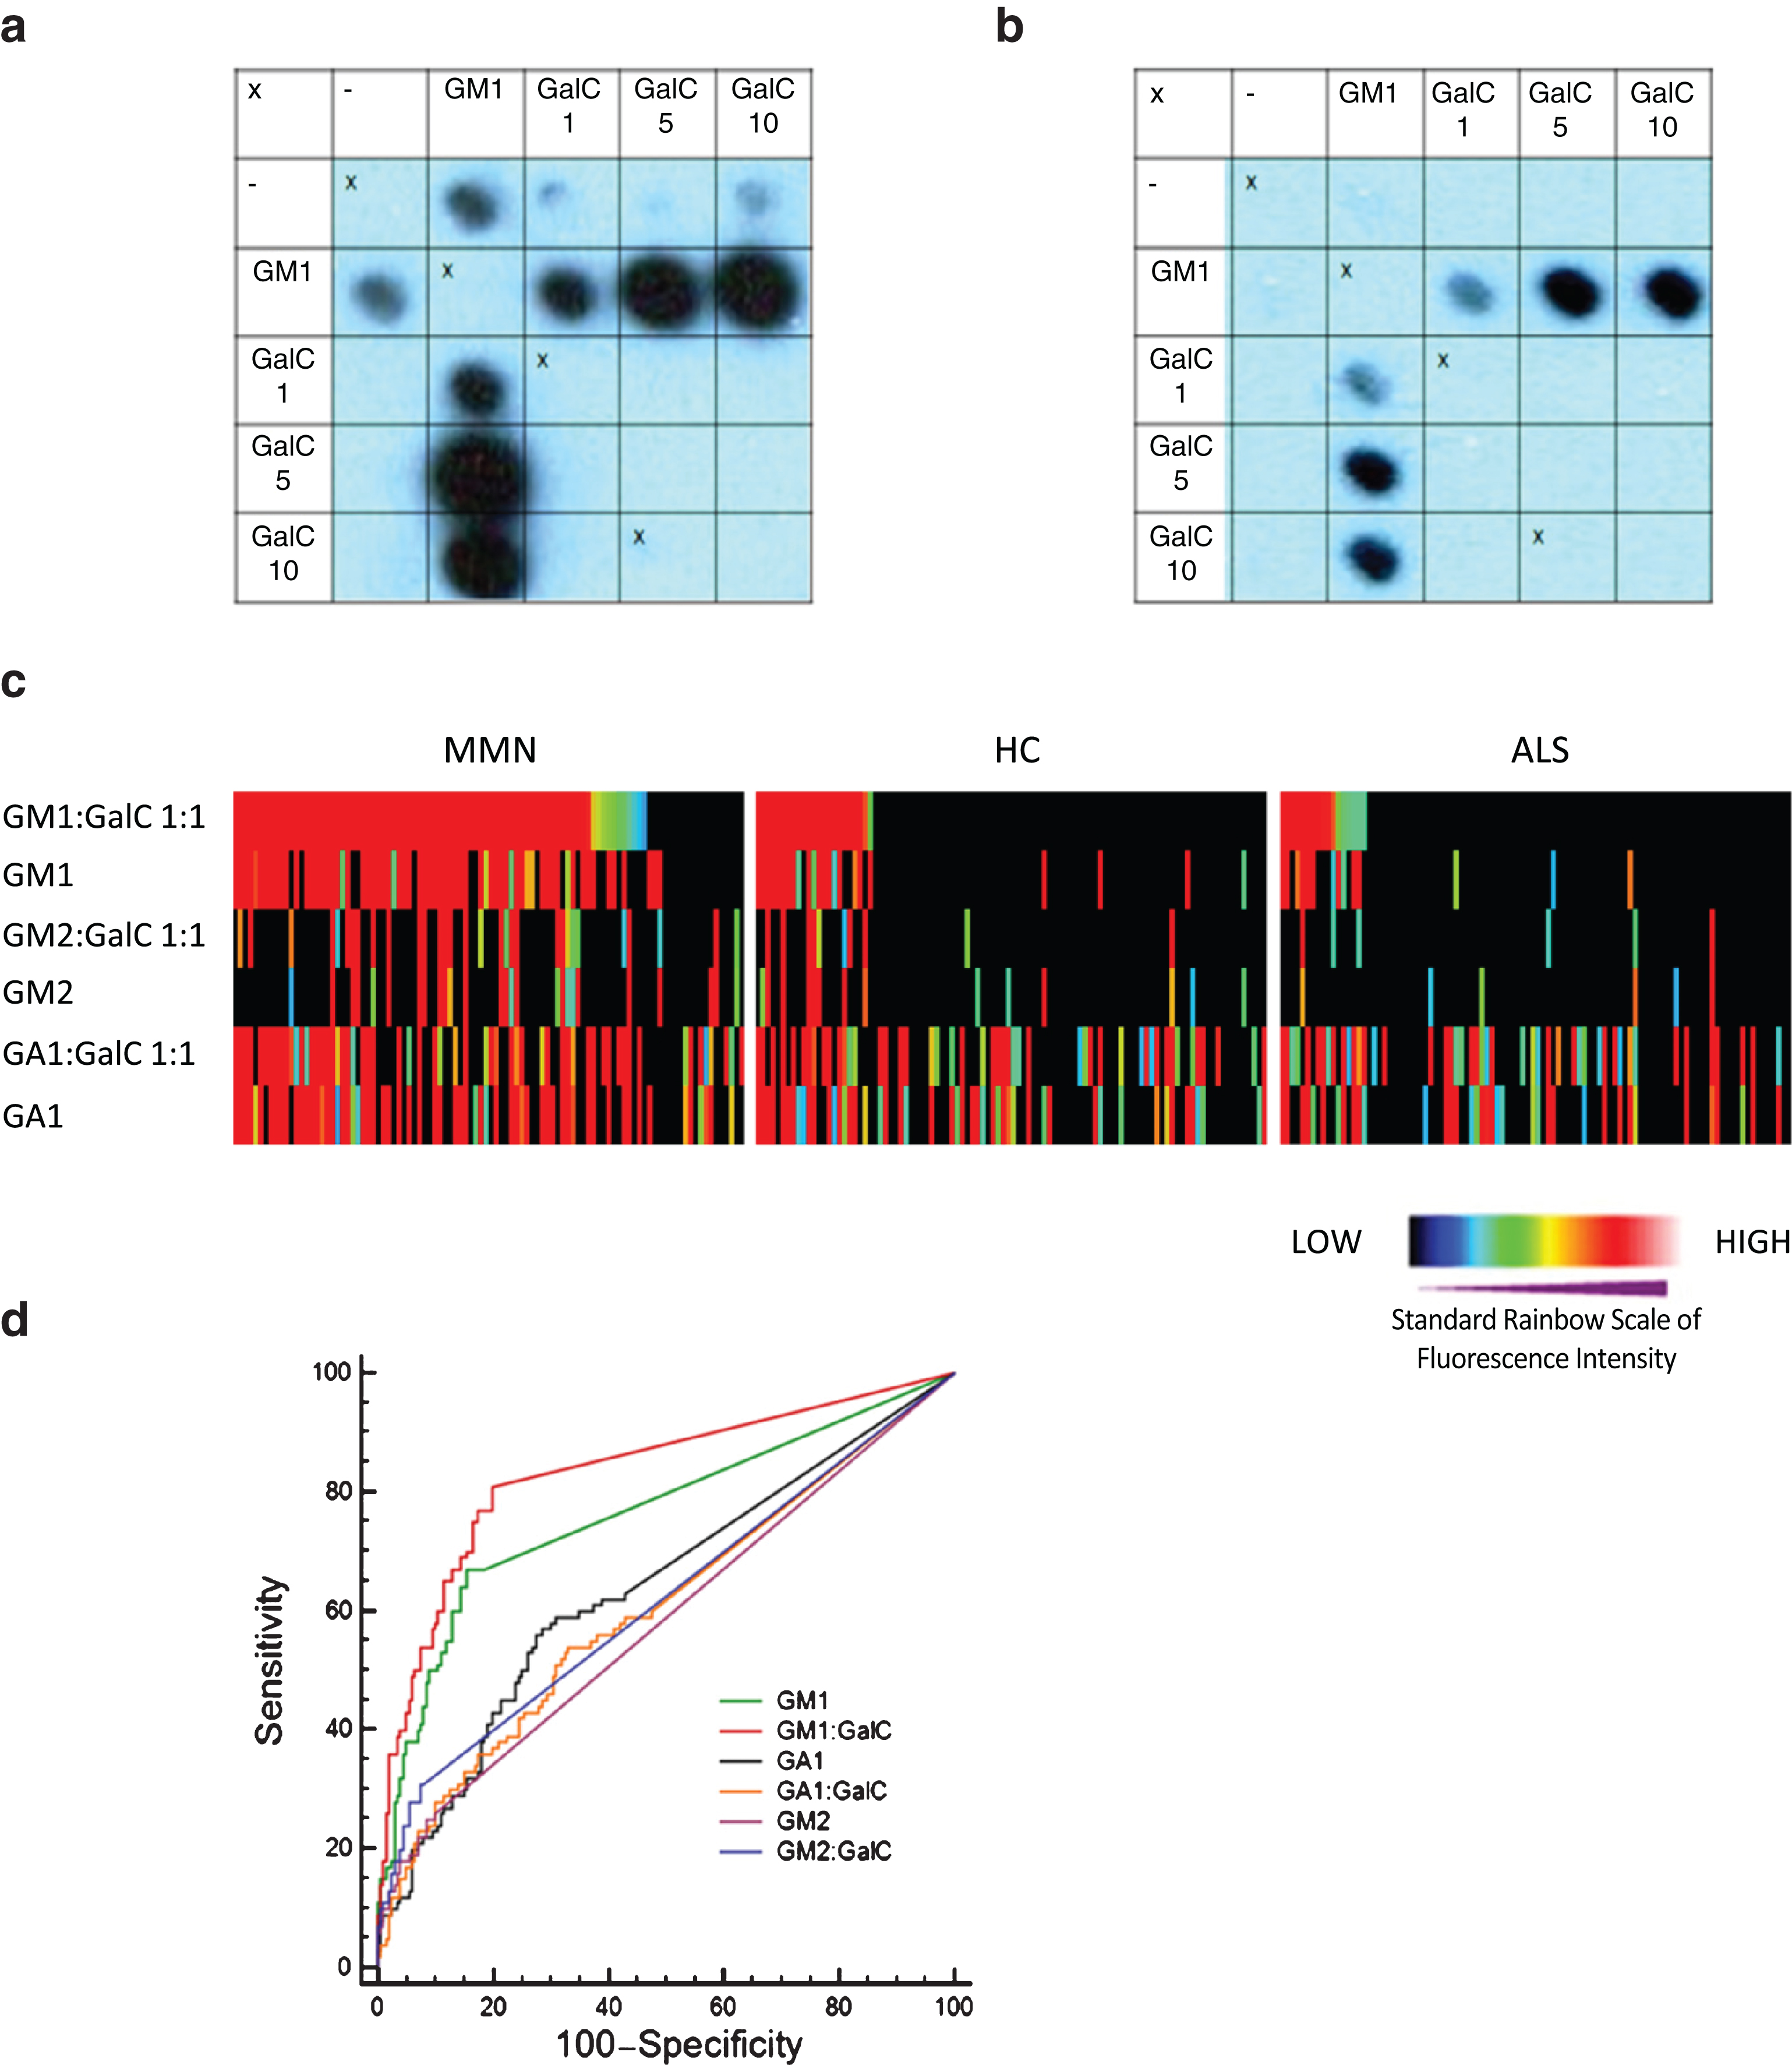
Fig.2
Flow chart diagram illustrating categorisation of all 300 serum samples tested by glycoarray as positive (>threshold) or negative (≤threshold) for GM1 (threshold = 5325) and GM1:GalC (threshold = 0). For all samples considered negative for both GM1 and GM1:GalC 1:1, the samples were also categorised according to ‘other reactivities’, in which a positive sample is determined as being greater than the calculated threshold for any lipid target tested on glycoarray.
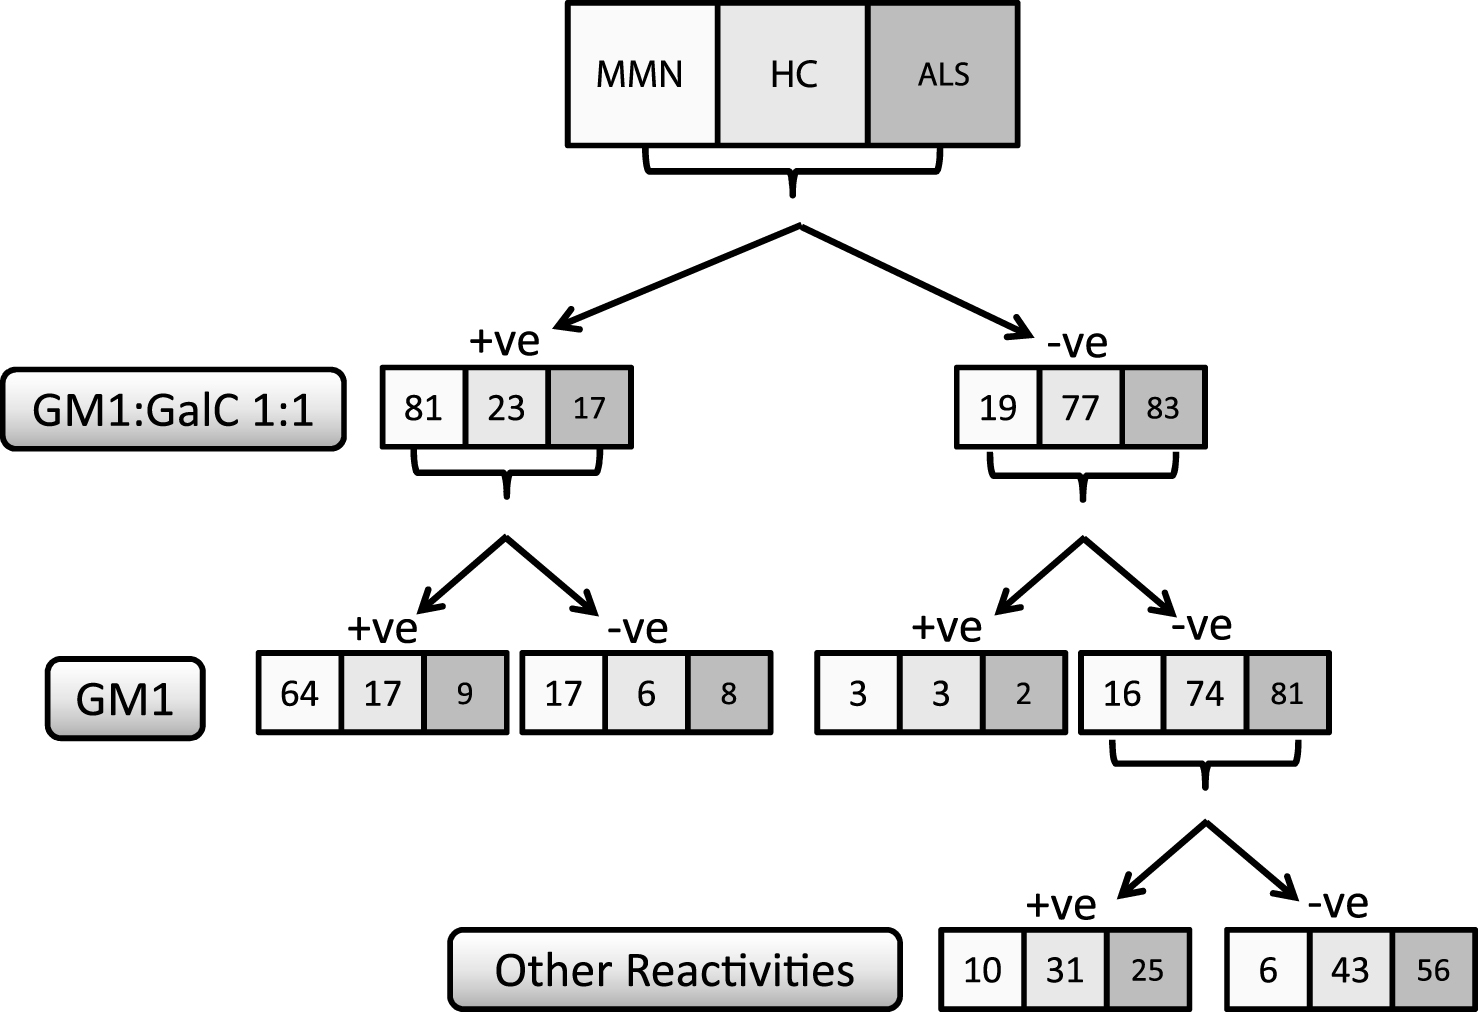
Fig.3
Box and whisker plots graphically illustrating the median and inter quartile data range for antibody binding intensity (glycoarray) and optical density (ELISA) for all 3 sample categories for GM1:GalC at 1:10 ratio. Outliers are individually assigned a data point (filled black circle) a. When testing by glycoarray a threshold of 21280 (dotted line) is applied to optimally discriminate disease and healthy groups. Complete separation of these groups is not possible, due to a substantial number of the control groups that were measured with binding intensities above the threshold. b. It is a similar scenario for ELISA utilising an optimised threshold of 0.121 (dotted line). When GalC is applied to GM1 at increasing ratios, antibody binding is increased in both MMN and control groups, thereby reducing both sensitivity and specificity compared with the optimal 1:1 ratio ofGM1:GalC.
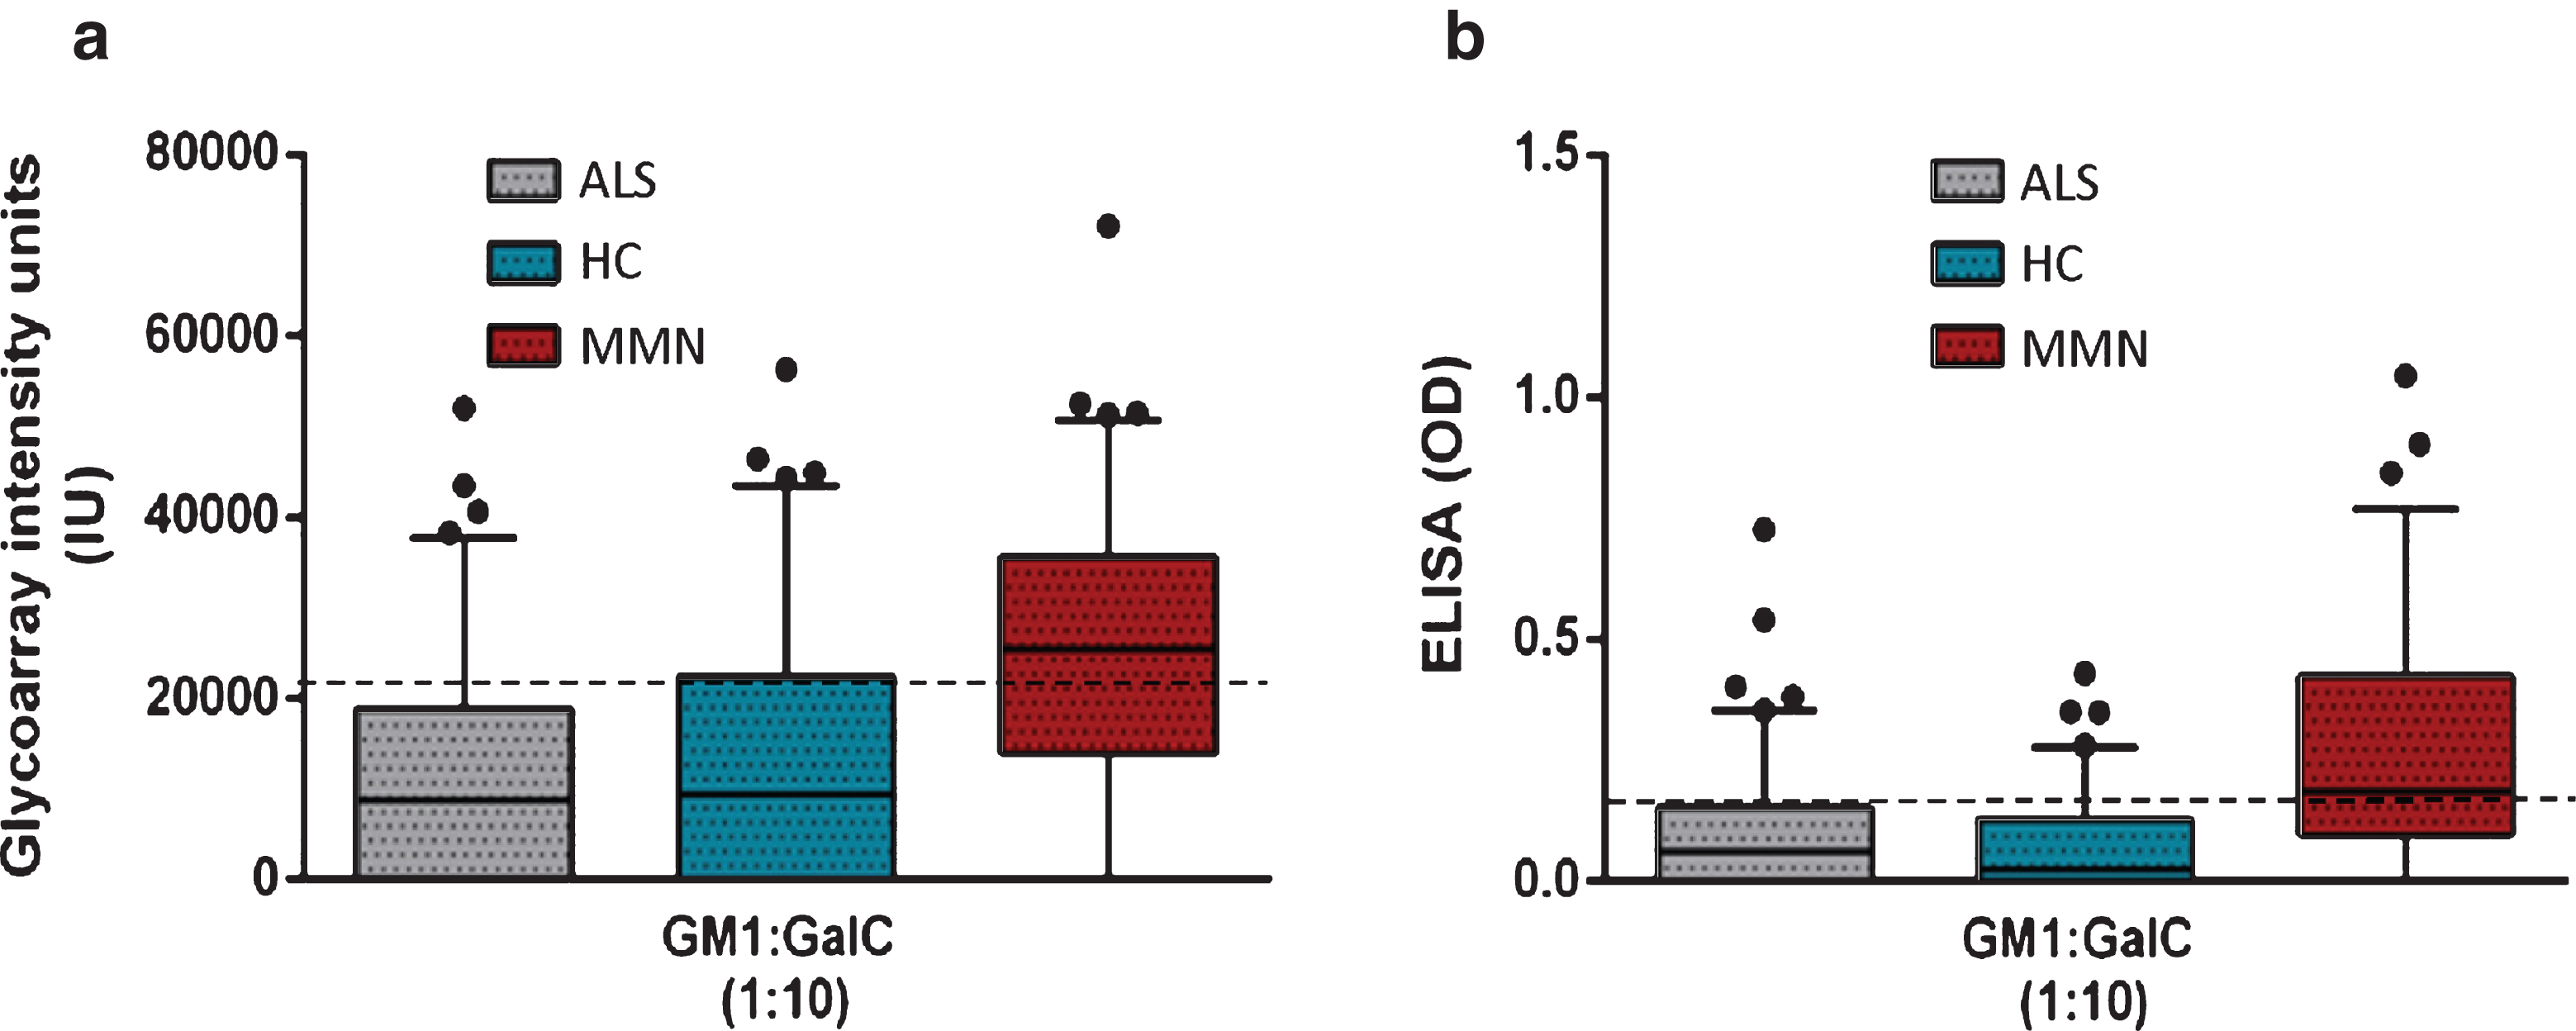
Table 1
Test performance of glycoarray and ELISA for GM1 alone and GM1:GalC at the various ratios after cut-off value optimisation
| Cut-off criterion value * | Sensitivity | Specificity | AUC | |
| Glycoarray | ||||
| GM1 | >5325 | 67 | 85 | 0.764 |
| GM1:GalC 1:1 | >0 | 81 | 80 | 0.834 |
| GM1:GalC 1:5 | >14650 | 70 | 77 | 0.778 |
| GM1:GalC 1:10 | >21280 | 61 | 79 | 0.743 |
| ELISA | ||||
| GM1 | >0.19 | 49 | 91 | 0.749 |
| GM1:GalC 1:10 | >0.12 | 69 | 74 | 0.767 |
*Cut-off value optimised for the highest diagnostic accuracy as determined by the J-index
Table 2
Clinical characteristics of GM1:GalC positive and negative MMN patients
| GM1:GalC reactivity | P-value | ||
| Negative | Positive | ||
| Number | 19 | 81 | |
| Gender, male | 15 (79) | 58 (72) | 0.52 |
| Age at onset | 41 (22– 52) | 42 (22– 68) | 0.40 |
| Site of onset | |||
| Cervical | 12 (63) | 57 (70) | 0.54 |
| Lumbar | 7 (37) | 24 (30) | |
| MRC sum score | 170 (128– 179) | 164 (113– 179) | 0.08 |
| ODSS | 3 (2– 6) | 3 (1– 9) | 0.39 |
| Conduction block | |||
| Definite | 16 (84) | 68 (84) | 0.98 |
| Probable | 3 (16) | 13 (16) | |
| Degree axon lossa | 2 (0– 8) | 2 (0– 9) | 0.55 |
| On IVIg maintenance treatment | 14 (74) | 64 (79) | 0.61 |
Data are median (range) or number (% ). Abbreviations: ODSS = Overall Disability Sum Score. aNumber of nerves with decreased distal compound muscle action potential (maximum 12).

