
Improved segmentation of brain tumors with data augmentation using MU-Net
Abstract
Semantic segmentation is crucial for the treatment and prevention of brain cancers. Several neural network–based strategies were rapidly presented by research groups to enhance brain tumor thread segmentation. The tumor’s uneven form necessitates the usage of neural networks for its detection. Therefore, improved patient outcomes may be achieved with precise segmentation of brain tumor. Brain tumors can range widely in size, form, and position, making diagnosis difficult. Thus, this work offers a Multi-level U-Net (MU-Net) approach for analyzing the brain tumor data augmentation for improved segmentation. Therefore, a significant amount of data augmentation is employed to successfully train the recommended system, removing the problem of a lack of data when using MR images for the diagnosis of multi-grade brain cancers. Here, we presented the “Multi-Level Pyramidal Pooling (MLPP)” component, where a new pyramidal pool will be employed to capture contextual data for augmentation. The “High-Grade Glioma” (HGG) datasets from the Kaggle and BraTs2021 were used to assess the proposed MU-Net. Overall Tumor (OT), Enhancing Core (EC), and Tumor Core (TC) were the three main designations to be segmented. The dice score was used to contrast the results empirically. The suggested MU-Net fared better than most existing methods. Researchers in the fields of bioinformatics and medicine might greatly benefit from the high-performance MU-Net.
1Introduction
Inconsistent brain cells clumped together to form a brain tumor. It might be malignant or not. The volume of datasets with low volume can be increased through “Data Augmentation (DA)”. It refers to several widely used techniques, including translating, flipping, rotating, and scaling. According to the type of images, these methods have varying degrees of accuracy. This study seeks to use several DA procedures to expand the volume limit of “Magnetic Resonance Imaging (MRI)” brain tumor images scans and then compare the outcomes of different methods because ML algorithms need a lot of data to develop a well-generalized model [1]. Early identification and detection of brain cancers are crucial for effective therapy. In actuality, it is crucial to improving care and guaranteeing a higher likelihood of survival. “Computed Tomography (CT)” and MRI scans, which is able to distinguish between aberrant and healthy brain cell proliferation, are two examples of diagnostic techniques and medical imaging equipment used to explain more about cancers. It has become possible to correctly classify brain tumors because to the tremendous advancements in medical science in the previous few decades. In image processing methods, “Convolutional Neural Network (CNN)” is utilized to categorize and to recognize the brain cancers and segment, identify, and classify MRI images [2]. A precise segmentation of the tumor, which is the process of dividing the tissues of the tumor from healthy brain tissues, is the first step in the MRI procedure to detect a brain tumor. This task is very challenging since tumors vary in their form, volume, thickness, and look. The most popular choice is MRI, which offers a broad contrast variety of tissues with a high degree of resolution and precision in the brain and is non-invasive [3]. The various clinical imaging modalities used to assess brain tumors include MRI, CT, “Positron Emission Tomography (PET)”, etc. MRI is usually selected among these. To gather the information needed for successful pathologies, a “Three-Dimensional (3D)” picture of an anatomy is produced [4]. Brain tumors are a specific form of cancer characterized by unchecked, excessive cell proliferation. Numerous variables, ranging from genetics to environmental factors including exposure to chemicals or high radiation sources, can cause cell damage. Typically, tumors are divided into heterogeneous neoplasms, which can be very invasive and difficult to differentiate (like multiform gliomas) or differentiable lesions (like meningiomas). The brain tumor with the highest death rate is glioma, which shows enhanced pathological progression. Early detection, on the other hand, significantly lowers these numbers. Fortunately, significant investments are being made today to address this and other brain cancer-related targets. Deep Learning (DL) a science that has gained a lot of attraction recently in the radiological area is one of the instruments used in research. Numerous applications for the identification and treatment of brain tumors have been covered by recent research, which has produced promising findings and results. However, considering the advantages the writers emphasize, the limited amount of research has validity in the actual clinical setting because of significant constraints [5]. By analyzing the issues in brain tumor segmentation, we propose a Multi-level U-Net approach to resolve it.
The contributions of this research:
• This technique was used in the process of preprocessing “Wavelet Thresholding”and image enhancement utilizing “Adaptive Curvelet Transform (ACT)”.
• This work extracted features using a “Fuzzy Gabor Filter”.
• This work suggested a “Multi-level U-Net (MU-Net)” for brain tumor segmentation.
• The study is structured in such a manner that Part II provides related work and problem statement, Part III outlines the recommended approach, Part IV depicts findings and discussion, and Part V draws a conclusion to the research along with the future work that will be done.
2Related works
[6] explains several transfer learning models that have been used to instruct a representation to identify brain cancers in resonance of magnetic imaging, including “MobileNet”, “InceptionV3”, “ResNet50”, and “VGG19”. An aforementioned representation, which was created using the “BraTS 2015” dataset, has a precision of 90.54%, 85.96%, 95.42%, and 91.69%, respectively. Identification of brain tumors in the area of medical image processing is a significant and challenging problem that necessitates handling vast amounts of data. [7] explains the first brain to maximize performance and reduce human effort, MRI pictures are pre-processed to enhance visual quality by increasing sample sizes to reduce network over-fitting. The agglomerative clustering-based technique is then used to obtain the tumor proposals or locations. A powerful tumor grading tool, the suggested method has been tested on a dataset of publicly available brain tumors. [8] describes segmentation using the Figshare data set and the “Unet Architecture” with “ResNet50” as the foundation, which reached a quantity of 0.9504 of “Intersection over Union (IoU)”. Data enhancement and preprocessing were created as methods to increase the categorization rate. Brain tumors can be classified into multiple categories using algorithmic evolution and learning transferred for reinforcement. [9] discusses a robust method for tumor lesion delineation is proposed. It is based on the integration of recognized elementary networks for segmentation and detection. With the help of our method, they were able to successfully infer a strong segmentation on a rare tumor that was situated in a previously unknown tumor context region during training. Without additional training or adjusting the network design, they get an average dice score of 0.62 for the uncommon tumor “Diffuse Intrinsic Pontine Glioma (DIPG)”. [10] explains the use of the “YOLOv3” deep neural network model with compact “Electro-Magnetic (EM)” imaging devices to detect brain tumors. The widely used object recognition model YOLOv3 offers excellent accuracy and faster processing. Utilizing a tissue-mimicking head phantom, the scattering properties of the nine-antenna array arrangement, where the eight other antennas serve as receivers and one serves as a broadcaster [11]. Classified and identified brain cancers in the pituitary gland, meningioma, and glioma using cutting-edge “Transfer Learning (TL)” trained algorithms. A selection of the nine pre-trained TL classifiers that will be assessed are “Inceptionresnetv2, Inceptionv3, Exception, Resnet18, Resnet50, Resnet101, Shufflenet, Densenet201, and Mobilenetv2.” The goal is to automatically identify and diagnose brain cancers by utilizing a fine-grained categorization technique. This evaluation of the TL algorithms is conducted using a publicly available Kaggle brain tumor classification dataset. Furthermore, default settings are used for optimization for every “Deep Learning (DL)” models. A deep machine learning architecture was presented by [12–15] for automatically categorizing MRI pictures under investigation into tumor or no tumor using supervised learning. They give particular attention to CNN and augmentation methods. The first of the three steps of the proposed method resizes (normalizes) brain tumor images into equal sizes for efficient model training. Significant augmentation of data is then required to address the issue of missing data while handling categorization. To building the CNN image for categorization of frameworks. [16–20] offers two “deep learning” based methods for identifying and categorizing brain tumors. The “BRATS 2018” dataset, which included 1,992 brain MRI scans, was broken down into smaller subsets for this investigation. 85.95% accuracy was attained by the YOLOv5 model, and 95.78% accuracy was attained by the FastAi classification model. [21–23] main goal is to provide researchers with a thorough literature review on magnetic resonance imaging for the identification of brain tumors. The anatomy of brain tumors, publicly accessible datasets, augmentation methods, categorization, object recognition, characterization, and this survey covers deep learning, virtual machine learning, and transfer learning for the research of brain tumors. recommends using edge-based fuzzy logic with U-NET CNN classification for brain tumor detection. The proposed tumour segmentation system is based on image enhancement, fuzzy logic-based edge detection, and classification. combined many new data-augmentation methods with MRI imaging of brain tumors. To enhance comprehension of the use of these methods, it reviews the papers submitted to the Multifunctional Brain Tumor Segmentation Challenge (BraTS 2018 edition). The BraTS database has become the industry standard for evaluating both cutting-edge and well-established methods for brain tumor segmentation and detection. It examines how the data augmentation techniques used altered the fundamental supervised learners’ capabilities. examine common image enhancement techniques and their features in this chapter. Examine and analyze data augmentation techniques that can be applied to medical picture analysis. The information presented in this chapter attempts to offer recommendations for deep learning model training for a range of medical imaging evaluation application where annotation data are scarce or difficult to get. The research proposed a method (using fuzzy C-Means clustering algorithm, then utilizing traditional classification and convolutional neural network) to identify brain tumors from two-dimensional (MRI) brain scans. The experimental examination was carried out utilizing an updated dataset with a range of tumor sizes, locations, shapes, and imagines intensities.
[23] used the Super Pixel is the first algorithm in the recommended method to cluster the images. They utilize the morphological operators to slice the disconnected portions. The active pattern algorithm is utilized to identify the tumors and malignant nodules. The outcomes demonstrate that the recommended approach outperforms the most advanced techniques in the area.
2.1Problem statement
Data augmentation, or implicit regularization is a widely used method for improving the generalization capabilities of neural networks. It is essential when there is a dearth of high-quality actual data and it is costly and time-consuming to locate fresh samples. In particular, tumor delineation, this is a particularly prevalent issue in the interpretation of medical images. In the majority of training system circumstances, using standard methods of data augmentation severely restricts its capabilities and has a detrimental effect on the output accuracy. Despite the superior representational capabilities of CNN-based approaches, the convolution kernels’ constrained receptive fields make it challenging to construct explicit long-distance dependence. Global semantic knowledge must be learned to do complicated prediction tasks like segmentation, which is made more challenging by this convolution operation restriction. The expanding lesion’s so-called mass impact progressively diminishes the validity of spatial prior knowledge for the healthy region of the brain by potentially dislodging healthy brain structures. A removal space has the same effect after therapy. The outcomes indicate that while it is relatively easy to segment the whole tumor area for both greater and low-grade tumors, as well as the tumor core area for high-grade tumors, it is much more difficult to locate the “core” in low-grade gliomas and to distinguish the growing structures for high-grade cases. These results provide an upper bound on the efficiency of any algorithmic segmentation. We recommend the MU-net strategy to solve this problem.
3Proposed methodology
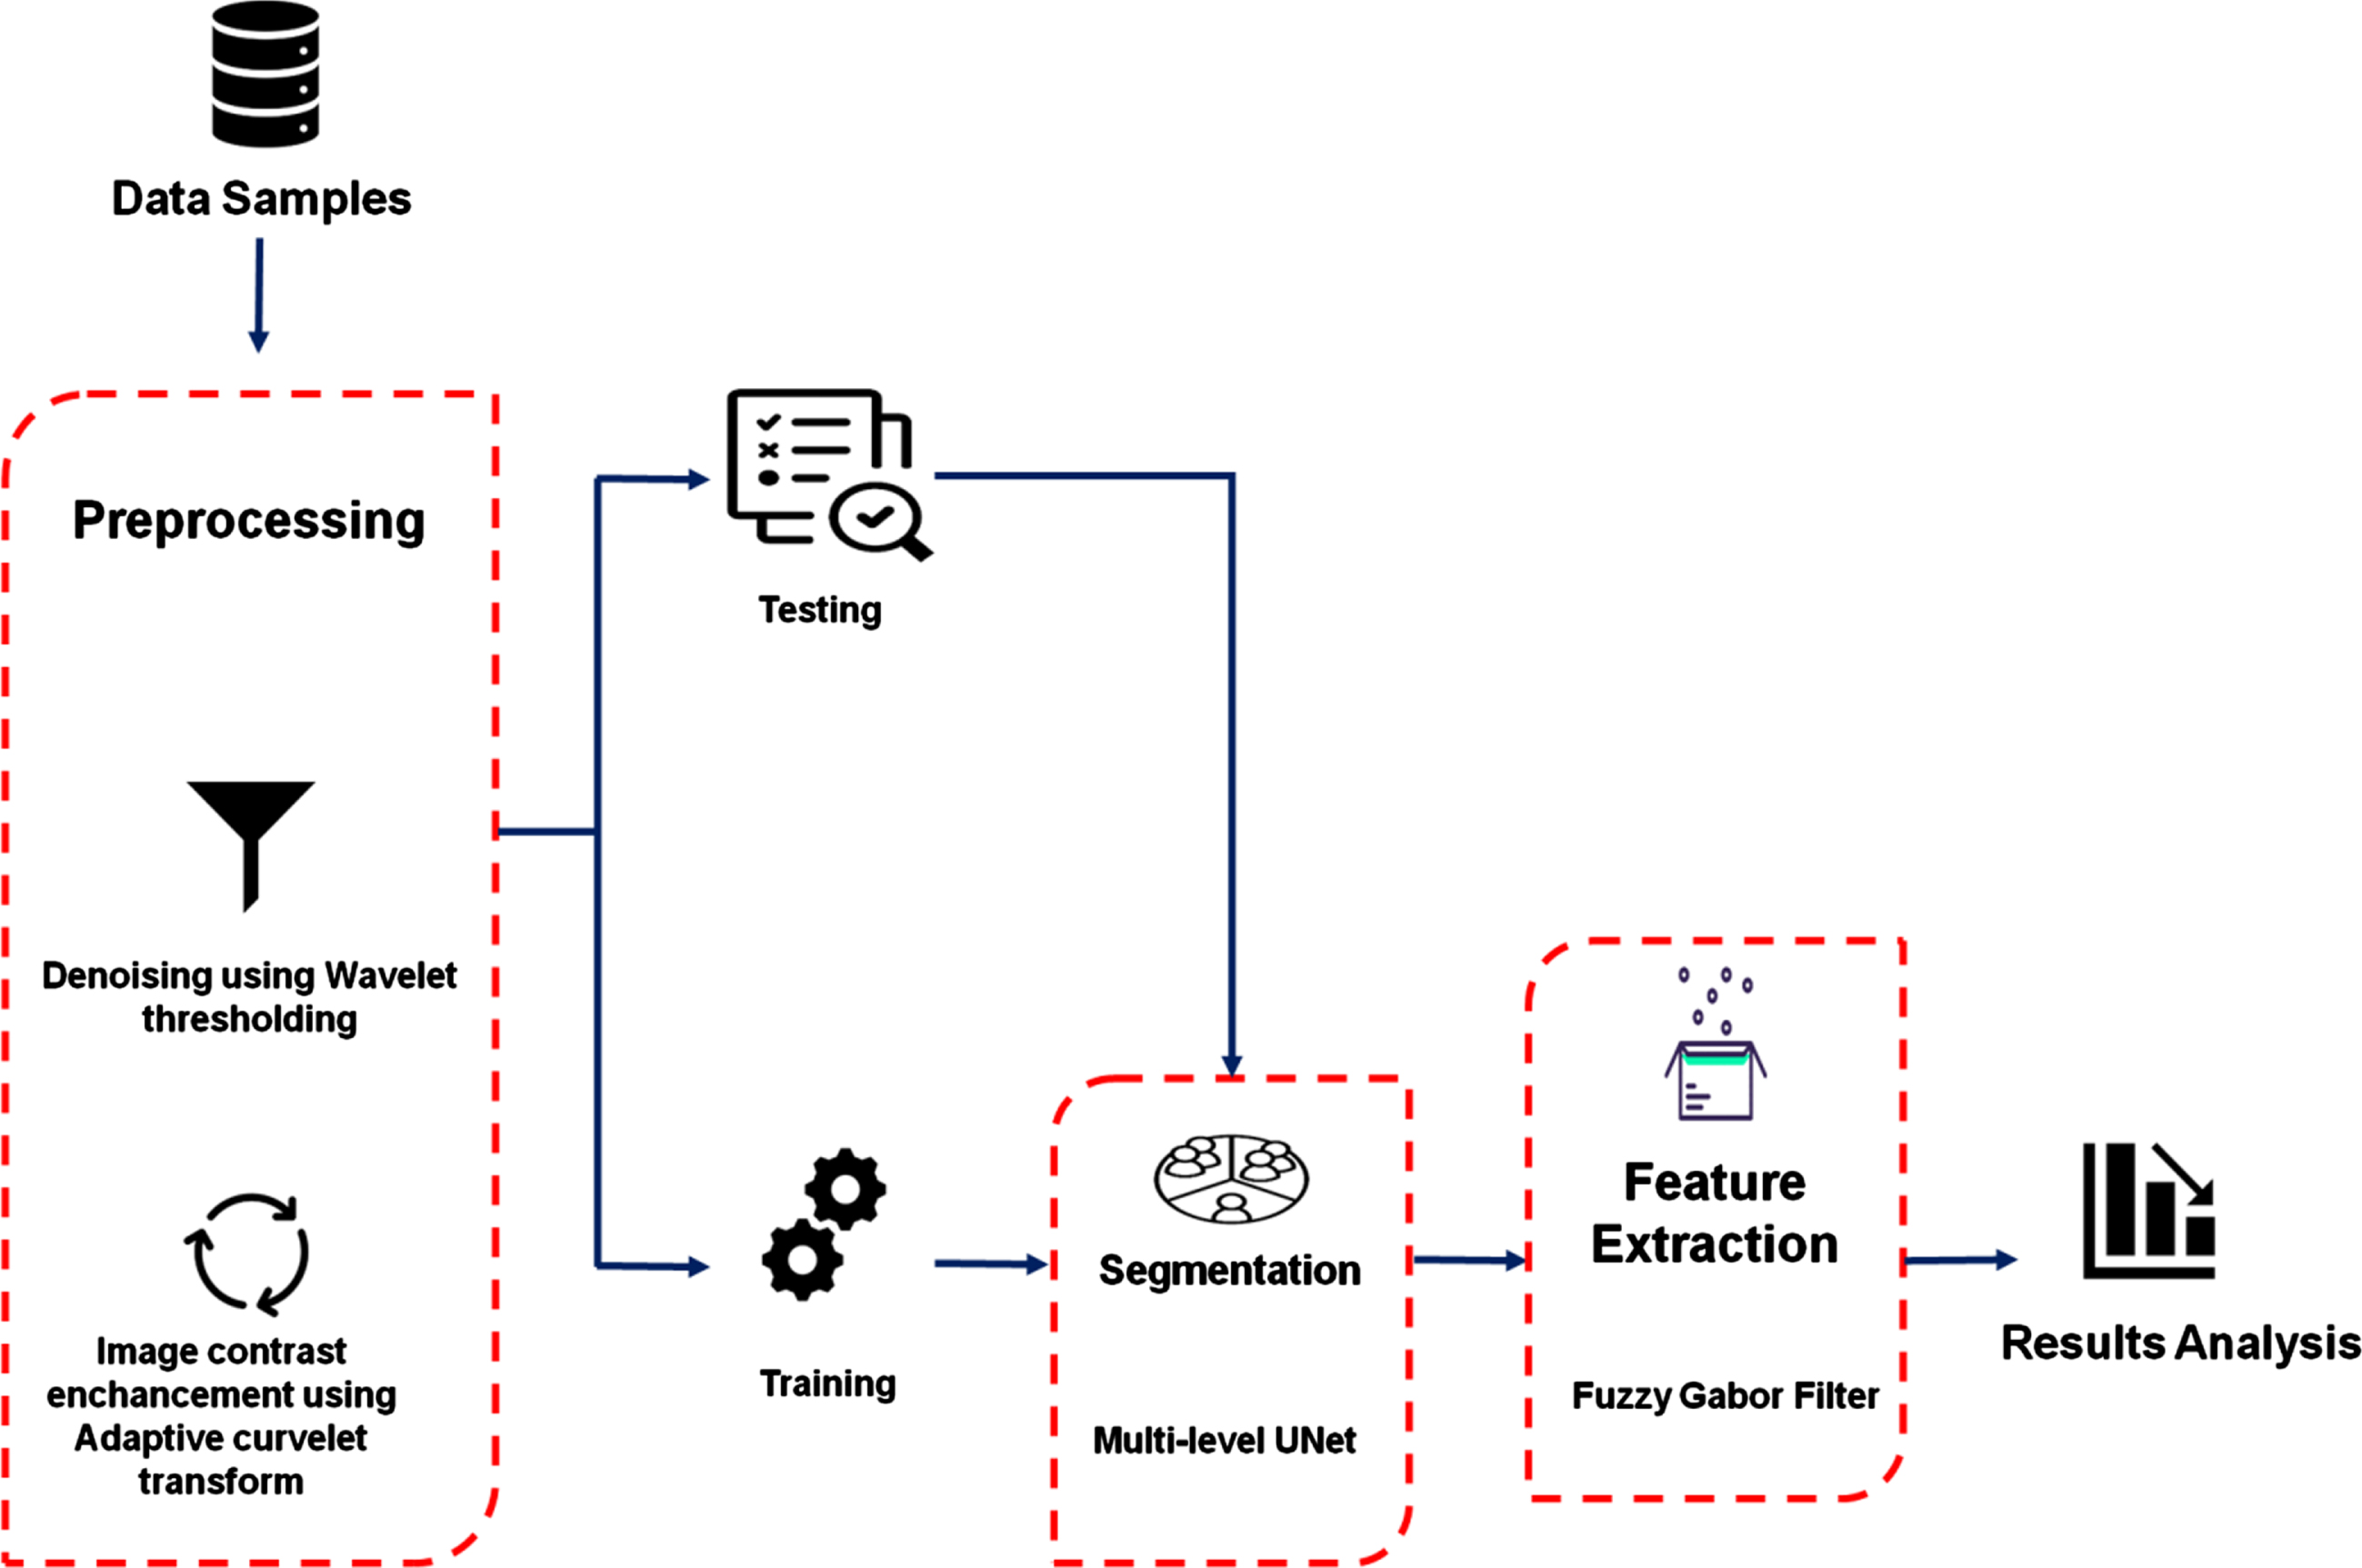
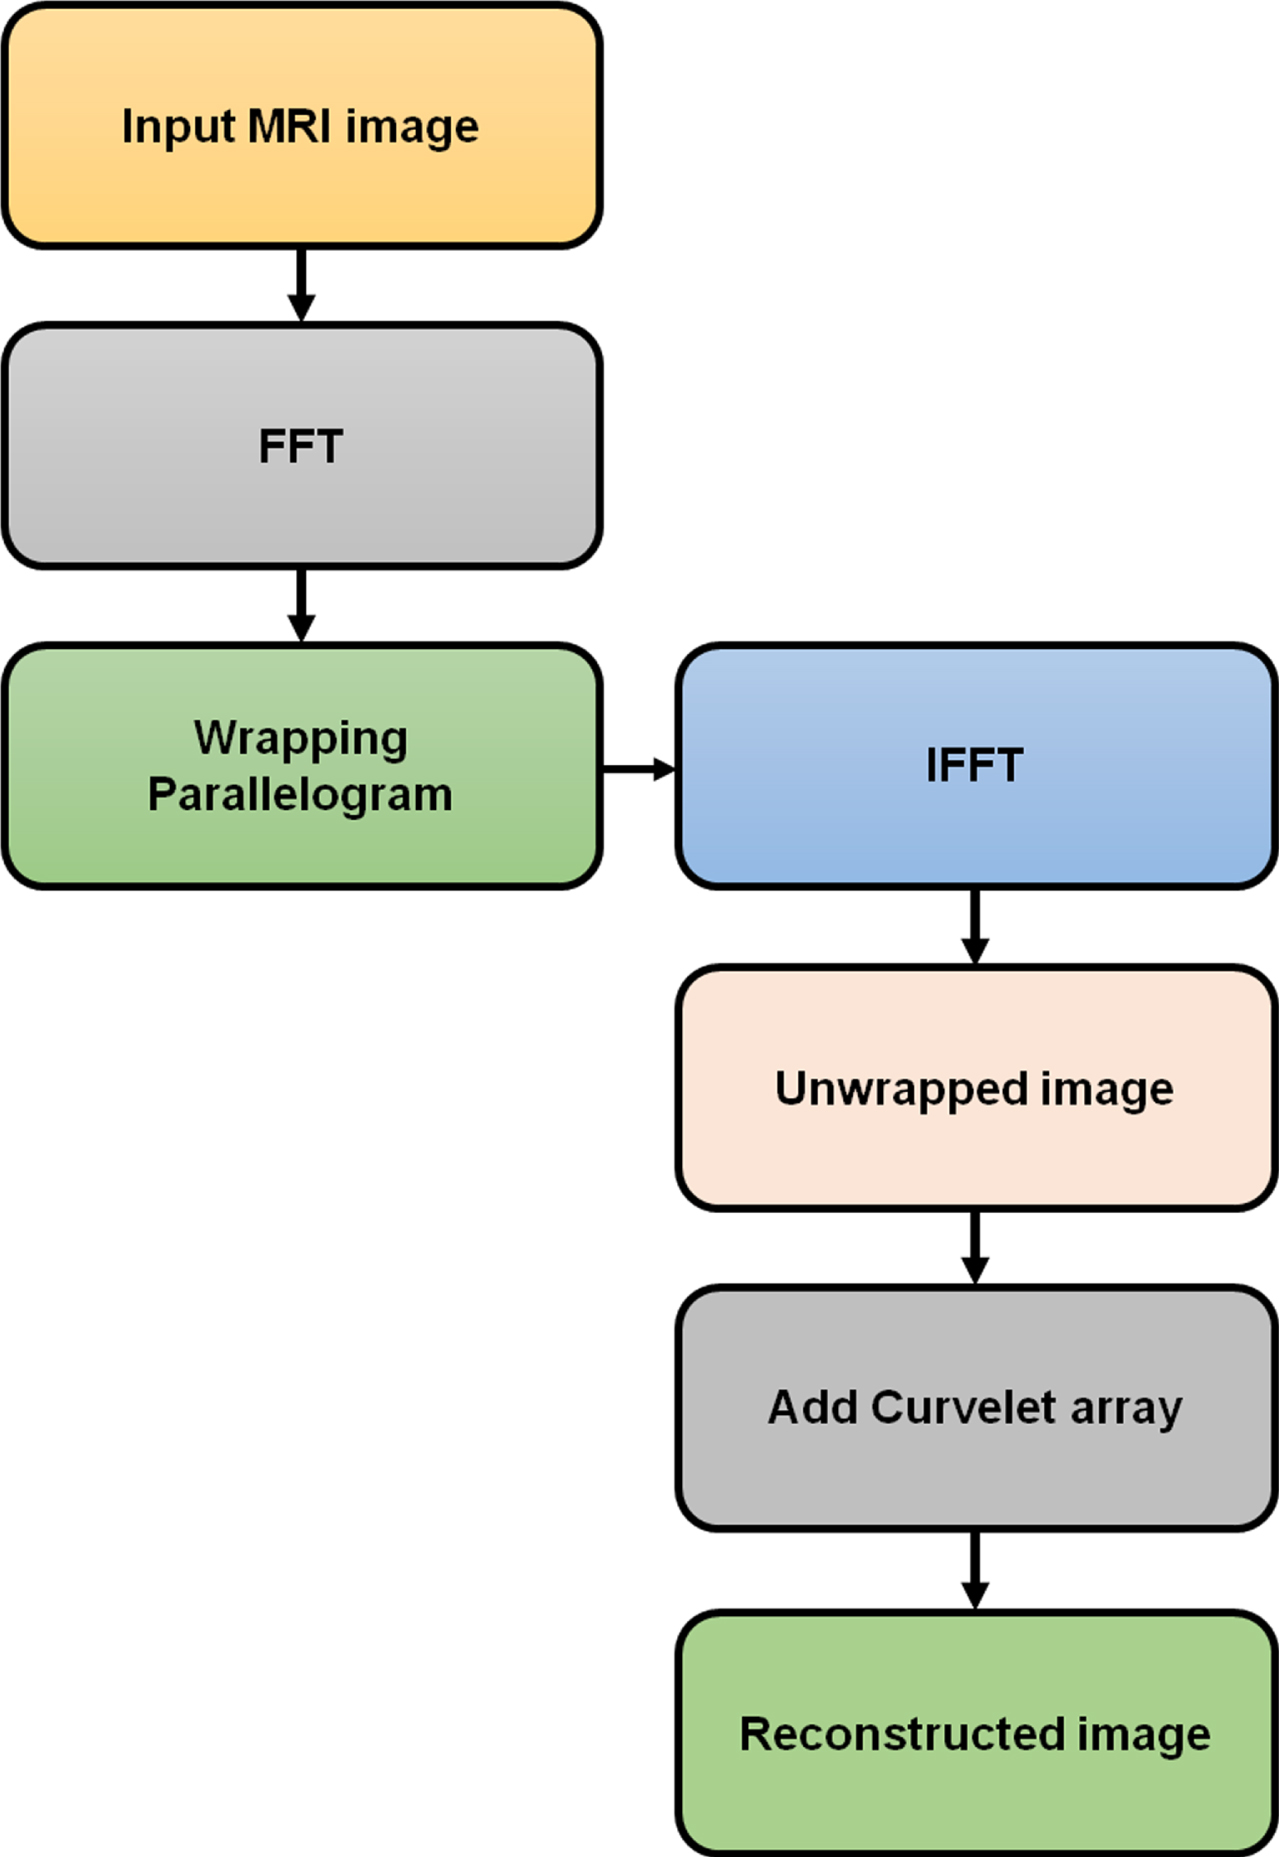
Thresholding, contrast enhancement, and feature extraction are all part of the suggested MU-Net approach for the identification and segmenting of brain tumors. For enhanced visualization and contrast enhancement utilizing ACT, the original brain pictures are first refined using “Wavelet Thresholding.” After that, the feature extraction is done using a “Fuzzy Gabor Filter.” Figure 1 displays workflow.
Fig. 1
Workflow.
A. Dataset Collection
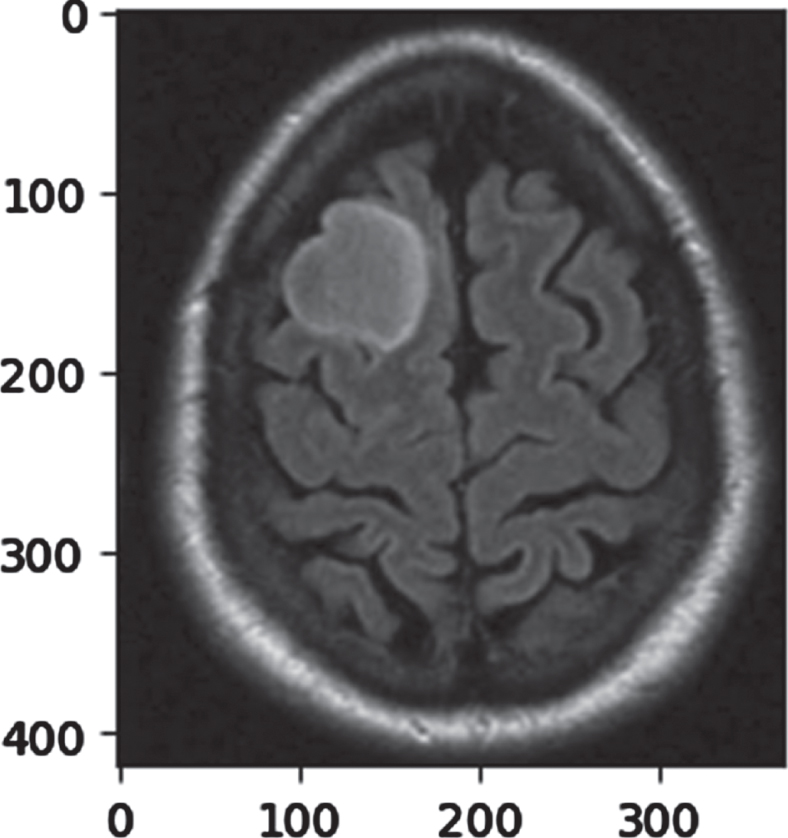
The dataset was obtained from the open data website Kaggle (https://www.kaggle.com/datasets/sartajbhuvaji/brain-tumor-classification-mri). The dataset includes MRI images of respective tumor classes. The four divisions are ‘Normal’, ‘Glioma’, ‘Meningioma’, and ‘Pituitary’. We divided this data set into two different sets. In the training set, 2612 items from 2 classes were detected. In the testing set, 652 items from 2 classes were detected. Figure 2 shows a picture with a tumor in it. In the tests; The dataset size is increased by an amount of 2048 via data augmentation. This is accomplished by utilising PCA colour augmentation to randomly clip 224×224 changes the RGB channels intensity and flips each patch from the primary images horizontally.
Fig. 2
Brain tumor.
• Enhancement of image data
Image enhancement is a technique for fictitiously increasing information gathering. This is helpful if a set of data with few data sample is given. A deep learning model tend to over-fit when it is trained on a small number of data sets. Feature extraction simplifies the process of visual transformations. Some of the modifications that are mainly utilized for picture augmentation include flipping, color modifications, trimming, motion, geometrical alteration, protection, re-scaling, enlargement, grey sizing, darkening and intensity, random erasing, etc.
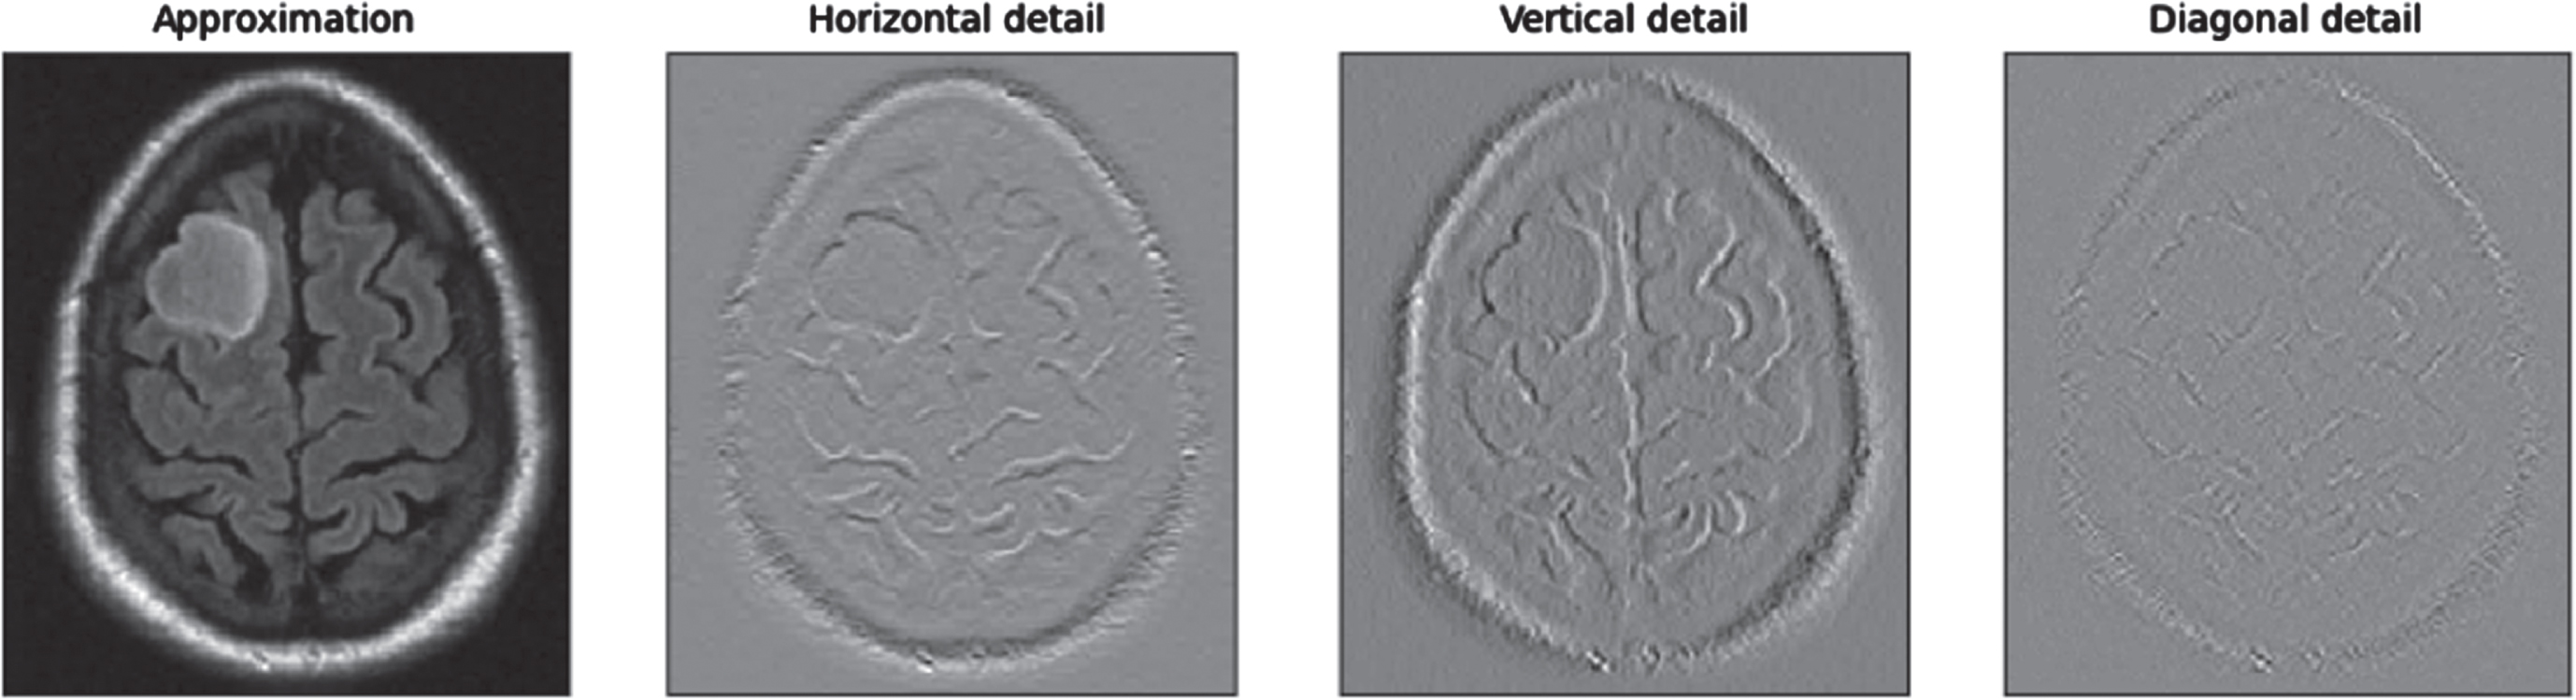
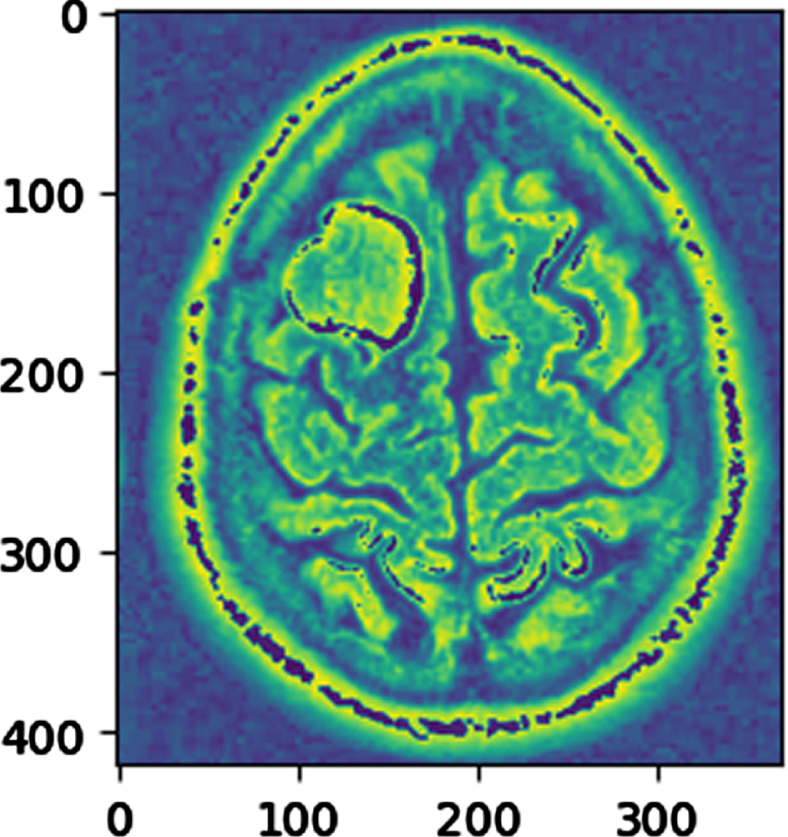
An MU-Net technique is suggested in this study to diagnose brain tumors using MRI data. The current approach makes use of frontal photographs from the visual laboratory database. First, picture quality augmentation and selection are done using a wavelet transform operation, and then add hot areas, including the armpits and neck, are segmented. Complex data is simple to recognize and obtain because of the organized collection of characteristics. The acquired findings demonstrated that using Multi-Level U-Networks with increased depth led to overfitting and was unable to provide acceptable rates. The original picture was nearly completely obscured by noise after adding noise. Despite using both soft and hard thresholds to reduce noise, the picture still had significant noise. Figure 3 displays the wavelet transform of an image of a brain tumor.
Fig. 3
Transform of wavelets.
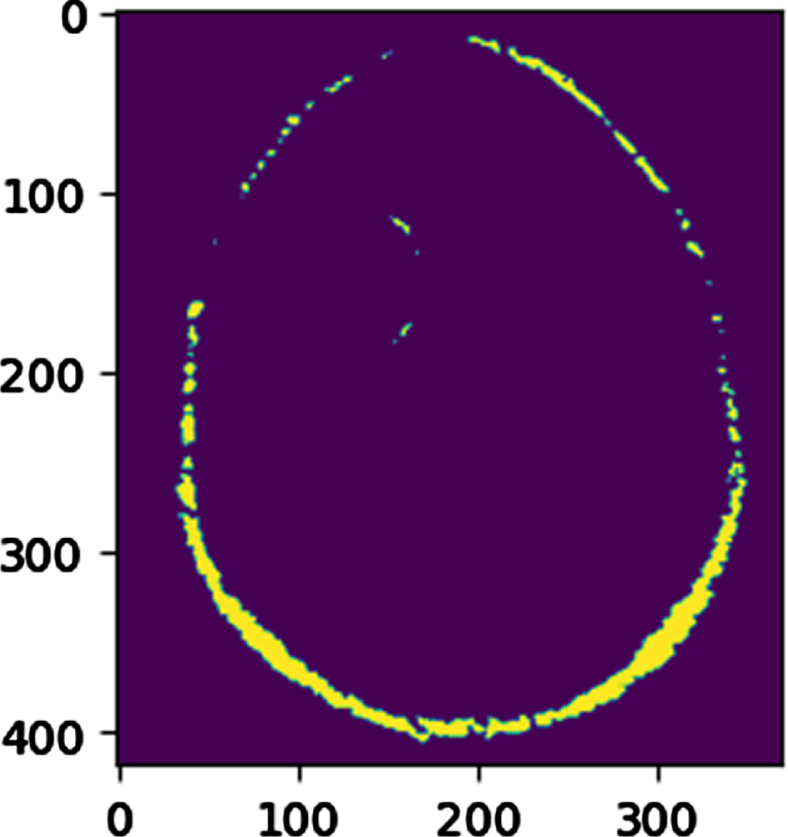
Using both soft and hard thresholds to eliminate noise makes the picture look smoother given the increase in noise. The picture was rather clear thanks to the approach described in this study, which completely reduced the image’s noise. In Fig. 4, the threshold picture is shown.
Fig. 4
Threshold image.
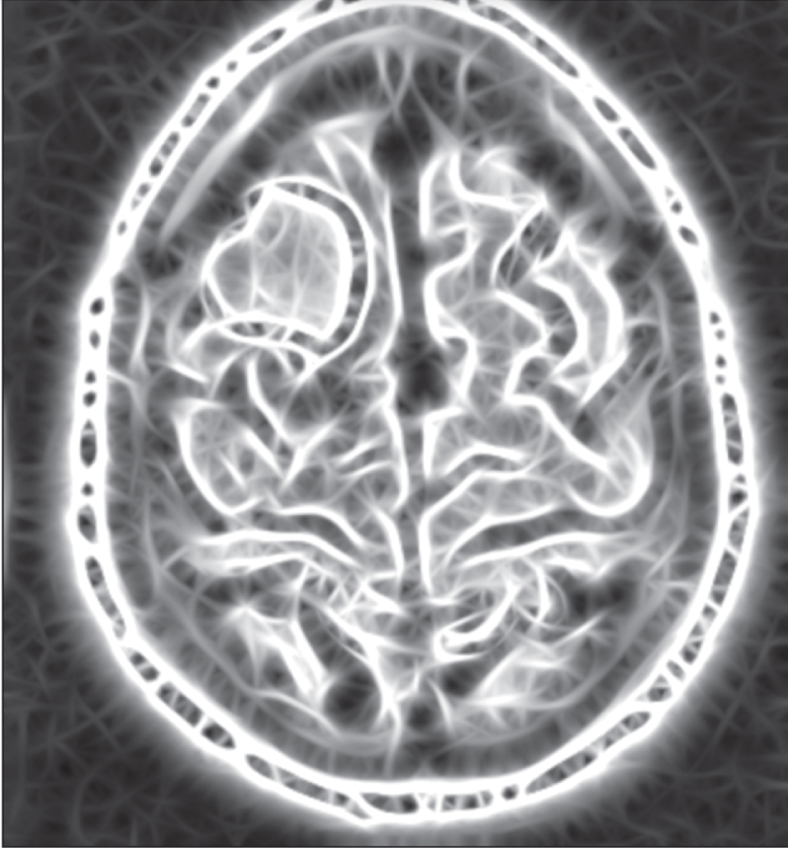
The curvelet transform adheres to the adaptive scaling concept. The detail portion of the picture is represented by the curvelet transform’s multi-scale edges. The curvelet has greater perceptual quality compared to other transforms and offers superior curvilinear properties. The curvelet transform’s most notable feature is that Using multi-scale representations and adaptive scaling, the MRI image’s characteristics are retrieved. The picture of a brain tumor created with ACT is shown in Fig. 5.
Fig. 5
ACT image contrast enhancement.
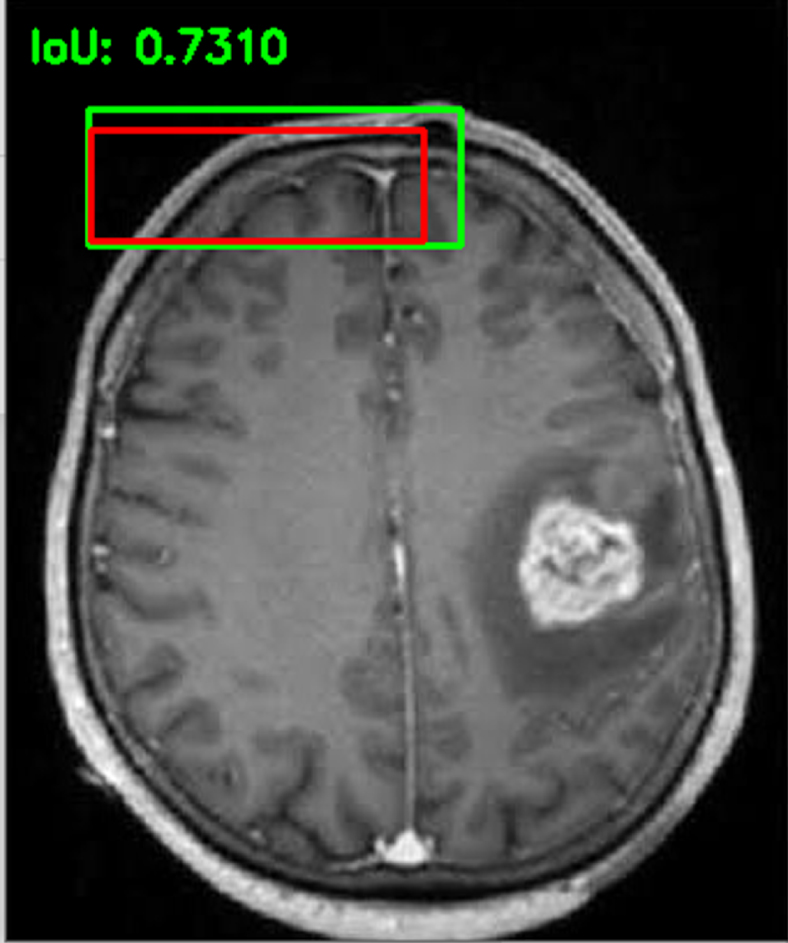
We initially contrasted our suggested MU-Net with pooling layers to a traditional separative U-Net and MU-Net to show the efficacy of multi-level learning. Figure 6 displayed the segmentation output.
Fig. 6
Segmentation image.
The outcomes produced by the fuzzified Gabor filter are shown in Fig. 7. Since the model parameters were chosen to highlight the information of the reference image, it is obvious that the areas around the plates saw the strongest responses. These findings also included more textures that could be detected as opposed to the outcome of the conventional Gabor filter.
Fig. 7
Extracted image.
B. Preprocessing
• Wavelet Thresholding
There are various methods for removing noise from photos in the current study. Wavelet de-noising has several applications. There are several benefits to using the wavelet approach to remove noise. The method is not only easy to use but also has a very excellent de-noising impact. As a consequence, this approach has produced excellent outcomes in real-world settings. Wavelet threshold de-core noising’s approach is founded on the wavelet’s clear connection. The energy of the signal is often concentrated on the large parameter after a wavelet transform. Since there is no wavelet correlation in the noise, there are no concentrated characteristics in the noise energy after wavelet processing. Signals predominate in wavelet coefficients with high amplitude values, while noise predominates in coefficients with low amplitude
This is how the soft threshold is determined:
(1)
The following is how the semi-threshold function is expressed:
(2)
This is how the hard threshold is represented:
(3)
We improved the threshold to compensate for the absence of soft and hard thresholds. In this study, we compared the subjective and objective experimental findings and concluded that the enhanced de-noising impact of the threshold function outperformed thresholds de-noising, both soft and hard.
vj,k –The wavelet coefficients at that particular position.
λ –The wavelet coefficient’s absolute value is set to zero if its value is less than the threshold parameter; else, it remains unchanged.
sgn (vj,k) –It returns -1 for negative, 1 for positive, and 0 for zero values.
λ 1 and λ 2 –Two threshold configurations that describe a semi-thresholding range.
3.1Adaptive curvelet transform (ACT)
To extract the features, ACTs with wrapping are utilized to get the curvelet coefficients. Smooth curves may be used to represent the characteristics of the ACT. The curvelet was created to overcome the drawbacks of wavelets. Due to the wavelets’ small number of directional components, they are unable to discern edges and curves. In general, “Unequal Space Fast Fourier Transform (USFFT)” and wrapping are the two types of techniques employed in the ACT. To derive the curvelet coefficient, the ACT wedge wrapping frequency is used. The ACT has more scales and angles and is more three-dimensional. Curvelet coefficients are obtained using IFFT. In Fig. 8, the ACT’s process is shown.
Fig. 8
Curvelet process wrapping method.
A matrix (Kc, r) represents the curvelet coefficients with angle ‘c’ and scale ‘r’. The following are the steps for implementing ACT:
• The discrete Fourier transform is represented as v [q1 , q2]for images of sizes P1 and P2, whereas for continuous images, it is denoted as v (q1 , q2).
• FFT is applied to v (q1 , q2) to produce the Fourier sample v [q1 , q2].
• The sample values v [q1, q2 - q1, tan θ c]for each scale are used to resample.
• Then add a window (w) to the sheared object function (u)
(4)
• Applying IFFT is the last step (Inverse Fast Fourier Transform).
C. Segmentation
• Multi-level U-Net (MU-Net)
The discriminator and generator are the basic components of a generative adversarial network. According to Equation (16), these two networks engage in a minimax two-player competition with one another. This formula G and D stands in for the generator and the discriminator, respectively. The symbol G (x) represents the likelihood that element x originates rather than using artificial samples, from the actual dataset.
(5)
No matter how similar the synthetic samples created by the generator are to the actual pictures, the discriminator’s goal during training is to tell them apart. The generator is to give examples which are as accurate as feasible with the intent to confuse the discriminator. Both the discriminator and the generator concurrently optimize their networks throughout this process until Nash equilibrium is reached. A generative adversarial network can collect high-dimensional digital information distributions thanks to its distinct competing mechanism. To combat the basic segmentation network’s loss of spatial information, we thus integrated adversarial learning MU-Net to generate an adversarial MU-Net, therefore gathering considerably more usable data for segmentation. With the addition of network depth, MU-Net is intended to address the issues of growing training errors and declining network performance. To further enhance the effectiveness of our adversarial MU-Net’s segmentation, we included multi-level instruction in our proposed model. This modified the gradient information flow. We used an adversarial technique based on this segmentation network to further guarantee that the distributions of the volumes created matched those of the ground truth pictures to create an adversarial MU-Net, a better segment. A segmented network includes the hostile MU-Net as the creator in a probabilistic model. As a result, the generated synthetic volumes are based on the probability maps that were derived from the segmentation network. Five convolutional layers make up the adversarial network in this study. From the first to the fifth layers, the kernel sizes are 7 × 7, 5 × 5, 4 × 4, 4 × 4, and 4 × 4. The resource values of the giver and the receiver in an adversarial MU-Net are specified in Equations (6) and (7), respectively. P total images make up the collection. The letters Kz and Oz, respectively, stand in for the segmentation network’s fake samples and the real pictures from the dataset for MRI. D denotes the discriminator, while G denotes the generator. After that, we included the adversarial MU-Net, which improves the flow of gradient data across the network, to significantly improve segmentation performance.
(6)
(7)
• Multi-Level Pyramidal Pooling module (MLPP)
Data augmentation techniques are used to provide fabricated examples of real-world data in order to produce more input samples for model training. The goal of employing data augmentation for datasets with less data, as stated by is to create a more robust dataset for the model to use when it is being trained. In general, this is advantageous when training models to handle problems involving limited data, such as biomedical picture segmentation. In this way, the initial U-Net concept also utilized data augmentation methods. Additionally, we include MLPP to collect more pertinent data for segmentation. We added a new pyramidal pooling to the aforementioned segment to collect contextual data during the model testing period. The most effective of four sets of communication networks with different numbers of polygonal pool units for merging data from different sizes were selected, and it served as the foundation for the final iteration of our proposed technique. Figure 9 shows the many pooling levels.
Fig. 9
Conventional pooling arrangement (a), blending mode (b), it has two components of layering pools (L1), and grouping inflation mode (c), which has three tiers of layering pooling (L2).
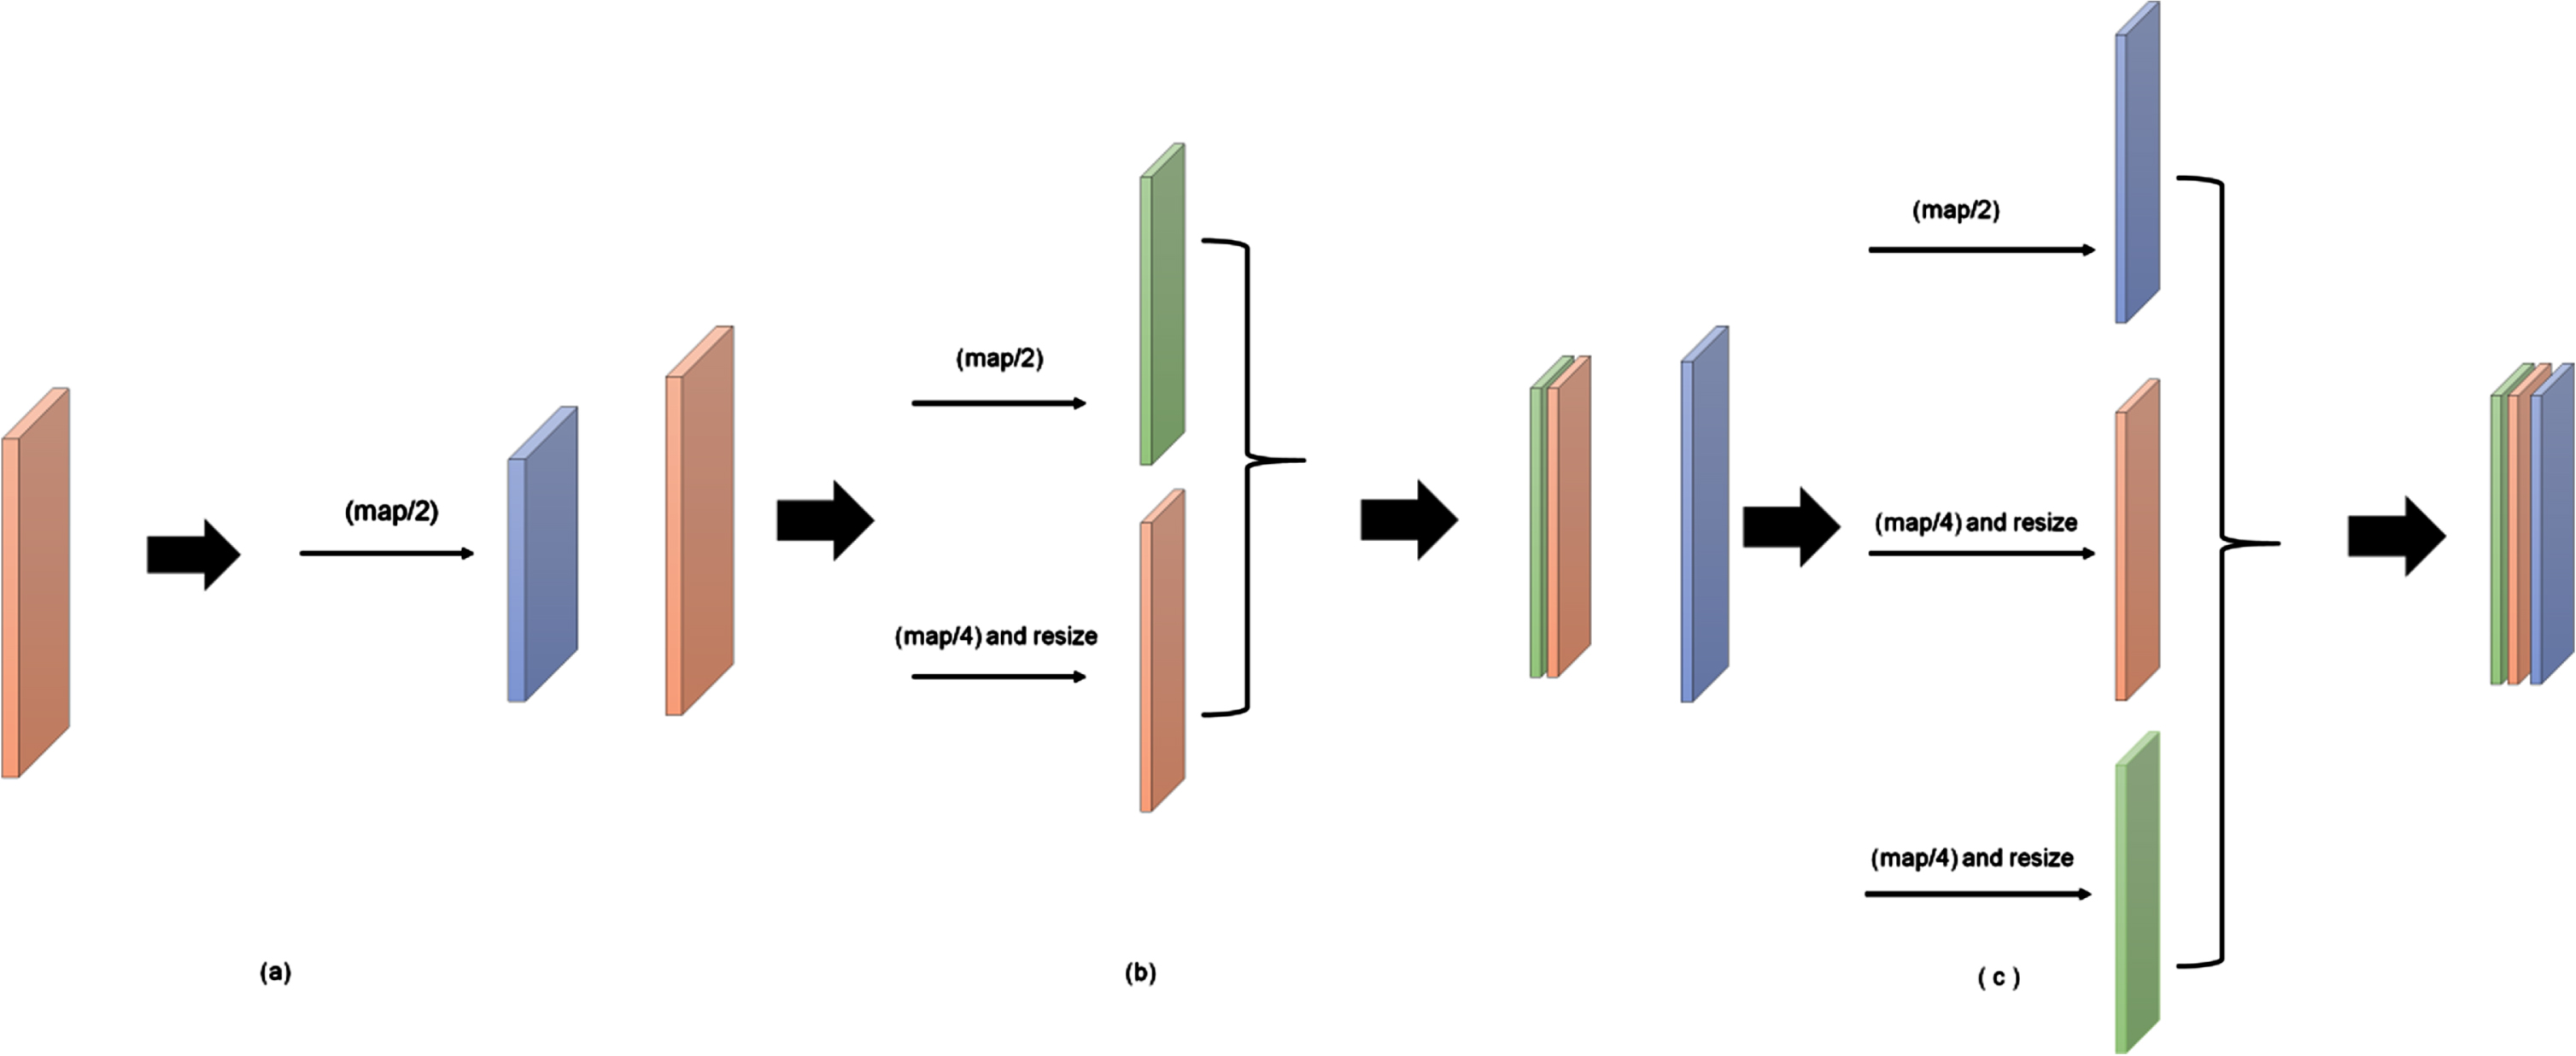
That is, after the initial network’s fourth convolutional layer, or (L_P1), we inserted a pooling unit. After the third and fourth convolutional layers, we progressively added one block to the second network (L_P2). We arranged a single element after the middle, treble, and quaternary convolutional layer in the third layer of the network (L_P3). In the fourth network (L_P4), after the initial, middle, triple, and final convolutional layers, we incrementally added one block. For the segmentation task, to test the robustness of MLPP, we often employed two kinds of enhanced convolution layer units based on the conventional convolution layer unit depicted in Fig. 9a. We sequentially examined their segmentation performance. These two prismatic generating blocks’ construction is shown in analogous fashion in Fig. 9b and 9c (L1 and L2).
D. Feature Extraction using Fuzzy Gabor Filter
The spatial domain representation of the complex Gabor function is
(8)
A definition of the complex sine wave is:
(9)
In Cartesian coordinates, the conditions (w0, c0) denote spatial frequencies. The following polar coordinates may be used to represent these spatial frequencies:
(10)
(11)
(12)
(13)
The complex sine wave is denoted by the following equations using the preceding ones:
(14)
(15)
When A is the amplitude, the center of the function is represented by (y0, x0), and σ x and σ y stand for the Gaussian deviation by each of the data. The function s (x, y, f, ∅ , σ), where f is the geographical frequencies and determines the filtering direction, ∅ is the final representation of the Gabor filter.
(16)
The filter deviation may be expressed as a difference in the wavelet coefficients, f, or λ wavelength, measured in pixels.
(17)
To enhance the Gabor filter’s responsiveness, the orientation and wavelengths were fuzzified using fuzzy logic. To fuzz the Gabor filter parameters, a Bell-type objective function has been employed as the input basis functions for directions and frequencies:
(18)
4Result and discussion
4.1Precision
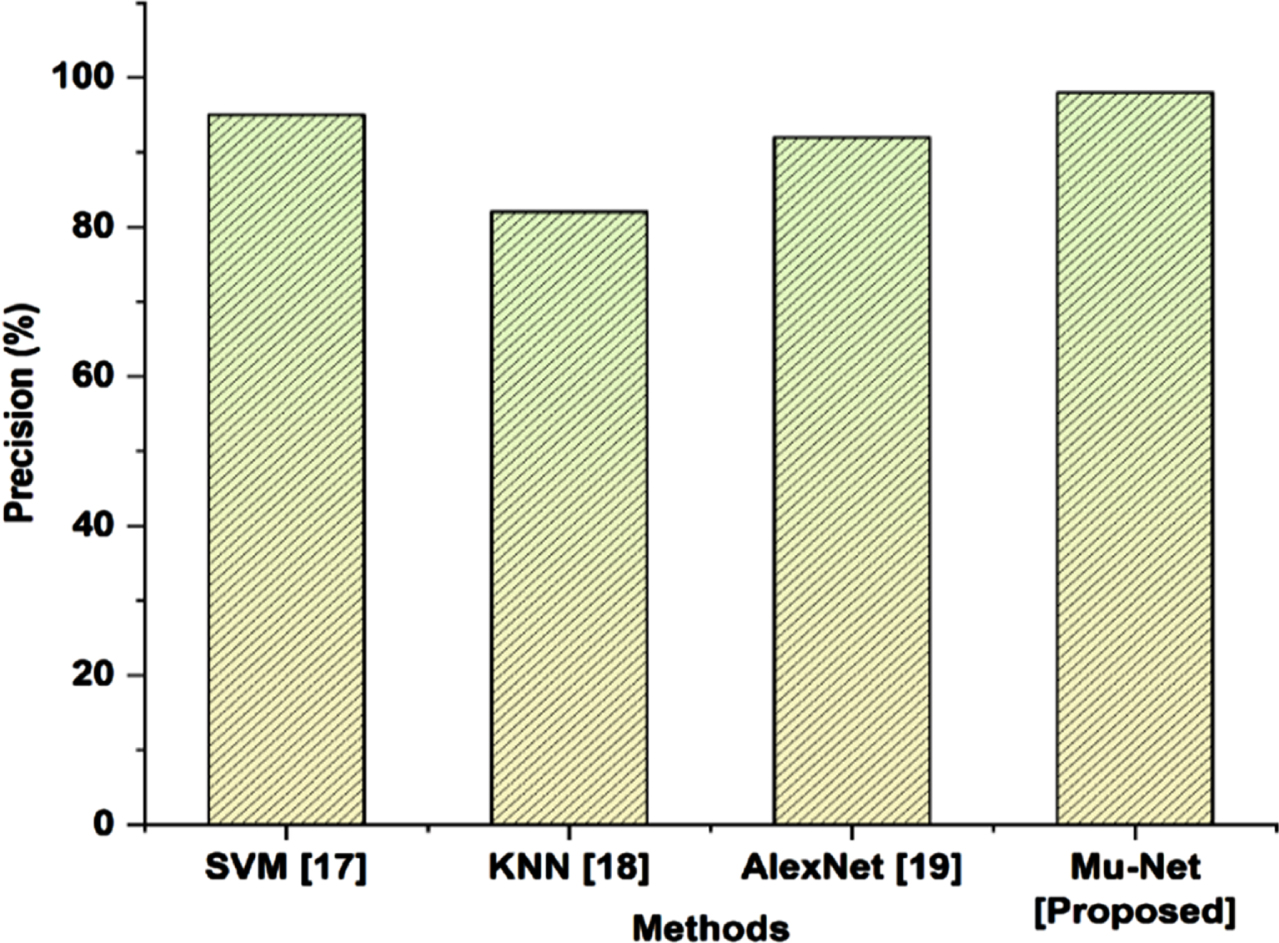
The percentage of relevant examples in relation to the overall count of retrieved instances is the definition of precision. Figure 10 depicts the comparison between precision of the suggested MU-Net technique and that of the standard approaches. Figure demonstrates the precision of the proposed method is higher when comparing to conventional methods.
Fig. 10
Comparison of precision.
4.2Recall
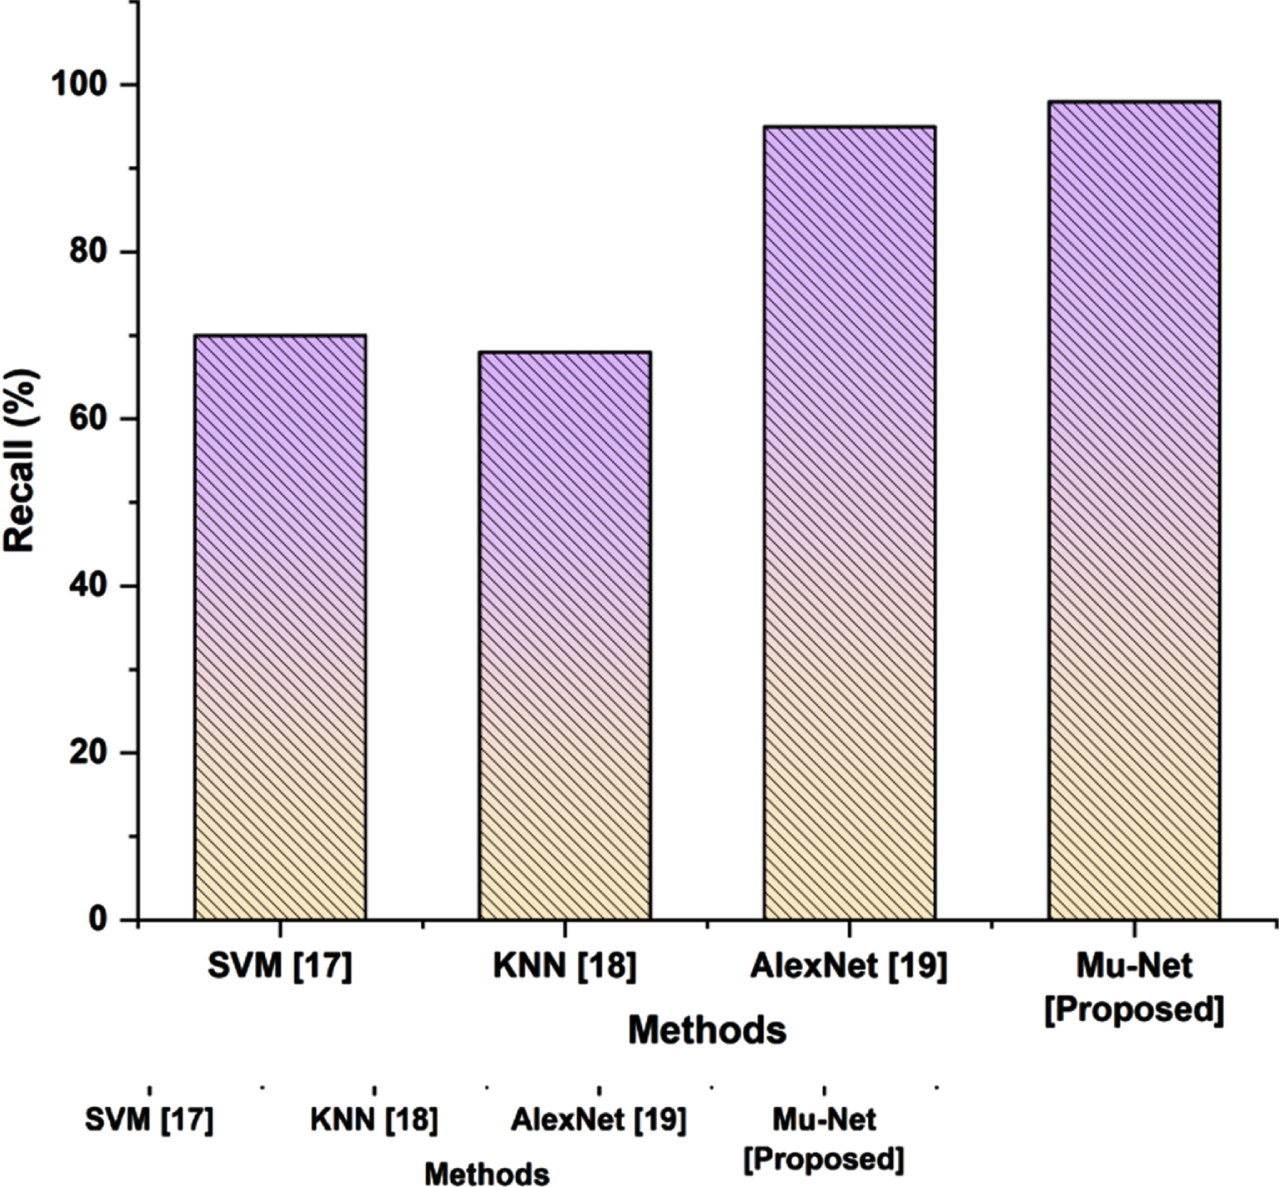
Recall is defined as the percentage of real positives to the total of false negatives and true positives. Figure 11 illustrates contrast between the recall of proposed MU-Net technique and that of the standard approaches. Figure shows that the recall of the suggested approach is higher when compare to conventional methods.
Fig. 11
Comparison of recall.
4.3F-Measure
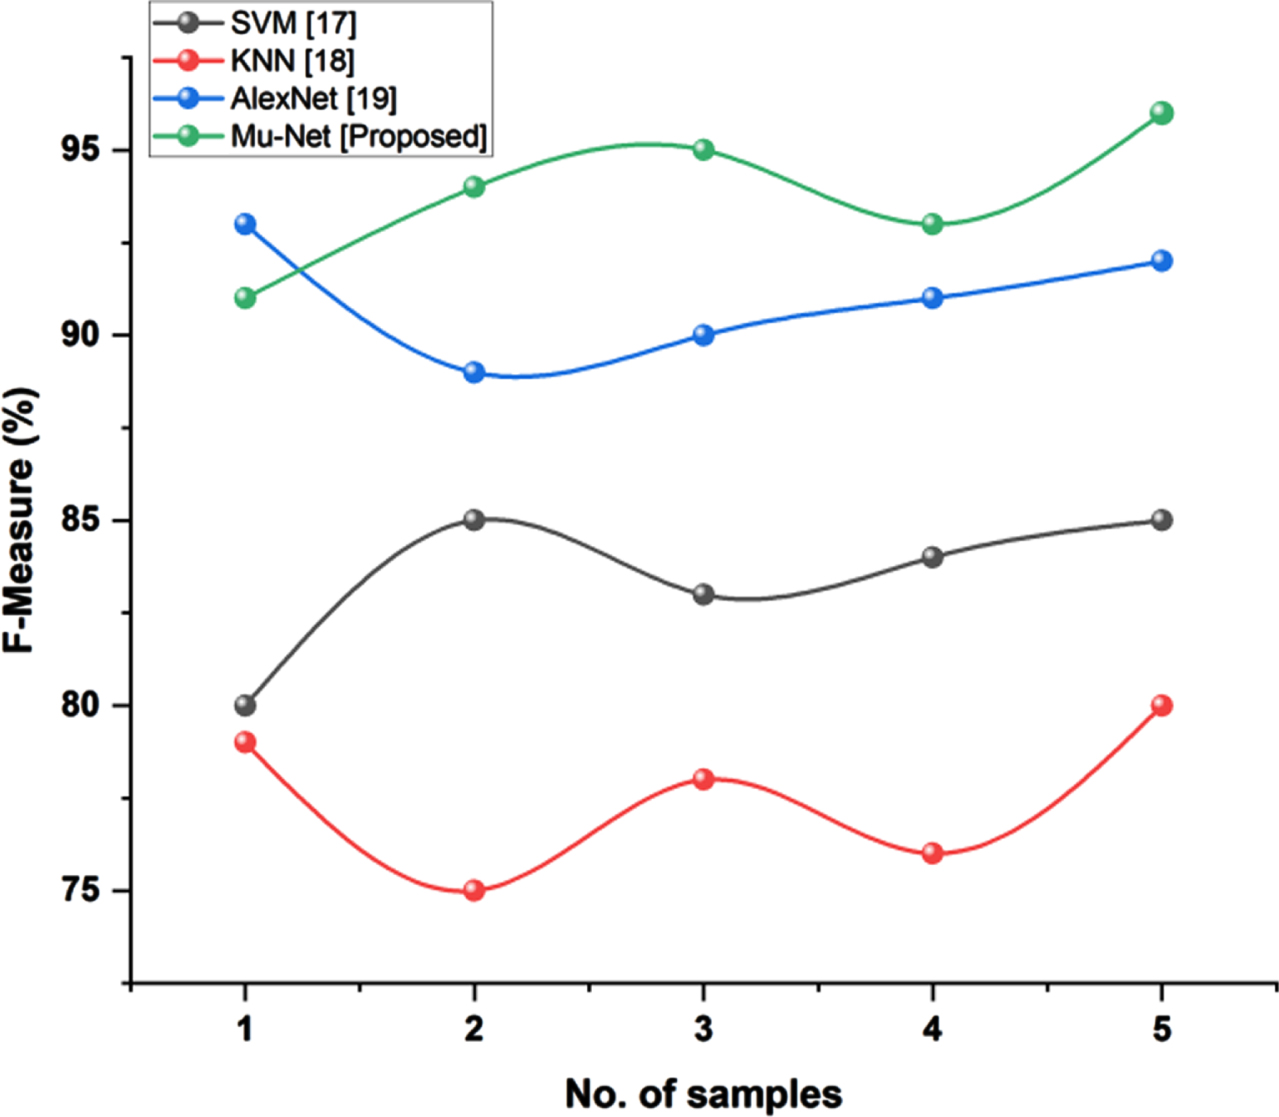
In the process of information evaluation, the F-measure is often used. It is possible to modify the F-measure such that accuracy is prioritized above recall, or vice versa. Both of these outcomes are feasible Fig. 12 depicts the comparison between the f-measure of the suggested BSS-RF technique and that of the standard approaches. Figure shows that the f-measure of the proposed method is higher when compare to conventional methods.
Fig. 12
Comparison of F-measure.
5Conclusion
Researchers often employ the augmentation of data approach to improve the quantity of training information, yielding enhanced data capable of teaching the network about the crucial characteristics of uniformity and stoutness. The majority of training system situations severely limits its capabilities and has a detrimental effect on output accuracy by using standard techniques of data augmentation. Following the course of therapy is necessary for brain tumors. For the patients to see how the medication is working, the tumors’ progression is crucial. Additionally, the progression of the tumors guides the physicians’ decisions on whether to begin, continue, or modify the administered treatment. Using MU-Net, the progress of brain tumors was divided into two categories in this thesis: beginning and progress. All MRI image slices were given to the network, and the Brain Tumor Progress dataset was taken into account. To get the best segmentation rates, MU-Net topologies that were taken into consideration for evaluating the lighter and deeper architectures were developed and compared. The proposed method has successfully achieved 95% accuracy in effective data augmentationand segmentation. The findings indicated that using a suitable MU-Net architecture might lead to tolerable rates and assist clinicians in monitoring the development of brain tumors following treatment. Future work will leverage multi-level learning by putting pre-trained networks in place and comparing the best outcomes found in this thesis. Additionally, MU-Net techniques will be used to take the degree of advancement into account. Future developments in AI techniques for medical imaging present opportunities for Better Identification of Brain Tumor using Data Augmentation Using MU-Net. To increase the precision and reliability of brain tumor segmentation and ultimately aid in more efficient treatment selection and diagnosis in clinical settings, more research may look into improved data augmentation methods, MU-Net architecture optimization, and deep learning integration with other imaging modalities.
Declaration
Ethics approval and consent to participate
No participation of humans takes place in this implementation process.
Human and animal rights
No violation of Human and Animal Rights is involved.
Funding
No funding is involved in this work.
Data availability statement
Data sharing not applicable to this article as no datasets were generated or analyzed during the current study.
Conflict of interest
Conflict of interest is not applicable in this work.
Authorship contributions
All authors are contributed equally to this work.
Acknowledgment
There is no acknowledgement involved in this work.
References
[1] | Safdar M.F. , Alkobaisi S.S. , Zahra F.T. , A comparative analysis of data augmentation approaches for magnetic resonance imaging (MRI) scan images of brain tumor, Actainformaticamedica 28: (1) ((2020) ), 29. |
[2] | Alsaif H. , Guesmi R. , Alshammari B.M. , Hamrouni T. , Guesmi T. , Alzamil A. , Belguesmi L. , A novel data augmentation-based brain tumor detection using convolutional neural network, Applied Sciences 12: (8) ((2022) ), 3773. |
[3] | Biswas A. , Bhattacharya P. , Maity S.P. , Banik R. , Data augmentation for improved brain tumor segmentation, IETE Journal of Research ((2021) ), 1–11. |
[4] | Rani V.V. , Vasavi G. , Kumar K.K. A detailed review on image augmentation and segmentation of brain MRI images using deep learning, 2021. |
[5] | Anaya-Isaza A. , Mera-Jiménez L. , Data augmentation andtransfer learning for brain tumor detection in magnetic resonanceimaging, IEEE Access 10: ((2022) ), 23217–23233. |
[6] | Rahul N.K. , Suresh S. , Sreekumar K. Detection of brain tumors—a comparative analysis of various transfer learning methods. In Ubiquitous Intelligent Systems (pp. 195–207). Springer, Singapore, 2022. |
[7] | Guan Y. , Aamir M. , Rahman Z. , Ali A. , Abro W.A. , Dayo Z.A. , Bhutta M.S. , Hu Z. , Guan Y. , Aamir M. , A framework for efficient brain tumor classification using MRI images, Math Biosci Eng 18: ((2021) ), 5790–5815. |
[8] | Sadad T. , Rehman A. , Munir A. , Saba T. , Tariq U. , Ayesha N. , Abbasi R. , Brain tumor detection and multi-classification using advanced deep learning techniques, Microscopy Research and Technique 84: (6) ((2021) ), 1296–1308. |
[9] | Chegraoui H. , Philippe C. , Dangouloff-Ros V. , Grigis A. , Calmon R. , Boddaert N. , Frouin F. , Grill J. , Frouin V. , Object detection improves tumor segmentation in MR images of rare brain tumors, Cancers 13: (23) ((2021) ), 6113. |
[10] | Hossain A. , Islam M.T. , Islam M.S. , Chowdhury M.E. , Almutairi A.F. , Razouqi Q.A. , Misran N. , A YOLOv3 deep neural network model to detect brain tumors in the portable electromagnetic imaging system, IEEE Access 9: ((2021) ), 82647–82660. |
[11] | Ullah N. , Khan J.A. , Khan M.S. , Khan W. , Hassan I. , Obayya M. , Negm N. , Salama A.S. , An effective approach to detect and identify brain tumors using transfer learning, Applied Sciences 12: (11) ((2022) ), 5645. |
[12] | Roopa Y.M. , Detection of Tumors From MRI Brain Images Using CNN With Extensive Augmentation, Turkish Journal of Computer and Mathematics Education (TURCOMAT) 12: (6) ((2021) ), 50–55. |
[13] | Dipu N.M. , Shohan S.A. , Salam K.M.A. Deep learning-based brain tumor detection and classification. In 2021 International Conference on Intelligent Technologies (CONIT) (pp. 1–6). IEEE 2021. |
[14] | Gull S. , Akbar S. , Artificial intelligence in brain tumor detection through MRI scans advancements and challenges, Artificial Intelligence and Internet of Things ((2021) ), 241–276. |
[15] | Maqsood S. , Damasevicius R. , Shah F.M. An efficient approach for the detection of brain tumors using fuzzy logic and U-NET CNN classification. In International Conference on Computational Science and Its Applications (pp. 105–118). Springer, Cham 2021. |
[16] | Aslam M. , Removal of the Noise & Blurriness using Global & Local Image Enhancement Equalization Techniques, International Journal of Computational and Innovative Sciences 1: (1), 2022. |
[17] | Deepa G. , Mary G.L.R. , Karthikeyan A. , Rajalakshmi P. , Hemavathi K. , Dharanisri M. , Detection of brain tumor using modified particle swarm optimization (MPSO) segmentation via Haralick features extraction and subsequent classification by KNN algorithm, Materials Today: Proceedings 56: ((2022) ), 1820–1826. |
[18] | David D.S. , Jayachandran A. , Robust classification of brain tumor in MRI images using salient structure descriptor and RBF kernel-SVM, TAGA Journal of Graphic Technology 14: (64) ((2018) ), 718–737. |
[19] | Çinar A. , Yildirim, M. , Detection of tumors on brain MRIimages using the hybrid convolutional neural network architecture, Medical Hypotheses 139: ((2020) ), 109684. |
[20] | Nalepa J. , Marcinkiewicz M. , Kawulok M. , Data augmentation for brain-tumor segmentation: a review, Frontiers in Computational Neuroscience 13: ((2019) ), 83. |
[21] | Abdollahi B. , Tomita N. , Hassanpour S. , Data augmentation in training deep learning models for medical image analysis, Deep Learners and Deep Learner Descriptors for Medical Applications ((2020) ), 167–180. |
[22] | Hossain T. , Shishir F.S. , Ashraf M. , Al Nasim M.A. , Shah, F.M. Brain tumor detection using convolutional neural network. In 2019 1st international conference on advances in science, engineering and robotics technology (ICASERT) (pp. 1–6). IEEE 2019. |
[23] | Shafiei F. , Ershad S.F. , Detection of lung cancer tumor in CT scan images using novel combination of super pixel and active contour algorithms, Traitement du Signal 37: (6) ((2020) ), 1029–1035. |


