
A compact CNN model for automated detection of COVID-19 using thorax x-ray images
Abstract
COVID-19 is an epidemic, causing an enormous death toll. The mutational changing of an RNA virus is causing diagnostic complexities. RT-PCR and Rapid Tests are used for the diagnosis, but unfortunately, these methods are ineffective in diagnosing all strains of COVID-19. There is an utmost need to develop a diagnostic procedure for timely identification. In the proposed work, we come up with a lightweight algorithm based on deep learning to develop a rapid detection system for COVID-19 with thorax chest x-ray (CXR) images. This research aims to develop a fine-tuned convolutional neural network (CNN) model using improved EfficientNetB5. Design is based on compound scaling and trained on the best possible feature extraction algorithm. The low convergence rate of the proposed work can be easily deployed into limited computational resources. It will be helpful for the rapid triaging of victims. 2-fold cross-validation further improves the performance. The algorithm proposed is trained, validated, and testing is performed in the form of internal and external validation on a self-collected and compiled a real-time dataset of CXR. The training dataset is relatively extensive compared to the existing ones. The performance of the proposed technique is measured, validated, and compared with other state-of-the-art pre-trained models. The proposed methodology gives remarkable accuracy (99.5%) and recall (99.5%) for biclassification. The external validation using two different test dataset also give exceptional predictions. The visual depiction of predictions is represented by Grad-CAM maps, presenting the extracted features of the predicted results.
1Introduction
COVID-19 is a zoonotic originated disease named SARS-Cov-2, which was initially diagnosed as a pneumonia virus in the city of China named Wuhan in 2019. Up till January 2022, 349,641,119 confirmed cases had been reported worldwide, out of which around 300 plus million people are recovered from this life-threatening virus, and approximately 5.5 million deaths have been reported. A statistical analysis of COVID-19 in different countries is shown in Table 1.
Table 1
Statistical Analysis of COVID-19[1]
| Country | Total Cases | Deaths/ Million | Transmission Classification |
| USA | 31,350,025 | 561,921 | Colony Spread |
| Brazil | 13,943,071 | 373,335 | Colony Spread |
| France | 5,214,493 | 100,536 | Colony Spread |
| UK | 4,390,787 | 127,274 | Colony Spread |
| Turkey | 4,323,596 | 36,267 | Colony Spread |
| Spain | 3,428,354 | 77,102 | Colony Spread |
| Germany | 3,163,308 | 80,303 | Colony Spread |
| Poland | 2,704,571 | 62,734 | Colony Spread |
| Argentina | 2,694,014 | 59,228 | Colony Spread |
| Colombia | 2,652,947 | 68,328 | Colony Spread |
| Mexico | 2,305,602 | 212,339 | Colony Spread |
| Iran | 2,261,435 | 67,130 | Colony Spread |
| Ukraine | 1,961,956 | 40,367 | Colony Spread |
| Peru | 1,704,757 | 57,230 | Colony Spread |
| Indonesia | 1,609,300 | 43,567 | Colony Spread |
| Czechia | 1,606,030 | 28,640 | Colony Spread |
| South Africa | 1,567,513 | 53,757 | Colony Spread |
| Netherlands | 1,410,950 | 16,938 | Colony Spread |
| Chile | 1,131,340 | 25,277 | Colony Spread |
| Canada | 1,121,498 | 23,623 | Colony Spread |
| Romania | 1,031,072 | 26,381 | Colony Spread |
| Iraq | 984,950 | 15,026 | Colony Spread |
| Belgium | 951,626 | 23,782 | Colony Spread |
| Philippines | 945,745 | 16,048 | Colony Spread |
| Sweden | 900,138 | 13,788 | Colony Spread |
| Pakistan | 761,437 | 16,316 | Colony Spread |
| India | 15,321,089 | 180,530 | Bunch of cases |
| Italy | 3,878,994 | 117,243 | Bunch of cases |
| Portugal | 831,221 | 16,946 | Bunch of cases |
| Russia | 4,718,854 | 106,307 | Bunch of cases |
The circumstances in this pandemic badly affect many individuals’ social and financial states. Several countries around the globe are also facing solid economic crises.
The early symptoms are fever, cough, body aches, and some respiratory complications [2]. The virus belongs to the betacoronavirus genus, an enveloped RNA virus. The mutation rate of RNA viruses is conspicuously high, and it is believed that it is a million times higher than its host [3]. RNA mutations lack the proofreading capability, so developing a vaccine, antiviral drugs, and diagnosis becomes incredibly challenging. The variations in the virus create a challenging situation for medical specialists and affectees [4]. When the COVID-19 virus enters the body, it starts infecting the epithelial layer of the lungs. A person who has symptoms of COVID-19 must be given proper medication and isolation as soon as possible, so a strong need for early diagnosis technique is required, which will give relief to medical professionals working under this pandemic stress [2]. Although the screening methods improve daily, they are still liable to medical professionals and helpers. Real-time fluorescent RT-PCR is a commonly used procedure for identifying COVID-19, but unfortunately, its false positive and false negative detection ratio is high [5]. The RT-PCR is a three-step process: RNA Extraction, RNA transcription, and lastly, amplification of PCR of DNA. The patient’s sample has been taken from any source, including nasopharyngeal swabs or aspirates, oropharyngeal swabs, bronchoalveolar lavage fluid (BALF), sputum, saliva, serum, urine, rectal or faecal samples, [6]. After that, the swab must be extracted for RNA retrieval. Inappropriate sample collection is the main reason for the false-positive and false-negative results. As the VTM sample should be kept between 25 to 27 degrees Celsius, the collection of the sample and its climatic conditions are sometimes inappropriate, leading to false results. Secondly, RT-PCR is a time taking process. Its sensitivity also depends on the swab type used for taking samples [7]. The countries with a higher rate of COVID-19 victims are trying to arrange rapid detection kits or focusing on developing antigen kits for COVID-19, called Rapid Test kits. Although the Rapid Tests are not as reliable as the RT-PCR test, they are helpful at a point of care level. Rapid tests for COVID-19 work similarly to the pregnancy strip test. This Rapid Test is not time-consuming as it only takes 10 to 30 min and identifies symptomatic individuals. This test can detect the presence of a virus if the exposure was in the past or is present now. The serological tests follow the same principle as immuno-assays. However, the difference is that it does not detect any viral antigen but the existence of antibodies against the virus in the sample liquid. A significant drawback in both serological and antigen tests is that there is a change of cross-reaction of antibodies, and the test will be declared false positive even with some other mutation. Other techniques for detecting COVID-19 include Immunoglobin M (IgM), Immunoglobin G (IgG), and Immunochromatographic fluorescence assay.
As the etiology and clinical manifestation of the infection are similar to other viral epidemics, such as middle east respiratory syndrome and severe acute respiratory syndrome, understanding these respiratory diseases can assist in the diagnosis of COVID-19 . However, radiographical imaging like Chest Computed Tomography (CT) Scan and Chest x-ray are essential in early diagnosis and management of treatment. This is a well-explored field of research [13–16]. Some advantages of using x-rays are triaging, accessibility, potable equipment and, most importantly, cost efficiency compared to CT scans and RT-PCR. Radiographs have the edge over expensive PCR testing for COVID-19 diagnosis; however, it needs a radiologist who can examine the radiograph and generate authenticated diagnostic results. CXR is mainly used to analyze patients with traditional pulmonary diseases, but this technique is not successful in the case of COVID-19 due to poor image characteristics. The x-ray image seems normal to the naked eye in the early/mild stage of disease [17]. There is a strong need to develop a computer-aided diagnosis system that can help radiologists promptly diagnose COVID-19. Recently, deep learning algorithms have been very accommodating in diagnosis and changed the stance, especially in biomedical imaging. These algorithms perform machine learning tasks using artificial neural networks, which extract information using high-level processing. Their applications are widespread in segmentation, regeneration, and classification. They account for a significant step in the biomedical CAD assisting system. Convolutional neural networks CNN are the most popular among these because they have excellent performance in most image-processing applications. CNN’s are developed to overcome the problem of limited resources, as they perform the task with parameter sharing and employ distinct convolution and pooling functions. Any device can efficiently complete the procedure. By increasing layers, accuracy can be improved, but the cost would also increase. Conventional CNNs mostly scale width, depth, and resolution as per the availability of resources. CNNs are used in different disease identifications with high-performance results compared with other techniques like SVM and RF. However, scaling up the CNN to broader, more profound, or at higher resolution will bring better accuracy and the cost of bringing in more parameters, which results in a high cost for training and testing. Researchers are busy developing condensed CNN and maintaining a good balance of accuracy and computational cost. Still, the performance of such a technique needs improvement. In CNN, the most helpful task was reducing the number of parameters compared to classical ANN. It has three layers: input layer, hidden layers, and output layer; the hidden layers have a subdivision of a convolutional layer, ReLU layer, pooling layer, and fully connected layer. The pooling operation is performed after convolution because it plays a significant role in parameter reduction. It reduces the height and width of layers individually. So a considerable amount of weight parameters are required to generate a complete connection. To build a model in less time, we take the help of transfer learning, an approach in which we can grasp the knowledge and skills like the number of features and weights from former trained models. In transfer learning, the knowledge gained by a network in solving one problem can be consumed by another problem, which will help overcome the problem of fewer data for training the model, ultimately performing the desired task using fewer resources.
In this article, we proposed a transfer learning technique using the base model of EfficientNet, a deep learning architecture for identifying COVID-19-positive and normal cases. The X-ray images consisting of COVID-19 disclosure are used to develop the CXR model, which uses deep learning to identify COVID-19. In images, there are areas of ground glass patterning that indicate a COVID-19 infection. It affects the lower lobes of both lungs, particularly the posterior segments, with a mainly peripheral and subpleural distribution. The X-ray can identify the infection if it shows a progression of lesions, septal thickening, or a Crazy Paving Pattern of opacities [15]. The performance was compared with other illustrious techniques like VGG16 and VGG19. The main contributions are highlighted as follows:
- Albumentation transforms, and intensity normalization is used in preprocessing for transforming CXR images.
- The combination of EfficientNets and dense layers is used to accomplish the target of a lightweight deep learning model. The ReduceLRonPlateau function controls the learning rate of the model if the matrix value lacks improvement.
- Collection of annotated CXR images from all available open-access resources and self-collected images. CXR images are compiled as dataset named COVID-19 Thorax x-ray freely available at Kaggle [18]. COVID-19 Thorax x-ray is an open-access repository containing 13500 CXR with front and side views. It is freely available for researchers who want to create innovations in this field.
2Literature Survey
Researchers are putting their best efforts into helping front-line health workers by developing detection, classification, and segmentation algorithms using both x-ray and CT Scan Images of COVID-19 victims.
A few investigations in published research claimed the pattern variations in chest x-ray beam pictures prior to the presence of dominant highlights of COVID-19 [19–22]. Huge revelations have been made in examinations by exploring x-ray results. As Kong et al. [20] guaranteed light opacities in the infrahilar space found in patients with COVID-19. Zu et al. [19] Chung et al. demonstrate that 33% of CT filters of the thorax have detailed round lung opacities. Zhao et al. [21] found blended ground-glass opacities (GGO) in many affectees with vascular enlargement and solidification. Also, Yoon et al. [22] introduced that 3% patients under examination had solitary nodular obscurity in the left side of the lung area, and the others had four to five unpredictable opacities in both lungs.
The authors of some recent research examined CXR images to identify COVID-19 at an early stage of infection. Authors in [23] gave a detailed review of deep learning techniques used to identify COVID-19. They have given comparisons based on data augmentation and deep learning networks. The five comparisons made on the processing with augmentation concluded that algorithms with augmentation before training provide better results than those without augmentation. They have also compared deep learning techniques used to identify COVID-19 from CXR. They compared fifteen publications and analyzed their accuracy and the network used in identification. They concluded that deep neural networks give higher efficiency but at the cost of complexity and time. Researchers in [24] have proposed a compact classifier for COVID-19 detection using a convolutional support estimator network (CSEN) and achieved a sensitivity of 97% and specificity of 95.5%. They have generated a comparison with a pre-trained deep neural network DenseNet-121 and attained a sensitivity of 95% and specificity of 99.74%. They have also generated a dataset of 1065 annotated images named Early-QaTa-COVID-19, available on Kaggle. The limitation of their work is not attaining an up-to-mark value of sensitivity. In [25] the authors have developed a tool using the machine learning algorithm SVM to attain instant results for the victim, and they achieved an accuracy of 98.93%. GE Antonio in [26] the study presents an approach based on fuzzy logic using deep learning to identify whether the image is a Covid-19 pneumonia image or an interstitial pneumonia image from a CXR. They developed an algorithm named CovNNet, which fuses fuzzy images with extracted features and concluded results. They used a small dataset comprising 121 images of both classes and achieved an accuracy of 81%. TanvirMahmud in [27] also experimented on CXR images and developed a multiclassifier, i.e., Normal, COVID-19, viral pneumonia, and bacterial pneumonia, using CovXNet. They used 5856 CXR images; 1583 were normal, 1493 were non-COVID viral pneumonia, 2780 were bacterial pneumonia, and 305 were COVID-positive. Their results give an accuracy of 97.4%. The results of another multiclassification were published in [28] in which 21057 CXR images were used to classify COVID, Pneumonia viral and bacterial, and normal. They proposed a multi-branch fusion auxiliary learning method and achieved an overall accuracy of 95.61%. The proposed method also classifies the specific types of Pneunomia
Authors in [29] have presented an integrated stacked deep convolution network InstaCovNet-19. They compiled the proposed model by combining many pre-trained models using ResNet101, Xception, InceptionV3, MobileNet, and NASNet. They tried to develop compensation for a small amount of training data. The proposed model achieved an accuracy of 99.08% for three classes, namely COVID-19, Pneumonia, and Normal. An accuracy of 99.53% is achieved on bi-classification, including COVID-19 and Non-COVID classification. They used two repositories for the dataset, both freely available on Kaggle, containing 219 and 142 COVID-19 x-ray images. The authors are using minimal data from COVID-positive patients for classification.
In another research, [30], the uncertainty of the model has been estimated using a bayesian deep Learning classifier, trained using the transfer learning method on COVID-19 x-ray images. The results of this research show a vital connection between the uncertainty of the model and its accuracy of prediction, which would be helpful for radiologists in estimating uncertainty. In deep learning, estimated uncertainty yields more reliable predictions, which will alert radiologists to false predictions, so the chances of deep learning acceptance in disease detection increase. This research work was carried out using COVID-chest x-ray-dataset, a publically available dataset,1. However, again among them, original COVID-19 CXRs are limited in number, which is a significant concern. Narin et al. [32] proposed 5 pre-trained CNN models namely ResNet50, ResNet101, ResNet152, InceptionV3 and Inception-ResNetV2. They performed experiments on samples of x-ray images from confirmed COVID-19 patients. The pre-trained model ResNet50 provides the highest results and accuracy of 0.952. COVID-chest x-ray-dataset is used in this work2 [31]. The main limitation of their work is that their dataset contains only 68 positive x-ray scans of COVID-19 victims, which is insufficient for training a neural network.
Zhang et al. [33] used a 14-layered residual CNN and used 100 images of COVID-19 confirmed cases available at GitHub repository.3 They achieved the sensitivity of 96.00% and specificity of 70.65%. The major limitation is the sensitivity; it should be on the higher side, especially in contagious diseases like COVID-19. Nayak et al. [34] also used Transfer learning and evaluated the results on 8 pre-trained models which are AlexNet, VGG-16, GoogleNet, MobileNet-V2, SqueezeNet, ResNet-34, ResNet-50, and Inception-V3 have been used for classification of COVID-19 from normal cases. Their results showed that the ResNet-34 model has the highest performance and achieves a precision value of 96.77%, specificity of 96.67%, F1-score of 0.9836, accuracy of 98.33%, and 0.9836 is the area under the curve (AUC). The second best is AlexNet for the prediction of COVID-19 and gives a precision value of 96.72%, a sensitivity of 98.33%, a specificity of 96.67%, an F1-score of 0.9752, an accuracy of 97.50%, and 0.9642 as AUC. They have used 203 frontal view Chest X-rays obtained from different available sources. Their dataset is limited; secondly, the recall value is not appreciable. Aminu et al. [35] used CovNet Neural Network for classification of COVID-19. they used seven four-layer blocks in CovNet architectural Layering. They performed multiclass identification of x-ray images from COVID-19, Pneumonia, and Normal. They also extracted features using CovNet from CT images. Their proposed network can achieve an accuracy of 96.84% for multiclass and 100% for binary-class. Their dataset includes 321 chest x-ray images with COVID-19, 500 with Pneumonia, and 445 normal, obtained from freely available resources. They are achieving outstanding accuracy in classification, but this study’s problem of limited datasets persists. A.Shamila Ebenezer [36] used image enhancement techniques on CT scans to improve the classification process. They used CLAHE in image processing steps. The final classification is done using EfficientNet algorithm. They achieve the accuracy of 94.56%, precision of 95%, recall of 95% and F1 of 93%. Horry et al. [37] presented the diagnosis procedure using pre-trained model in x-ray radiographs, using four popular transfer learned models VGG, Inception, Xception, and ResNet. VGG19 shows the highest performance. Results are attained in the form of precision 83%, sensitivity 80%, and F1-score 80%. They used a dataset of 100 COVID-19 CXRs, 100 pneumonia, and 200 normal. Again, this research’s limitations are lower sensitivity and limited annotated data on COVID-19.
3Materials and Methods
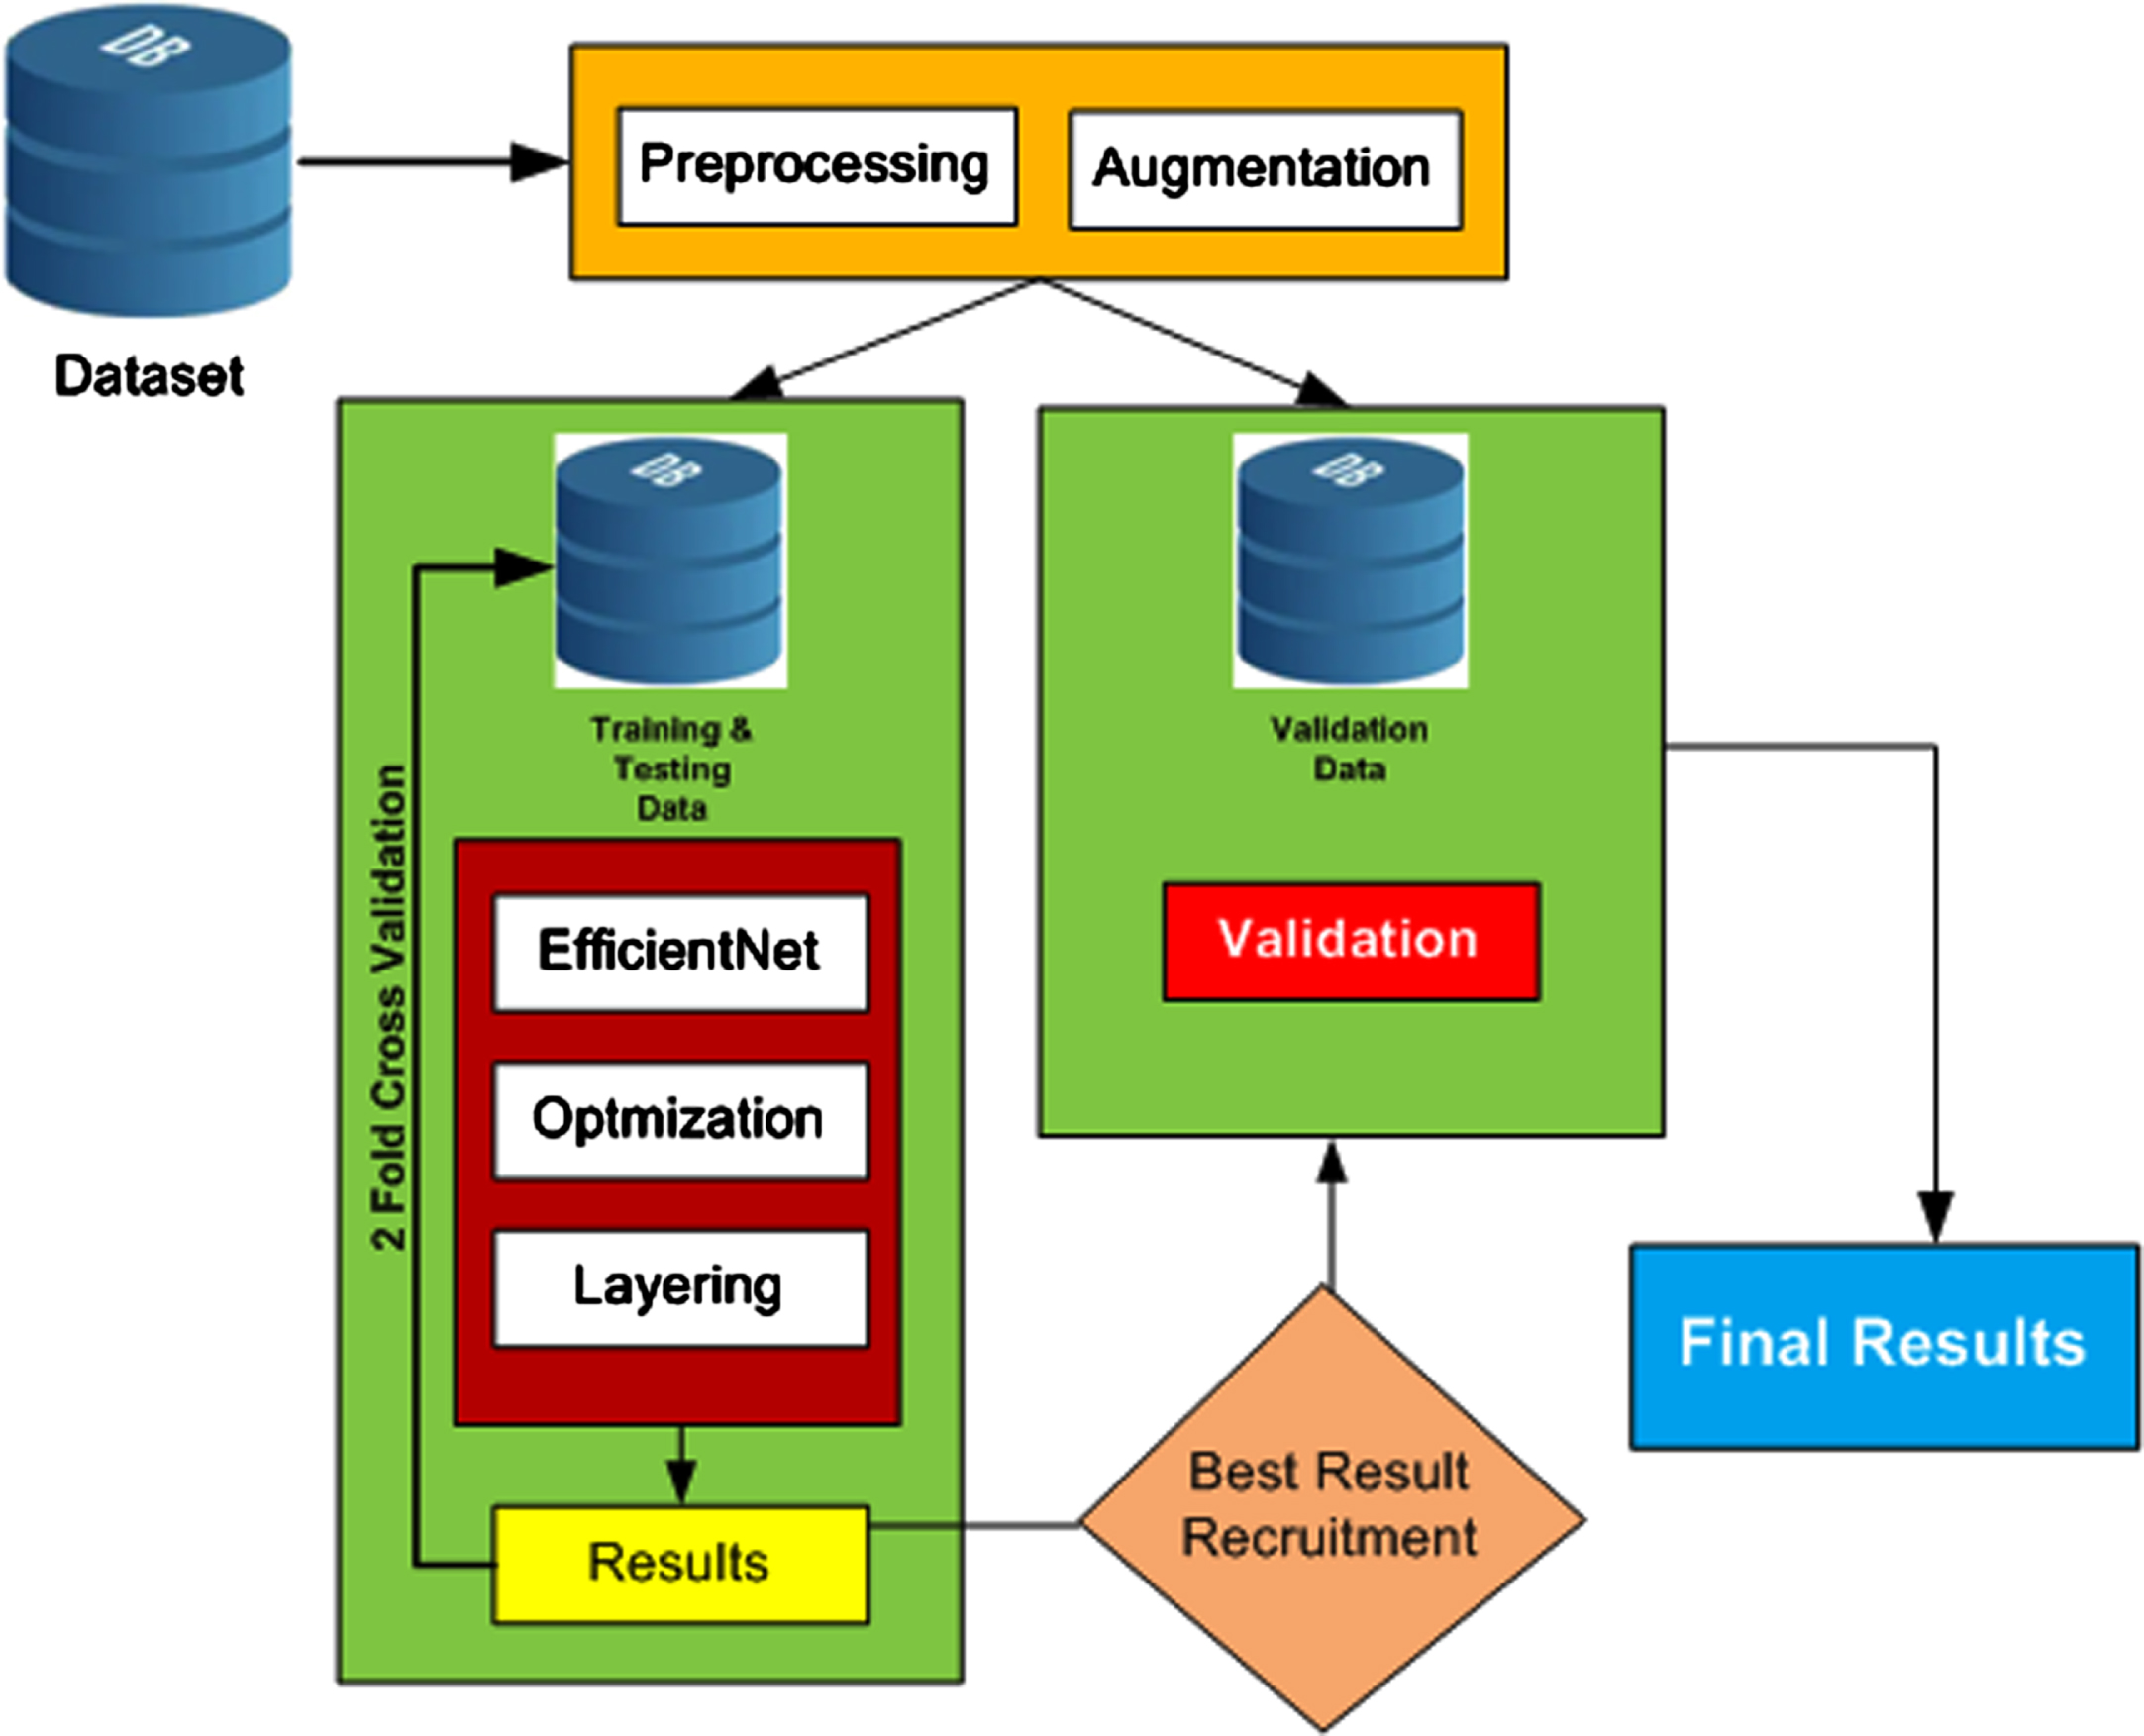
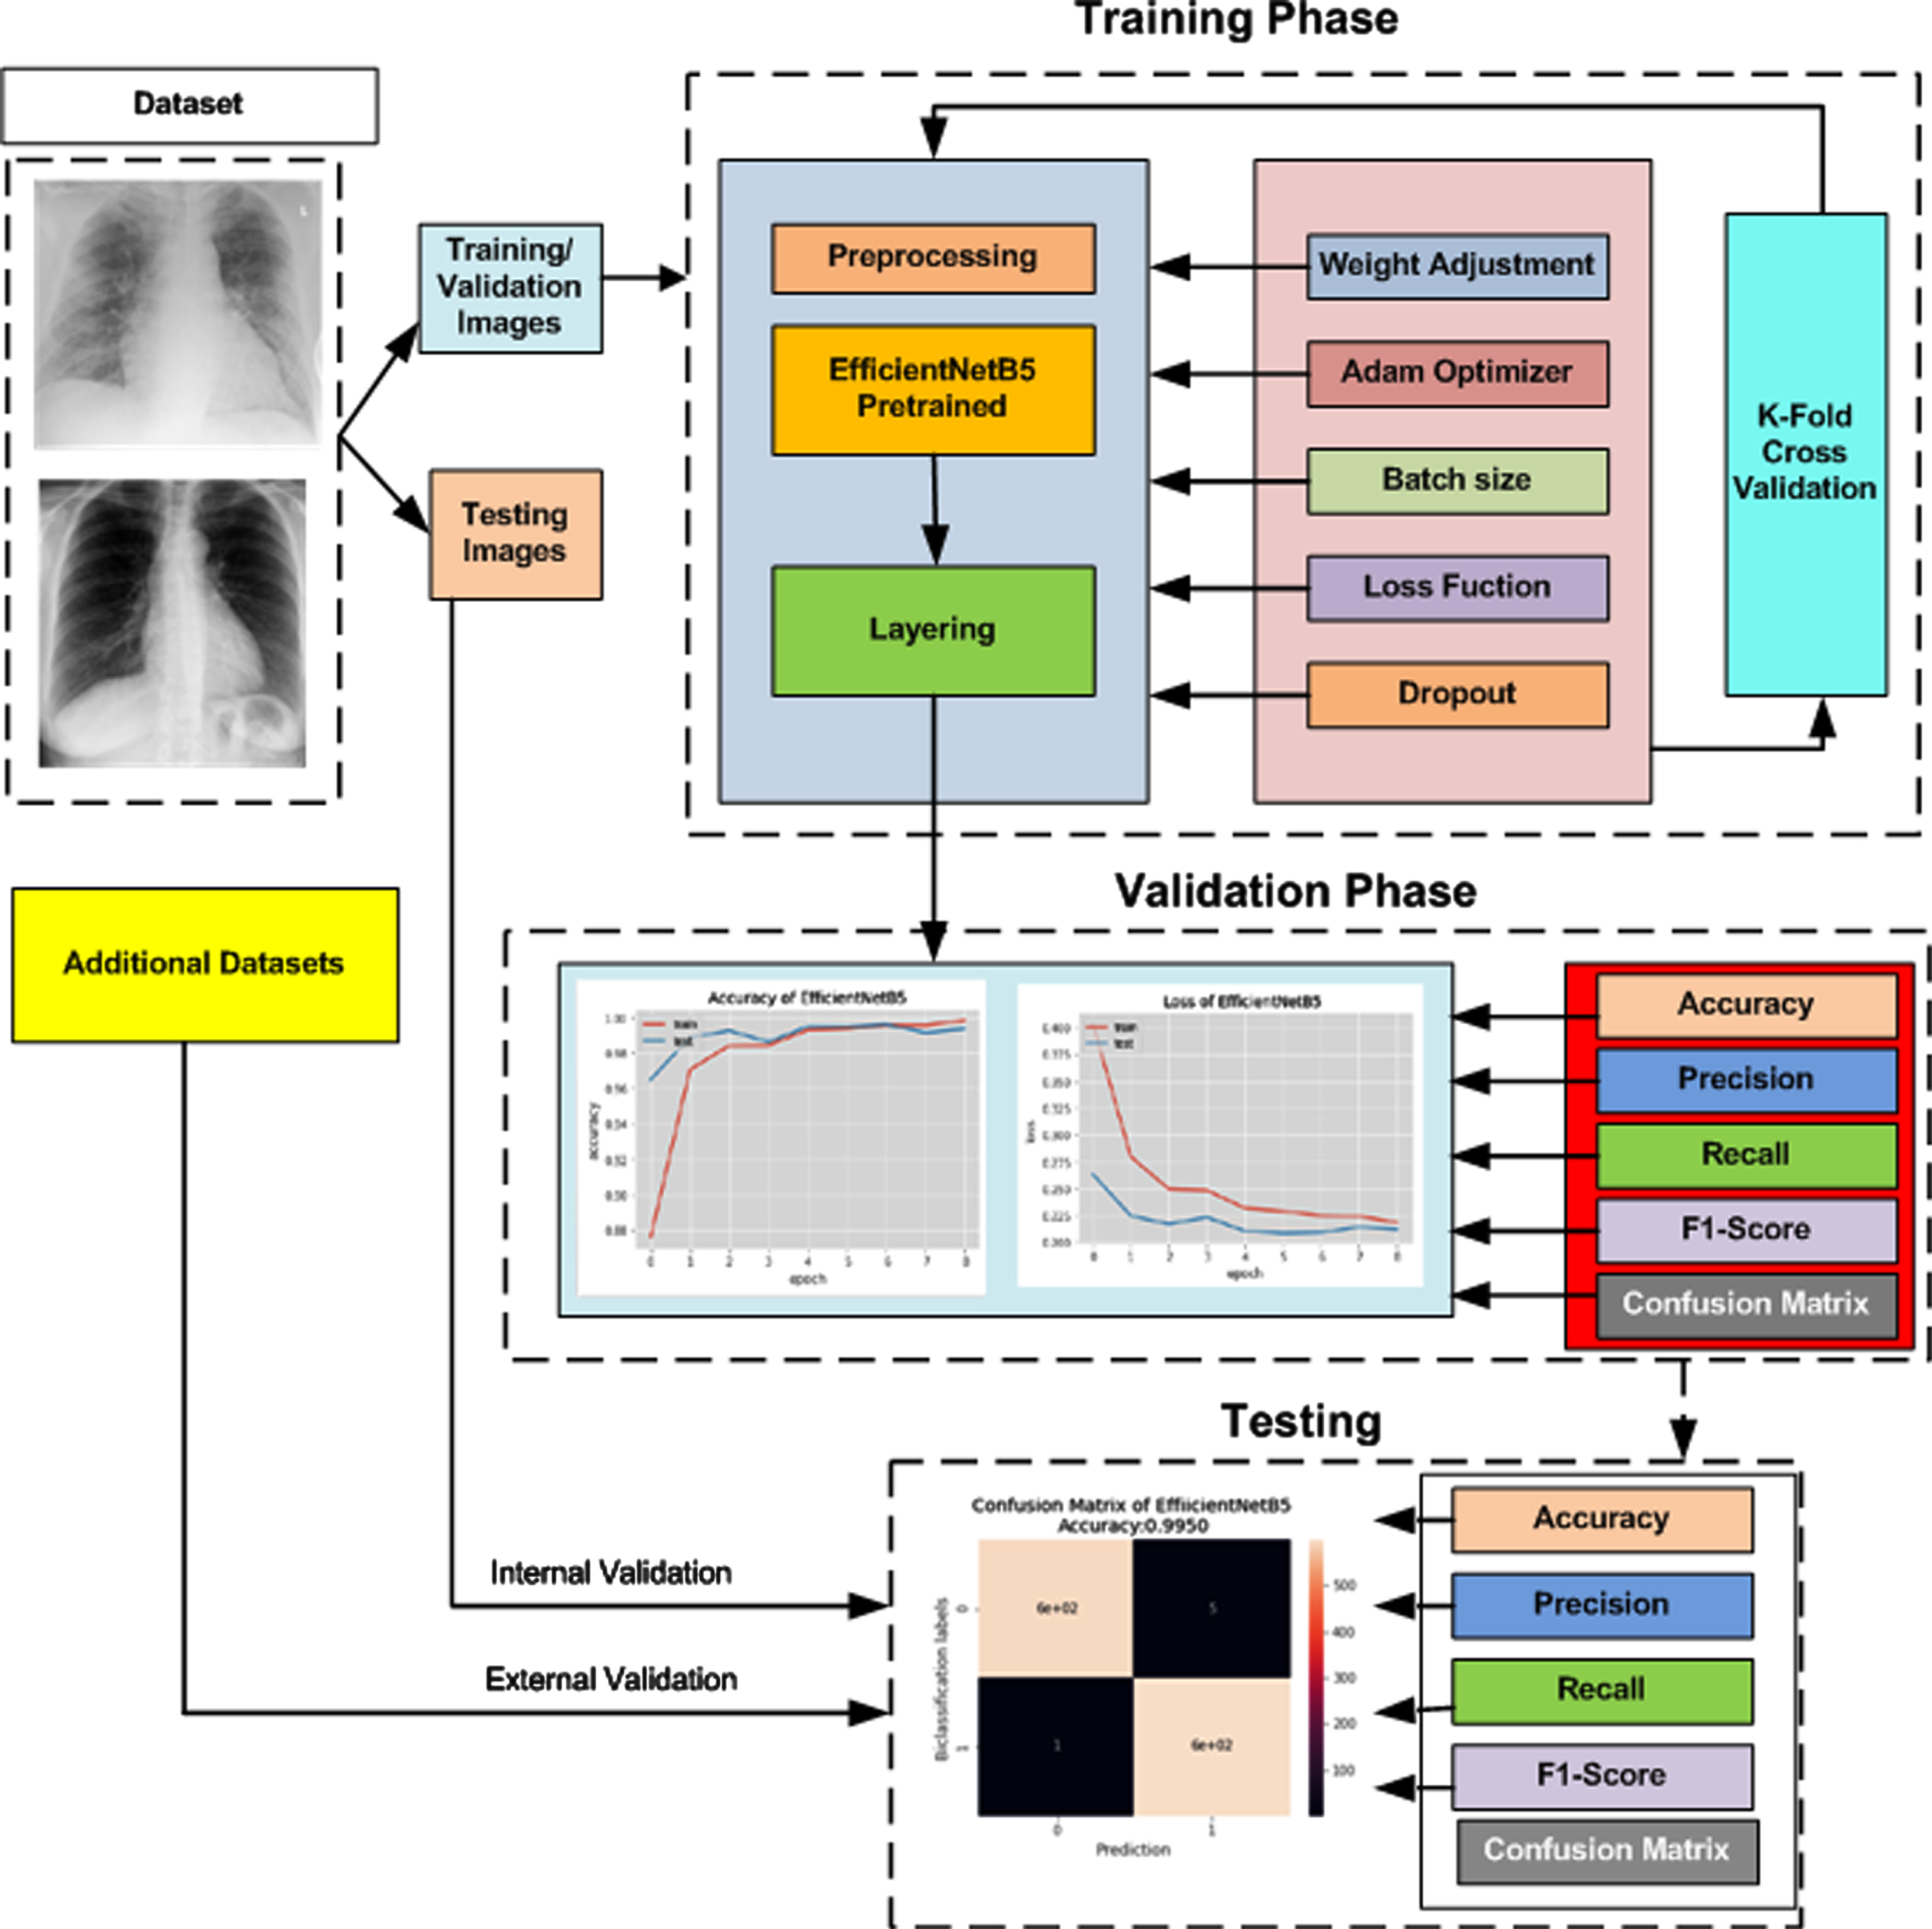
The pre-trained architectures of the neural network EfficientNet are used in this proposed model for COVID-19 detection. The layout of the overall methodology is presented as a block diagram in Figure 1. The steps are further explained in this section.
Fig. 1
Flow Process of Proposed Methodology.
3.1Datasets
COVID-19 is a new virus playing the game of mutational variant strain creation. As most countries are facing pandemic situations, there is a critical need for annotated x-ray images in this area. By keeping this fact in mind, the authors gathered the most comprehensive annotated dataset of CXR images of COVID-19-positive patients. Dataset_1 is collected from all the open access data sources; among them, [38], and [31] are significant sources, Dataset_1 comprises 13500 images; among them, 6950 belong to the class COVID-19, and 6550 belong to the Normal class. External validation Data 1 (EVD_1) is the folder of self-collected images, and it is used for external validation of the trained network. These CXR images, after the necessary consent, are collected from Nishtar Hospital Multan and Al-Khidmat diagnostics Multan and annotated by experienced radiologists. In total, collected CXR images are 150; among them, 42 are used in the proposed network for external validation testing. EVD_2 has been downloaded from [39]. It has 59 CXR images in total; among them, 34 are COVID-19-positive, and 25 are normal CXR images. It is also used for external validation of the proposed network. The composition details of datasets are given in Table 2.
Table 2
Composition of datasets used for experiments
| Total images | Image format | Source | Reference | |
| Dataset_1 | 13500 | png, jpg, jpeg | NIH | [31, 38] |
| EVD_1 | 42 | png, jpg, jpeg | Nishtar Medical Hospital | self-collected |
| Alkhidmat Diagnostics | ||||
| EVD_2 | 59 | png, jpg, jpeg | Figshare | [39] |
Figure 2 represents the sample of COVID-19 positive CXR images used in this work, containing front and side view thorax CXR images. Row 1 and 2 in Figure 2 represent front view CXR images, and Row 3 represents side view representation. We have shared the complete dataset on the Kaggle website as a COVID-19 thorax x-ray for use in research work. In the proposed algorithm, Dataset_1 is used for training before applying preprocessing. Data is divided into two parts, 80% for training and 20 % for internal validation. The detail of the dataset is given in Table 3. The internal validation is carried out along with external validation. The proposed algorithm has been externally validated on two different datasets: EVD_1 and EVD_2. These datasets are obtained from external sources and have not been included during training. Details are given in Table 4.
Fig. 2
Thorax x-ray of COVID-19 Positive.
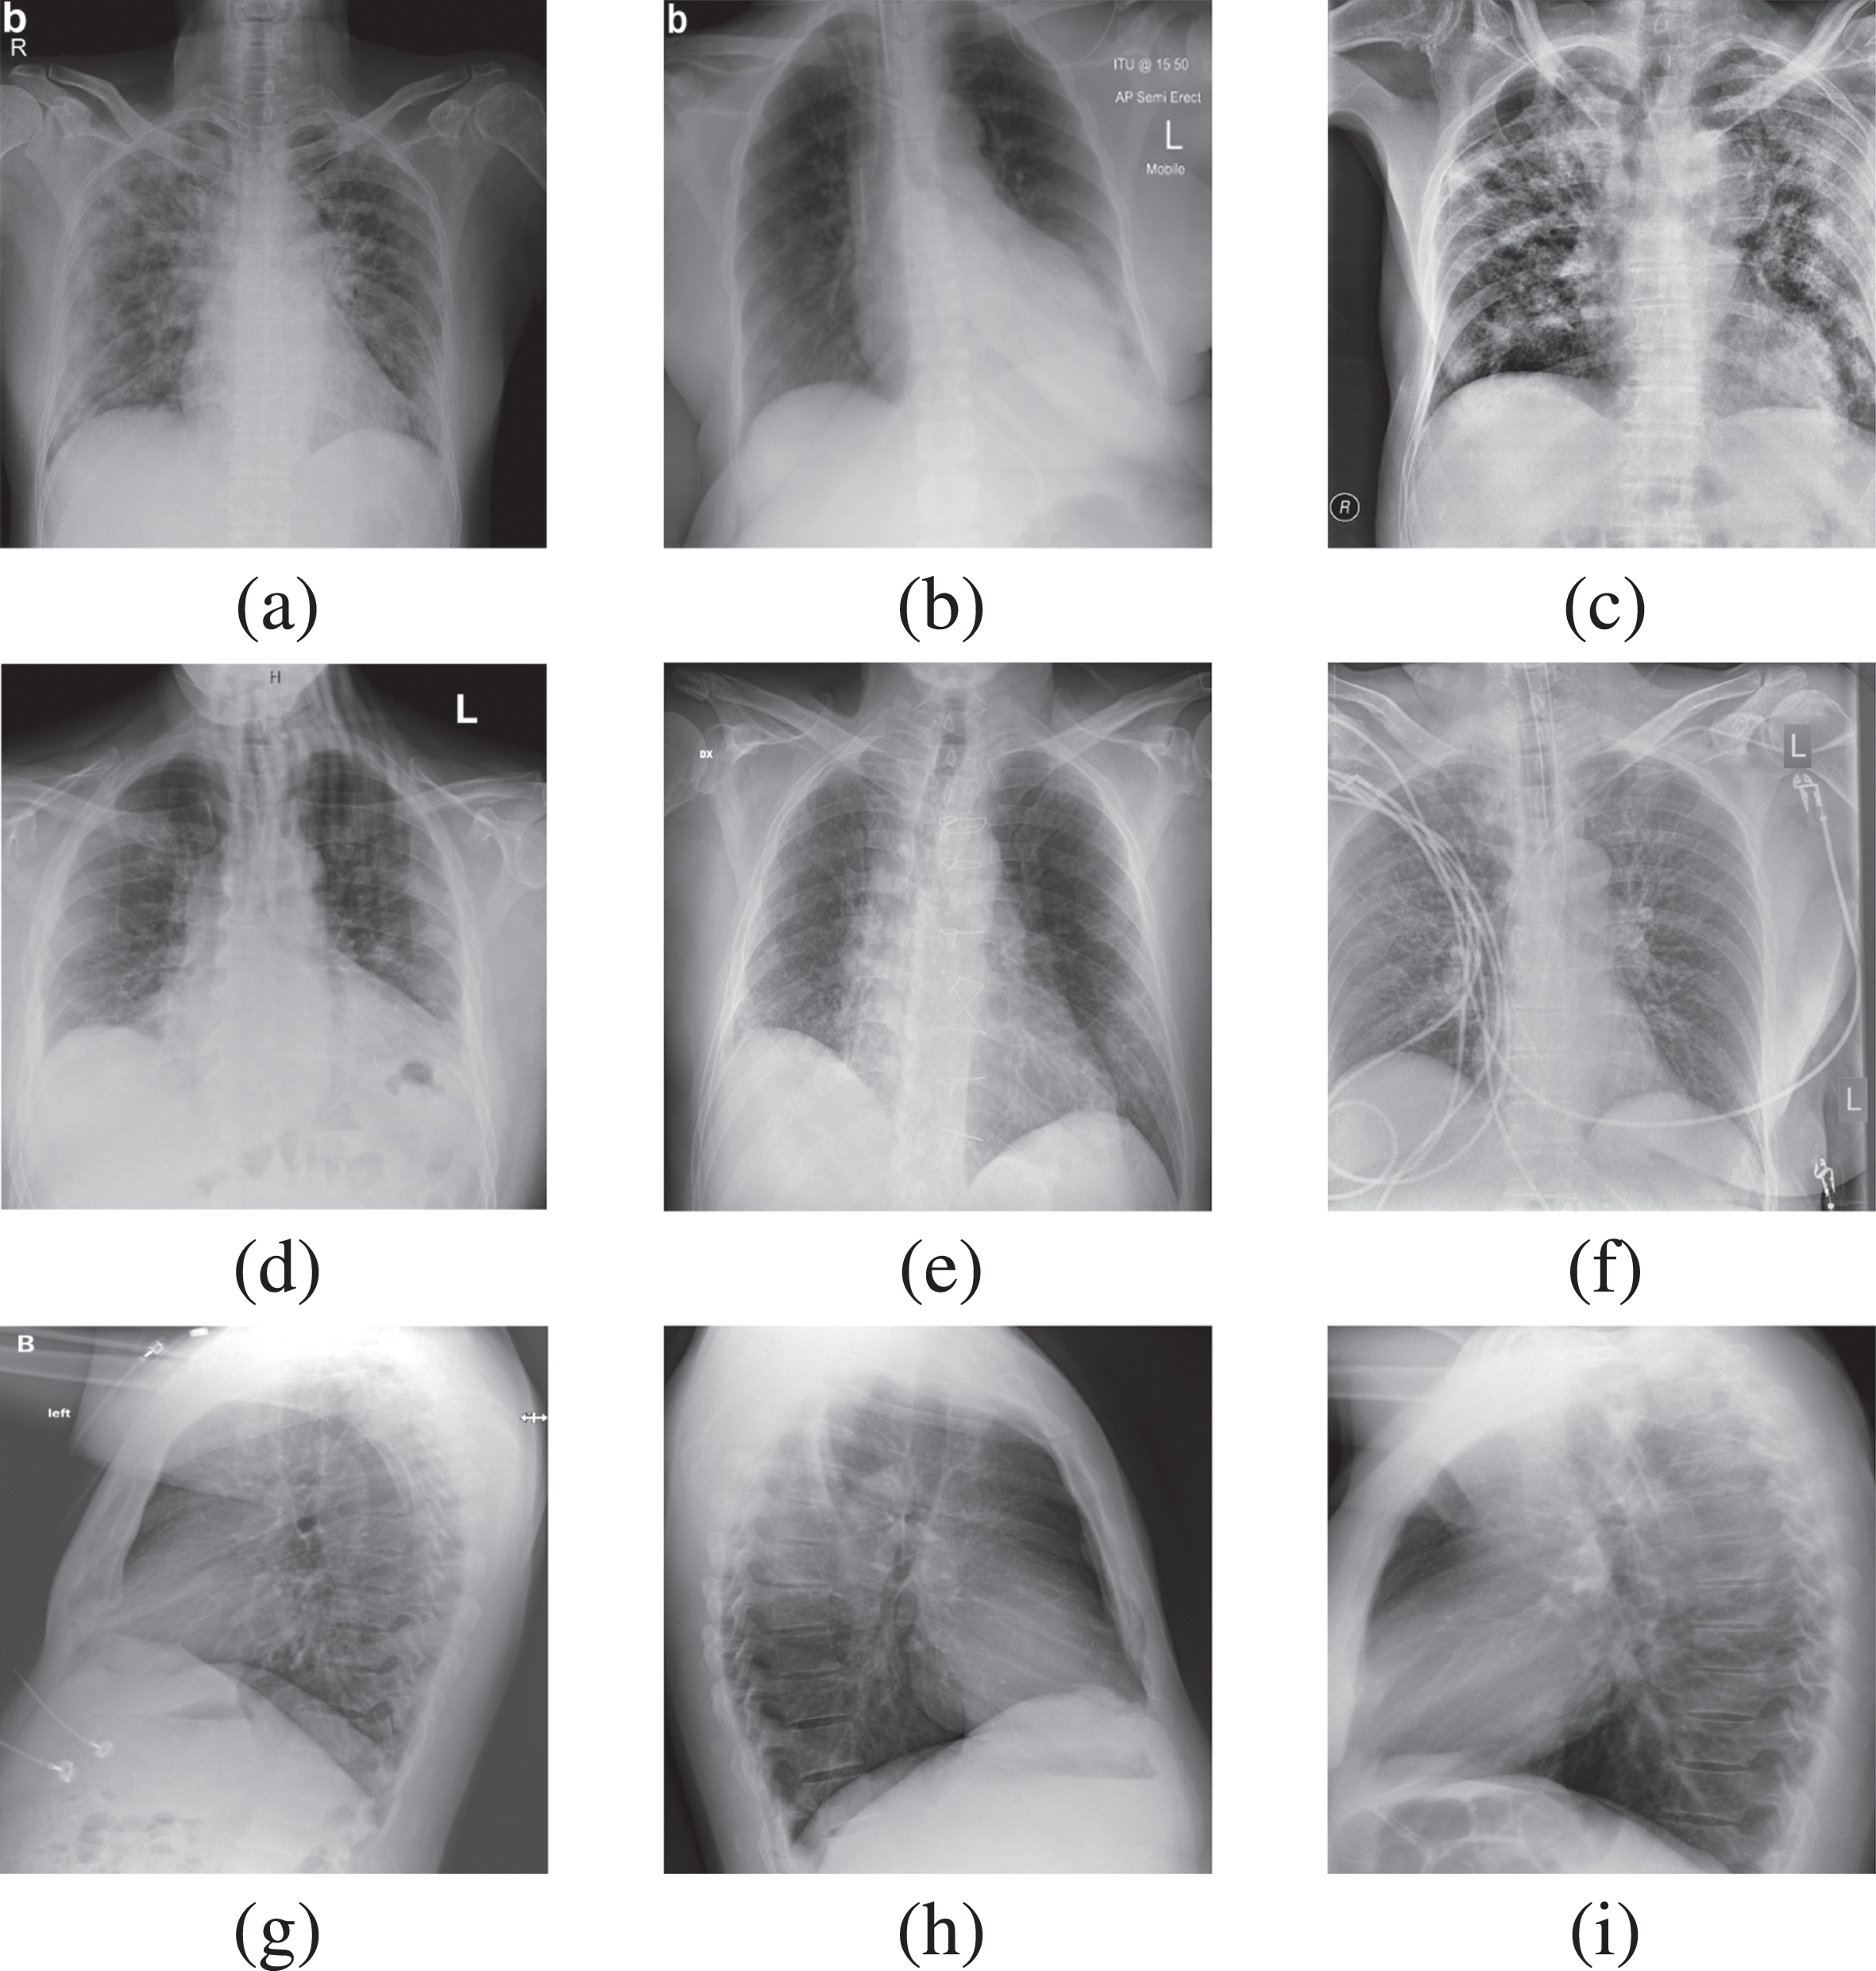
Table 3
The CXR Dataset_1 details used for Training, Validation and Testing
| Class | Number of Images for Training/Validation | Number of Test images for internal Validation | Total Images |
| COVID-19 | 6297 | 600 | 6897 |
| Normal | 5889 | 600 | 6489 |
Table 4
Details of EVD_1 and EVD_2 datasets
| Class | EVD_1 | EVD_2 | Total Images |
| COVID-19 | 17 | 34 | 51 |
| Normal | 25 | 25 | 50 |
3.2Preprocessing
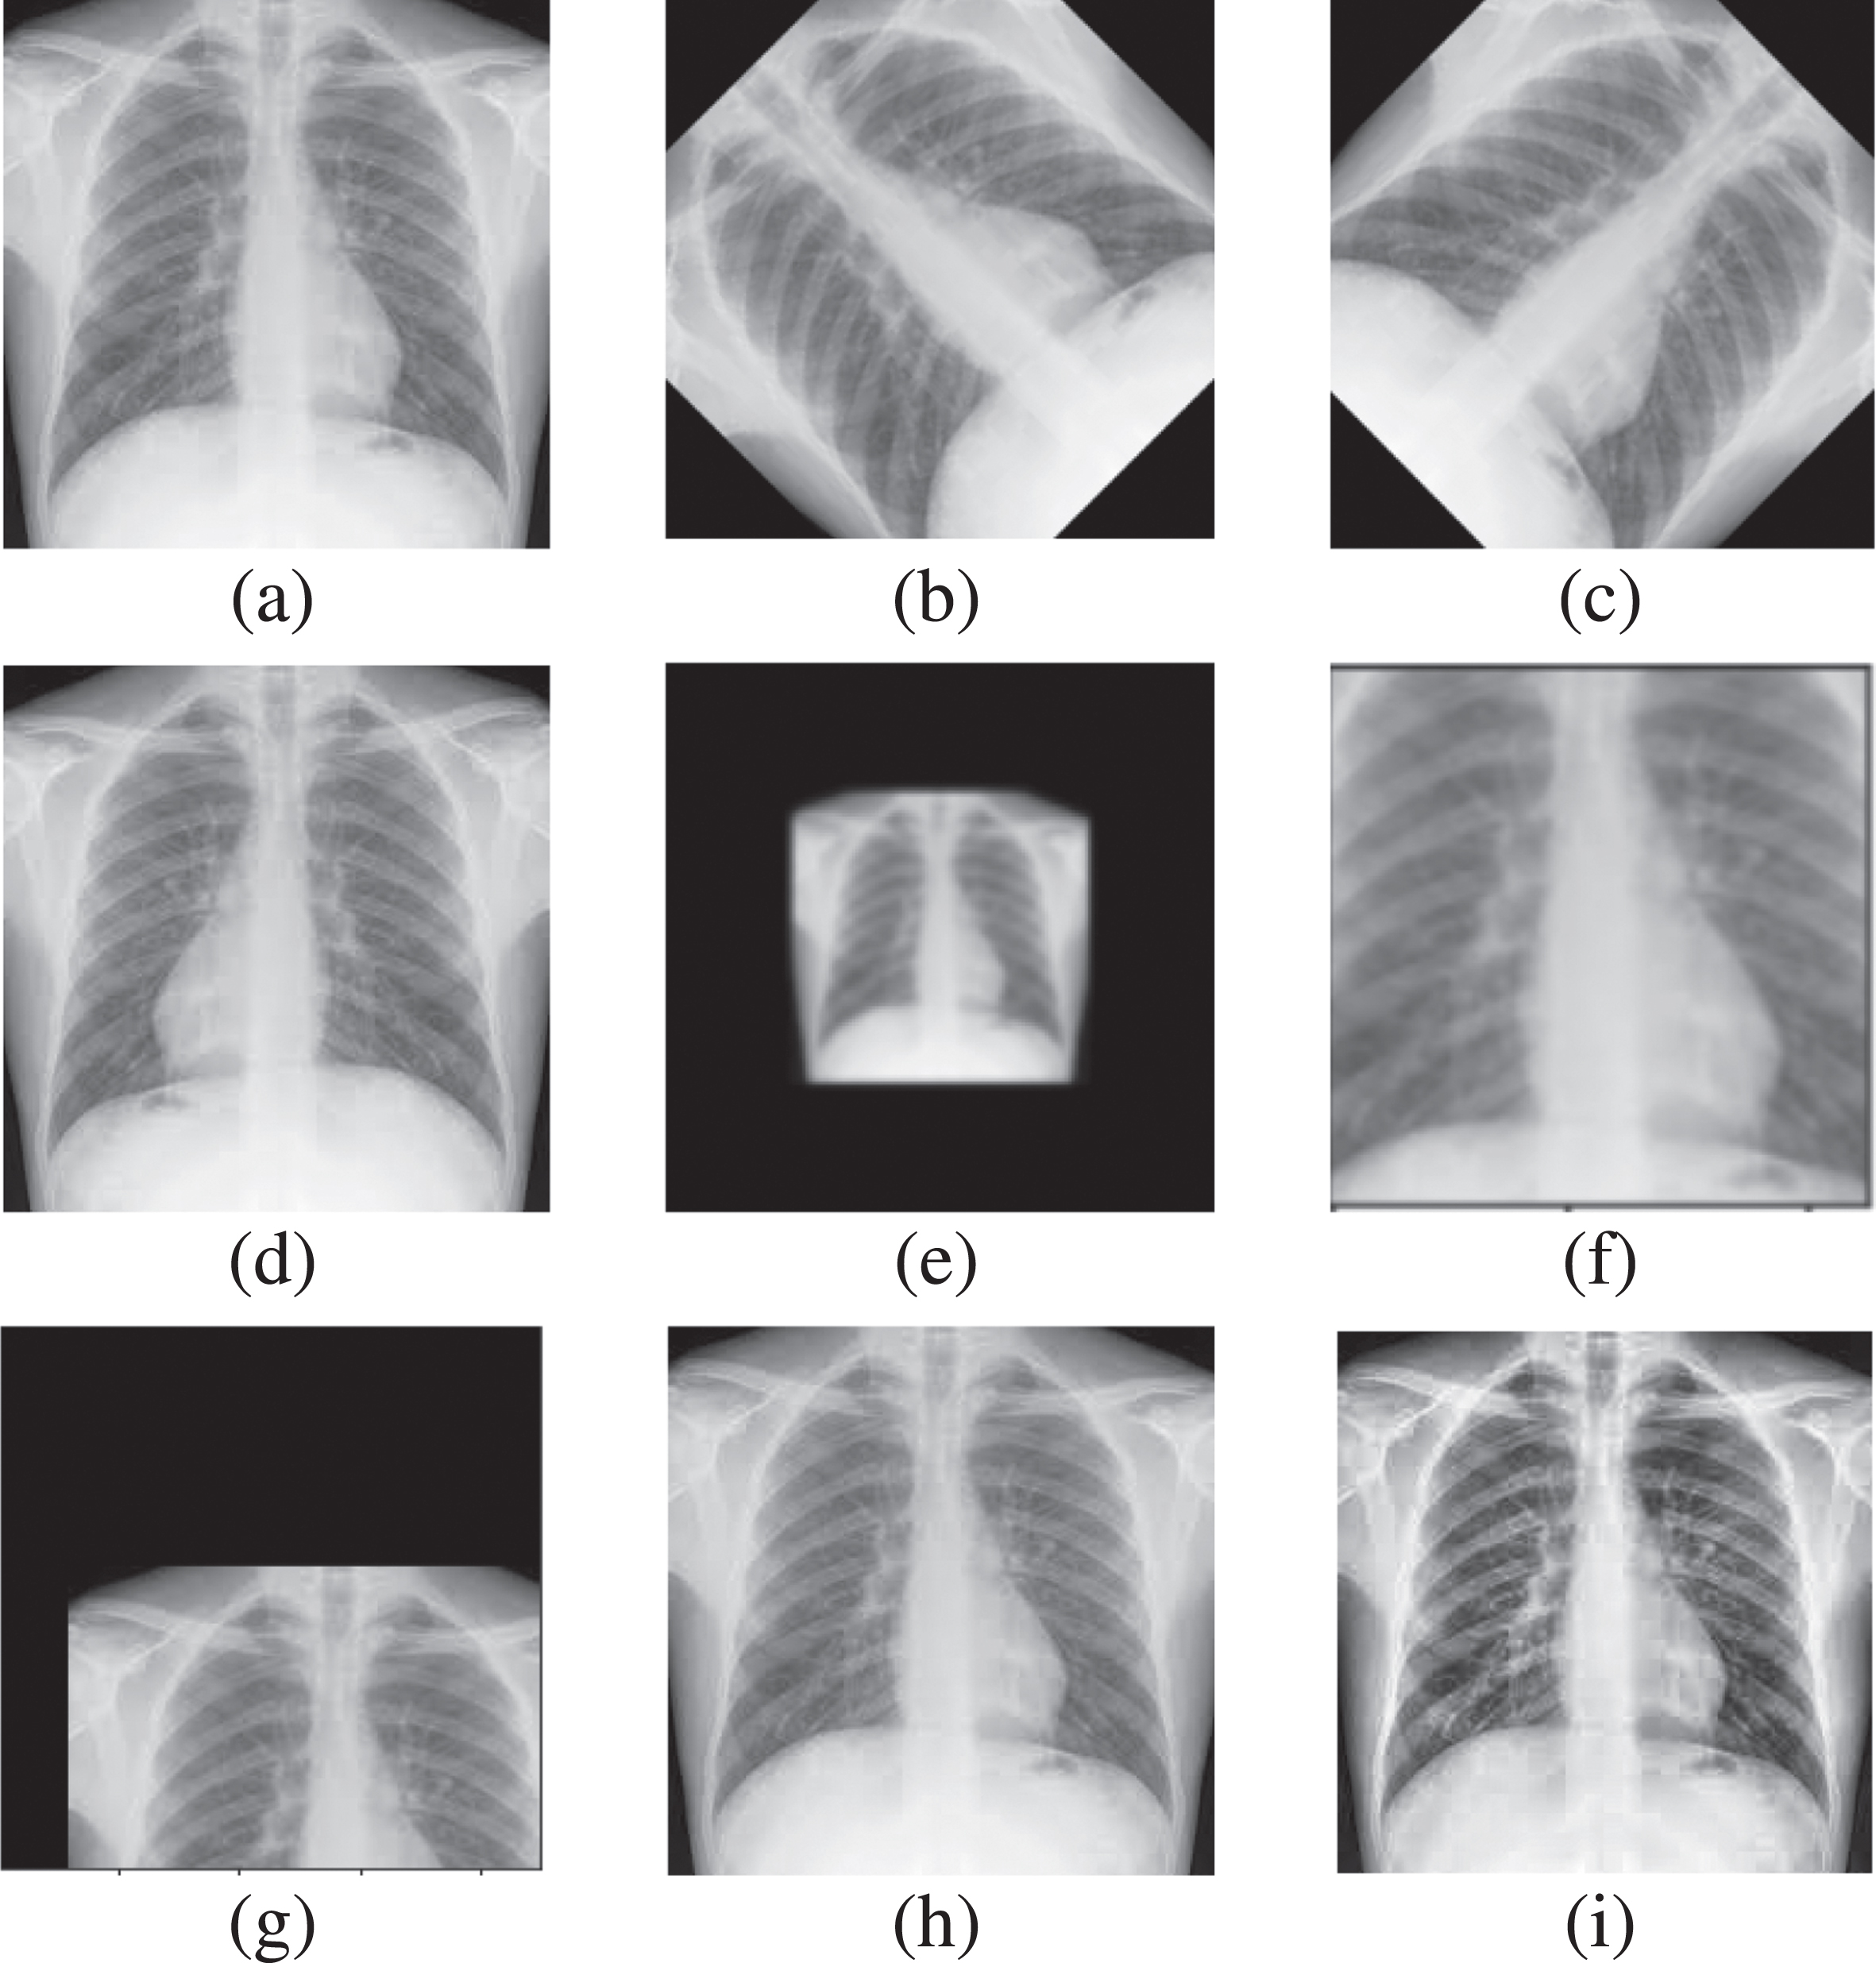
The initial work before preprocessing is the division of Dataset_1, such as 80%, placed in a train/validation folder. The remaining 20% in the test folder for internal validation. The first step of the proposed model is preprocessing the training/validation part of COVID-19 thorax x-ray images. This process freezes all the weights of network layers the classification layer remains active. The image cropping is applied to reduce extra dark space from the CXR images. The Albumentation [40] and ImageDataAugmentor libraries [41] have been imported from the GitHub repositories. Albumentation is highly recommended to perform segmentation and detection tasks in biomedical imaging; it reduces overfitting, which decreases execution time and ultimately increases accuracy [42]. ImageDataAugmentor library in Keras is used for data generation. The two parameters used by data generator are rescaling and augment [43]. Different operations are performed in data augmentation before passing to CNN to reduce overfitting. The copies of each image are produced by applying rotation, adding noise, shifting, scaling, flipping, zooming in/out and contrast limiting and equalizing [44]. Figure 3 visually depicts the augmented version of a single image from our dataset.
Fig. 3
Data Augmentation (a)Original CXR (b)(c) Rotated (d) Horizontally Flipped (e) Zoomedout (f) Zoomedin (g) Shifted (h) Gaussian Noise (i) CLAHE enhanced.
There is no overlapping of images. The preprocessed data has been trained and validated on fine tuned network using two-fold cross-validation. Cross-validation is like a repeated random sampling method, but the groups are generated so that no two groups overlap. The folds represent the number of groups the data has been divided into [45]. The thorax x-rays are variant in size, so for further transformation, these images are resized into a standard size of 224 for further processing. The next step is intensity normalization, so min-max normalization [46] is applied to shift the intensity to [0 1]. Intensity normalization is computed using Equation 1.
(1)
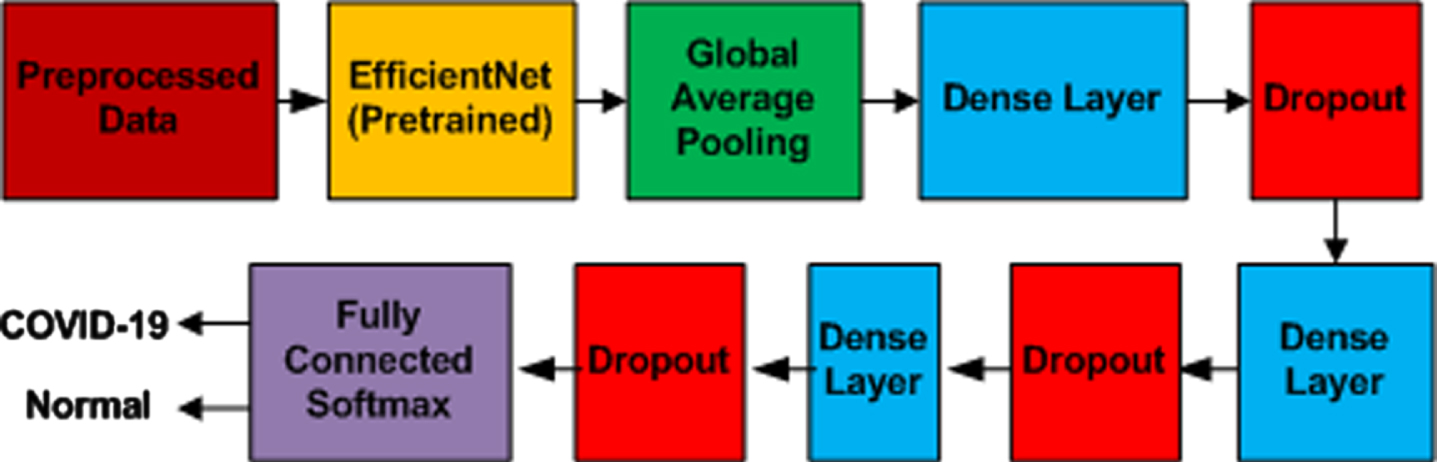
3.3The Proposed Neural Network Model
The basic aim of the proposed fine-tuned neural network is to develop a lightweight network. The transfer learning approach is used in the form of the improved EfficientNetB5 module. This architecture of B5 came into existence with the addition of layers in base model B0. It has 30M parameters and 9.9B flops. Figure 5 depicts its architecture. EfficientNet [47] is a family of models ranging from B0 to B7. The layers in EfficientNets range from 237 to 813, and trainable parameters are 11 million. B0 is the base model designed by Neural Architecture Search [48]. Depending on the application, this model used the compound scaling method to achieve better accuracy and efficiency in higher models. The empirical study used by developers of this network smartly balances width, depth, and resolution by simply scaling each of these with a constant ratio. A coefficient φ is used to uniformly scale width, depth, and resolution per given resource. The FLOPS of this network can be attained using Equation (2).
![Architecture Design of EfficientNetB5 [49].](https://content.iospress.com:443/media/ifs/2023/44-5/ifs-44-5-ifs223704/ifs-44-ifs223704-g005.jpg)
(2)
Fig. 4
Architecture of EfficientNetB0.
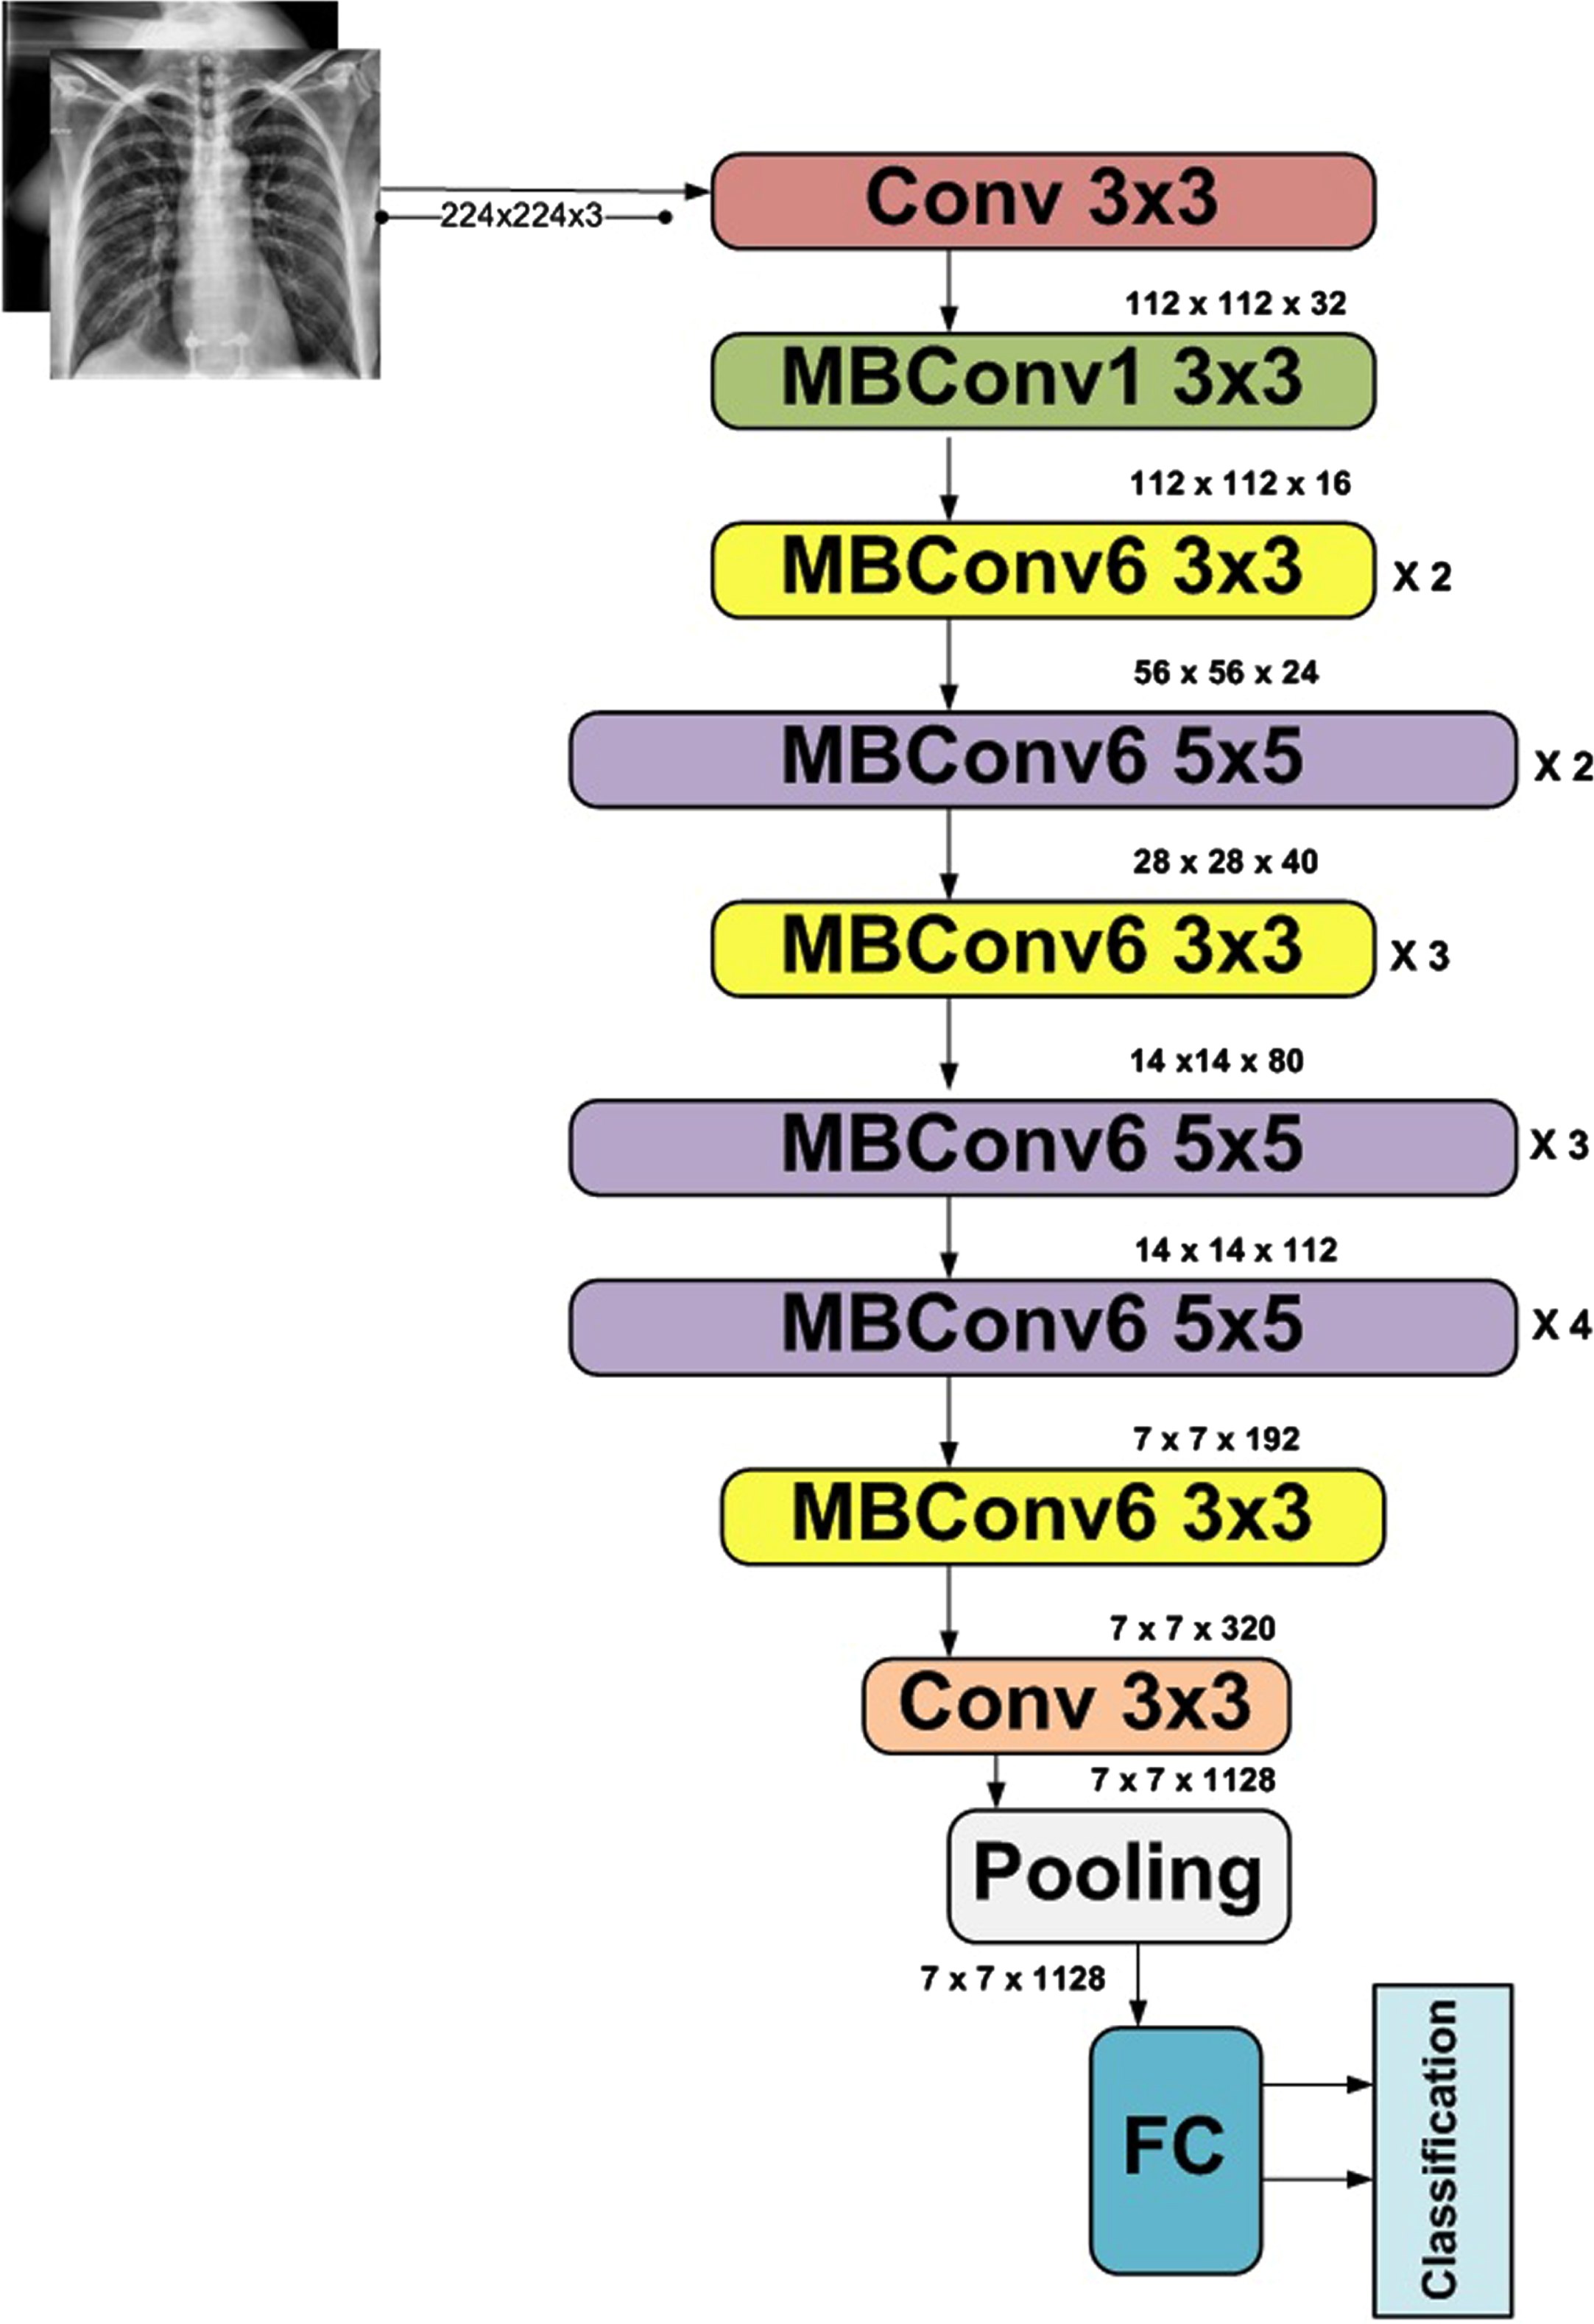
The addition of layers in the base model upgrades the model. The architectural design of EfficientNetB5 is represented in Figure 5. The upgraded design of EfficientNetB5 used in this proposed model is presented in Figure 6.
Fig. 6
Structure of Proposed Modified Algorithm.
The next step during the training process is to update weights, so the general equation set 11 is used to perform this task. Lets consider
(3)
The next task is the optimization and adaptive optimization algorithm, Adam optimizer, which is used as a solver to minimize the loss and improve accuracy. It precisely controls the step size and updates the neural network weights accordingly [50]. The global average pooling layer is used to reduce overfitting. In addition, three dense inner layers accompanied by dropout and ReLU activation functions, formulated in Equation 4 and 5, have been used to complete the first iteration. Consider a layer y, which has a neuron named r. The layer y is going to take a neuron z from y - 1 layer [51]. The equation used to calculate the input neuron would be as follows.
(4)
(5)
30% dropout layer was added to reduce training time and overfitting before classification. The softmax layer will finally classify the images that can be performed using Equation 6.
(6)
The exact process is repeated for the second fold. The results obtained in both folds were compared for best performance. The best parameters were selected for validation by comparing the results, and the final results were generated. The layout of the complete flow is depicted in Figure 1. The Layering of the proposed model is elaborated in Figure 6.
4Experiments
4.1Experimental Setup
We have developed a diagnostic algorithm in the proposed setup using improved EfficientNetB5 architecture. The top layer of the network is replaced by two output neuron layers, as our modal will classify two types of images normal CXR and COVID CXR. The remaining layers are unchanged as they are well-trained on ImageNet. In addition, a combination of dropout and dense layers is introduced to enhance the performance further. To manage the values of weights and how many times the value of the weight should be revised is defined by the optimizer, so we have used the Adam optimizer in the next step to perform experimentation. We have also compared the Stochastic Gradient Decent SGD optimizer with ADAM, but because of built-up momentum, Adam performed better than SGD with a learning rate of 0.0001. To check the improvement in the learning rate, we have taken help from early stopping criteria if the system is not showing improvements by setting the patience value to 3. The batch size is set to 16. Table 5 shows some important parameter. The proposed models are compiled using an online tool named Google Colaboratory in a GPU environment, which is a product of Google Research. It is an online free platform used to train Deep Learning Models. All codes were formulated in Keras Python 3.7.11 version with 12GB NVIDIA Tesla K80 GPU. The functional Layout of the prescribed model is depicted in Figure 7.
Table 5
Parameters used for proposed model training: EfficientNets and VGG
| Parameters | Value |
| Learning Rate | 0.001 |
| Batch size | 16 |
| Dropout | 30% |
| Optimizer | Adam |
Fig. 7
Functional Layout of prescribed EfficientNetB5 model.
4.2Performance Metrics
To evaluate the performance of the proposed bi-classification algorithm for COVID-19 detection, numerous evaluation metrics are used to estimate the performance, like True Positive (TP), True Negative (TN), False Positive (FP), and False Negative (FN) Rates. TP is the number of times the prescribed model will predict a positive value as positive, and TN is the number of identification of a negative value correctly. Similarly, when the model depicts the positive value as a negative value, it is FP; when a negative value is depicted as positive, it is FN. The other classification parameters like Accuracy, Precision, Recall, and F1-score can be calculated using TP, TN, FP, and FN. Equations (7 to 10) state the mathematical representation of these metrics. Precision is the ratio of accurately predicted positive values and the total number of predicted positive values, formulated in Equation 9; on the other hand, Recall/Sensitivity can be defined as the accurate prediction of positive cases. Equation 8 elaborates the mathematical notation of recall/sensitivity. In uneven class distribution, F1-Score is a very useful parameter as it considers FP and FN along with true values [52], formulated in Equation 10.
(7)
(8)
(9)
(10)
4.2.1Gradient-weighted Class Activation Mapping (Grad-CAM)
The results are also presented as heat maps to depict the localized area graphically. Grad-CAM is a localization technique used to generate these maps. It provides a visual explanation of any neural network model depictions. In order to accomplish the localization map, the gradient information from CNN’s last layer will be used to observe all image information for each class of images. As referred in [53] Lets assume that
(11)
(12)
4.3Training
The self-generated Dataset_1, including COVID-19 and Normal x-ray images detailed in Table 1, has been divided into two parts, 80% is used for training/validation of the network, remaining 20% is used for testing of the trained network. The transfer learning approach is proposed. Pretrained networks significantly reduce training time; the Softmax is an activation function in the output layer for detection. Dense layers used ReLU activation, and a Dropout of 30% was used to reduce overfitting. The optimizer used for both pre-trained networks is the Adam optimizer with 0.0001 sets as the learning rate. The main library of ImageDataAugmentor has been imported to create a data generator that reduces the execution time. The library in Python Keras transforms images randomly. Images are re-scaled by 1/255 so that images get normalized from range [0, 255] to [0, 1].
5Results and Discussion
This section comprises results obtained after experimentation on the proposed model for the detection of COVID-19. The comparative analysis is also performed on EfficientNet B0, B1, B2, B3, B4, B6, and B7 models. We also compared our model with pre-trained VGG16 and VGG19. The attained results of the proposed model are presented in Tables 7 and 8.
Table 7
Classification Report of Deep learning models in the form of performance metrics
| Network Model | Time/epoc | Accuracy | Precision | Recall | F1-Score | Support |
| EfficientNetB0 | 098s | 0.986 | 0.98680 | 0.98666 | 0.98666 | 1200 |
| EfficientNetB1 | 100s | 0.985 | 0.98606 | 0.98583 | 0.98583 | 1200 |
| EfficientNetB2 | 108s | 0.983 | 0.98359 | 0.98333 | 0.98333 | 1200 |
| EfficientNetB3 | 110s | 0.987 | 0.98780 | 0.98750 | 0.98749 | 1200 |
| EfficientNetB4 | 103s | 0.989 | 0.98933 | 0.98916 | 0.98916 | 1200 |
| EfficientNetB5 | 104s | 0.995 | 0.99502 | 0.99500 | 0.99499 | 1200 |
| EfficientNetB6 | 134s | 0.986 | 0.98675 | 0.98666 | 0.98666 | 1200 |
| EfficientNetB7 | 127s | 0.990 | 0.99099 | 0.99083 | 0.99083 | 1200 |
| VGG16 | 098s | 0.986 | 0.98667 | 0.98666 | 0.98666 | 1200 |
| VGG19 | 094s | 0.978 | 0.97833 | 0.97833 | 0.97833 | 1200 |
Table 8
Evaluation on Loss matrix of all EfficientNets and VGG
| Network Model | Average Loss |
| EfficientNetB0 | 0.22200 |
| EfficientNetB1 | 0.22430 |
| EfficientNetB2 | 0.22275 |
| EfficientNetB3 | 0.22215 |
| EfficientNetB4 | 0.22600 |
| EfficientNetB5 | 0.22305 |
| EfficientNetB6 | 0.22520 |
| EfficientNetB7 | 0.23380 |
| VGG16 | 0.01827 |
| VGG19 | 0.21220 |
The results clearly define improved EfficientNetB5 best in terms of accuracy and time/epoch. Table 6 shows that our experimentation has attained accuracy and time/epoch values. The other state of art models, especially the EfficientNet models other than B5, is also showing significant results, but VGG 16 and 19 have attained the lowest accuracy in our diagnosis.
Table 6
Performance Metrics of proposed EfficientNetB5 Network
| Accuracy | Precision | Recall | F1-Score | Support | |
| COVID-19 | - | 0.9983 | 0.9916 | 0.9950 | 600 |
| Normal | - | 0.9917 | 0.9983 | 0.9950 | 600 |
| Bi-classification | 0.995 | 0.9950 | 0.9950 | 0.9950 | 1200 |
The Networks of deep learning models converge at different times because of their parameter variations and architectural differences [54]. Suppose we look at the graphical response of training and testing of these models, as shown in the first column of Figure 8 and 9. In that case, it is observed that the convergence in terms of the epoch is efficient in the case of lightweight EfficientNets [55] and lower in VGG. The convergence rate of EfficientNets is smooth and less time-consuming due to its scaling coefficient technique [48]. Secondly, the loss of trained models, which show the false prediction rate during the training/testing session, is shown in the second column. In terms of loss, EfficientNets, preferably B5, performs better as its loss decreases with time. The training and testing are performed based on image splitting defined in Table 3. The comparison of accuracy attained by networks is also depicted in Figure 10, which clearly defines improved EfficientNetB5 as working best in terms of accuracy, having the highest values of cross-validation accuracy as compared to other networks.
Fig. 8
Accuracy and Loss curves of EfficientNets from B0 to B7 during the training process.
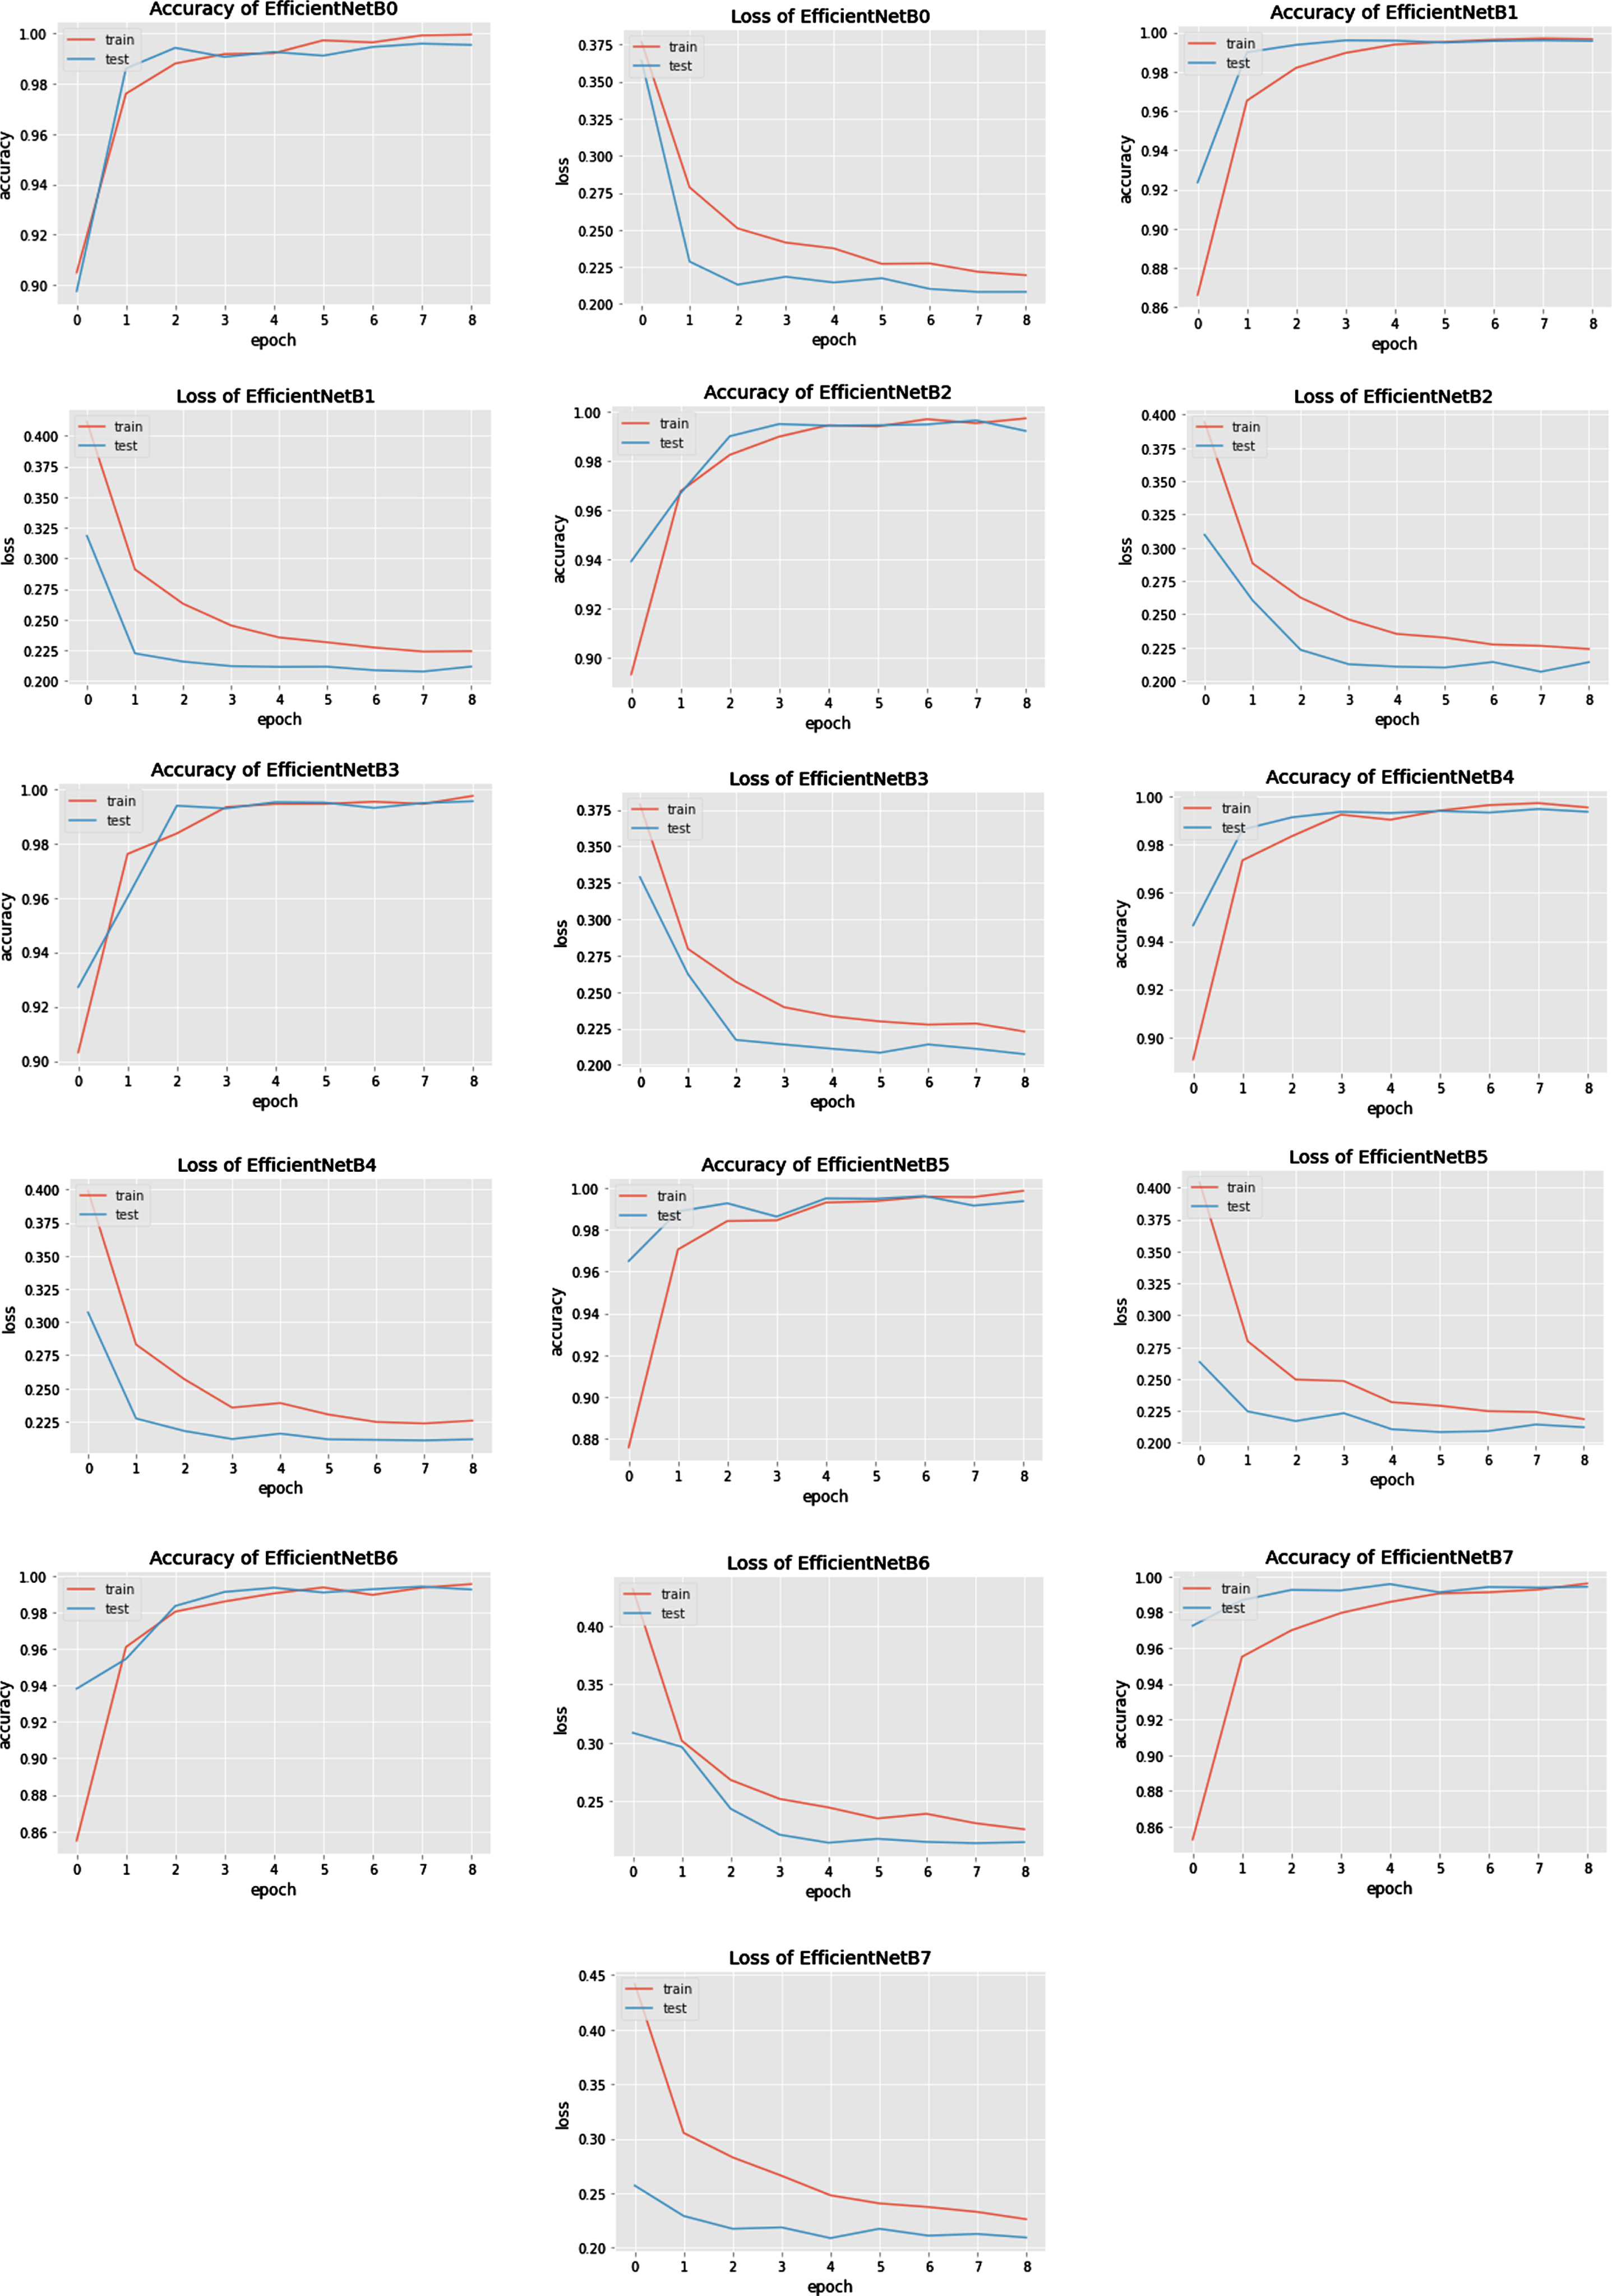
Fig. 9
Accuracy comparison bar graph of deep learning models used in the proposed model.
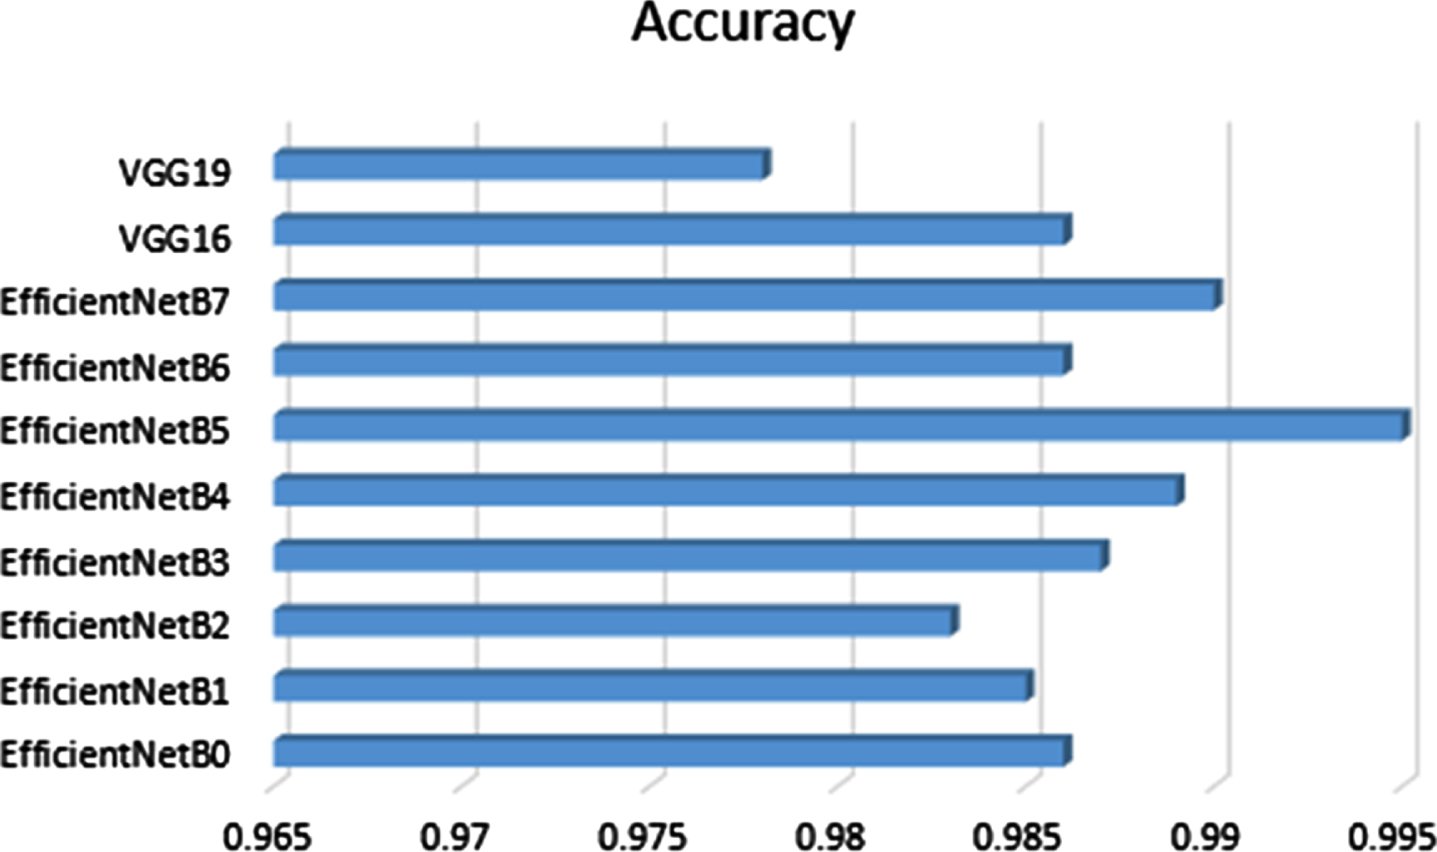
Fig. 10
Results of VGG16 and VGG19.
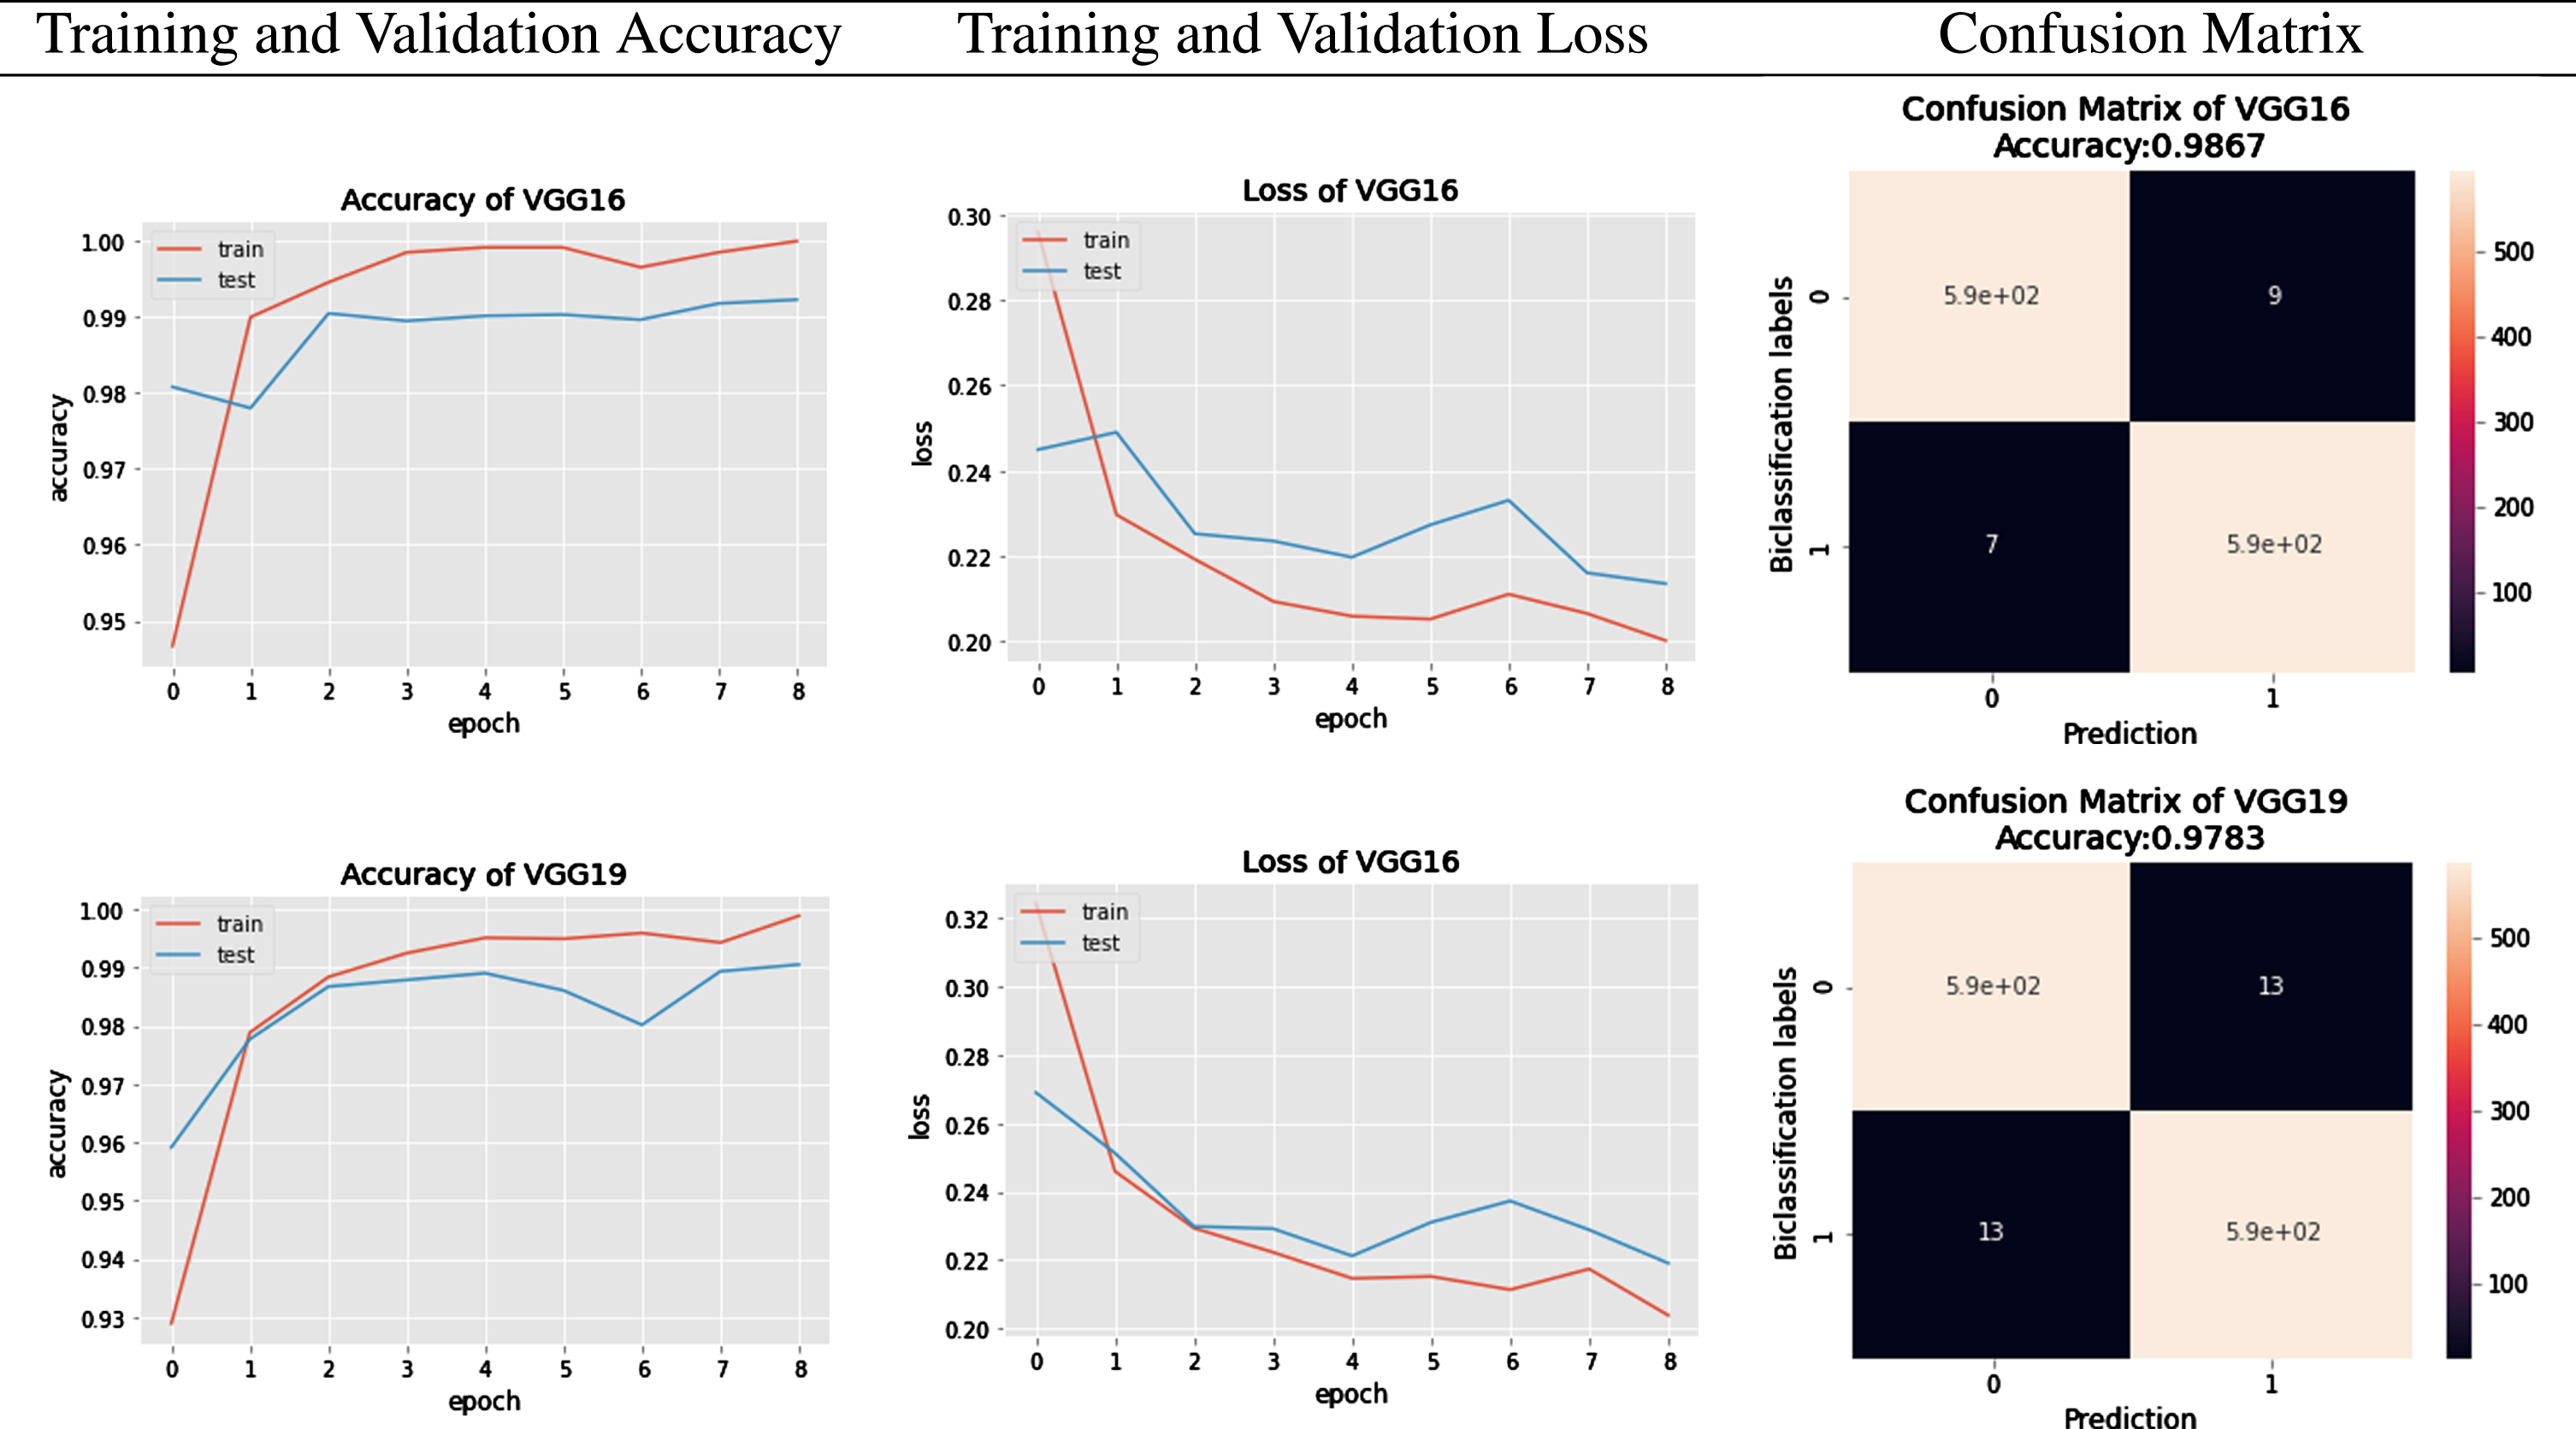
To further investigate the behaviour of each network, authors have generated classification reports in the form of Precision, Recall, F1-Score, and Support. These performance parameters are calculated based on the existence of True Positive (TP), True Negative(TN), False Positive (FP), and False Negative (FN) parameters. The Confusion Matrix of EfficientNet Model classification and VGG models classification are graphically depicted in Figure 9 and 11 respectively. Looking at the details given in Table 7 regarding classification, B5 has achieved the highest results compared to other state-of-the-art algorithms. EfficientNets below produce the overall results generated from VGG16 and VGG19.
Fig. 11
Confusion Matrix of predictions generated from EfficientNetB0 to EfficientNetB7.
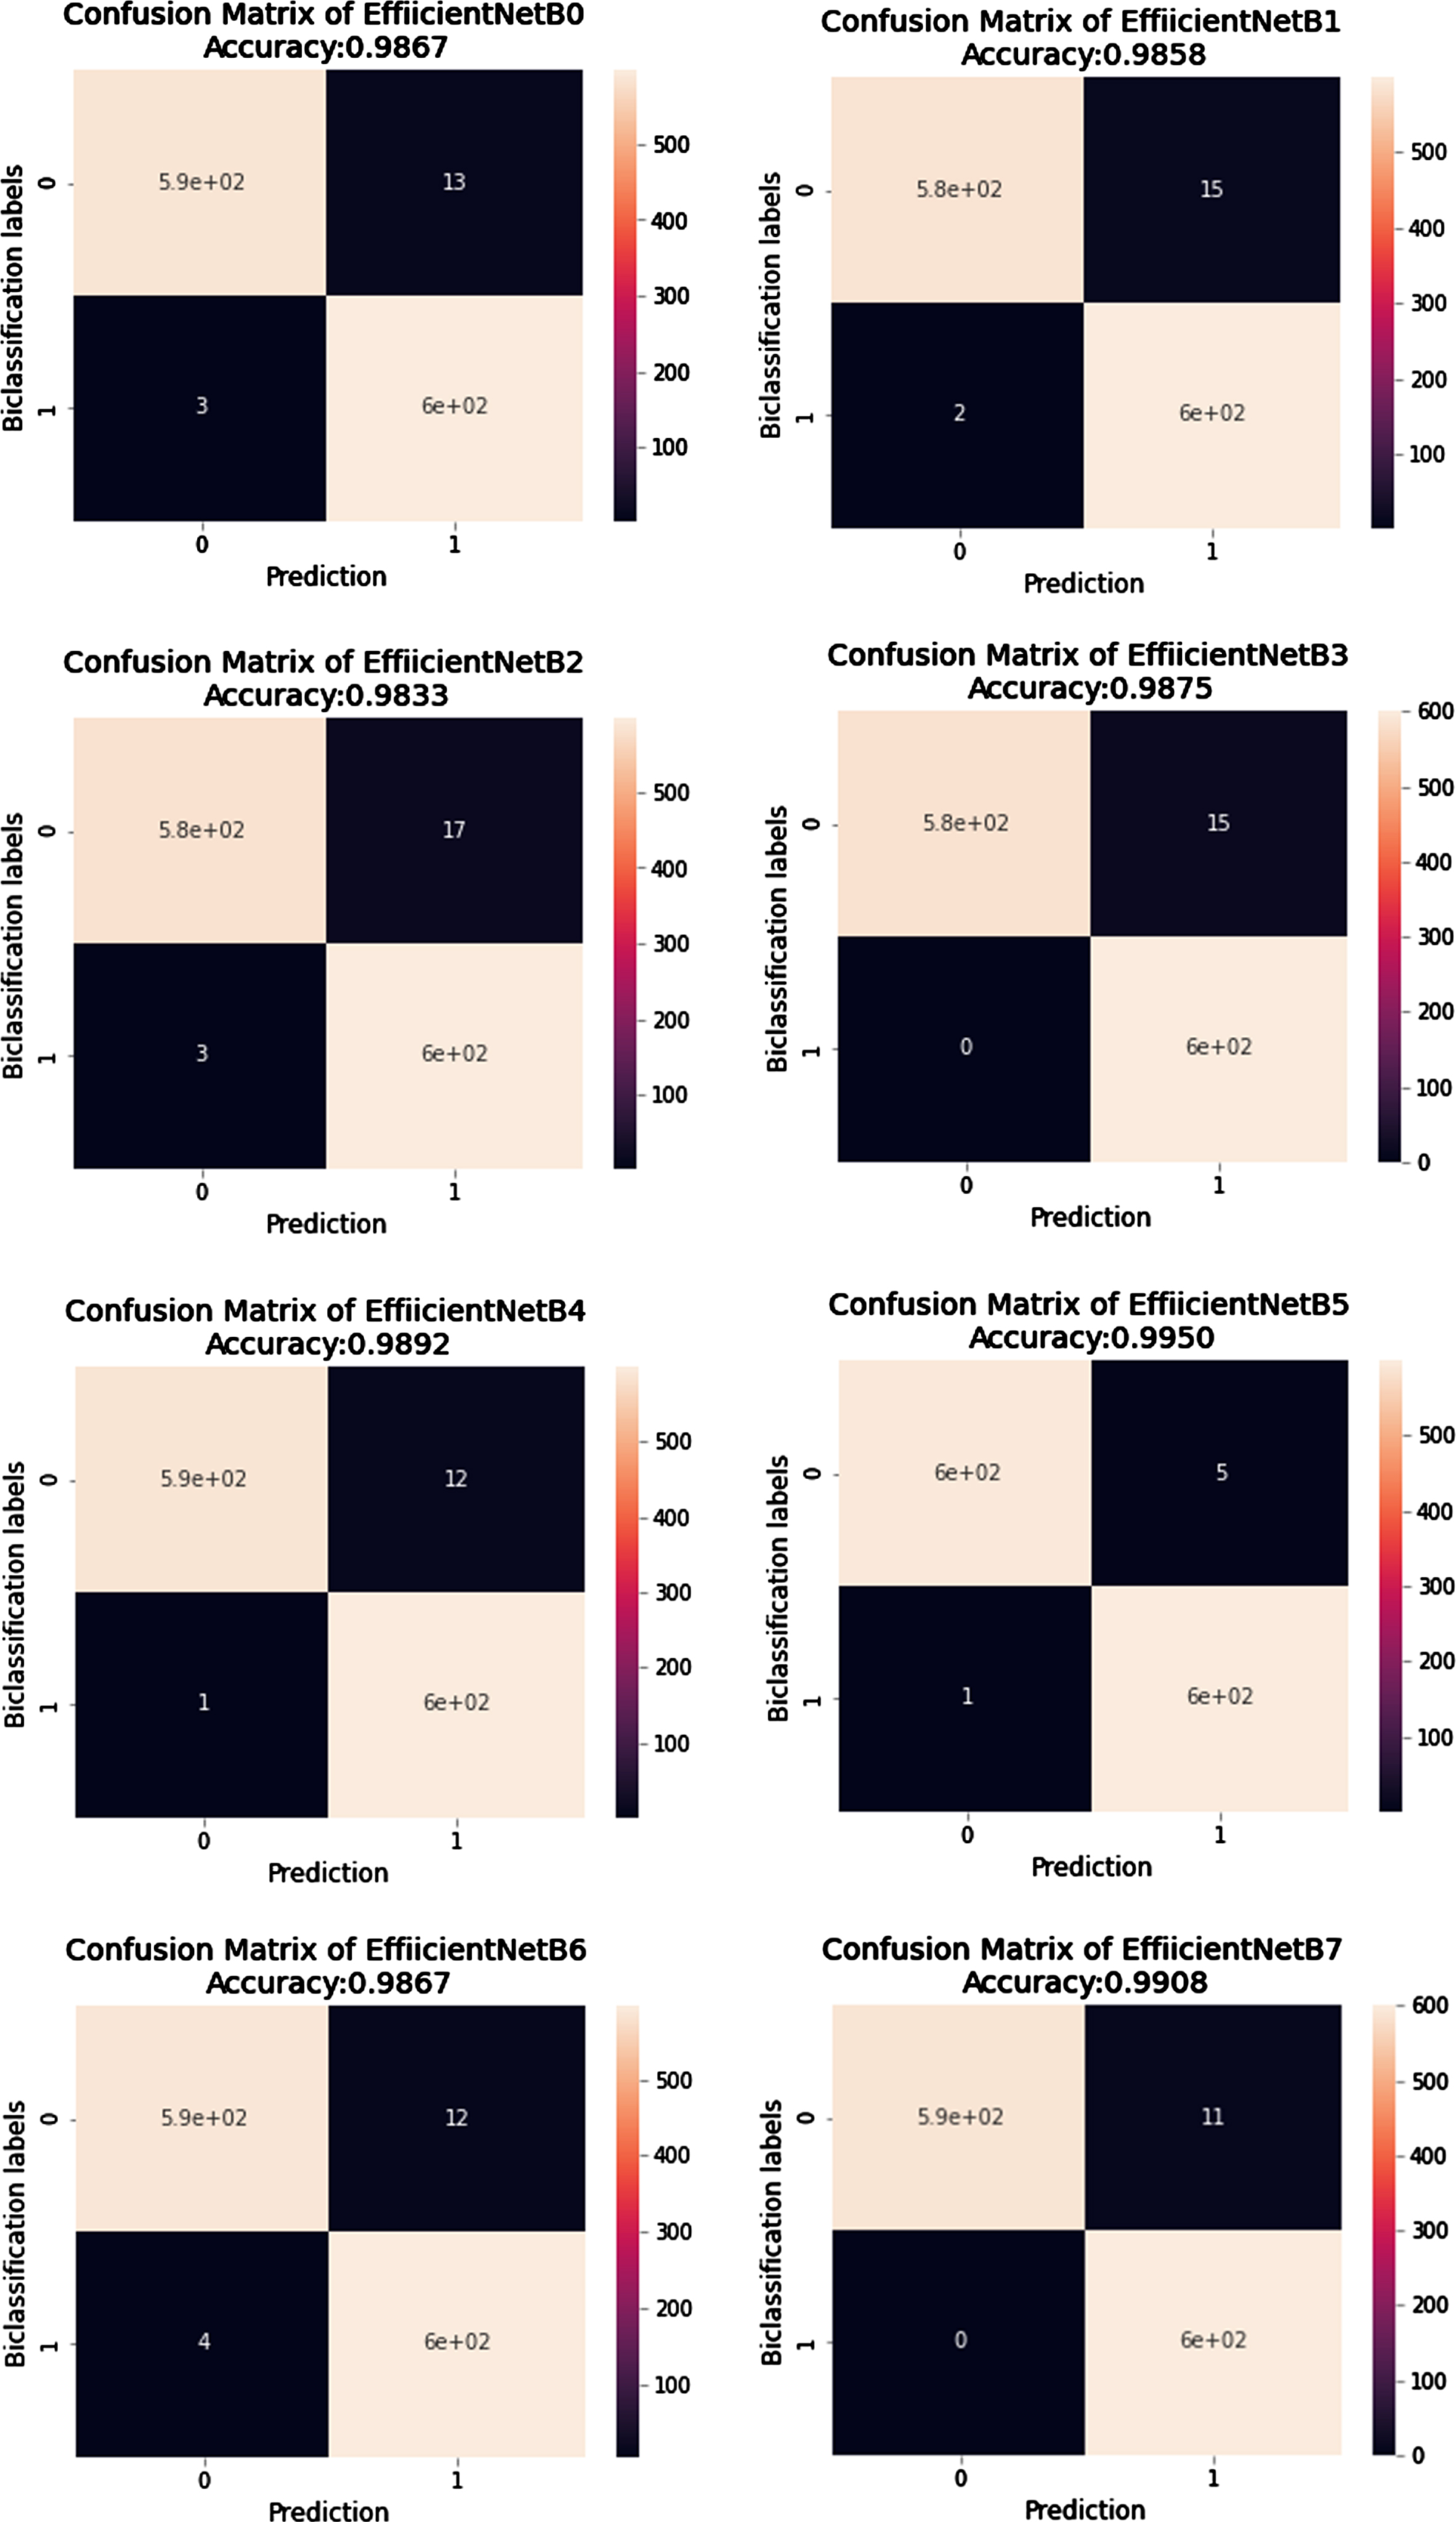
In the case of COVID-19 classification, the most crucial parameter is the FP value because negatively diagnosed COVID patients are a source of real danger for society. The best algorithm among all should be the one that gives the minimum number of FP scores. In our case, improved EfficientNetB5 has the lowest value of FP, 5 out of 600 images. Similarly, the classification parameter Recall has an FP parameter in the denominator, elaborated in Equation 8. The higher the value of Recall more accurate our algorithm predicts the result. The Recall value in the case of improved EfficientNetB5 is 0.995, which is higher as compared to other algorithms. All algorithms’ average losses are also calculated, and in Table 8 it can be seen that EfficientNetB5 has a lower loss than B6 and B7. It is evident that EfficientNetB5 achieves high accuracy and low loss compared to other networks. The comparison of predicted values of improved EfficientNetB5 with other state-of-the-art algorithms during the cross-validation process is shown in Table 9. It clearly distinguishes the result of predictions.
Table 9
Evaluation matrix of all EfficientNets and VGG
| Network Model | TP | FP | FN | TN |
| EfficientNetB0 | 587 | 13 | 03 | 597 |
| EfficientNetB1 | 585 | 15 | 02 | 598 |
| EfficientNetB2 | 583 | 17 | 03 | 597 |
| EfficientNetB3 | 585 | 15 | 00 | 600 |
| EfficientNetB4 | 588 | 12 | 01 | 599 |
| EfficientNetB5 | 595 | 05 | 01 | 599 |
| EfficientNetB6 | 588 | 12 | 04 | 596 |
| EfficientNetB7 | 594 | 06 | 11 | 589 |
| VGG16 | 591 | 06 | 07 | 593 |
| VGG19 | 587 | 13 | 13 | 587 |
This section presents a comparative analysis of previously published classification results for COVID-19 detection in CXR images. It is observed that most of the experiments are performed using a limited number of CXR images of COVID-19 victims. Secondly, very few among them have a low training time. They are also not paying much attention to limiting the number of parameters. Most of the authors have not validated their work using a cross-validation approach. Lastly, very few among them have generated experimental comparisons of results with other models. The comparison is generated in Table 10.
Table 10
Comparison of literature used deep learning network models with network models, dataset, and classification report
| Reference | Network Model | Epoch | Dataset | Classification parameters | Accuracy |
| [56] | Ensemble network InceptionV3+MobileNetV2 | - | COVID-1000 Other-3000 | Sensitivity-0.968Specificity-0.987 F1-Score-0.9845 | 0.881 |
| [57] | COVID-CheXNet | 10 | COVID-400 Normal-400 | Sensitivity-0.998Specificity-1.000Precision-1.000 F1-Score-0.999 | 0.999 |
| [58] | CXRVN | - | COVID-221 Other-234 | Sensitivity-0.978Specificity-0.955Precision-0.957 F1-Score-0.967 | 0.967 |
| [59] | nCOVnet | 80 | COVID-142 Normal-142 | Sensitivity-0.976 Specificity-0.785 | 0.881 |
| [60] | MobileNet | 200 | COVID-320 Other-5928 | Sensitivity-0.878,Specificity-0.993Precision-0.878 F1-Score-0.878 | 0.986 |
| [61] | ResNet50 VGG16 | - | COVID-135 Other- 208 | - | 0.8920.900 |
| [62] | CovNet-CXR-S CovNet-CXR-L | - | COVID-183 Other- 13617 | - | 0.9260.944 |
| [63] | VGG16ResNet50EfficientNetB0 | 50 | COVID-202 Other-600 | - | 0.8800.9000.965 |
| Our Proposed Model | Modified EfficientNetB5 | 9 | COVID- 6297 Normal- 5889 | Sensitivity- 0.9916 Precision- 0.9983F1-Score-0.9949 | 0.995 |
5.1Overall Results of Algorithm
The results of eight models of EfficientNet and two models of VGGs are depicted in figures and tables. Their performance depicts that as the complexity of trainable parameters increases, the results get more modified. The Confusion Matrix in Figure 9 and 11 shows that the accuracy increases as the model number increases but on the cost of more time for convergence and an increase in the number of parameters. So using the improved EfficientNetB5 is the best choice as there is less time difference from the base model EfficientNetB0, but the accuracy is approaching 99.5% on low parameter cost. The efficiency of VGG models is less as compared to EfficientNet models.
5.1.1Testing the proposed network
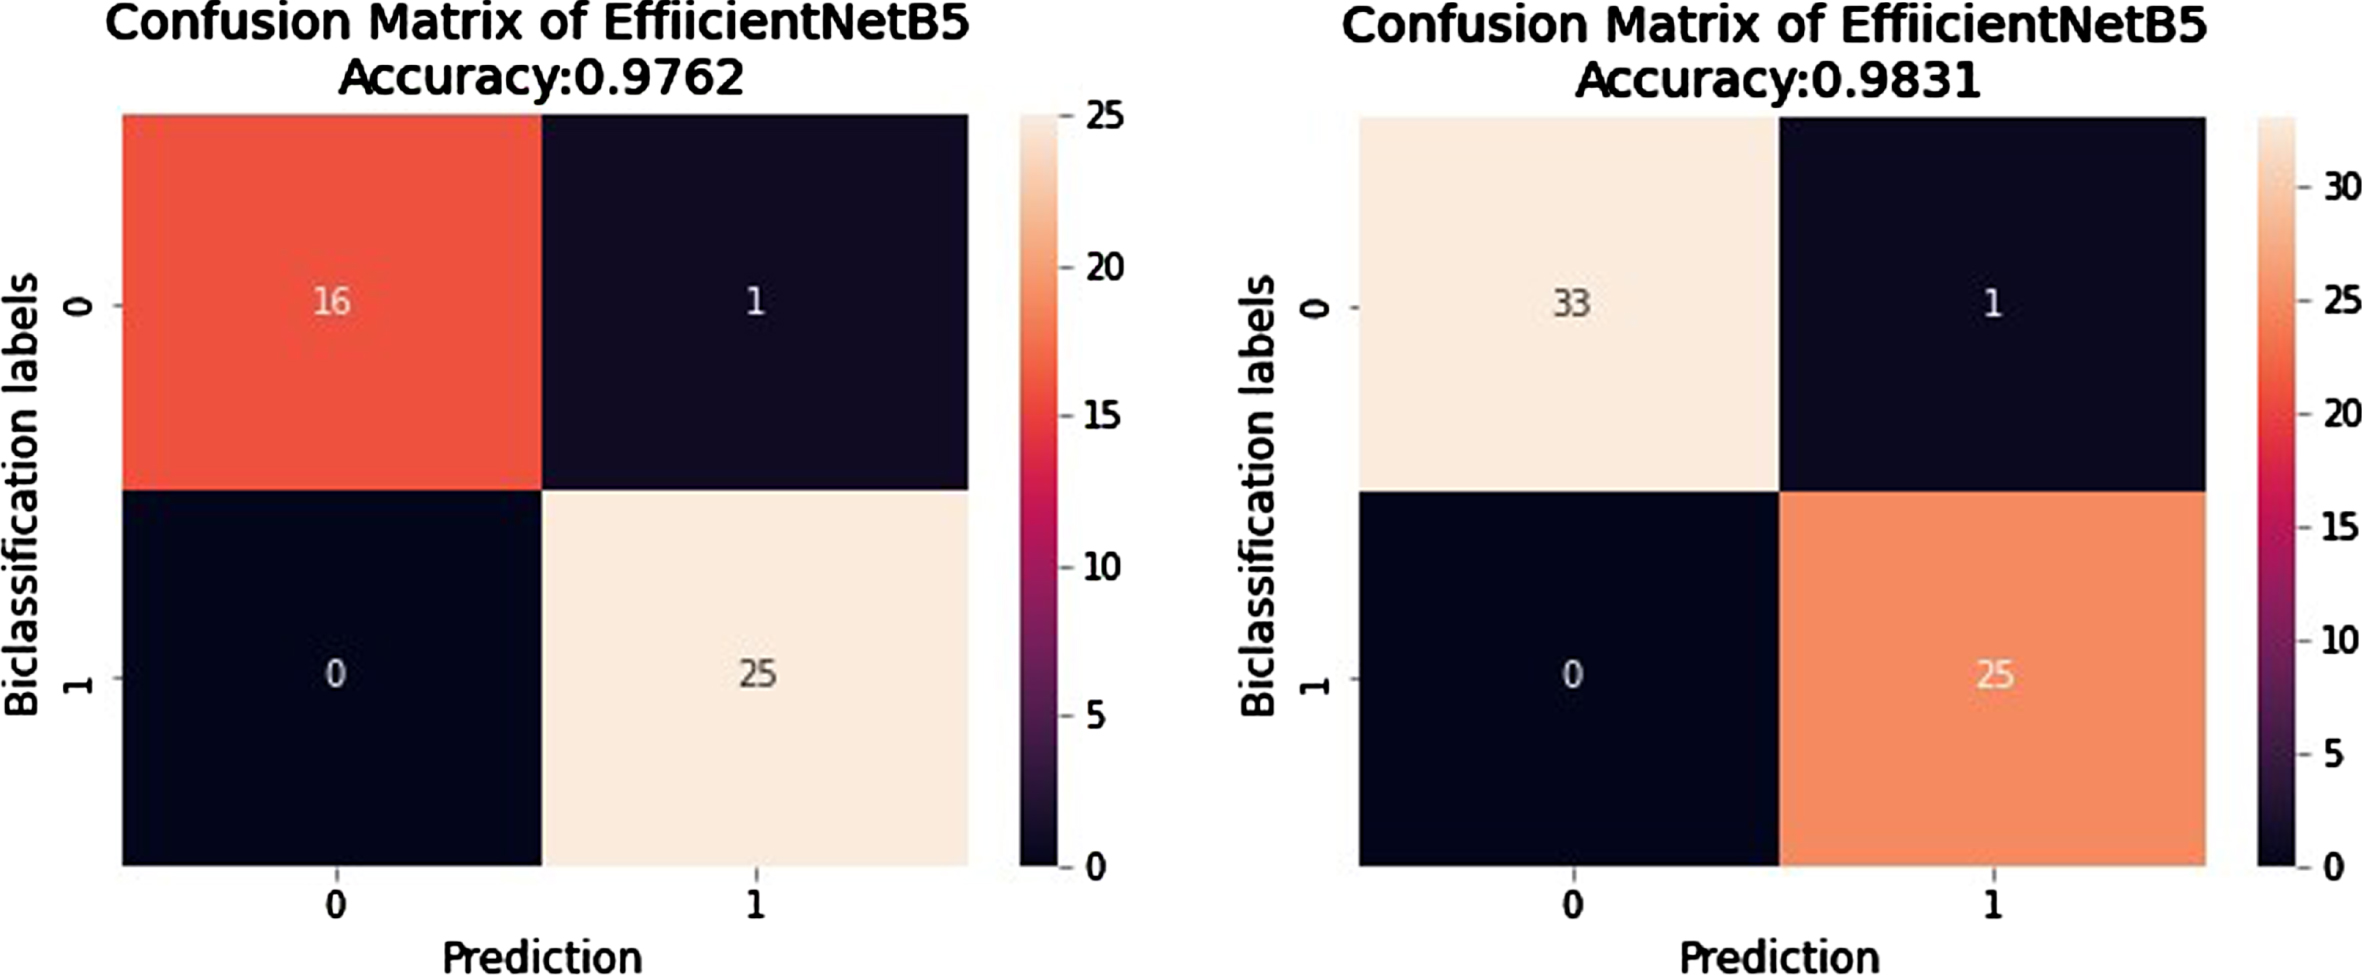
The internal and external validation of our proposed model is performed on three different sets of data which were not included in the training. Their prediction is represented in a confusion matrix in Figure 11 for internal validation, and Table 6 gives results in the form of performance metrics. Figure 12 shows results for external validation. EVD_1 shows an accuracy of 97.6% and an F1-score of 97.5%, whereas EVD_2 shows an accuracy of 98.3% and an F1-score of 98.2%.
Fig. 12
Confusion Matrix of predictions generated from EfficientNetB5 for External Validation.
5.1.2Graphical Localization
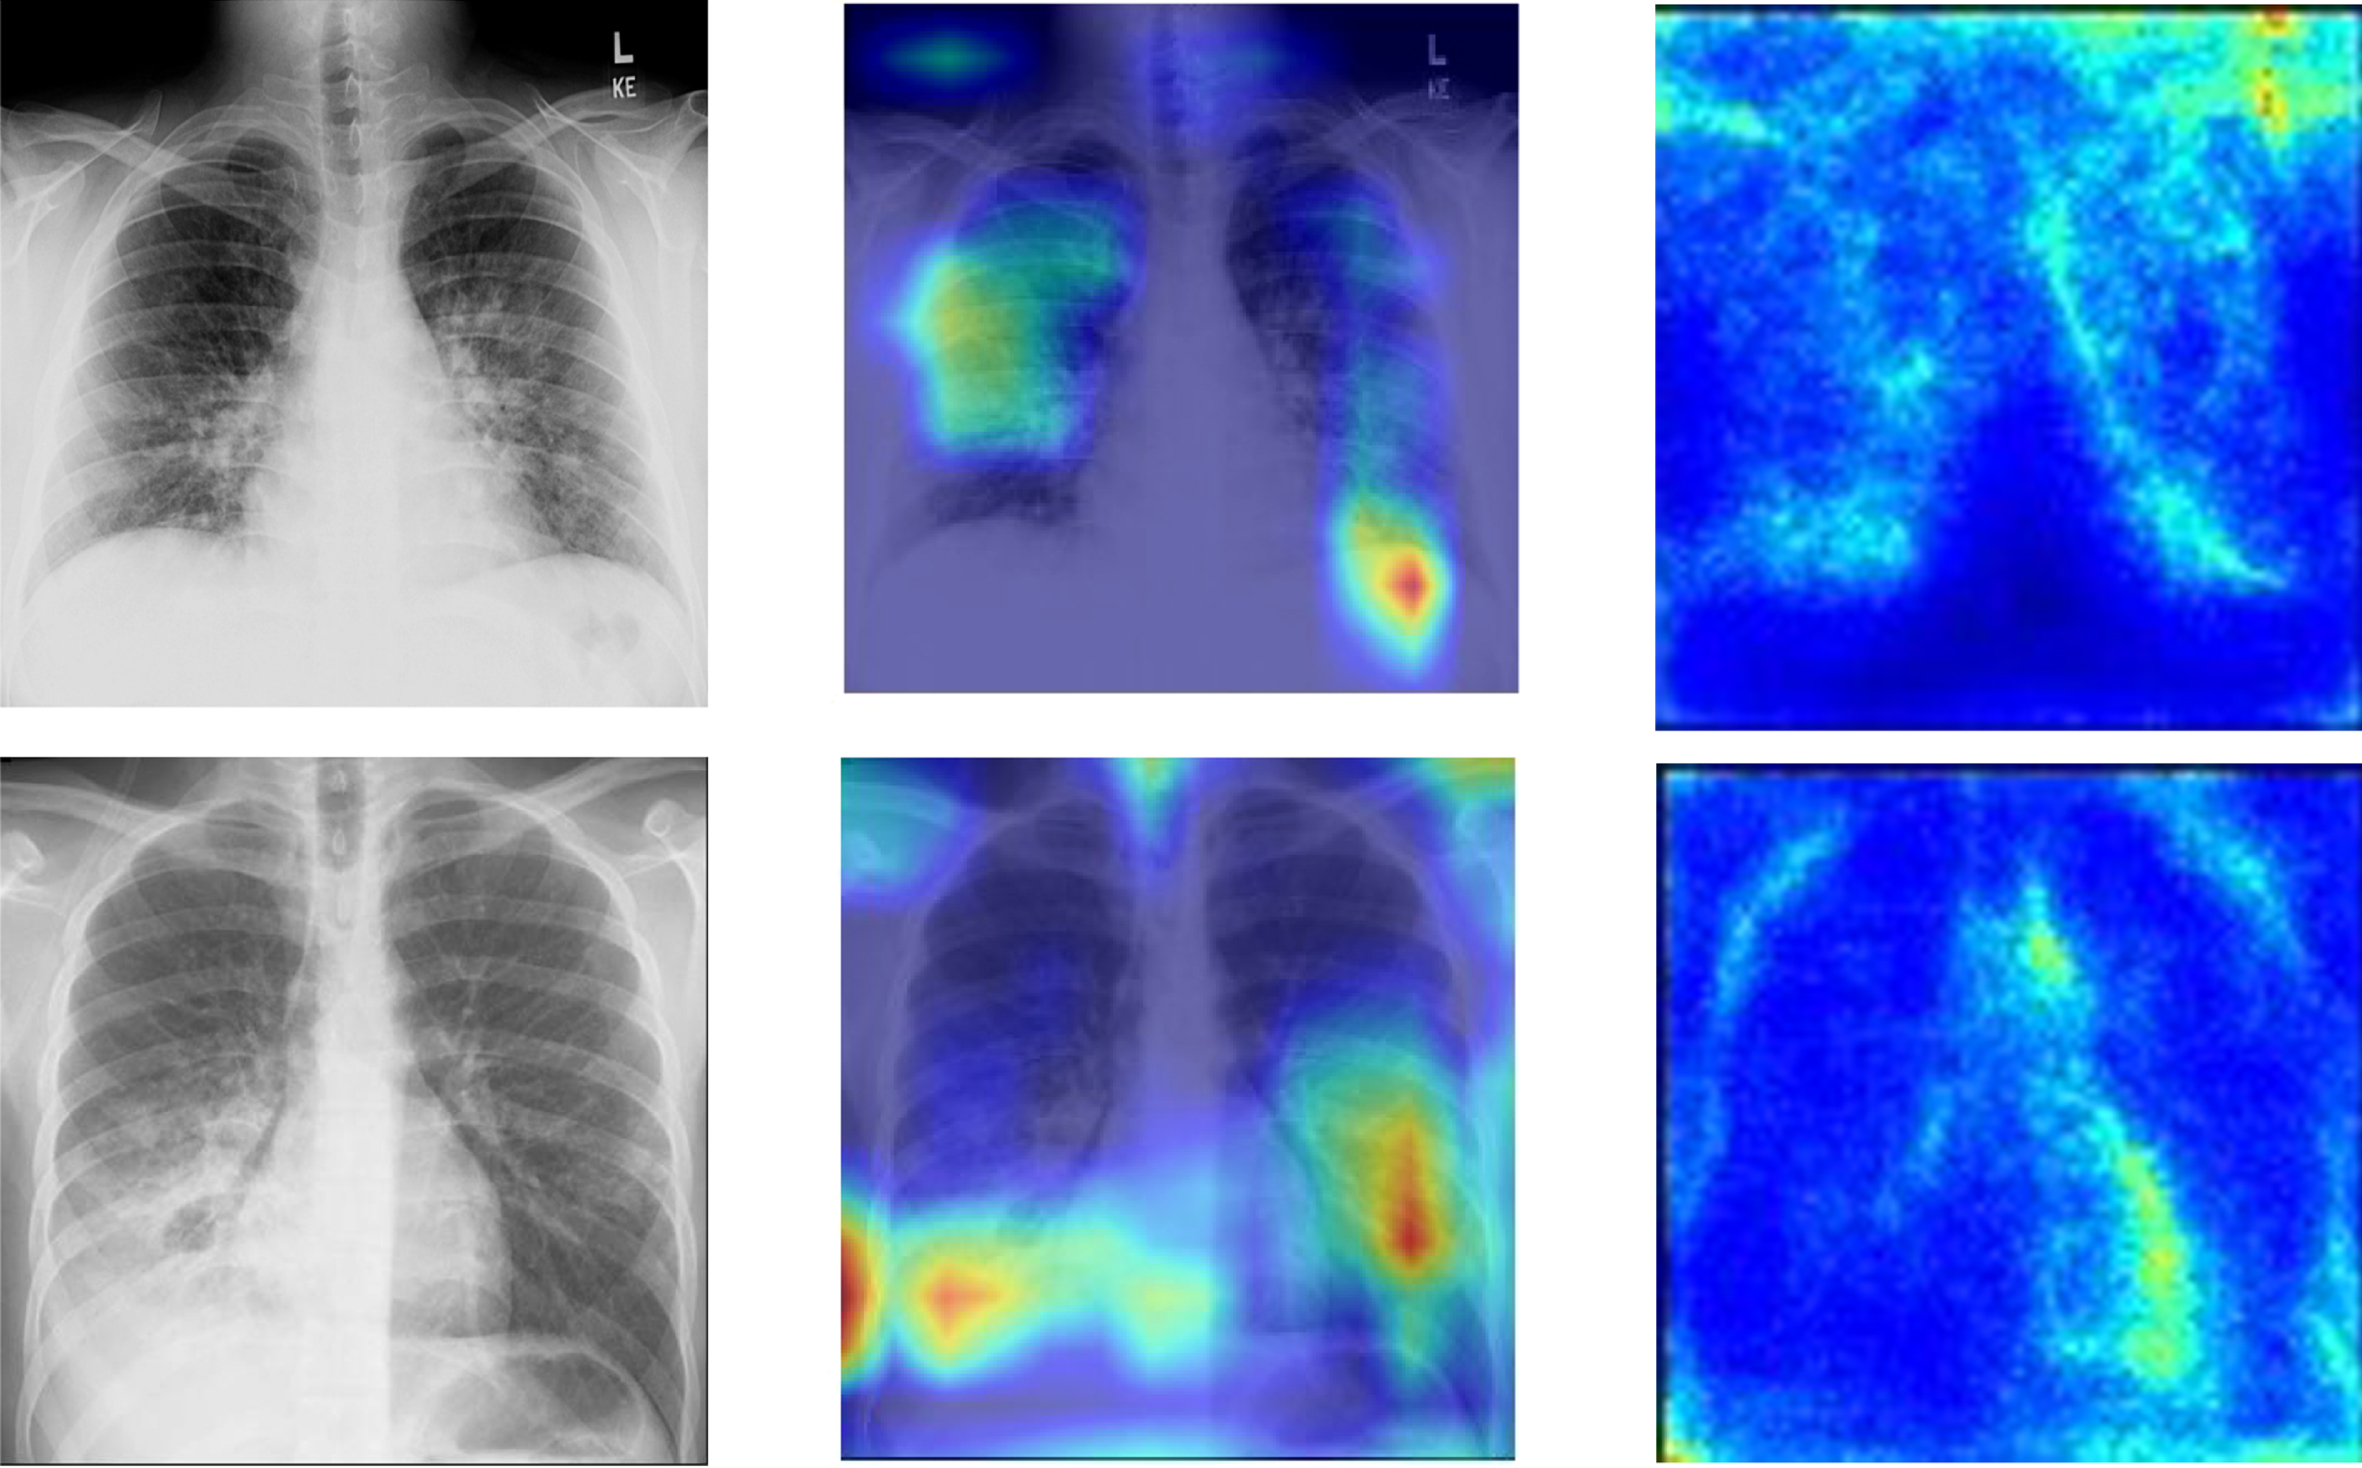
Grad-CAM localization is used in the proposed work; it uses the gradients of COVID-19 consolidations and passes on to the last convolution layer. The localization map is generated, which enhances and highlights the infected regions in the CXR image. Grad-CAM activation Maps offer a way to enhance the specific regions that can be learned from the trained parameters by highlighting the appropriate regions that can be used to predict the results [16]. In the procedure, the average value of all channels is also collected to attain the saliency maps. The final output is in visual form, presented in Figure 13. In the proposed bi-classification, features are extracted in a matrix form of both classes. The other class is evaluated with reference to the first class, and a final prediction is derived. The colors of the heat map show the specific area where high radiant colors indicate the most affected part.
Fig. 13
Graphical depiction of features extracted by network: Original CXR, Heat Map and Saliency Maps.
5.2Discussions
The EfficientNet and VGG models are used for all experiments. Achieving excellent efficiency in utilizing fewer resources is the main task of our research, the proposed Networks are trained on nine epochs, and two-fold cross-validation data-splitting method is used. All the results attained are graphically and numerically depicted in the experimental results mentioned in Section 5.1. Using the basic CNN architecture, the problem of vanishing gradient arises. Skip connection has resolved this problem in more complex versions of the Deep Learning Networks. Increasing the layers in the network leads to an increase in the parameters; hence higher computational resources are required, which automatically leads to an increase in cost. The prescribed EfficientNet model is a light weight model with low parameters and higher computational efficiency. In the case of a smaller dataset, common in medical imaging, a bigger network will create the problem of overfitting. The results in the prescribed fine-tuned algorithm show that all models achieve good efficiency in fewer resources, so improved EfficientNetB5 achieves an accuracy of 99.5% in 104s per epoch and Recall of 99.5%. These are excellent results at a reasonable cost. The reason behind the low statistic results of B6 and B7, as compared to B5, is the occurrence of aliasing [64]; as the number of parameters increases in B6 and B7 the network will start learning the unwanted information so that the accuracy will decrease and false prediction will increase. Further, the pre-trained VGG models compared with the proposed model; they give low accuracy and Recall compared to the improved EfficientNetB5 model.
The interpretability of the model is depicted using heat and saliency maps shown in Figure 13 of our professional network[53]. They will give a clear insight into predicted results. It can be observed in Figure 13 that our model has generated localized heat maps as per opacity present in the diseased Image. The consolidations are present on the lower lobes of the Image.
6Conclusion
The work in this article introduces the complex task of automated detection of COVID-19 from thorax x-ray images. The proposed tasks include collecting class annotated images of COVID-19 and Normal X-rays and generating a low-cost, fine-tuned deep learning-based detection algorithm using EfficientNetsB5. The reason behind generating an algorithm with a lightweight deep learning model is that it can efficiently work on handheld devices. It is a lightweight, highly efficient model that can collaborate with humans. The most significant feature of the model is the recall value of 0.9916, which is best per the author’s knowledge. The proposed technique will give deeper insight into all necessary formalities associated with COVID-19 identification through thorax x-ray. The procedure considers all the changes associated with CXR compared to normal CXR and generates the final decision. The developed model can detect COVID-19 with up to 99% accuracy. Detection of COVID-19 through x-ray is more beneficial as x-ray scanners are easily accessible even in remote areas. Secondly, radiation exposure in the x-ray is 70 times less than CT scan.
7Future Work
The algorithm presented in this paper can be innovated and used for detecting other diseases like tuberculosis and pneumonia on the same platform. The multiple-diseases identification on the same CXR image can also be a future task. The proposed work can be expanded and improved by adding annotated CXR images to the existing dataset and working on disease severity levels along identification. This research is fundamental in the present scenario and can help medical professionals handle this pandemic.
References
[1] | Ghebreyesus D.T.A. , WHO, 2021. |
[2] | Manigandan S. , Wu M.-T. , Ponnusamy V.K. , Raghavendra V.B. , Pugazhendhi A. and Brindhadevi K. , A systematic review on recent trends in transmission, diagnosis, prevention and imaging features of COVID-19, Process Biochemistry (2020). |
[3] | Duffy S. , Why are RNA virus mutation rates so damn high? PLoS Biology 16: (8) ((2018) ), 3000003. |
[4] | Pachetti M. , Marini B. , Benedetti F. , Giudici F. , Mauro E. , Storici P. , Masciovecchio C. , Angeletti S. , Ciccozzi M. , Gallo R.C. , et al., Emerging SARS-CoV-2 mutation hot spots include a novelRNA-dependent-RNA polymerase variant, Journal of Translational Medicine 18: ((2020) ), 1–9. |
[5] | Manigandan S. , Wu M.-T. , Ponnusamy V.K. , Raghavendra V.B. , Pugazhendhi A. and Brindhadevi K. , A systematic review on recent trends in transmission, diagnosis, prevention and imaging features ofCOVID-19, Process Biochemistry (2020). |
[6] | Islam N. , Salameh J.-P. , Leeflang M.M. , Hooft L. , Mc-Grath T.A. , Pol C.B. , Frank R.A. , Kazi S. , Prager R. , Hare S.S. , et al., Thoracic imaging tests for the diagnosis of COVID-19, Cochrane Database of Systematic Reviews 11: ((2020) ). |
[7] | Li Y. , Yao L. , Li J. , Chen L. , Song Y. , Cai Z. and Yang C. , Stability issues of RT-PCR testing of SARS-CoV-2 for hospitalized patients clinically diagnosed with COVID-19, Journal of Medical Virology (2020). |
[8] | Das K.M. , Lee E.Y. , Singh R. , Enani M.A. , Al Dossari K. , VanGorkom K. , Larsson S.G. and Langer R.D. , Follow-up chest radiographic findings in patients with MERS-CoV after recovery, Indian Journal of Radiology and Imaging 27: (03) ((2017) ), 342–349. |
[9] | Cascella M. , Rajnik M. , Aleem A. , Dulebohn S.C. and Di Napoli R. , Features, evaluation, and treatment of coronavirus (COVID-19), Statpearls [internet] (2022). |
[10] | Chan J.F.-W. , Kok K.-H. , Zhu Z. , Chu H. , To K.K.-W. , Yuan S. and Yuen K.-Y. , Genomic characterization of the novel human-pathogenic corona virus isolated from a patient with a typical pneumonia after visiting Wuhan, Emerging Microbes & Infections 9: (1) ((2020) ), 221–236. |
[11] | Ketai L. , Paul N.S. and Ka-tak T.W. , Radiology of severe acuterespiratory syndrome (SARS): the emerging pathologic-radiologiccorrelates of an emerging disease, Journal of Thoracic Imaging 21: (4) ((2006) ), 276–283. |
[12] | Song F. , Shi N. , Shan F. , Zhang Z. , Shen J. , Lu H. , Ling Y. , Jiang Y. and Shi Y. , Emerging 2019 novel coronavirus (2019-nCoV) pneumonia, Radiology (2020). |
[13] | Purohit K. , Kesarwani A. , Ranjan Kisku D. and Dalui M. , Covid-19 detection on chest x-ray and ct scan images using multi-image augmented deep learning model, in: Proceedings of the Seventh International Conference on Mathematics and Computing, Springer, (2022), pp. 395–413. |
[14] | Antonio G.E. , Wong K.T. , Tsui E.L. , Chan D.P. , Hui D.S. , Ng A.W. , Shing K.K. , Yuen E.H. , Chan J.C. and Ahuja A.T. , Chest radiograph scores as potential prognostic indicators in severe acute respiratory syndrome (SARS), American Journal of Roentgenology 184: (3) ((2005) ), 734–741. |
[15] | Ehab A. and Braga R.I. , The Clinical Significance of a –on Chest Radiology, European Journal of Case Reports in Internal Medicine 5: (12) ((2018) ). |
[16] | Selvaraju R.R. , Cogswell M. , Das A. , Vedantam R. , Parikh D. and Batra D. , Grad-cam: Visual explanations from deep networks via gradient-based localization, in: Proceedings of the IEEE international conference on computer vision, (2017), pp. 618–626. |
[17] | Shi F. , Wang J. , Shi J. , Wu Z. , Wang Q. , Tang Z. , He K. , Shi Y. and Shen D. , Reviewof artificial intelligence techniques in imaging data acquisition, segmentation and diagnosis for covid-19, IEEE reviews in biomedical engineering (2020). |
[18] | Kaggle Dataset. https://www.kaggle.com/. |
[19] | Hussain E. , Hasan M. , Rahman M.A. , Lee I. , Tamanna T. and Parvez M.Z. , CoroDet: A deep learning based classification for COVID-19 detection using chest X-ray images, Chaos, Solitons &Fractals 142: ((2021) ), 110495. |
[20] | Hussain E. , Hasan M. , Rahman M.A. , Lee I. , Tamanna T. and Parvez M.Z. , CoroDet: A deep learning based classification for COVID-19 detection using chest X-ray images, Chaos, Solitons &Fractals 142: ((2021) ), 110495. |
[21] | Zhao W. , Zhong Z. , Xie X. , Yu Q. and Liu J. , Relation between chest CT findings and clinical conditions of coronavirus disease (COVID-19) pneumonia: a multicenter study, American Journal of Roentgenology 214: (5) ((2020) ), 1072–1077. |
[22] | Yoon S.H. , Lee K.H. , Kim J.Y. , Lee Y.K. , Ko H. , Kim K.H. , Parkand C.M. and Kim Y.-H. , Chest radiographic and CT findings of the novelcoronavirus disease (COVID-19): analysis of nine patients treated inKorea, Korean Journal of Radiology 21: (4) ((2020) ), 494. |
[23] | Shyni H.M. and Chitra E. , A comparative study of x-ray and CT images in COVID-19 detection using image processing and deep learning techniques, Computer Methods and Programs in Biomedicine Update (2022), 100054. |
[24] | Ahishali M. , Degerli A. , Yamac M. , Kiranyaz S. , Chowdhury M.E. , Hameed K. , Hamid T. , Mazhar R. and Gabbouj M. , Advance warningmethodologies for covid-19 using chest x-ray images, IEEEAccess 9: ((2021) ), 41052–41065. |
[25] | Absar N. , Mamur B. , Mahmud A. , Emran T.B. , Khandaker M.U. , Faruque M. , Osman H. , Elzaki A. and Elkhader B.A. , Development of acomputer-aided tool for detection of COVID-19 pneumonia from CXR images using machine learning algorithm, Journal of Radiation Research and Applied Sciences 15: (1) ((2022) ), 32–43. |
[26] | Ieracitano C. , Mammone N. , Versaci M. , Varone G. , Ali A.-R. , Armentano A. , Calabrese G. , Ferrarelli A. , Turano L. , Tebala C. , et al., A fuzzy-enhanced deep learning approach for early detection of Covid-19 pneumonia from portable chest X ray images, Neurocomputing 481: ((2022) ), 202–215. |
[27] | Mahmud T. , Rahman M.A. and Fattah S.A. , CovXNet: A multi-dilation convolutional neural network for automatic COVID-19 and other pneumonia detection from chest X-ray images with transferable multi-receptive feature optimization, Computers in Biology and Medicine 122: ((2020) ), 103869. |
[28] | Liu J. , Qi J. , Chen W. and Nian Y. , Multi-branch fusion auxiliarylearning for the detection of pneumonia from chest Xray images, Computers in Biology and Medicine 147: ((2022) ), 105732. |
[29] | Gupta A. , Gupta S. , Katarya R. , et al., Insta CovNet-19: A deep learning classification model for the detection of COVID-19 patients using Chest X-ray, Applied Soft Computing 99: (2021), 106859. |
[30] | Ghoshal B. and Tucker A. , Estimating uncertainty and interpretability in deep learning for coronavirus (COVID-19) detection, arXiv preprint arXiv:2003.10769 (2020). |
[31] | Cohen J.P. , Morrison P. , Dao L. , Roth K. , Duong T.Q. and Ghassemi M. , Covid-19 image data collection: Prospective predictions are the future, arXiv preprint arXiv:2006.11988 (2020). |
[32] | Narin A. , Kaya C. and Pamuk Z. , Automatic detection of coronavirus disease (covid-19) using x-ray images and deep convolutional neural networks, arXiv preprint arXiv:2003.10849 (2020). |
[33] | Zhang J. , Xie Y. , Li Y. , Shen C. and Xia Y. , Covid-19 screening on chest x-ray images using deep learning based anomaly detection, arXiv preprint arXiv:2003.12338 (2020). |
[34] | Nayak S.R. , Nayak D.R. , Sinha U. , Arora V. and Pachori R.B. , Application of deep learning techniques for detection of COVID-19 cases using chest X-ray images: A comprehensive study, Biomedical Signal Processing and Control 64: ((2021) ), 102365. |
[35] | Aminu M. , Ahmad N.A. and Noor M.H.M. , Covid-19 detection via deep neural network and occlusion sensitivity maps, Alexandria Engineering Journal (2021). |
[36] | Ebenezer A.S. , Kanmani S.D. , Sivakumar M. and Priya S.J. , Effect of image transformation on Efficient Net model for COVID-19 CT image classification, Materials Today: Proceedings 51: ((2022) ), 2512–2519. |
[37] | Horry M.J. , Chakraborty S. , Paul M. , Ulhaq A. , Pradhan B. , Sahaand M. and Shukla N. , X-ray image based COVID-19 detection using pre-trained deep learning models (2020). |
[38] | Covid-19 Xray Images, 2021, (Accessed on 1/05/2021). |
[39] | Winther H. , Laser H. , Gerbel S. , Maschke S. , Hinrichs J. , Vogel-Claussen J. , Wacker F. , Hoper M. and Meyer B. , COVID-19 image repository, Figshare (Dataset) (2020). |
[40] | Buslaev A. , Iglovikov V.I. , Khvedchenya E. , Parinov A. , Druzhininand M. and Kalinin A.A. , Albumentations: fast and flexible image augmentations, Information 11: (2) ((2020) ), 125. |
[41] | Jung A.B. , Wada K. , Crall J. , Tanaka S. , Graving J. , Reinders C. , Yadav S. , Banerjee J. , Vecsei G. , Kraft A. , Rui Z. , Borovec J. , Vallentin C. , Zhydenko S. , Pfeiffer K. , Cook B. , Fernandez I. , DeRainville F.-M. , Weng C.-H. , Ayala-Acevedo A. , Meudec R. , Laporte M. , et al., imgaug, 2020, Online; accessed 01-Feb-2020. |
[42] | Buslaev A. , Iglovikov V.I. , Khvedchenya E. , Parinov A. , Druzhininand M. and Kalinin A.A. , Albumentations: fast and flexible image augmentations, Information 11: (2) ((2020) ), 125. |
[43] | Bloice M.D. , Stocker C. and Holzinger A. , Augmentor: an image augmentation library for machine learning, arXiv preprint arXiv:1708.04680 (2017). |
[44] | Zhang H. , Liang W. , Li C. , Xiong Q. , Shi H. , Hu L. and Li G. , DCML: Deep contrastive mutual learning for COVID-19 recognition, Biomedical Signal Processing and Control 77: ((2022) ), 103770. |
[45] | Berrar D. , Cross-Validation., 2019. |
[46] | Swati Z.N.K. , Zhao Q. , Kabir M. , Ali F. , Ali Z. , Ahmed S. and Lu J. , Brain tumor classification for MR images using transfer learning andfine-tuning, Computerized Medical Imaging and Graphics 75: ((2019) ), 34–46. |
[47] | Guang J. and Xi Z. , ECAENet: EfficientNet with efficient channel attention for plant species recognition, Journal of Intelligent & Fuzzy Systems (2022), 1–13. |
[48] | Tan M. and Le Q. , Efficientnet: Rethinking model scaling for convolutional neural networks, in: International Conference on Machine Learning, PMLR, (2019), pp. 6105–6114. |
[49] | Agarwal V. , Complete Architectural Details of all EfficientNet Models, Towards Data Science, 2020. https://towardsdatascience.com/. |
[50] | Zhang Z. , Improved adam optimizer for deep neural networks, in: 2018 IEEE/ACM 26th International Symposium on Quality of Service (IWQoS), IEEE, (2018), pp. 1–2. |
[51] | Ahmad F. , Khan M.U.G. and Javed K. , Deep learning model for distinguishing novel coronavirus from other chest related infections in X-ray images, Computers in Biology and Medicine 134: (2021), 104401. |
[52] | Powers D.M. , Evaluation: from precision, recall and F-measure to ROC, informedness, markedness and correlation, arXiv preprint arXiv:2010.16061 (2020). |
[53] | Selvaraju R.R. , Cogswell M. , Das A. , Vedantam R. , Parikh D. and Batra D. , Grad-cam: Visual explanations from deep networks via gradient-based localization, in: Proceedings of the IEEE International Conference on Computer Vision, (2017), pp. 618–626. |
[54] | Valiuddin M. , Using the EfficientNet convolutional neural network architecture for skin lesion analysis and Melanoma detection. |
[55] | Suphalakshmi A. , Ahilan A. , Jeyam A. and Subramanian M. , Cervical cancer classification using efficient net and fuzzy extreme learning machine, Journal of Intelligent & Fuzzy Systems, 1–10. |
[56] | Ahmad F. , Khan M.U.G. and Javed K. , Deep learning model for distinguishing novel coronavirus from other chest related infections in X-ray images, Computers in Biology and Medicine 134: (2021), 104401. |
[57] | Al-Waisy A.S. , Al-Fahdawi S. , Mohammed M.A. , Abdulkareem K.H. , Mostafa S.A. , Maashi M.S. , Arif M. and Garcia-Zapirain B. , COVID-CheXNet: hybrid deep learning framework for identifying COVID-19 virus in chest X-rays images, Soft Computing (2020), 1–16. |
[58] | Elzeki O.M. , Shams M. , Sarhan S. , Abd Elfattah M. and Hassanien A.E. , COVID-19: a new deep learning computeraided model for classification, PeerJ Computer Science 7: ((2021) ), 358. |
[59] | Panwar H. , Gupta P. , Siddiqui M.K. , Morales-Menendez R. and Singh V. , Application of deep learning for fast detection of COVID-19 in X-Rays using nCOVnet, Chaos, Solitons & Fractals 138: (2020), 109944. |
[60] | Sethi R. , Mehrotra M. and Sethi D. , Deep learning based diagnosis recommendation for COVID-19 using chest x- rays images, in: 2020 Second International Conference on Inventive Research in Computing Applications (ICIRCA), IEEE, (2020), pp. 1–4. |
[61] | Hall L.O. , Paul R. , Goldgof D.B. and Goldgof G.M. , Finding covid-19 from chest x-rays using deep learning on a small dataset, arXiv preprint arXiv:2004.02060 (2020). |
[62] | Hirano H. , Koga K. and Takemoto K. , Vulnerability of deep neural networks for detecting covid-19 cases from chest xray images touniversal adversarial attacks, Plos One 15: (12) ((2020) ), 0243963. |
[63] | Zebin T. and Rezvy S. , COVID-19 detection and disease progression visualization: Deep learning on chest X-rays for classification and coarse localization, Applied Intelligence 51: (2) ((2021) ), 1010–1021. |
[64] | Nahas H. , Au J.S. , Ishii T. , Yiu B.Y. , Chee A.J. and Alfred C. , A deep learning approach to resolve aliasing artifacts in ultrasound color flow imaging, IEEE Transactions on Ultrasonics, Ferroelectrics, and Frequency Control 67: (12) ((2020) ), 2615–2628. |


