
Airline flight delays using artificial intelligence in COVID-19 with perspective analytics
Abstract
This study envisages assessing the effects of the COVID-19 on the on-time performance of US-airlines industry in the disrupted situations. The deep learning techniques used are neural network regression, decision forest regression, boosted decision tree regression and multi class logistic regression. The best technique is identified. In the perspective data analytics, it is suggested what the airlines should do for the on-time performance in the disrupted situation. The performances of all the methods are satisfactory. The coefficient of determination for the neural network regression is 0.86 and for decision forest regression is 0.85, respectively. The coefficient of determination for the boosted decision tree is 0.870984. Thus boosted decision tree regression is better. Multi class logistic regression gives an overall accuracy and precision of 98.4%. Recalling/remembering performance is 99%. Thus multi class logistic regression is the best model for prediction of flight delays in the COVID-19. The confusion matrix for the multi class logistic regression shows that 87.2% flights actually not delayed are predicted not delayed. The flights actually not delayed but wrongly predicted delayed are12.7%. The strength of relation with departure delay, carrier delay, late aircraft delay, weather delay and NAS delay, are 94%, 53%, 35%, 21%, and 14%, respectively. There is a weak negative relation (almost unrelated) with the air time and arrival delay. Security delay and arrival delay are also almost unrelated with strength of 1% relationship. Based on these diagnostic analytics, it is recommended as perspective to take due care reducing departure delay, carrier delay, Late aircraft delay, weather delay and Nas delay, respectively, considerably with effect of 94%, 53%, 35%, 21%, and 14% in disrupted situations. The proposed models have MAE of 2% for Neural Network Regression, Decision Forest Regression, Boosted Decision Tree Regression, respectively, and, RMSE approximately, 11%, 12%, 11%, respectively.
1Introduction
COVID 19 has drastically affected every walk of life. The air transportation infrastructure is no exception. Numerous regions adopted travel restrictions initiatives in response to the pandemic situation arising from the spread of corona disease 2019 (COVID-19), which was caused by the extreme acute respiratory syndrome coronavirus 2 (SARS-CoV-2). This affected both domestic and international traveling across the world [1]. After imposing a preliminary initiative constraining the northern territory of Lodi on February 21st 2020, Italy became the first country to impose a nationwide lockdown on March 9th 2020, [2]. On March 11th, 2020, two days after Italy announced its lockdown, the US barred non-US travelers from entering the country who had visited China, Iran, or any of the EU’s 26 member states. On March 16th, 2020, the restriction was expanded to non-US visitors who had toured the Great Britain and Ireland [1]. Later on, the EU formally sealed the borders for all its member nations to almost all non-EU citizens. The US State department released a Level 4 Global Health Travel Advisory on March 19, 2020, cautioning all US people against foreign travel. Such devastating series of incidents becomes the thread in opposition to the air transportation industry forced to gradually put itself into a semi-comatose state in order to overcome the rapidly rising hygienic and economic issues [3].
The information from the Customs and Border Protection (CBP) website’s “Airport Wait Times,” depicts the passengers’ arrival at US immigration through entrance via all the airports [4]. Monmousseau et al., [5] presents a comprehensive overview of the accessible CBP dataset, as well as a study of the wait times at the US airport immigration facilities from Jan 2013 to Jan 2019.
The air transportation infrastructure is critical to comprehend and research in pandemic circumstances from different viewpoints, such as disease transmission within planes [6], outbreak transmission through flights [7], and the impact of travel bans on airline business [8]. The impact of the outbreak on traveller attitudes against airlines remained the main subject of the studies throughout the pandemic circumstances. Throughout 2019, people on twitter mentioned thirty-four main US airports services in a median of 13,255 tweets referring an airport and 295,904 tweets discussing an airline, suggesting the need for better flights and airports services.
Flight bans and other initiatives implemented by the number of countries around the world are having a massive effect on the airline industry. The data collected by US Department of Bureau of Transportation Statistics depicts the several foreign and domestic flights affected during March 1st to April 22nd 2020, based on BTS and CBP statistics since June 24th 2020. The daily internal flights declines by 50% in the second half of March 2020, according to the dataset. Although not technically sleeping, numerous flights continued to be operated by airlines for fear of losing their slots [9] or because they needed to keep operating routes with intention of obtaining financial help [10], a circumstance that were similar to a sleep disorder known as “nightmare”.
The uncertainty in the COVID-19 situations makes it difficult to predict the real future of air travel. Truong [11] developed neural network models for predicting international and domestic travel based on daily travel by distance, economic status, COVID-19 situation, and travel bans. The study concluded that weekly economic index (WEI) contribute more to air travel. Distance played important role in domestic and international travel. Travel bans affected both the international and domestic air travel. Moreover, air travel will takes years to back to normal, even after the restoration of the economy from the jerks of COVID-19.
This study is organized as follows. After the introduction the problem statement is presented in section 2. Related studies are presented in section 3. In section 4 research gap is highlighted. In section 5 theoretical frameworks is presented. Section 6 provides information about the dataset and factors. Formulation of the problem is presented in section 7. Results and discussion are in section 8. Responses to hypothesis are recorded in section 9 and the study concluded in section 10.
2Problem statement
Critical analysis is required to know the affect of COVID 19 on the air transportation. It is required to know the effect on important issues, such as disease transmission within planes, transmission through flight, and the impact of travel bans on overall airline industry. Although, flight bans are required for controlling the spread of the COVID 19, they drastically affect the airline industry business. Due to COVID 19 a large amount of flight schedule disruption have been reported. The result is in the form of negative affect on the on-time performances of the airlines with long flight delays. Whereas the passengers are increasingly becoming services quality sensitive; the drastic change in the airline schedule with long flight delays negatively affect the airline good name, passenger satisfaction, time and money. However, since the flight ban has been strictly implemented, a common query is to know how much the flight is delayed? One possible answer is indefinite time delay or can’t say anything, but such a response is going to create more curiosity and confusion among the passengers. Moreover, a response of such type sounds low while living in a modern advanced era. Thus, it is needed to predict correctly how much the flight is delayed in the disruption situations? Furthermore, the accuracy and reliability of the prediction is inevitably important in pandemic situations. It is required to choose proper, correct, reliable and accurate method of prediction in such disrupted situations. It is reported that the modern techniques of the artificial intelligence and machine learning possess extraordinary prediction capabilities. Thus in this research the techniques of artificial intelligence and machine learning are utilized for prediction of flight delays in the COVID 19 pandemic situations.
Due to the outbreak of the COVID 19, many flights were delayed causing a major disruption in the flight traffic control. To predict the correct status of the flight is important information for an airline business and better passenger service in the pandemic situation. This knowledge can save time, money, energy and result in better passenger service. It is reported that artificial intelligence and machine learning techniques have tremendous prediction capabilities. Thus the problem of the proposed research problem is “How to exploit the prediction capabilities of the artificial intelligence and machine learning techniques for predicting flight delays in COVID-19 pandemic situations?” The proposed research has the following objectives.
1. To study the pandemic effect on the flight delays with the help of the modern AI tools.
2. To use neural network regression, decision forest regression, boosted decision tree regression and multiclass logistic regression for predicting flight delay in COVID-19 pandemic situation.
3. To perform feature-target correlations for identifying most important feature contributing to flight delays in pandemic situation.
The inputs-target correlation is computed to response to the following hypothesis following Seok et al., [12].
H1: The departure delay of the flight is directly related to the arrival delay in the COVID 19 situations.
H2: The air time of the flight has a positive relationship to the arrival delay in the COVID 19 situations.
H3: The carrier delay of the flight is directly related to the arrival delay in the COVID 19 situations.
H4: The weather delay of the flight has a positive relationship to the arrival delay in the COVID 19 situations.
H5: The NAS delay of the flight is directly related to the arrival delay in the COVID 19 situations.
H6: The security delay of the flight has a positive relation to the arrival delay in the COVID 19 situations.
H7: The late aircraft delay of the flight is positively related to the arrival delay in the COVID 19 situations.
3Related studies
Airline flight delays in normal situations have been previously addressed by studies, however, it has not been properly addressed in the COVID 19 pandemic situations. In the normal situation the flight delay / cancellation can help provide important information for decision making for airlines, airports, and air traffic control. It can be an early information to airline customers so that they can reschedule the itinerary beforehand. The advance rescheduling can reduce the loss of time, money and service. It is reported that flight delays and cancellations have socio-economic and environmental effects [13, 14]. Zhixing et al., [15] concluded that flight network characteristics, resilience and flight delays are directly and indirectly related to each other. Wang et al., [16] used structural properties of network to reduce flight delays and compared the network structure of USA and China. They used the data from 1 August 2012 to 31 August 2013 with 196 airports. Zhou et al., [17] analyzed the impact of flight delays using the data of flight arrivals and departures in China from December 1st to 31st 2000.
Predicting the flight delays and cancellations had been the main theme of various major studies in the past [18–21]. In [22], machine learning based regression was used for flight delays hours ahead of the flight operation. The flight delay states and flight schedule information was taken as input features to the regression model. The authors showed that the on-time performance was largely effected by the delay states of the flight. Ding [23] used multiple linear regression model for prediction of airline flight delays with 79.1 % accuracy. Kenan et al., [24] addressed to reduce flight delays with optional flights. Gui et al., [25] recommended random forest technique for flight delay prediction with 90.2% accuracy. Lambelho et al., [26] used LightGBM, Multilayer Perceptron, and Random Forests for flight delays and cancellations in Heathrow airport. They used the method of binary classification. Stefanovi¡c et al., [27] predicted deviation from the scheduled flight time using machine learning for lithuanian airports. Yazdi et al., [28] used Levenberg-Marquart technique for predicting flight delays.
Disease transmission in planes and outbreak spreading with flights become the bases of flight bans and air transport. Baspinar and Koyuncu [29] addressed the issue of flight delays caused by spread of epidemic. The authors studied two different epidemic models, one was flight-based model, whereas, the second was airport-based model. The authors considered data form 10 busiest airports in Europe to study the spread of infection in air traffic between 13:30 to 16:30 on June 02, 2015. Nowzari [30] commented on the spread of epidemic in a network. Perotti et al., [31] observed that network sparsity (Low interaction time), slowdown the Suspectable-Infectous SI spread of disease. Mou et al., [32] pointed that the temporal sparsity (inter-event interaction time) and the time of flight slow down the infection transmission rate. They used the data of 1,627 airline routes with14,268 flights for 2014 of Chinese Aviation Network. Bussell et al., [33] utilized control theory strategies to control the spreading of informed humans, plants and animals diseases. They addressed the disease management strategies, to practically control the transmission of infectious diseases. Alamo et al., [34], used a 3M strategy, Monitor, Model and Manage to control COVID 19 transmission. Li et al., [35] studied delay propagation model using an integrated airport-based Susceptible-Infected-Recovered-Susceptible (ASIRS) epidemic model. They used the flight data of the Civil Aviation Administration of China (CAAC) from June to December in 2015 with 93630 flights.
4Gaps in the literature
Alla et al., [36] used multilayer perceptron neural network for predicting flight arrival delay of the American airlines. The data used by the authors was for the American airlines for the time space between 1st of January to the 31st of December 2018 with total of 760000 flights. In our proposed model the flight delay and cancellation data will be from January 2020 to Jun 2020, with 2745847 flights, covering the time span of the advent of COVID-19 pandemic. Thus there is a promising population gap. Secondly, our data pertains to the advent of COVID 19. Moreover, the study [36] considers only 10 input features to predict flight delay. In our proposed model we focus on more important numerical features. Thus there are promising methodological, evidence, empirical, population and practical knowledge types of gaps with [36]. Zeng et al., [37] simulate data from 325 airports in the United States from 2015 to 2018, portraying the situation before the advent of COVID-19 situation. This motivates there are promising methodological, evidence, empirical, population and practical knowledge types of gaps with [37]. Niu et al., [38] used control theory approach for flight delays in complex airline networks. Thus there are promising methodological, evidence, empirical, population and practical knowledge types of gaps with [38]. Zoutendijk and Mitici [39] used machine learning to reduce the flight delay at Rotterdam The Hague Airport (RTM) between 1 January 2017 and 29 February 2020. A total of 17,365 departing and 17,336 arriving flights were taken into consideration. Because in [39] only one airport with approximately 17365 flights were considered, whereas, the current model will consider 2745847 flights information, depicting promising methodological, evidence, empirical, population and practical knowledge types of gaps with [39]. Bandyopadhyah et al., [40] utilized the data of January 2019 to train a flight cancellation model and test it with the data of January 2020. The proposed study possess promising methodological, evidence, empirical, population and practical knowledge types of gaps with [40]. Thus we can refine the research gap easily from these studies. The research gaps with renowned studies are refined and presented in Table 1. From a through literature review, we come to know that no model has been trained for flight delay prediction in the COVID 19 disruption situation. Thus the proposed study envisages to train and test AI based prediction models for airline flight delay prediction in the COVID 19 disruption situation.
Table 1
Identification of the gaps and its types
| Research | Population used / population quantity | Method used | Unit of analysis | Variable predicted | Type of gap |
| Proposed Research | January 2020 to Jun 2020 | Neural Network Regression | US domestic airline industry | Flight Delay | self |
| 2745847 Flight data | Decision Forest Regression | ||||
| Boosted Decision Tree Regression | |||||
| Multi Class Logistic Regression | |||||
| Alla et al., [36] | 1st of January 2018 to the 31st | Perceptron Neural Network | US Airline Industry | Flight Arrival Delay | Methodological Gap (New Methods) |
| of December 2018 | Evidence Gap as it was before COVID. | ||||
| 760000 flights | Empirical Gap (New Experiments on new predictors) | ||||
| Population Gap (Big Population with COVID) | |||||
| Practical Knowledge Gap (Impact of COVID 19) | |||||
| Zeng et al., [37] | 2015 to 2018 | Deep-Graph LSTM | US Airports | Airport Delay | Methodological Gap (New Methods) |
| 325 Airports | Evidence Gap as it was before COVID. | ||||
| Empirical Gap (New Experiments on new predictors) | |||||
| Population Gap (Big Population with COVID) | |||||
| Practical Knowledge Gap (Impact of COVID 19) | |||||
| Niu et al., [38] | 13 US Passenger Airlines in 2015 | State Space of the Control Theory | US Domestic Passenger Airlines | Arrival Delay | Methodological Gap (New Methods)Evidence Gap as it was before COVID.Empirical Gap (New Experiments on new predictors)Population Gap (Big Population with COVID)Practical Knowledge Gap (Impact of COVID 19) |
| Zoutendijk and Mitici [39] | 1 January 2017 and 29 February 2020.17,365 departing and 17,336 arriving flights | Mixture Density NetworkRandom Forest Regression | Rotterdam The Hague Airport (RTM), Netherlands. | Flight Delay Prediction | Methodological Gap (New Methods)Evidence Gap as it was before COVID.Empirical Gap (New Experiments on new one predictor)Population Gap (Big Population with COVID)Practical Knowledge Gap (Impact of COVID 19) |
| Bandyopadhyah et al.,[40] | January 2019 for Training.January 2020 for Testing.1191331 Flights | Long-short term memory (LSTM) Gated Recurrent Unit (GRU) | US Airlines Industry | Flight Cancellation | Methodological Gap (New Methods)Evidence Gap as Bandyopadhyah et al., (2020) was just at the start of COVID.Empirical Gap (New Experiments on Flight Delays)Population Gap (Big Population with COVID)Practical Knowledge Gap (Impact of COVID 19) |
The Table 1 summaries that with most of the renowned research, the proposed study have methodological, evidence, empirical, population and practical knowledge types of gaps. Thus there exist promising gap to work on the proposed research study.
5Theoretical framework
Airline service quality and schedule disruption are major factors affecting the airline business. Studies have demonstrated that airline capacity reductions disproportionately affect passengers, emphasizing the discrepancies between quantifying aircraft delays and cancellations and evaluating the real passenger delay [41–44]. According to statistics from a prominent US airline, disrupted passengers, whose routes were disrupted due to a capacity drop, account for just 3% of overall passengers, but account for 39% of entire passenger inconvenience.
The inclusions of passenger-centric strategies were advocated in USA [45] and Europe [46] when assessing the air transportation mechanism. Cook et al., [47] made the first effort at incorporating passenger-oriented metrics. The ideas of Multimodal, Efficient Transportation in Airports and Collaborative Decision Making (META-CDM) were established to include passenger interests in airport procedure of decision making [48–50]. Despite the fact that these efforts offer passengers a prominent role, they nonetheless rely significantly on flight-centric data and hence suffer from the same latency limitations. After multiple years, the desired move from flight-centric to passenger-centric metrics has yet to be adopted by regulatory authorities. EUROCONTROL and the FAA offered timeliness indicators that combined airline and passenger perspectives into a unified picture (EUROCONTROL and FAA [51]). Lemer [52] called for integrated airport efficiency indicators which would address the needs of travelers, airlines, and airports, as well as the demands of many other players (such as restaurants or governments). Many experiments have been conducted to better understand the travel experience or at minimum the passenger expectation of aviation and airline efficiency. Tsaur et al., [53] suggested fuzzy theory to conduct surveys to assess airline service efficiency. Hunter [54] conducted a comprehensive survey of aviation perception studies from 1995 to 2006, highlighting the decline in customer support across the airlines sector. De-Oña and De-Oña [55] performed a study of survey-based research of public transit system for more detailed information. They concluded that while researchers continue to attempt to boost the sophistication of models in order to better predict customer comfort in public transportation, management and practitioners use simplified models to achieve their target of maximizing passenger perceived service efficiency in exchange for money. Passenger assessments undertaken for airports or airlines, indeed very comprehensive, remained restricted to very specific samples of passengers and brief time span, and may not be representative. Tsaur et al., [53], for instance, has a sampling data of 211 passengers, while Pakdil and Aydın [56] has a sampling set of 385 passengers in their survey studies. They are often costly and time-consuming to introduce, rendering their usage for assessing the impact of significant perturbations on the air transportation environment, such as the COVID-19 disease outbreak, inefficient and challenging to update.
The widespread availability of smartphones has made it simpler to measure the performance of the air transport industry utilizing passenger-generated information. Passenger behavior at airports [57, 58] and transit stations [59] is studied using information from Wi-Fi hotspots and Bluetooth beacons, along with historical data. Information created by passengers’ smart phones and obtained by phone carriers, if appropriate, can be used to evaluate passengers’ door-to-door activity under both nominal and deteriorated circumstances [60–62]. From this literature it is clear that the airline passengers are increasingly becoming service quality sensitive.
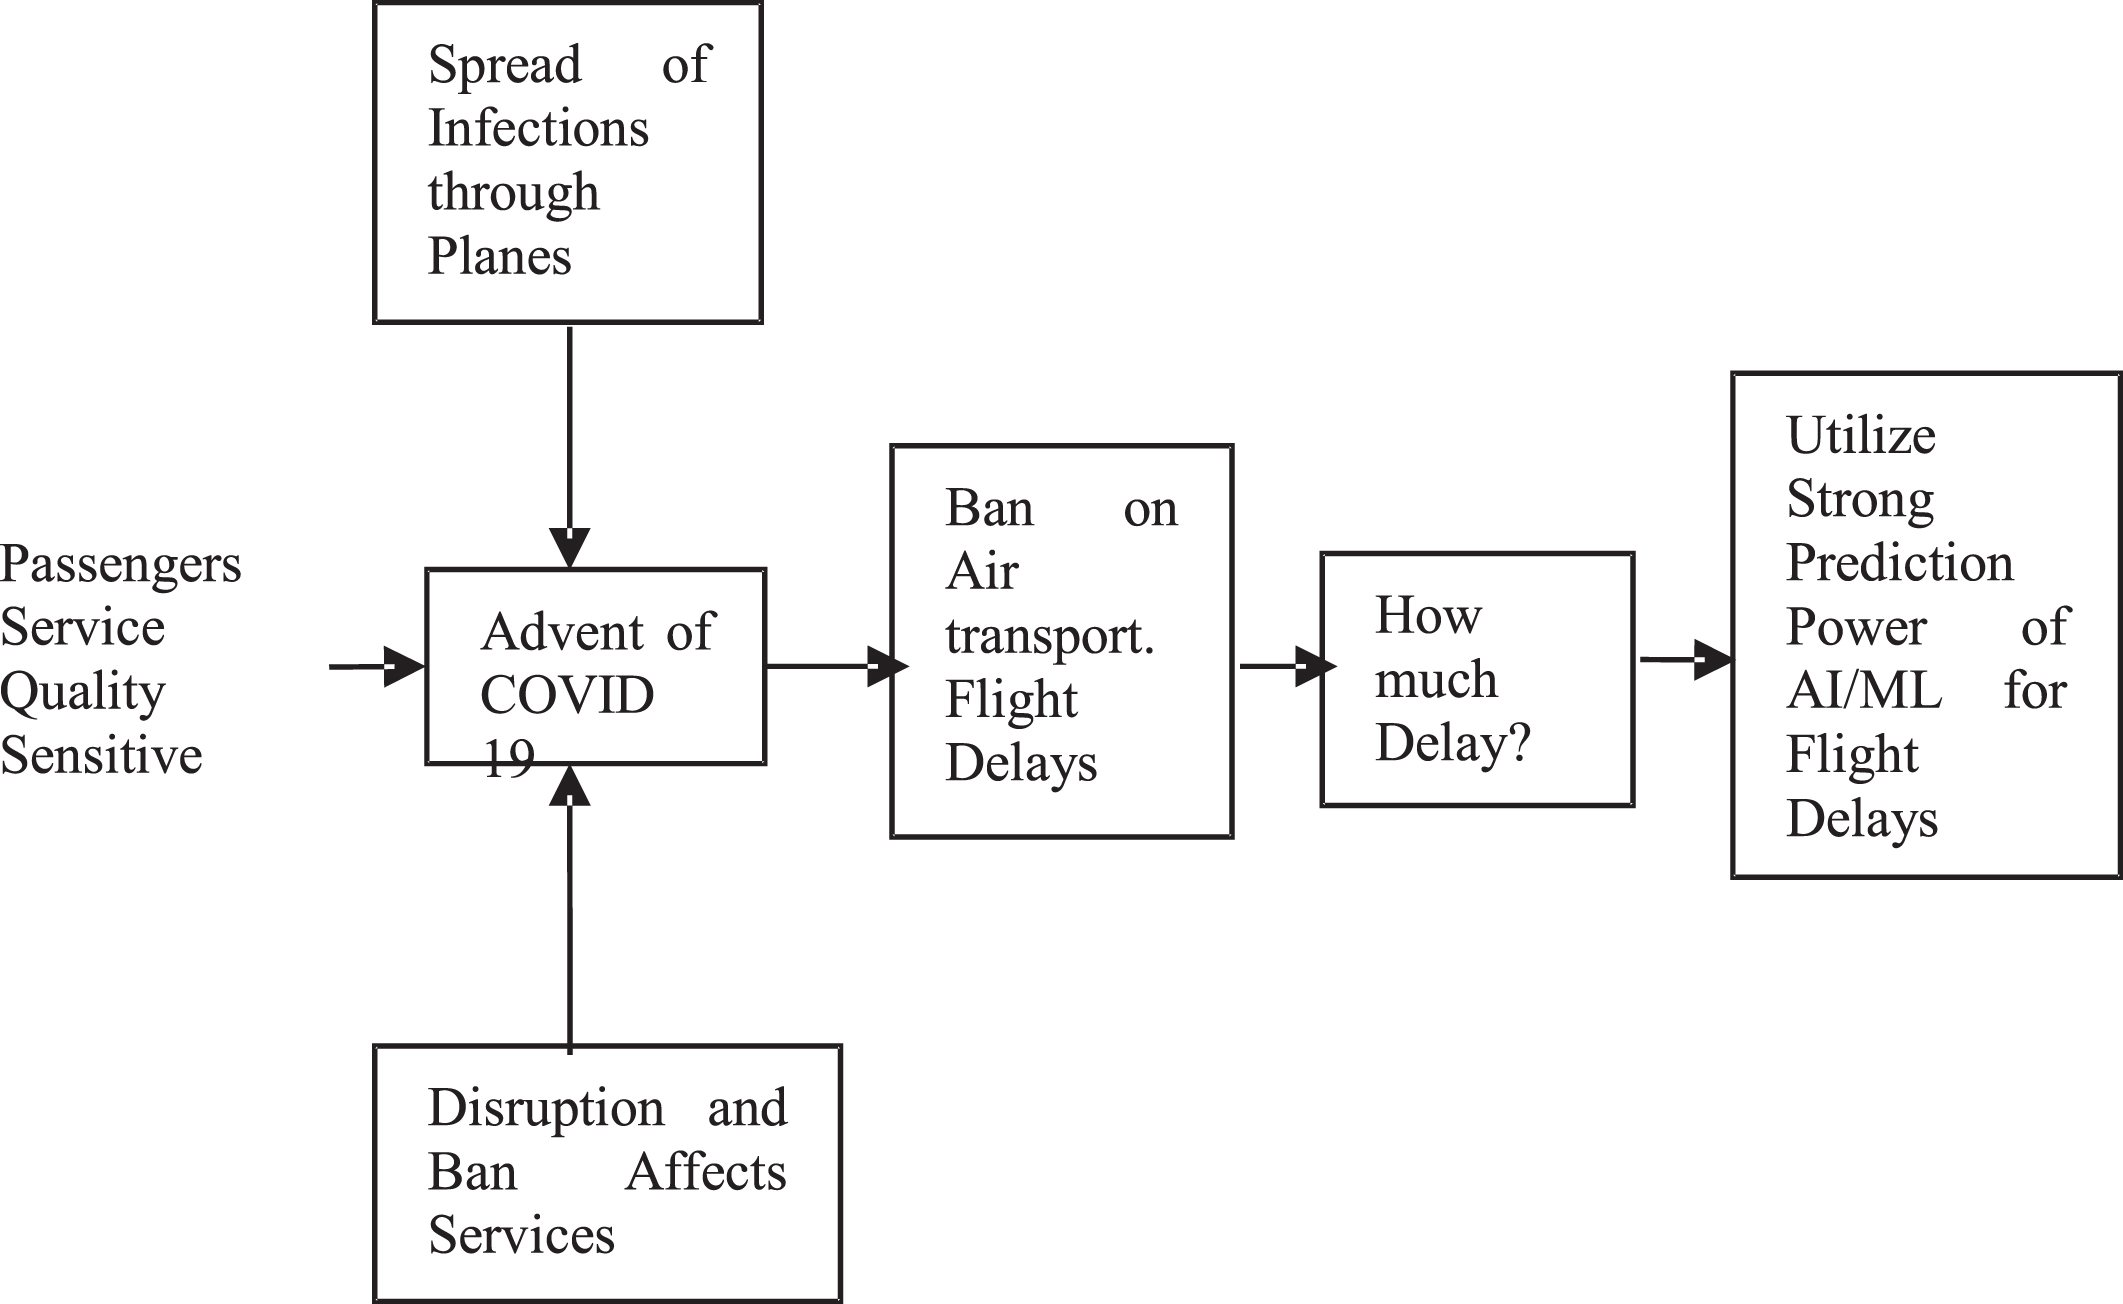
Artificial intelligence and machine learning techniques have extraordinary capabilities of predicting the occurrence of a future event. Minimum schedule disruption and best passenger services affect the airline business ([41–48, 50]). In the study, Pakdil and Aydin [56], the authors emphasized the need for preparedness in disruptions, emergency and unexpected situations for the airline industry. Reliable expectations need efficient and accurate prediction mechanisms. The modern deep learning based machine learning algorithm can memorize big data for the purpose of predicting the future unexpected situations. Thus in this study the memorizing power of the modern deep learning algorithms are exploited to predict the flight delays in the COVID 19 pandemic situation. Thus AI based computer integrated systems are developed to predict whether the flight will be delayed or not? Moreover, it is important to know which of the features contribute more towards flight delays during the COVID-19 pandemic situations. The theoretical framework can be presented graphically as shown in Fig. (1). The framework depicts that when the passengers are service quality sensitive, the outbreak of the COVID 19, and the belief that the disease transmit through planes, impose ban on air travel. Due to the ban a huge flight schedule disruption occurred and the passengers want to know whether a certain flight is delayed or not? Thus the powerful prediction tools of AI are used to response to the event of flight delay prediction in the pandemic situation.
Fig. 1
Graphical presentation of theoretical framework.
Thus we memorize / train our model with 2196678 flight delay information. We further test the accuracy of our proposed model with 549169 flight delay information. In other words, we try to teach / memorize / learn our system 2196678 flight delay / cancellation patterns. Then we test with 549169 flight delay patterns, and let the system to check whether a flight with specific features will be delayed?
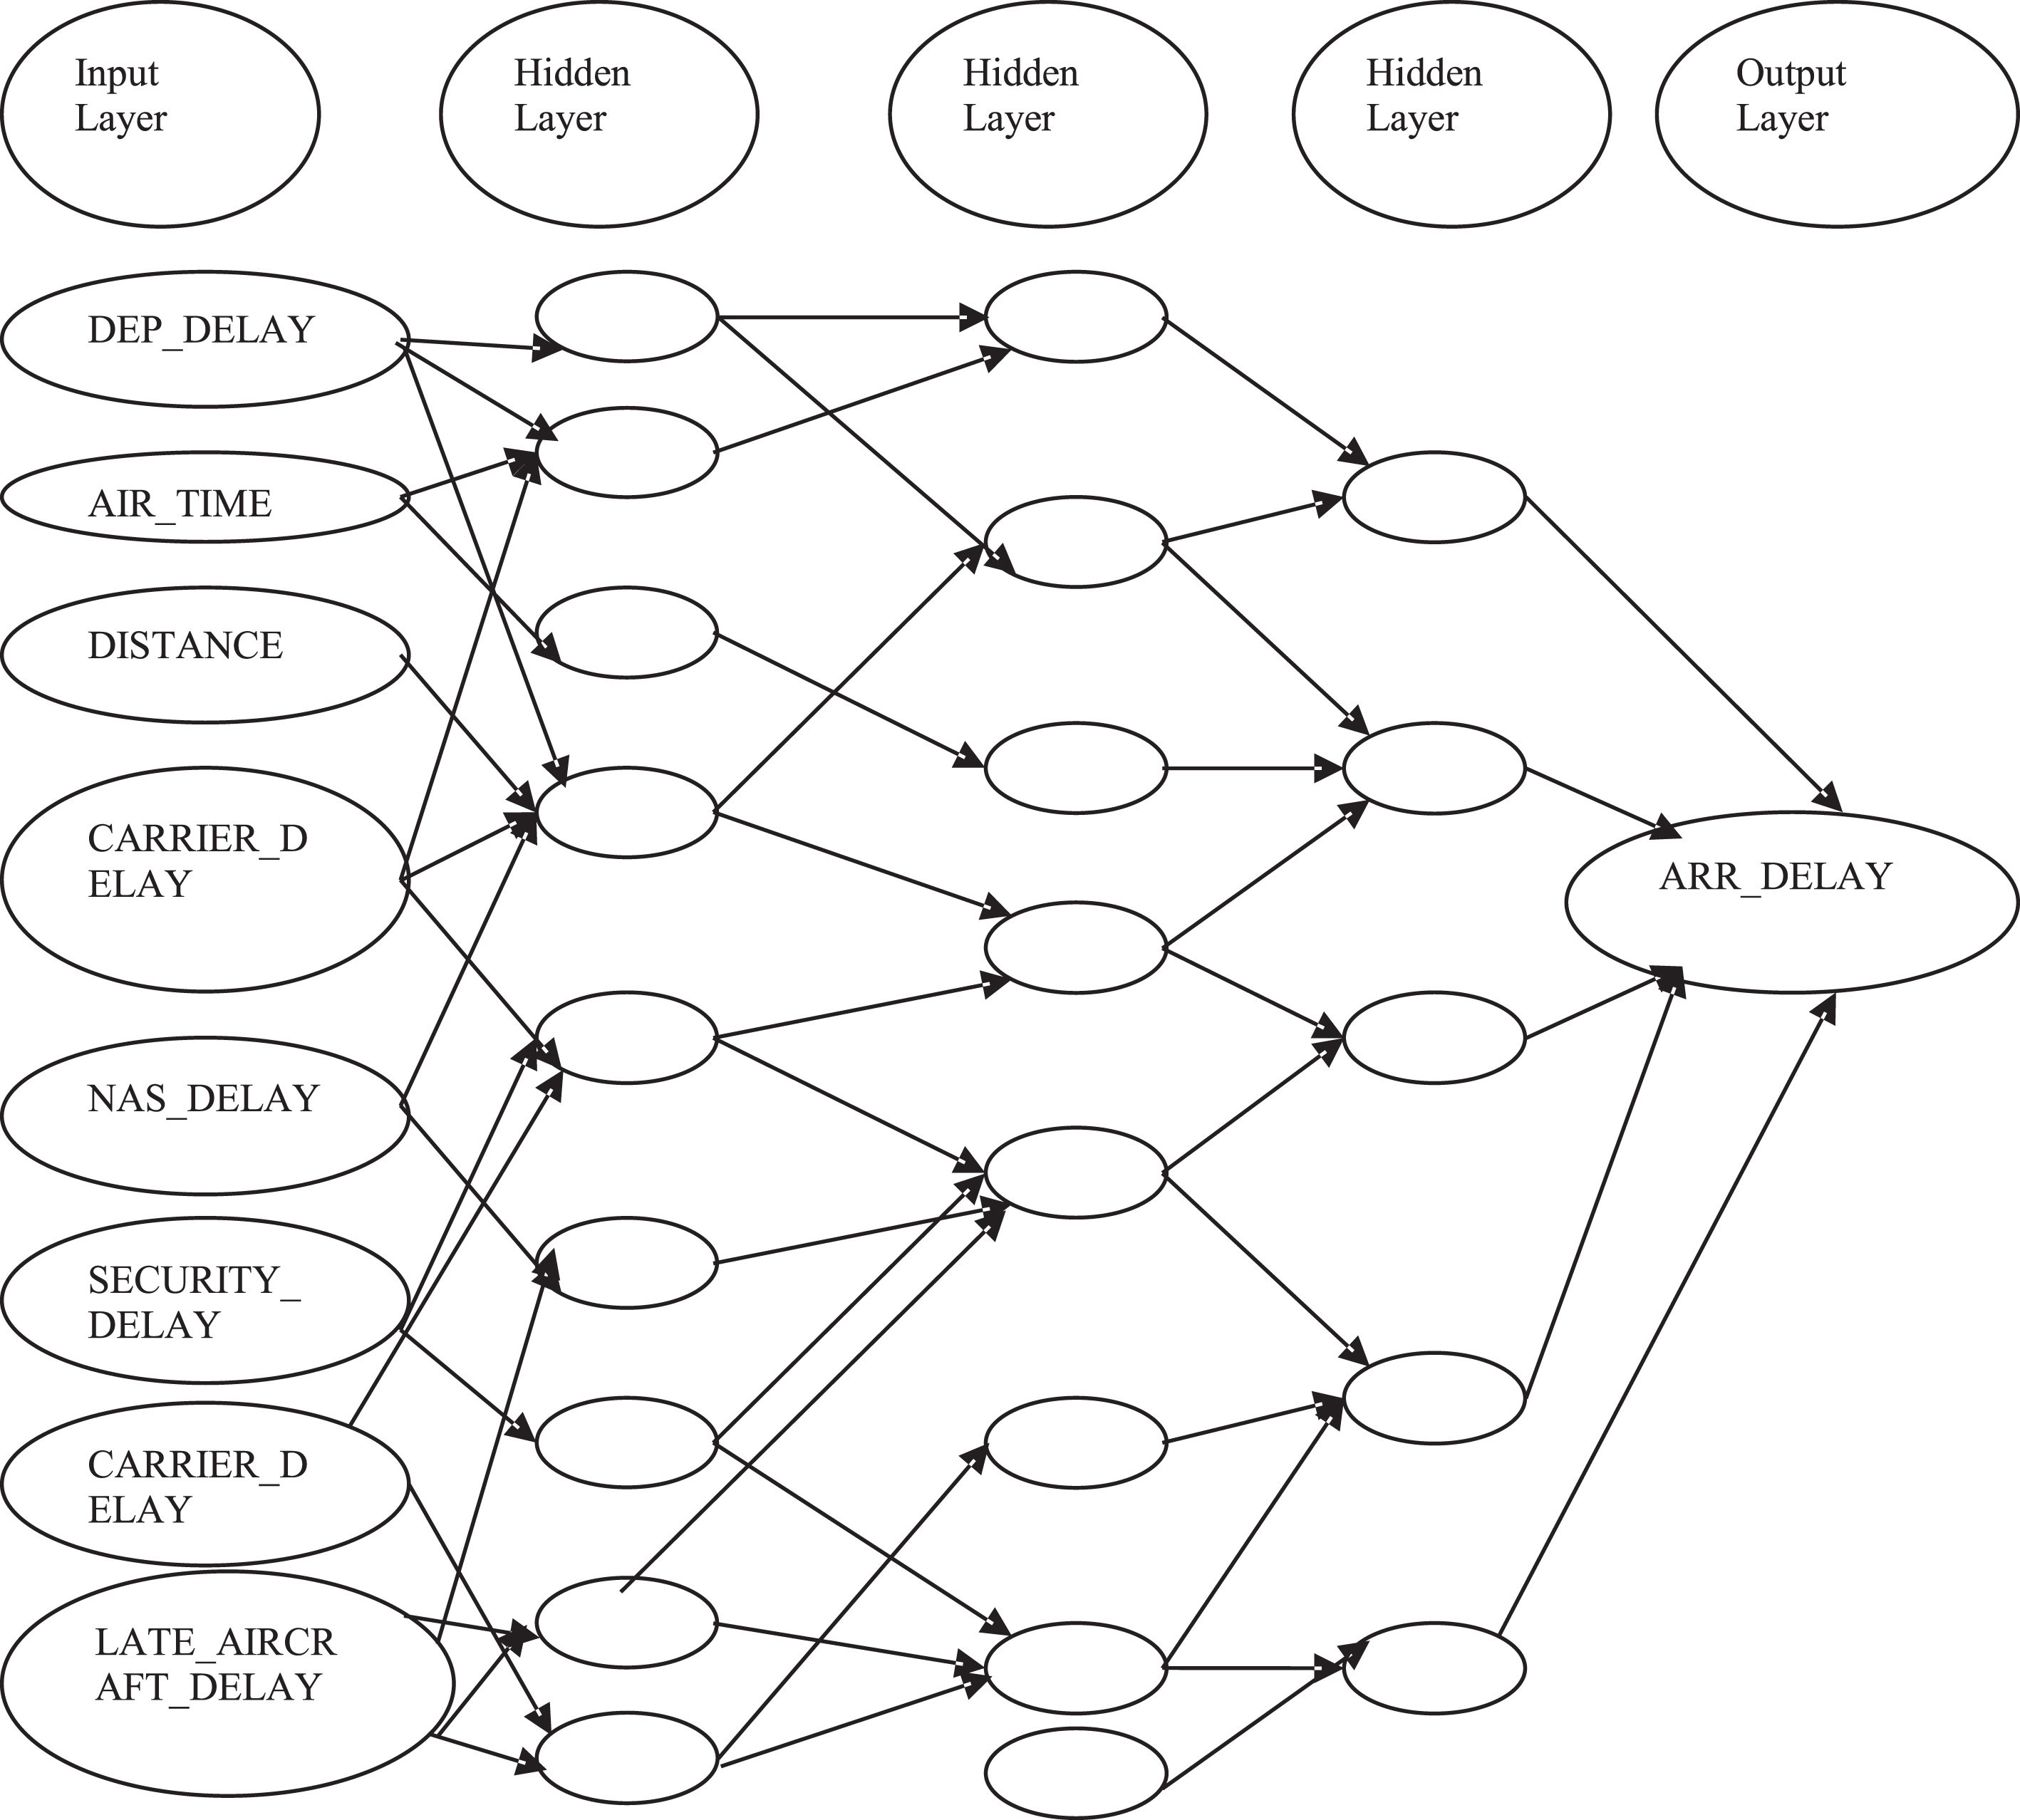
Figure (2) shows the research design adopted in this study for the predicting the flight delay during the COVID 19 situation. The techniques of the artificial intelligence used for prediction and interpretations of flight delays are as under.
1. Neural network regression.
2. Decision forest regression.
3. Boosted decision tree regression.
4. Multi-class logistic regression.
Fig. 2
Research design of deep learning based flight delay prediction during COVID 19.
6Dataset and features
COVID-19 has severely crippled the global airline industry. All the major air services were thoroughly reduced throughout the year 2020. The data of 2745847 flights with 47 delays features were obtained from Kaggle (2020). The data is further obtained by (Kaggle, [63]) from The United States Department of Transportation’s (DOT) Bureau of Transportation Statistics ([64]). The department detail information for the on-time performance of flights for major US carriers. The data is from January - June 2020 containing all the relevant flight information from the Top 10 United States flight carriers with 2745847 flights during the pandemic time. The unit of analysis for this research is the US Airline industry. The study will help to predict the airline flight delays in COVID 19 pandemic situations. The system is trained with 2196678 flight delay data during the COVID 19 situation. The data of the 549169 flights are used for testing to check the accuracy of the model. The total dataset consists of 2745847 flights delay information during the COVID 19 situation. In all deep learning techniques the data is usually subdivided into the training and testing data sample. It is common practice to allocate 80% of the data to training sample and 20% to testing sample. In other words 80% of the dataset is given to the model for training / memorizing and the rest 20% check how the model have memorized the dataset for prediction. Thus the totality of dataset is subdivided into training and testing samples having data of 2196678 and 549169 flights, respectively, during the COVID 19 situation. The following features are used for the prediction of flight delays in the COVID-19 situations.
AIR_TIME: Total elapsed time the airplane remains in air and measured in minutes.
ARR_DELAY: Measured in minutes.
CARRIER_DELAY: Measured in minutes. The cancellation or delay due to circumstances within the control of and airline. For example, crew unavailability, maintenance, aircraft cleaning, fueling, baggage loading, fueling, etc.
DEP_DELAY: Measured in minutes.
DISTANCE: Measured in miles from the origin to destination airport.
LATE_AIRCRAFT_DELAY: Measured in minutes. This type of delay is caused by a previous flight arrived late, this situation causes the present flight to departure late.
NAS_DELAY: Measured in minutes. Delays and cancellations due to national aviation system. For example, airport operations, non-extreme weather conditions, heavy traffic volume, air traffic control.
SECURITY_DELAY: Measured in minutes. Delays / cancellations caused by emergency evacuation of a terminal or concourse. Re-boarding of aircraft caused by security breach, fault in security screening equipment. Long waiting lines at security screening areas exceeding 29 minutes.
WEATHER_DELAY: Measured in minutes. Extreme meteorological conditions causing delays / cancellations of a flight. For example, winds, heavy rains, hurricane, tornado, floods, blizzard.
7Formulation of the Proposed Neural Network Regression for Flight Delay Prediction
A neural network is composed of interconnected nodes and edges forming layers. The first and last layers are termed as input layer and output layer, respectively. There may be many hidden layers between these two layers. Majority of the prediction problems are solved by having one or a few hidden layers. However, deep neural networks may have even hundreds hidden layers. The interconnected layers have higher levels of semantic depth. Training of the network on the given data is performed to know the relationship between inputs and outputs. The graph starts from inputs to hidden and ends with output layer. The nodes succeeding layers are connected to next layer with the help of weighted edges. To compute the output for an input, an activation function is used to calculate the value at nodes. Each layer calculates a value based on the weighted sum of values that is calculated at nodes of the preceding layer.
In the neural network, the inputs are multiplied with the weights at the hidden layers to create node “j”. For example the output of the first hidden layer is given as (1). Here
(1)
(1) For the second hidden layer the output is given in (2). In the second layer f2 is applied on the output of
(2)
The output at the third hidden layer at node “j” can be calculated (3). In the third layer f3is applied on the output of
(3)
Finally the output at the “j” th node of the output layer is given as (4). In the output layer θjis applied on the output of
(4)
In case the network has “k” hidden layers, the output at the k th hidden layer is given as (5).
(5)
Finally the output at the output layer is given in (6). In the output layer θj is applied on the output of
(6)
The performance of neural network based models are measured in the form of mean solution error (7), root mean square error (8), relative absolute error (9), relative squared error (10), and coefficient of determination (11).
(7)
Here, oi, ti denote the predicted target and the actual target, respectively.
(8)
(9)
(10)
(11)
Thus Equations 7–11 are used for performance evaluation.
The machine learning techniques used in this study are neural network aggression, decision forest regression, boosted decision tree regression and multiclass logistic regression. The parameters of the models are presented in Table (2). The neural network regression uses a cross entropy loss function. The loss function ensures how the prediction is close to the actual value. Its value range from 0–1, with 0 representing the perfect match and 1 the completely mismatch. Learning rate of the problem is 0.005. The learning rate is the changing parameter, setting the step size at each iteration to come close to the minimum loss function. The network performed 100 iterations with minmax normalizer. The normalizer transform the original data into the (0, 1) range, it preserve the relationship of the original data. The initial weights from which the machine start learning is 0.1. The system perform shuffling with random seed. A random seed is a initial random number generator for the system to start the iterative process. The method allow unknown level to create groups of unknown values in training and validation. This allows the method to better predict the unknown values.
Table 2
Methods and parameters
| Neural network regression | Decision forest regression | Boosted decision tree | Multiclass logistic regression |
| Loss Function CrossEntropy | Ensemble Element Count 8 | Number of Leaves 20 | Optimization Tolerance 1E-07 |
| Learning Rate 0.005 | Max Depth 32 | Minimum Leaf Instances 10 | L1 Weight 1 |
| Number Of Iterations 100 | Random Split Count 128 | Learning rate 0.2 | L2 Weight 1 |
| Is Initialized From String False | Min Leaf Sample Count 1 | Number of Trees 100 | Memory Size 20 |
| Is Classification False | Class Count 1 | Allow Unknown Levels True | Use Threads True |
| Initial Weights Diameter 0.1 | Resampling Method Bagging | Random Number Seed True | Allow Unknown Levels True |
| Momentum 0 | Random Number Seed 5 | Random Number Seed True | |
| Neural Network Definition | Allow Unknown Levels True | ||
| Data Normalizer Type MinMax | |||
| Number Of Input Features | |||
| Number Of Hidden Nodes System.Collections.Generic.List‘1 [System.Int32] | |||
| Number Of Output Classes | |||
| Shuffle True | |||
| Allow Unknown Levels True | |||
| Random Number Seed True |
The decision forest set up 8 decision forests for the proposed problem. The max depth is the depth of each tree in the forest. Deep tree has more depth capturing more information for a problem. The depth of the tree range from 1–32. The minimum sample at each leaf is 1 shows the minimum number of samples to reach a leaf (decision). The method allow unknown level to create groups of unknown values in training and validation. This allows the method to better predict the unknown values. The resampling method used is bagging starting with a random seed of 5. In the process of bagging also known as bootstrapping decision trees in the forest are grown on randomly selected sample of the original dataset with replacement and the process continues until a dataset of the size of the original dateset is obtained. Bagging uses voting its aggregation policy. Each tree score unnormalized histograms of labels, which are normalized as probabilities. Trees with high probabilities have greater change to be the decision of the ensemble.
The boosted decision tree method setup 100 decision trees. Ten samples are required to reach a leaf (decision). The method allow unknown level to create groups of unknown values in training and validation. This allows the method to better predict the unknown values. The resampling method used is boosting. In boosting each tree is dependent on the prior trees. The second tree corrects errors in first. Likewise the third tree correct errors in second and first and so on.
The multiclass logistic regression use a combination of L1 and L2 regularization techniques. Regularization is a method used for penalizing models with extreme coefficient values. In this method a penalty is charged with coefficient values to reduce the errors. L1 is used for sparse models whereas L2 for non sparse. Spare data is high dimensional where the values are not exactly known. The optimization convergence value for the multiclass logistic regression is 0.0000007. The method allow unknown level to create groups of unknown values in training and validation, thus better predicting the unknown values.
Simulation models and machine learning models are opposite in characteristics. In this study machine learning techniques are adopted thus the model may not necessarily exhibit the characteristic properties associated with simulation studies. The difference between the two is that, in simulation study, the model is known exactly but the unknown inputs are not. On the other hand in machine learning the unknown inputs are known exactly, but the model is not exactly known [66, 67].
8Results and discussions
After training the model on a set of 2196678 flight data, it is tested on a data of 549169 to check the performance of the learned model. The results of the proposed neural network regression are shown in Table 3. The Table 3 takes into consideration the flight information data and predict whether a flight with certain flight information is going to be delayed or not? In the Table 3 the second column shows the result that whether the flight is going to be delayed or not? Moreover the last column named Scored Labels shows the degree of assurance that the flight is going to be delayed. In Table 3, only few flights out of 549169 are shown and their predictions are displayed.
Table 3
Arrival delay prediction with proposed neural network regression based on data [63, 64]
| DEP_ DELAY | ARR_ DELAY | AIR_ TIME | DISTANCE | CARRIER_ DELAY | WEATHER_ DELAY | NAS_ DELAY | SECURITY_ DELAY | LATE_ AIRCRAFT_ DELAY | Scored Labels |
| 70 | true | 42 | 247 | 0 | 11 | 1 | 0 | 59 | 0.99169 |
| 3 | true | 40 | 204 | 0 | 0 | 0 | 0 | 0 | 0.98757 |
| 9 | true | 219 | 1488 | 0 | 0 | 0 | 0 | 0 | 0.98001 |
| 0 | false | 0 | 247 | 0 | 0 | 0 | 0 | 0 | 0.01368 |
| 75 | true | 133 | 946 | 62 | 0 | 0 | 0 | 0 | 0.97969 |
| 6 | true | 268 | 2585 | 0 | 0 | 0 | 0 | 0 | 0.95789 |
| 25 | true | 200 | 1521 | 0 | 0 | 0 | 0 | 0 | 0.97839 |
| 0 | false | 0 | 680 | 0 | 0 | 0 | 0 | 0 | –0.00380 |
| 12 | false | 79 | 522 | 0 | 0 | 0 | 0 | 0 | 0.98431 |
| 3 | true | 97 | 770 | 0 | 0 | 0 | 0 | 0 | 0.99928 |
| 11 | true | 196 | 1501 | 11 | 0 | 15 | 0 | 0 | 0.98847 |
Table 4 shows the results of testing for the decision forest regression for some flights out of 549169. The Table 4 takes into consideration the flight information data and predict whether a flight with certain flight information is going to be delayed or not? In the Table 4 the second column shows the flight arrival delay status. Moreover the last two columns named Scored Label Mean and Scored Label Standard Deviation, respectively show the degree of assurance of flight delay and the standard deviation of the prediction. In Table 4, the predictions for some flights out of 549169 are shown.
Table 4
Arrival delay prediction with proposed decision forest regression [63, 64]
| DEP_ DELAY | ARR_ DELAY | AIR_ TIME | DISTANCE | CARRIER_ DELAY | WEATHER_ DELAY | NAS_ DELAY | SECURITY_ DELAY | LATE_ AIRCRAFT_ DELAY | Scored Label Mean | Scored Label Standard Deviation |
| 70 | true | 42 | 247 | 0 | 11 | 1 | 0 | 59 | 1 | 0.000296 |
| 3 | true | 40 | 204 | 0 | 0 | 0 | 0 | 0 | 1 | 0.000244 |
| 0 | false | 0 | 116 | 0 | 0 | 0 | 0 | 0 | 0 | 0.000036 |
| 0 | true | 198 | 1448 | 0 | 0 | 0 | 0 | 0 | 1 | 0.000216 |
| 9 | true | 219 | 1488 | 0 | 0 | 0 | 0 | 0 | 1 | 0.000275 |
| 0 | false | 0 | 247 | 0 | 0 | 0 | 0 | 0 | 0 | 0.00001 |
| 1 | true | 113 | 967 | 0 | 0 | 0 | 0 | 0 | 1 | 0.000215 |
| 75 | true | 133 | 946 | 62 | 0 | 0 | 0 | 0 | 1 | 0.000172 |
| 6 | true | 268 | 2585 | 0 | 0 | 0 | 0 | 0 | 1 | 0.000246 |
| 25 | true | 200 | 1521 | 0 | 0 | 0 | 0 | 0 | 0.9582 | 0.21251 |
The testing results of the boosted decision tree are shown in Table 5. Training the model on a set of 2196678 flight data and then testing on a data of 549169 flight information data. In the Table 5 the second column shows the result that whether the flight is going to be delayed or not? Moreover the last column named Scored Labels shows the degree of assurance that the flight is going to be delayed. Table 5 shows the predictions of only few flights out of 549169 tested flights.
Table 5
Arrival delay prediction with proposed boosted decision tree regression [63, 64]
| DEP_ DELAY | ARR_ DELAY | AIR_ TIME | DISTANCE | CARRIER_ DELAY | WEATHER_ DELAY | NAS_ DELAY | SECURITY_ DELAY | LATE_ AIRCRAFT_ DELAY | Scored Labels |
| 70 | true | 42 | 247 | 0 | 11 | 1 | 0 | 59 | 1.002182 |
| 3 | true | 40 | 204 | 0 | 0 | 0 | 0 | 0 | 0.96821 |
| 0 | false | 0 | 116 | 0 | 0 | 0 | 0 | 0 | 0.000252 |
| 0 | true | 198 | 1448 | 0 | 0 | 0 | 0 | 0 | 0.975555 |
| 9 | true | 219 | 1488 | 0 | 0 | 0 | 0 | 0 | 0.957273 |
| 0 | false | 0 | 247 | 0 | 0 | 0 | 0 | 0 | 0.000097 |
| 1 | true | 113 | 967 | 0 | 0 | 0 | 0 | 0 | 0.975054 |
| 75 | true | 133 | 946 | 62 | 0 | 0 | 0 | 0 | 0.998 |
Moreover, the decision forest constructs hundred decision trees. Two decision trees are shown in the Fig. 3. By clicking on the edges of the trees, the prediction probabilities of the certain decision tree can be seen.
Fig. 3
Two decision trees out of 100, by boosted decision tree regression.
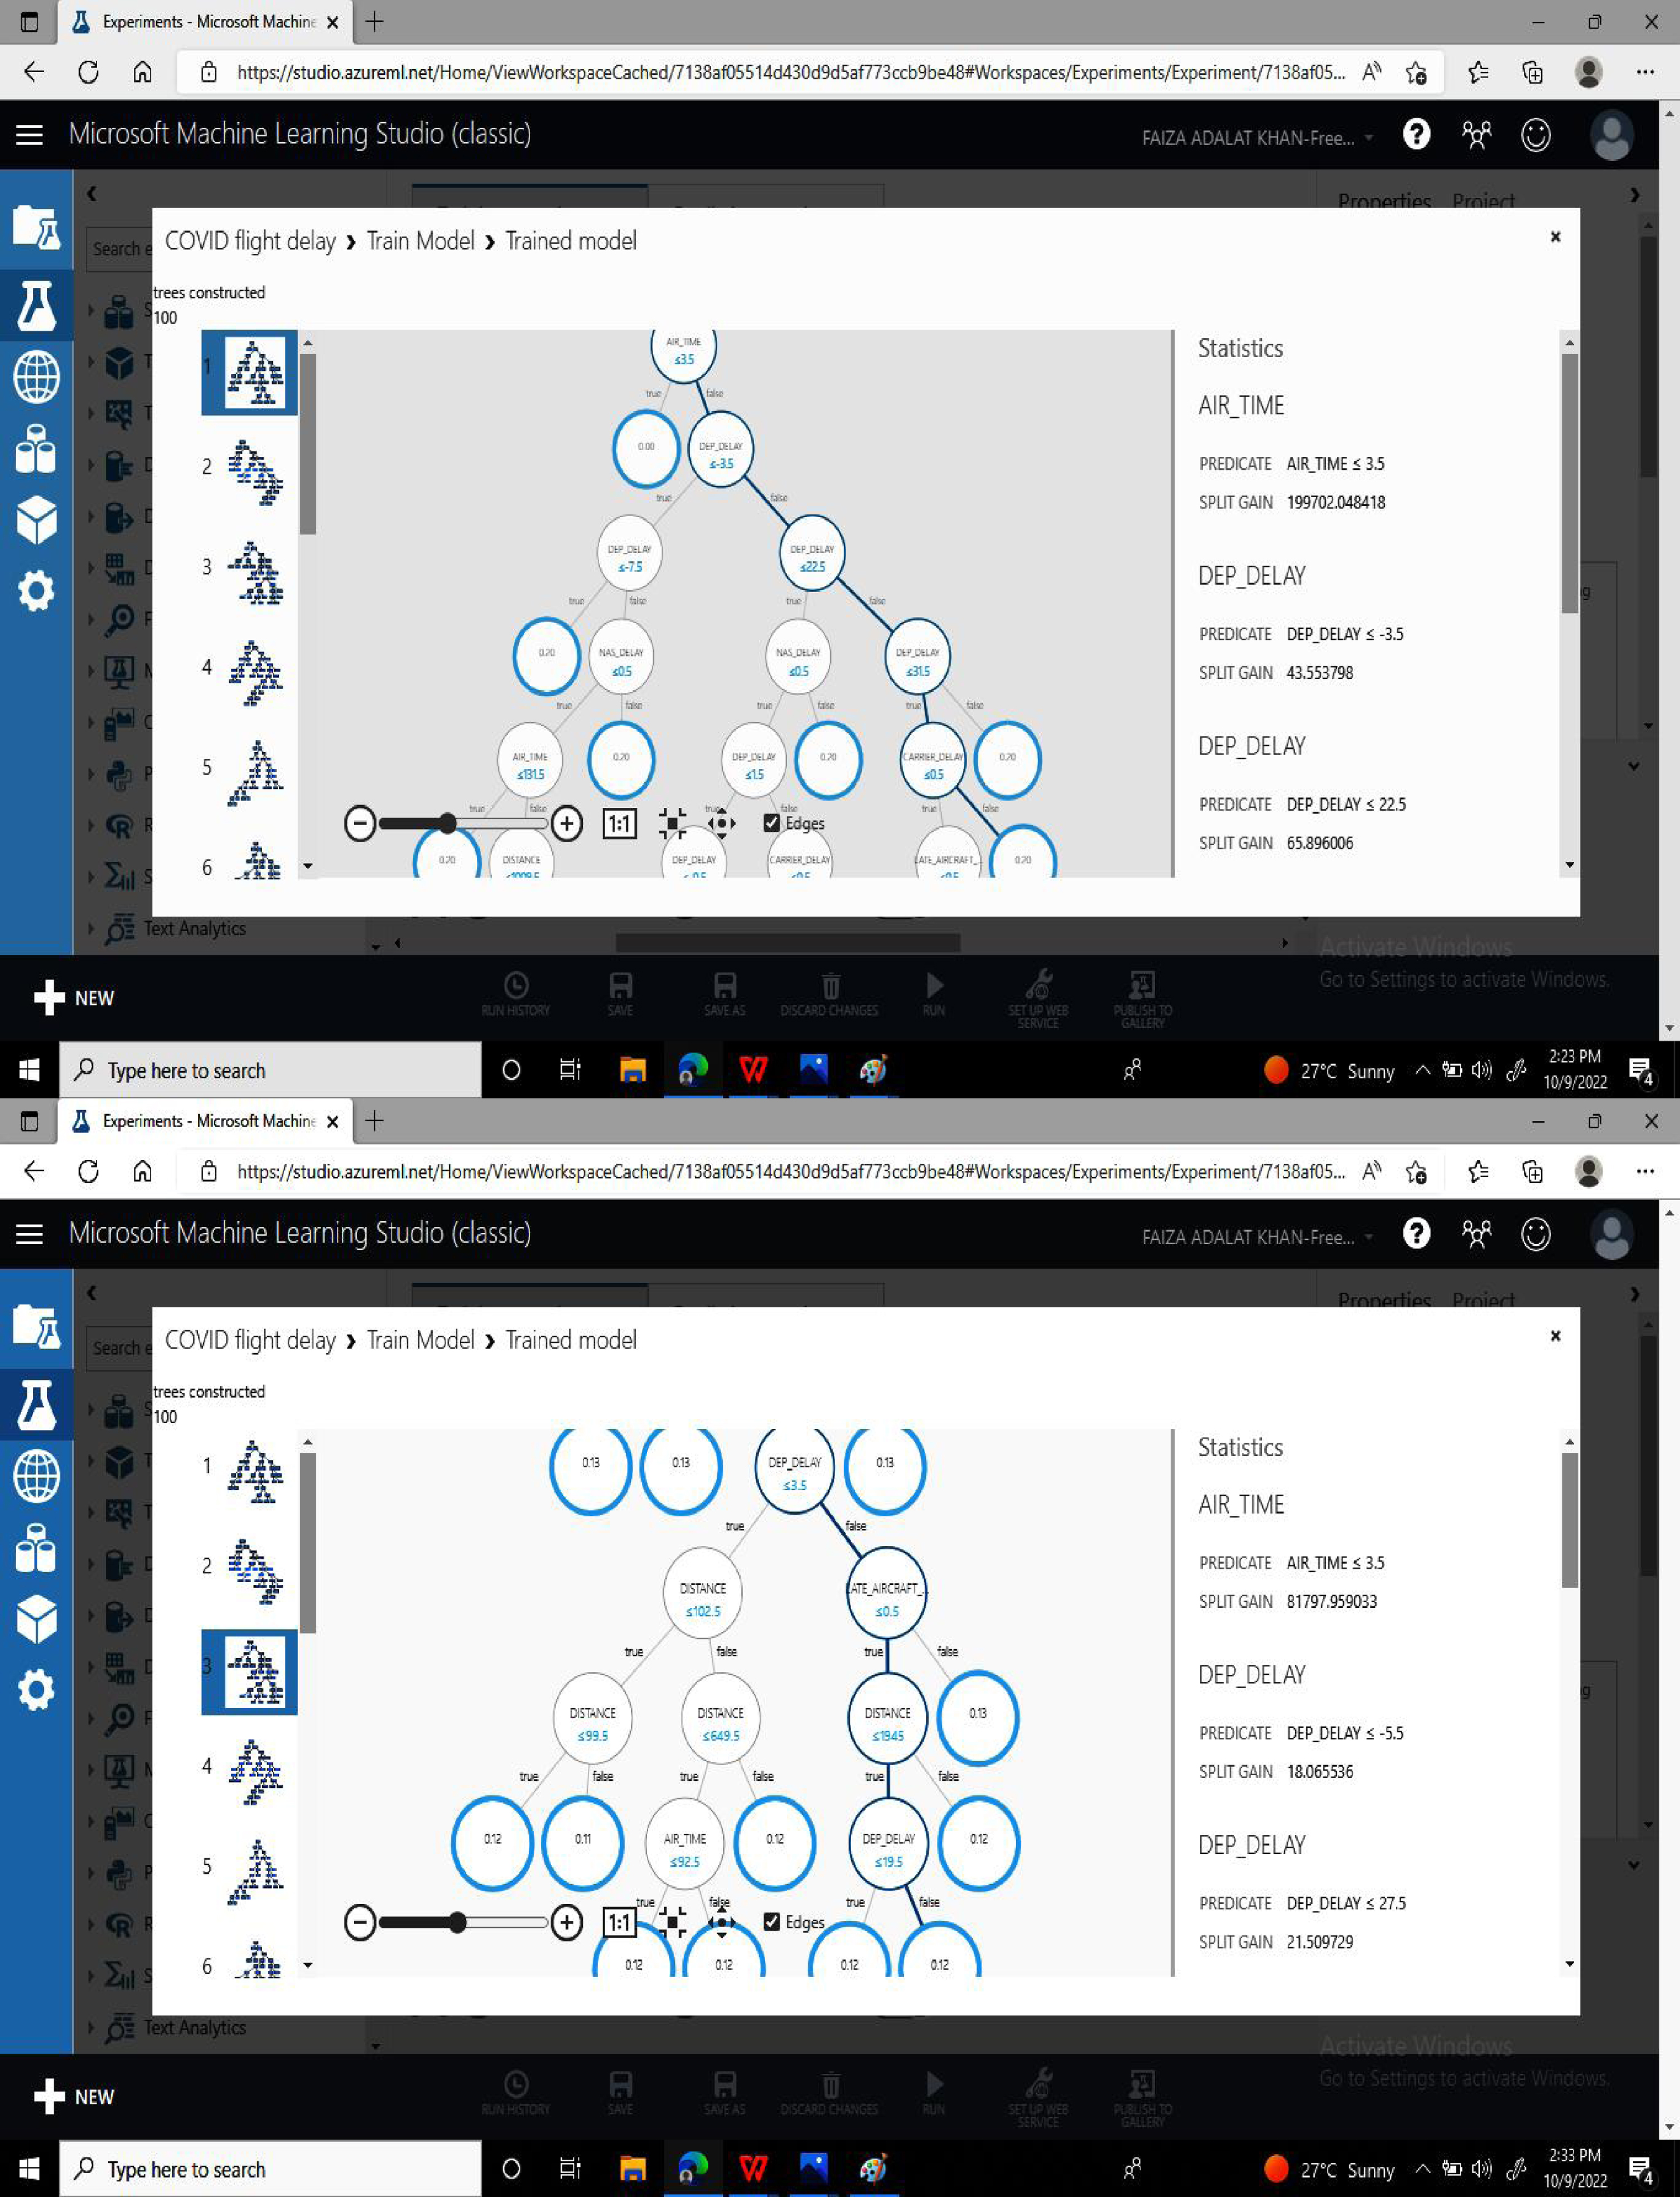
Table 6 shows the prediction results of the multi class logistic regression. Table 6 shows that the logistic regression predicts the status of the flight with three parameters. The last three columns show prediction of a flight with certain information. The scored probabilities for class “False” and the scored probabilities for the class “True”, shows the probabilities of a certain flight in the delayed and not delayed category. Table 6 shows the predictions for some flights out of 549169 tested flights.
Table 6
Arrival delay prediction with proposed multi class logistic regression [63, 64]
| DEP_ DELAY | ARR_ DELAY | AIR_ TIME | DISTANCE | CARRIER_ DELAY | WEATHER_ DELAY | NAS_ DELAY | SECURITY_ DELAY | LATE_ AIRCRAFT_ DELAY | Scored Probabilities for Class “False” | Scored Probabilities for Class “True” | Scored Labels |
| 70 | true | 42 | 247 | 0 | 11 | 1 | 0 | 59 | 0.02195 | 0.978041 | true |
| 3 | true | 40 | 204 | 0 | 0 | 0 | 0 | 0 | 0.03523 | 0.96476 | true |
| 0 | false | 0 | 116 | 0 | 0 | 0 | 0 | 0 | 0.56241 | 0.437588 | false |
| 0 | true | 198 | 1448 | 0 | 0 | 0 | 0 | 0 | 0.00077 | 0.999227 | true |
| 9 | true | 219 | 1488 | 0 | 0 | 0 | 0 | 0 | 0.00011 | 0.999887 | true |
| 0 | false | 0 | 247 | 0 | 0 | 0 | 0 | 0 | 0.85186 | 0.148131 | false |
| 1 | true | 113 | 967 | 0 | 0 | 0 | 0 | 0 | 0.05023 | 0.949761 | Âtrue |
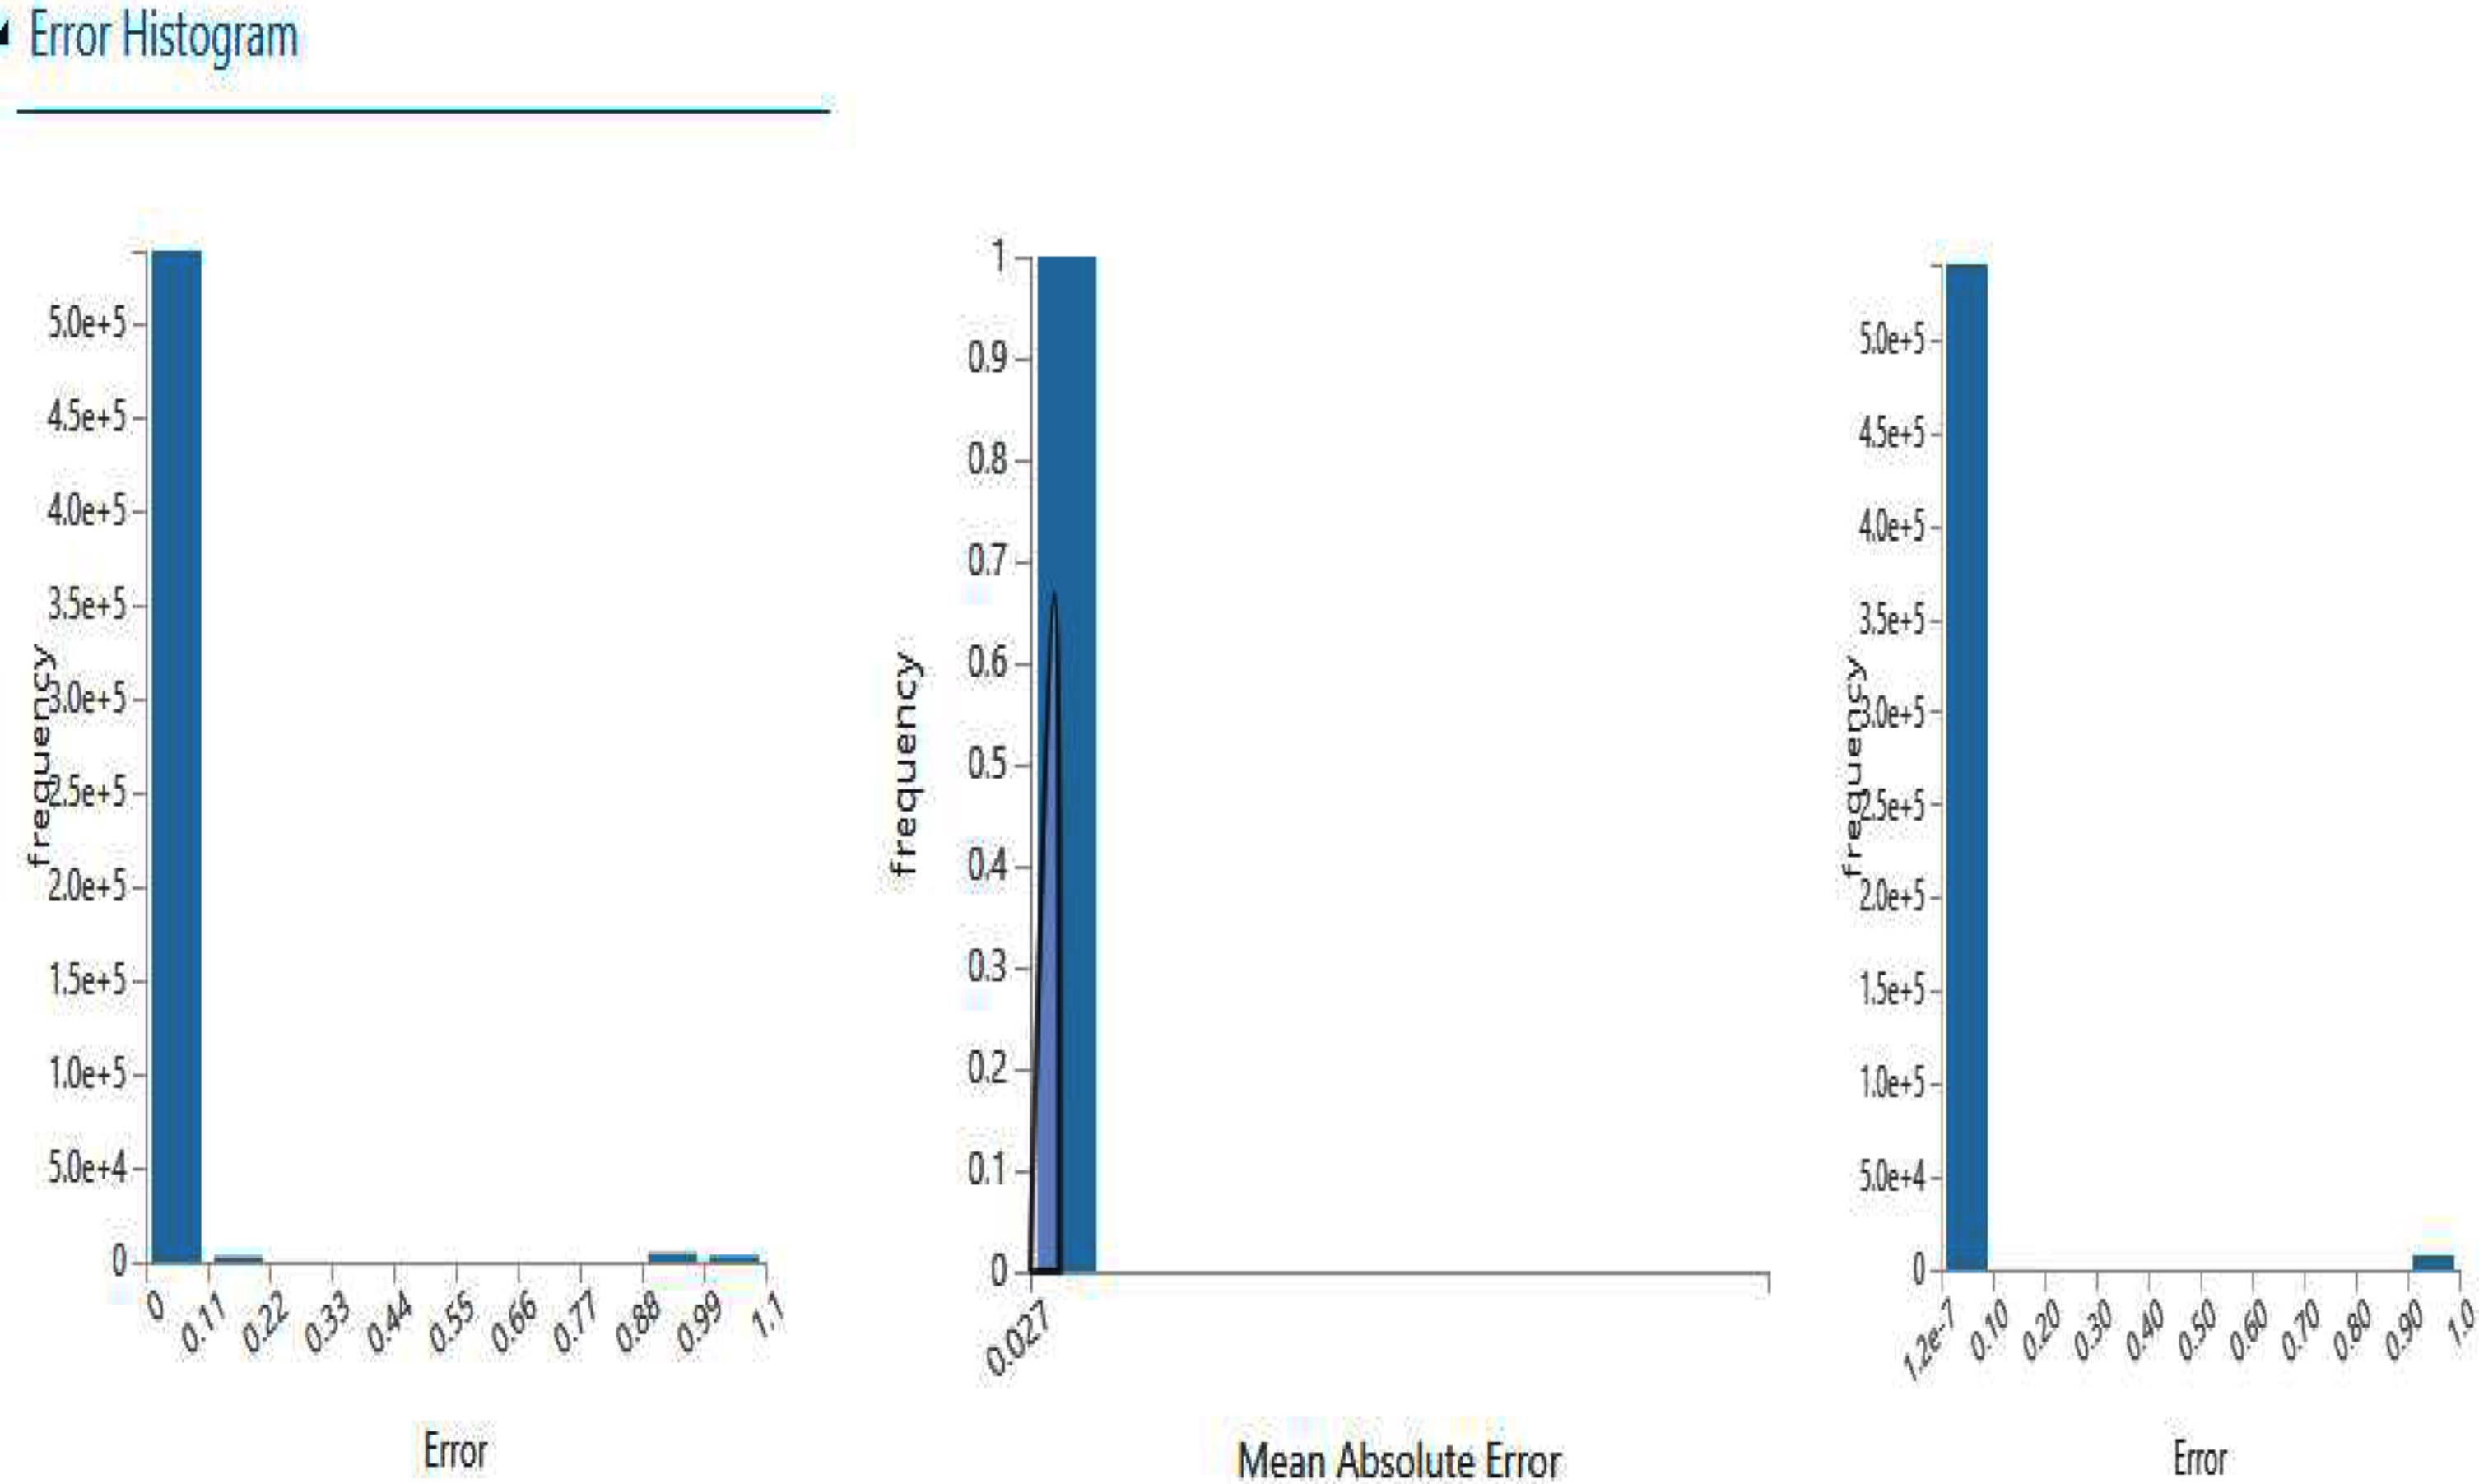
The performances of the three methods are compared in Table 7. The performances of all the methods used are satisfactory. From Table 7 it is clear that the mean absolute error of the boosted decision tree and decision forest regression is 0.02697. The coefficient of determination for the boosted decision tree is 0.870984. This shows that 87% of the variations in the arrival delay are explained by the inputs in the model. Thus the performance of the boosted decision tree regression is best. Moreover, the graphs for the errors in the neural network regression, decision forest regression and boosted decision forest regression are shown in Fig. 4.
Table 7
Comparisons of the performances of the three method for arrival delay prediction
| Neural network regression | Decision forest regression | Boosted decision tree regression | |
| Mean Absolute Error | 0.029241 | 0.026953 | 0.02697 |
| Root Mean Squared Error | 0.117822 | 0.124874 | 0.115933 |
| Relative Absolute Error | 0.140345 | 0.129362 | 0.129445 |
| Relative Squared Error | 0.133254 | 0.149685 | 0.129016 |
| Coefficient of Determination | 0.866746 | 0.850315 | 0.870984 |
Fig. 4
Errors of the three method for arrival delay prediction.
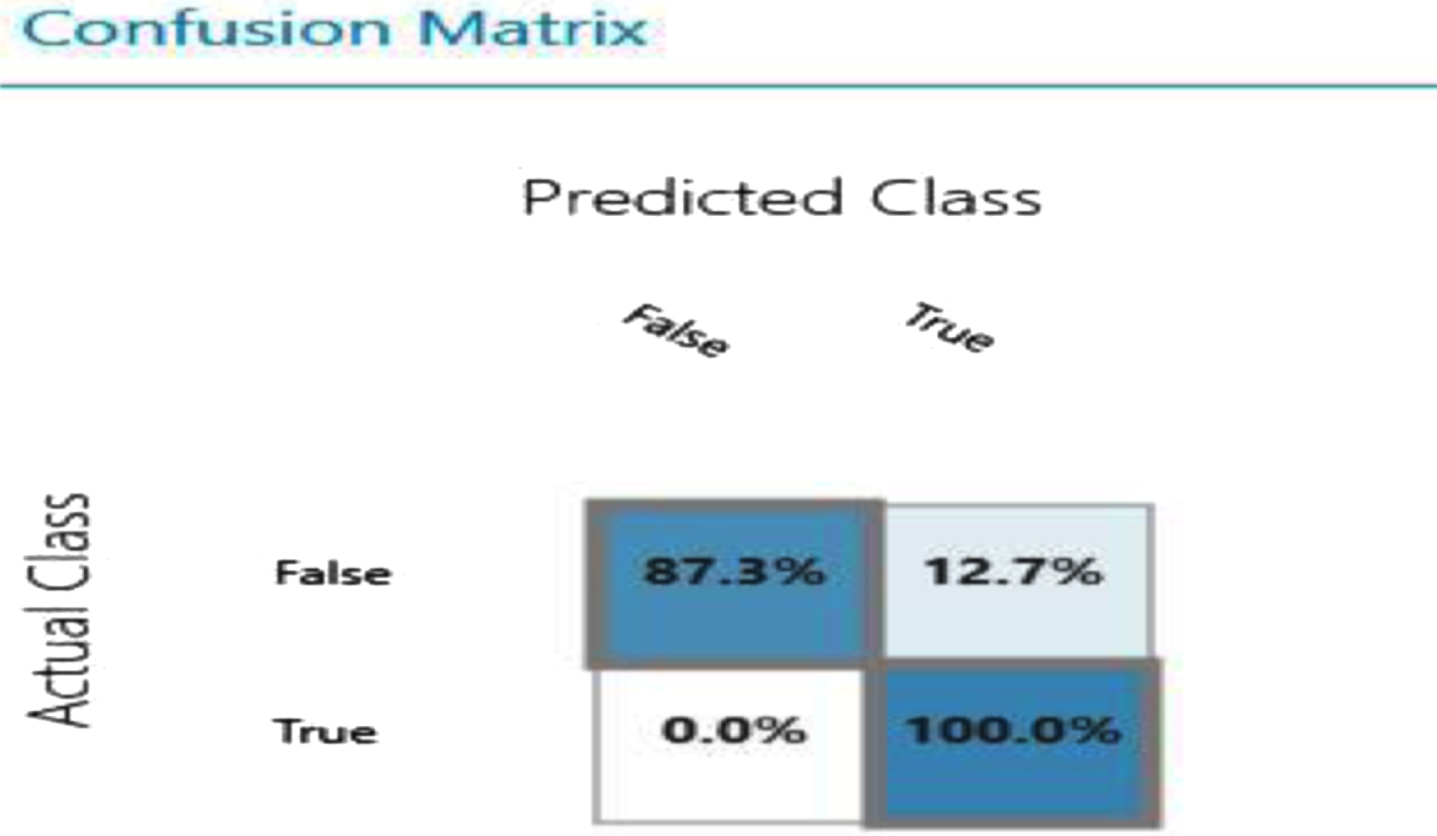
The Table 8 shows that multi class logistic regression gives an overall accuracy and precision of 98.4%. Recalling/remembering performance is 99%. Thus multi class logistic regression is the best prediction model for prediction of flight delays in the COVID-19 situations. The confusion matrix for the multi class logistic regression is shown in Fig. 5. The Fig. 5 shows that 87.2% flights which were not delayed were predicted not delayed by the proposed model. The flights which were actually not delayed but were wrongly predicted as delayed by the model were 12.7%. There is no flight which was actually delayed but wrongly predicted not delayed by the model. All the flights which were delayed were predicted delayed by the model.
Table 8
Results of the multi class logistic regression for arrival delay prediction
| Overall accuracy | 0.98493 |
| Average accuracy | 0.98493 |
| Micro-averaged precision | 0.98493 |
| Macro-averaged precision | 0.991419 |
| Micro-averaged recall | 0.98493 |
| Macro-averaged recall | 0.936368 |
Fig. 5
Confusion matrix for multi class logistic regression for arrival delay prediction.
The model is cross validated to assess the variability and reliability of the model. Cross validate evaluates the performance of the model by considering a bigger data space. Instead of a part, it uses the entire training dataset for training and evaluation. In the process the model is subdivided into 10-folds (samples), build new model for each fold, and finally returns the accuracy metrics for each fold. The model set aside data in fold 1 for validation and the remaining folds are used for training. For example, if the data is divided into 10 folds, then it generates 10 models so that one-tenth of the data is used for validation and nine-tenth for training each fold.
The cross validation results for the neural network regression are presented in Table (9). The entire training dataset is divided into ten fold i.e (0–9). The results illustrate that the representative coefficient of determination for all the folds is 0.86. Moreover, the representative MAE, RMSE, RAE, RSE, are 0.043, 0.11, 0.20, 0.13, respectively.
Table 9
Cross validation for the neural network regression
| Fold | Number of | Mean | Root | Relative | Relative | Coefficient |
| number | examples | absolute | mean squared | absolute | squared | of |
| in fold | error | error | error | error | determination | |
| 0 | 219667 | 0.0451055 | 0.119064 | 0.216627 | 0.138234 | 0.861766 |
| 1 | 219668 | 0.044372 | 0.119087 | 0.213576 | 0.136521 | 0.863479 |
| 2 | 219668 | 0.045096 | 0.11914 | 0.216725 | 0.136435 | 0.863565 |
| 3 | 219668 | 0.045007 | 0.120127 | 0.215044 | 0.137898 | 0.862102 |
| 4 | 219667 | 0.044723 | 0.117794 | 0.215351 | 0.133628 | 0.866372 |
| 5 | 219668 | 0.044427 | 0.116975 | 0.211147 | 0.130063 | 0.869937 |
| 6 | 219668 | 0.04487 | 0.118122 | 0.214961 | 0.133688 | 0.866312 |
| 7 | 219668 | 0.044715 | 0.117787 | 0.213053 | 0.13221 | 0.86779 |
| 8 | 219668 | 0.045449 | 0.118005 | 0.218133 | 0.133668 | 0.866332 |
| 9 | 219668 | 0.030614 | 0.116594 | 0.146253 | 0.129888 | 0.870112 |
| Mean | 0.043438 | 0.11836 | 0.208087 | 0.134223 | 0.865777 | |
| Standard Deviation | 0.004518 | 0.001188 | 0.021819 | 0.002998 | 0.002998 |
The cross validation results for the decision forest regression are presented in Table (10). Here the entire training dataset is divided into ten fold i.e (0–9). The results illustrate that the representative coefficient of determination for all the folds is 0.85. Moreover, the representative MAE, RMSE, RAE, RSE, are 0.026, 0.12, 0.12, 0.14, respectively.
Table 10
Cross validation for the decision forest
| Fold | Number of | Mean | Root | Relative | Relative | Coefficient |
| number | examples | absolute | mean squared | absolute | squared | of |
| in fold | error | error | error | error | determination | |
| 0 | 219667 | 0.027254 | 0.126509 | 0.130893 | 0.153729 | 0.846271 |
| 1 | 219668 | 0.027089 | 0.125322 | 0.13039 | 0.151194 | 0.848806 |
| 2 | 219668 | 0.026759 | 0.12487 | 0.128603 | 0.149873 | 0.850127 |
| 3 | 219668 | 0.027289 | 0.126551 | 0.130388 | 0.153041 | 0.846959 |
| 4 | 219667 | 0.026545 | 0.123656 | 0.127823 | 0.147258 | 0.852742 |
| 5 | 219668 | 0.026489 | 0.123109 | 0.125892 | 0.14406 | 0.85594 |
| 6 | 219668 | 0.026982 | 0.124434 | 0.129262 | 0.148358 | 0.851642 |
| 7 | 219668 | 0.026783 | 0.123797 | 0.127613 | 0.146045 | 0.853955 |
| 8 | 219668 | 0.026812 | 0.124172 | 0.128686 | 0.148003 | 0.851997 |
| 9 | 219668 | 0.026691 | 0.124185 | 0.127514 | 0.147353 | 0.852647 |
| Mean | 0.026869 | 0.124661 | 0.128706 | 0.148891 | 0.851109 | |
| Standard Deviation | 0.000277 | 0.001162 | 0.001566 | 0.003063 | 0.003063 |
The cross validation results for the boosted decision tree regression are presented in Table (11). The entire training dataset is divided into ten fold i.e (0–9). The results illustrate that the representative coefficient of determination for all the folds is 0.87. Moreover, the representative MAE, RMSE, RAE, RSE, are 0.026, 0.11, 0.11, 0.12, respectively.
Table 11
Cross validation for the boosted decision tree regression
| Fold | Number of | Mean | Root | Relative | Relative | Coefficient |
| number | examples | absolute | mean squared | absolute | squared | of |
| in fold | error | error | error | error | determination | |
| 0 | 219667 | 0.027226 | 0.117096 | 0.130759 | 0.131704 | 0.868296 |
| 1 | 219668 | 0.027042 | 0.116277 | 0.130162 | 0.130156 | 0.869844 |
| 2 | 219668 | 0.026972 | 0.116074 | 0.129624 | 0.129503 | 0.870497 |
| 3 | 219668 | 0.027233 | 0.11722 | 0.130118 | 0.131305 | 0.868695 |
| 4 | 219667 | 0.026678 | 0.11469 | 0.128462 | 0.126678 | 0.873322 |
| 5 | 219668 | 0.026519 | 0.1139 | 0.126034 | 0.123313 | 0.876687 |
| 6 | 219668 | 0.026744 | 0.115044 | 0.128122 | 0.126812 | 0.873188 |
| 7 | 219668 | 0.026668 | 0.114688 | 0.127065 | 0.125345 | 0.874655 |
| 8 | 219668 | 0.026714 | 0.114782 | 0.128213 | 0.126465 | 0.873535 |
| 9 | 219668 | 0.026733 | 0.114903 | 0.127713 | 0.126149 | 0.873851 |
| Mean | 0.026853 | 0.115468 | 0.128627 | 0.127743 | 0.872257 | |
| Standard Deviation | 0.000248 | 0.001125 | 0.001512 | 0.002766 | 0.002766 |
The cross validation results for the muti class logistic regression are presented in Table (12). The entire training dataset is divided into ten fold i.e (0–9). The representative precision and recall for the false class are 0.99 and 0.87, respectively. The representative precision and recall for the true class are 0.98 and 0.99, respectively.
Table 12
Cross validation for the multiclass logistic regression
| Fold number | Number of examples in fold | Average log loss for class “False” | Precision for class “False” | Recall for class “False” | Average log loss for class “True” | Precision for class “True” | Recall for class “True” |
| 0 | 219667 | 0.655964 | 0.999823 | 0.87096 | 0.022403 | 0.983022 | 0.999979 |
| 1 | 219668 | 0.653098 | 0.999778 | 0.871598 | 0.022303 | 0.983152 | 0.999974 |
| 2 | 219668 | 0.64043 | 0.999823 | 0.872173 | 0.02237 | 0.983193 | 0.999979 |
| 3 | 219668 | 0.655144 | 0.999692 | 0.871344 | 0.022356 | 0.982959 | 0.999964 |
| 4 | 219667 | 0.636245 | 0.999956 | 0.874478 | 0.022404 | 0.983533 | 0.999995 |
| 5 | 219668 | 0.61554 | 0.99974 | 0.878305 | 0.022485 | 0.983755 | 0.999969 |
| 6 | 219668 | 0.628393 | 0.999693 | 0.875293 | 0.022496 | 0.98353 | 0.999964 |
| 7 | 219668 | 0.631987 | 0.999826 | 0.876189 | 0.022373 | 0.983531 | 0.999979 |
| 8 | 219668 | 0.646356 | 0.999868 | 0.875183 | 0.022394 | 0.983555 | 0.999985 |
| 9 | 219668 | 0.629544 | 0.999956 | 0.87535 | 0.022441 | 0.983478 | 0.999995 |
| Mean | 0.63927 | 0.999815 | 0.874087 | 0.022402 | 0.983371 | 0.999978 | |
| Standard Deviation | 0.013382 | 0.000094 | 0.002445 | 0.000059 | 0.000267 | 0.000011 |
Time complexity is the total running time required for a computational model to complete its operations.The time complexity of algorithms is expressed using the big O notation. Model complexity can be determined by many factors. For example, the number of training instances, the number of number of features, the number of layers (depth) and the number of neurons in hidden layers (width) in a given model, as well as the linear, nonlinear nature of the problem. There are sophisticated and automated methods to control and reduce model complexity. These include features and model selection, linear model, subset selection, shrinkage methods and regularization. Machine learning techniques take relatively less time to train, ranging from a few seconds to a few hours. Deep learning techniques have many parameters, big data, many hidden layers thus taking longer time to train. For example an algorithm, ResNet, takes around two weeks to train. It is worth noting that time complexity is important in real-time systems. For training based systems, time complexity does not matter due to availability of highly computational devices such as GPU’s, Virtual Machines, TPU’s. Once trained, they can be used as real-time systems with less complexity.
Let denote n = number of training examples, m = number of features, k’ = number of trees. The train time complexity of the neural network regression is O(n) and its test time complexity is O(m). The train time complexity of the decision tree algorithm is O(n*log(n)*m), its test time complexity is O(m). Decision Forest has train time complexity O(k’*n*log(n)*m) and test time complexity O(m*k’). Moreover, Logistic Regression has train time complexity O(n*m) and test time complexity O(m) [68].
9Response to hypothesis testing
The hypothesis testing help to identify which feature contribute more to the flight delays in the COVID 19 situations. Figure 6 and Table 13-14, show that arrival delay has strong relationship with departure delay, carrier delay, Late aircraft delay, weather delay and Nas delay, respectively. Whereas, for the other variables its relationship is random or unrelated/weak related.
Fig. 6
Relationship / correlation of the arrival delay with related factors.
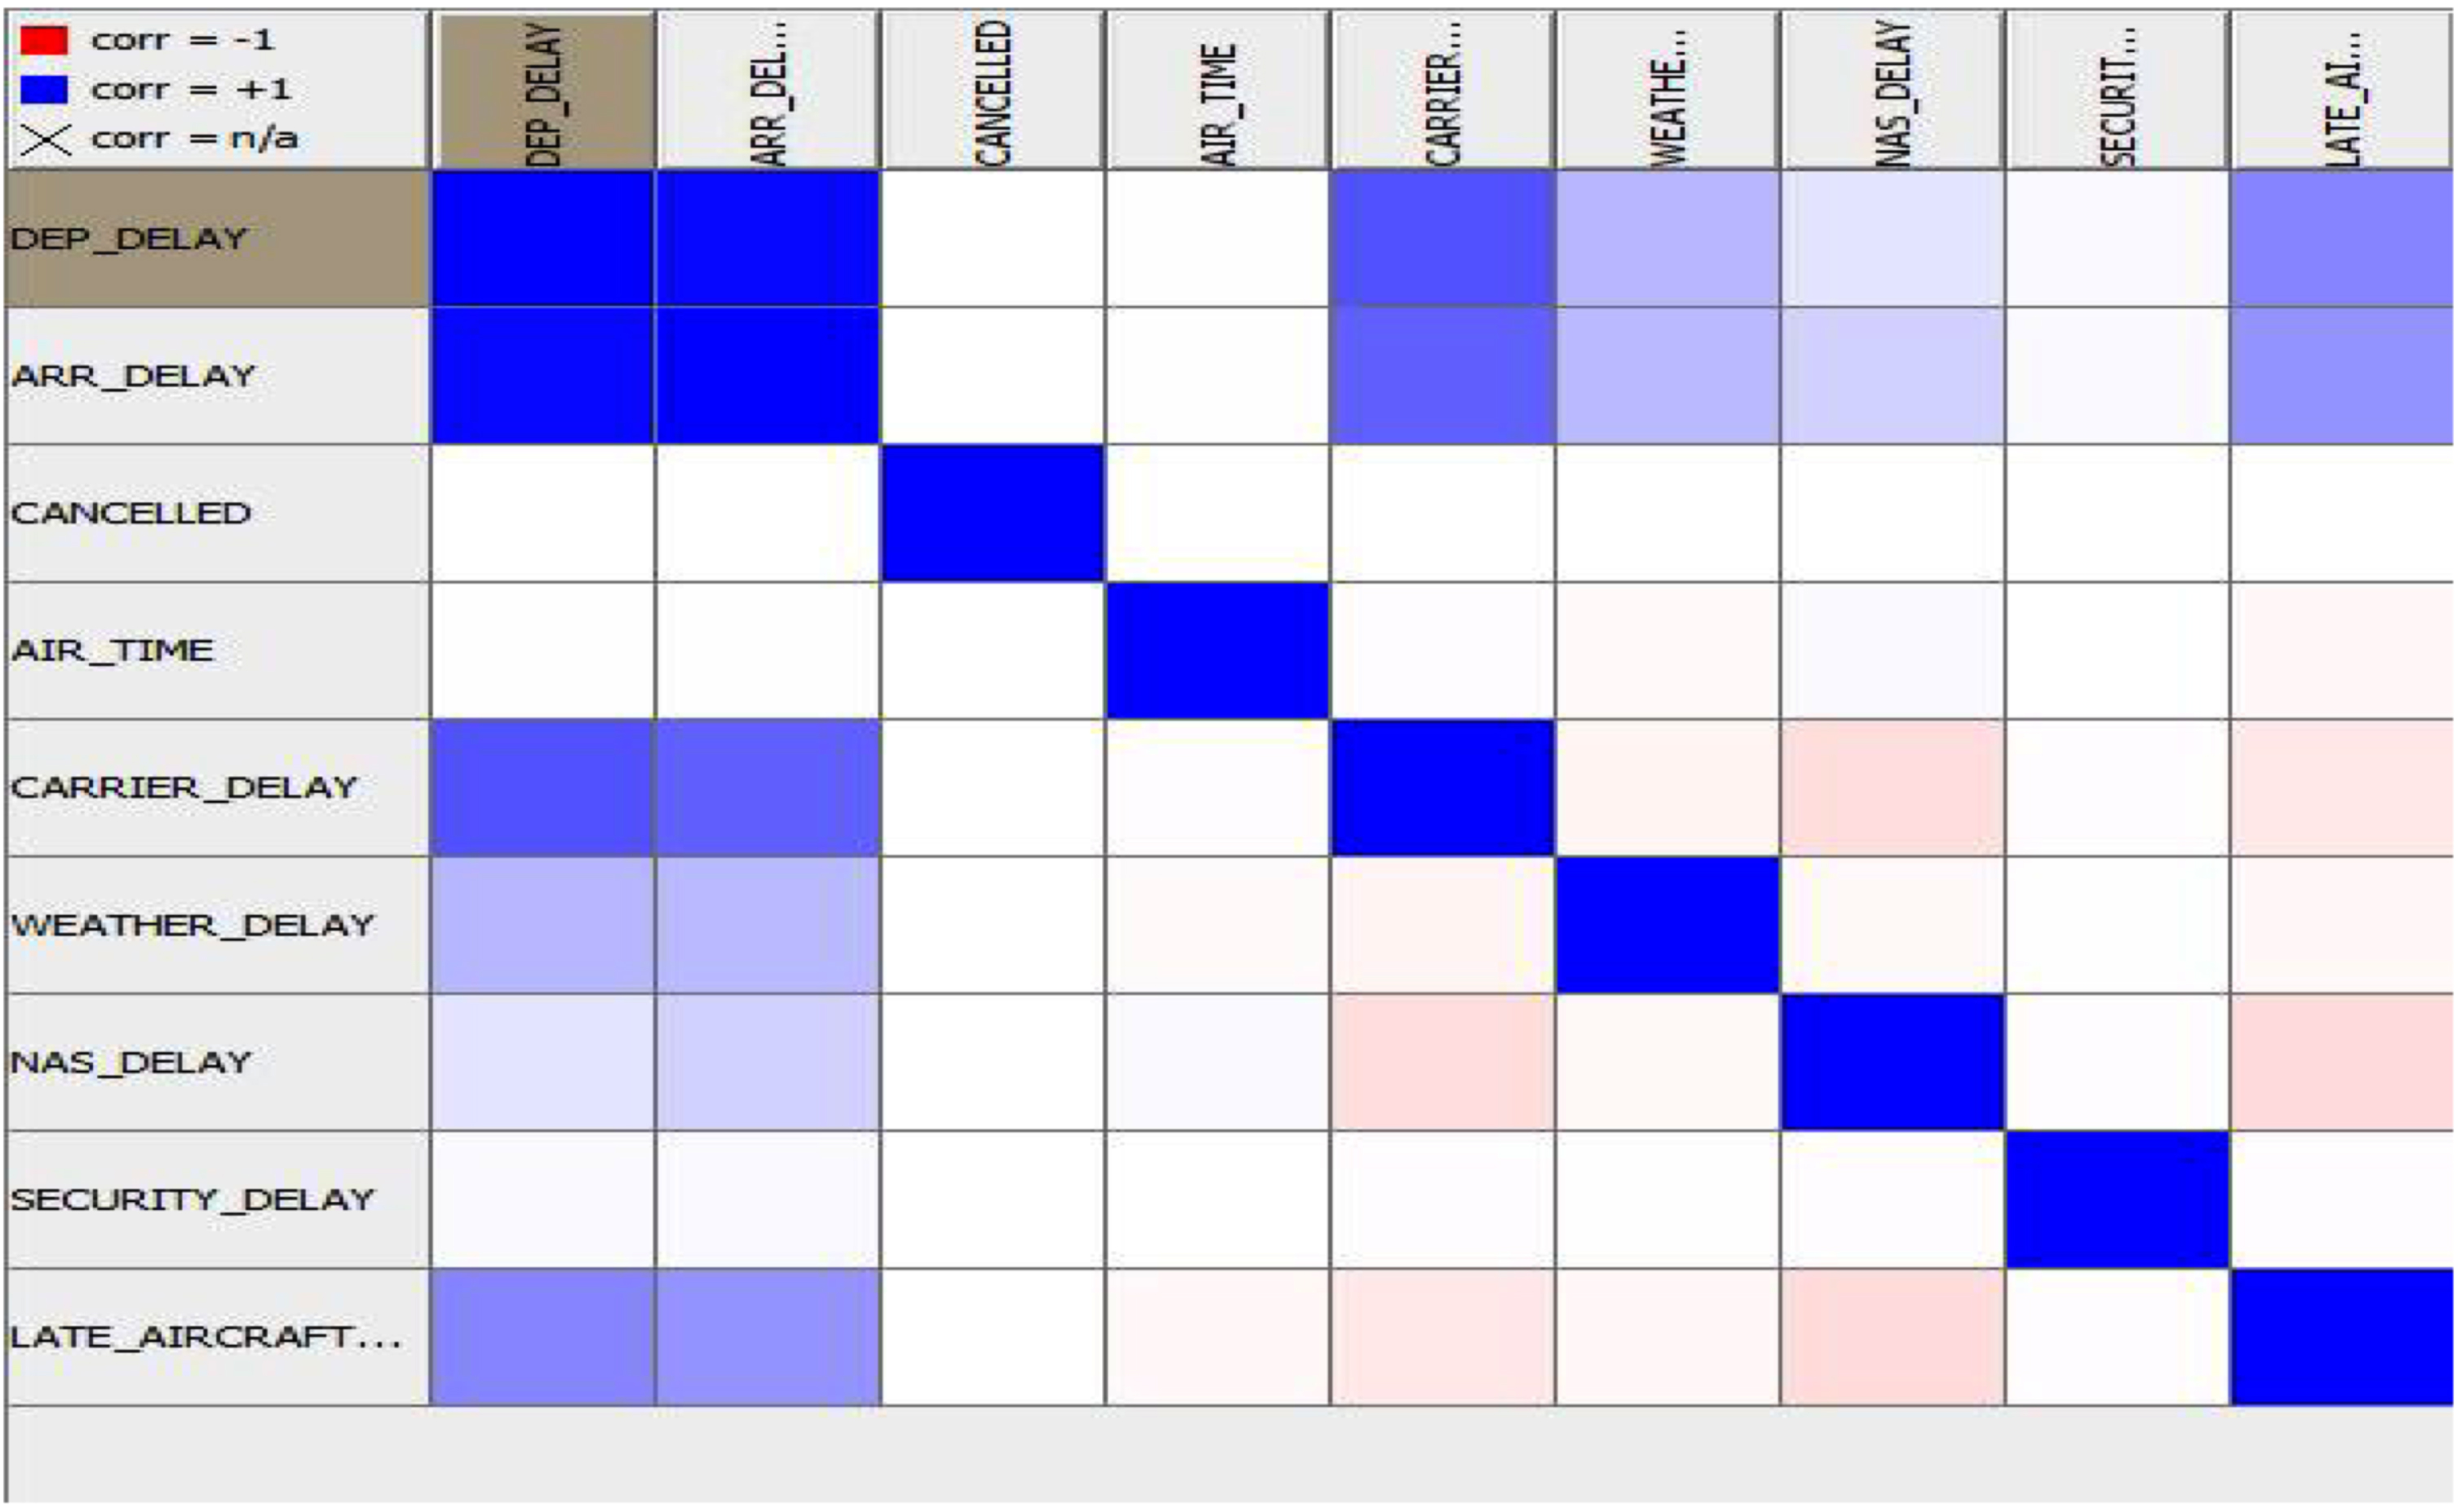
Table 13
Strength relationship / correlation of the arrival delay with related factors
| RowID | DEP_ DELAY | ARR_ DELAY | CANCELLED | AIR_ TIME | CARRIER_ DELAY | WEATHER_ DELAY | NAS_ DELAY | SECURITY_ DELAY | LATE_ AIRCRAFT_ DELAY |
| DEP_DELAY | 1.0 | 0.94 | 9.3E-4 | 0.0046 | 0.59 | 0.23 | 0.087 | 0.019 | 0.39 |
| ARR_DELAY | 0.94 | 1.0 | 3.7E-14 | –0.0046 | 0.53 | 0.21 | 0.14 | 0.016 | 0.35 |
| CANCELLED | 9.3E-4 | 3.7E-14 | 1.0 | –5.4E-14 | –5.9E-14 | –2.8E-14 | –2.6E-14 | –4.6E-15 | –2.4E-14 |
| AIR_ TIME | 0.0046 | –0.0046 | –5.4E-14 | 1.0 | –0.0069 | –0.015 | 0.018 | 6.8E-4 | –0.024 |
| CARRIER_ DELAY | 0.59 | 0.53 | –5.9E-14 | –0.0069 | 1.0 | –0.037 | –0.10 | –0.0084 | –0.069 |
| WEATHER_ DELAY | 0.23 | 0.21 | –2.8E-14 | –0.015 | –0.037 | 1.0 | –0.018 | –0.003 | –0.023 |
| NAS_ DELAY | 0.087 | 0.14 | –2.6E-14 | 0.018 | –0.10 | –0.018 | 1.0 | –0.008 | –0.11 |
| SECURITY _DELAY | 0.01 | 0.01 | –4.6E-15 | 6.8E-4 | –0.008 | –0.003 | –0.008 | 1.0 | –0.006 |
| LATE_ AIRCRAFT _DELAY | 0.39 | 0.35 | –2.4E-14 | –0.02 | –0.069 | –0.02 | –0.11 | –0.006 | 1.0 |
Table 14
Correlation with probability of the arrival delay with related factors
| First column name | Second column name | Correlation value | p value |
| DEP_DELAY | ARR_DELAY | 0.94 | 0.0 |
| DEP_DELAY | CANCELLED | 9.3E-4 | 0.12 |
| DEP_DELAY | AIR_TIME | 0.0046 | 8.4E-15 |
| DEP_DELAY | CARRIER_DELAY | 0.59 | 0.0 |
| DEP_DELAY | WEATHER_DELAY | 0.23 | 0.0 |
| DEP_DELAY | NAS_DELAY | 0.08 | 0.0 |
| DEP_DELAY | SECURITY_DELAY | 0.019 | 0.0 |
| DEP_DELAY | LATE_AIRCRAFT_DELAY | 0.39 | 0.0 |
| ARR_DELAY | CANCELLED | 3.7E-14 | 1.0 |
| ARR_DELAY | AIR_TIME | –0.0046 | 1.3E-14 |
| ARR_DELAY | CARRIER_DELAY | 0.53 | 0.0 |
| ARR_DELAY | WEATHER_DELAY | 0.21 | 0.0 |
| ARR_DELAY | NAS_DELAY | 0.14 | 0.0 |
| ARR_DELAY | SECURITY_DELAY | 0.016 | 0.0 |
| ARR_DELAY | LATE_AIRCRAFT_DELAY | 0.35 | 0.0 |
| CANCELLED | AIR_TIME | –5.47E-14 | 1.0 |
| CANCELLED | CARRIER_DELAY | –5.9E-14 | 1.0 |
| CANCELLED | WEATHER_DELAY | –2.8E-14 | 1.0 |
| CANCELLED | NAS_DELAY | –2.6E-14 | 1.0 |
| CANCELLED | SECURITY_DELAY | –4.6E-15 | 1.0 |
| CANCELLED | LATE_AIRCRAFT_DELAY | –2.48E-14 | 1.0 |
| AIR_TIME | CARRIER_DELAY | –0.006 | 4.9E-31 |
| AIR_TIME | WEATHER_DELAY | –0.015 | 8.2E-143 |
| AIR_TIME | NAS_DELAY | 0.018 | 0.0 |
| AIR_TIME | SECURITY_DELAY | 6.86E-4 | 0.25 |
| AIR_TIME | LATE_AIRCRAFT_DELAY | –0.02 | 0.0 |
| CARRIER_DELAY | WEATHER_DELAY | –0.03 | 0.0 |
| CARRIER_DELAY | NAS_DELAY | –0.10 | 0.0 |
| CARRIER_DELAY | SECURITY_DELAY | –0.008 | 2.8E-44 |
| CARRIER_DELAY | LATE_AIRCRAFT_DELAY | –0.06 | 0.0 |
| WEATHER_DELAY | NAS_DELAY | –0.018 | 2.02E-199 |
| WEATHER_DELAY | SECURITY_DELAY | –0.003 | 1.5E-7 |
| WEATHER_DELAY | LATE_AIRCRAFT_DELAY | –0.023 | 0.0 |
| NAS_DELAY | SECURITY_DELAY | –0.008 | 7.0E-49 |
| NAS_DELAY | LATE_AIRCRAFT_DELAY | –0.11 | 0.0 |
| SECURITY_DELAY | LATE_AIRCRAFT_DELAY | –0.006 | 3.1E-24 |
Based on the calculation in Tables 13-14, and Fig. 6, the following deductions are drawn for the formulated hypothesis.
H1: The departure delay of the flight is directly related to the arrival delay in the COVID 19 situations.
The null hypothesis is accepted as there is a strong relation 0.94% between the departure delay of the flight and the arrival delay in the COVID 19 situations.
H2: The air time of the flight has a positive relationship to the arrival delay in the COVID 19 situations.
The null hypothesis is rejected, as there is a minute negative relation –0.0046% of the air time with the arrival delay in the COVID 19 situations.
H3: The carrier delay of the flight is directly related to the arrival delay in the COVID 19 situations.
Accept the null hypothesis as there is significant relation 0.53% between carrier delay of the flight and the arrival delay in the COVID 19 situations.
H4: The weather delay of the flight has a positive relationship to the arrival delay in the COVID 19 situations.
Accept the null hypothesis as there is significant positive relationship between the weather delay and arrival delay in the COVID 19 situations. The relation is 0.21%.
H5: The NAS delay of the flight is directly related to the arrival delay in the COVID 19 situations.
Accept the null hypothesis as there is positive relationship between the NAS delay and arrival delay and the strength of the relation is 0.14%.
H6: The security delay of the flight has a positive relation to the arrival delay in the COVID 19 situations.
Reject the null hypothesis as the positive relation between the security delay and arrival delay is weak and its strength is 0.016%.
H7: The late aircraft delay of the flight is positively related to the arrival delay in the COVID 19 situations.
Accept the null hypothesis, as the late aircraft delay and arrival delay in the COVID 19 situations were significantly positively related and the strength of the relation 0.35%.
Figure 6 and Table 13-14, it is clear that the arrival delay has relationship with departure delay, carrier delay, Late aircraft delay, weather delay and Nas delay, respectively. The strength of relation with departure delay, carrier delay, Late aircraft delay, weather delay and Nas delay, 94%, 53%, 35%, 21%, and 14%, respectively. There was a weak negative relation (almost unrelated) with the air time and arrival delay. Security delay and arrival delay are almost unrelated with strength of 1% relationship.
Finally compare the proposed model with the models presented in the existing literature. The model is compared for MAE and RMSE with some studies (Alla et al., [36]; Zoutendijk and Mitici [39]; Yu et al., [21]). Moreover, the proposed model is compared for accuracy, precision and recall metrics with some studies (Yu et al., [21]; Bandyopadhyah et al., [40]). The Table 15 depicts that the proposed model have MAE of 2% for proposed Neural Network Regression, Decision Forest Regression, Boosted Decision Tree Regression, respectively. RMSE for Neural Network Regression, Decision Forest Regression, Boosted Decision Tree Regression are approximately, 11%, 12%, 11%, respectively. Table 15 summarizes that the proposed techniques are better than studies (Alla et al., [36]; Zoutendijk and Mitici [39]; Yu et al., [21]) in terms of MAE and RMSE. Furthermore, the Multi Class Logistic Regression is better in accuracy, precision and recall, respectively from (Yu et al., [21]; Bandyopadhyah et al., [40]). Figure 6 and Table 13-14, illustrate the relationship of the arrival delay with departure delay, carrier delay, Late aircraft delay, weather delay and Nas delay, respectively. The strength of relation with departure delay, carrier delay, Late aircraft delay, weather delay and Nas delay, 94%, 53%, 35%, 21%, and 14%, respectively. Weak negative relation (almost unrelated) with the air time and arrival delay exist. Security delay and arrival delay are almost unrelated with strength of 1% relationship.
Table 15
Comparisons of the proposed methods with literature
| Research | MAE | RMSE | Multi class logistic regression | Comparisons and conclusions |
| Proposed Research | Neural Network Regression = 0.029241 | Neural Network Regression = 0.11782 | Overall accuracy = 98.49% | Self |
| Decision Forest Regression = 0.02695 | Decision Forest Regression = 0.12487 | Macro-averaged precision = 99.14% | MAE of proposed Neural Network Regression, Decision Forest Regression, Boosted Decision Tree Regression are approximately 2%. RMSE for Neural Network Regression, Decision Forest Regression, Boosted Decision Tree Regression are approximately, 11%, 12%, 11%, respectively. | |
| Boosted Decision Tree Regression = 0.02697 | Boosted Decision Tree Regression = 0.1159 | Micro-averaged recall = 98.49% | For Multi Class Logistic Regression over all accuracy, precision and recall are 98.4%, 99.14% and 98.4%, respectively. | |
| Alla et al., [36] | MLP = 12.40 | 18.48 | MAE of the flight arrival delay of Alla et al., [36] are 12%, 16% and 19% for MLP, Decision Tree and Gradient Boosting, respectively. | |
| Decision Tree = 16.97 | 26.25 | RMSE of the flight arrival delay of [36] are 18.48%, 26.25% and 29.93% for MLP, Decision Tree and Gradient Boosting, respectively. | ||
| Gradient Boosting = 19.34 | 29.93 | MAE of proposed Neural Network Regression, Decision Forest Regression, Boosted Decision Tree Regression are approximately 2%. RMSE for Neural Network Regression, Decision Forest Regression, Boosted Decision Tree Regression are approximately, 11%, 12%, 11%, respectively. Depicts that the MAE and RMSE are better than Alla et al., [36]. | ||
| Zoutendijk and Mitici [39] | Mixture Density Network = 15.62 | Mixture Density Network = 24.98 | MAE for the Flight Delay for Mixture Density Network and Random Forest Regression are 15.62 and 14.99 respectively. | |
| Random Forest Regression = 14.99 | Random Forest Regression = 24.39 | RMSE for the Flight Delay for Mixture Density Network and Random Forest Regression are 24.98 and 24.39, respectively. | ||
| MAE of proposed Neural Network Regression, Decision Forest Regression, Boosted Decision Tree Regression are approximately 2%. RMSE for Neural Network Regression, Decision Forest Regression, Boosted Decision Tree Regression are approximately, 11%, 12%, 11%, respectively. Depicts that the MAE and RMSE are better than Zoutendijk and Mitici [39]. | ||||
| Bandyopadhyah et al., [40] | Accuracy GRU = 98.7% | Long-short term memory (LSTM) Gated Recurrent Unit (GRU) | Bandyopadhyah et al.,[40] accuracy of GRU and MLP are, 98.7% and 97.3%, respectively. | |
| Accuracy MLP = 97.3% | For proposed Multi Class Logistic Regression over all accuracy, precision and recall are 98.4%, 99.14% and 98.4%, respectively. Thus proposed model is better than Bandyopadhyah et al., [40]. | |||
| Lambelho et al., [26] | Accuracy = 79.1% | Lambelho et al., [26] accuracy, precision and recall are 79.1%, 56% and 55%, respectively. | ||
| Precision = 56% | For proposed Multi Class Logistic Regression over all accuracy, precision and recall are 98.4%, 99.14% and 98.4%, respectively. | |||
| Recall = 55% | Thus proposed model is better than Lambelho et al., [26]. | |||
| Yu et al., [21] | Deep belief network-Support Vector Regressor (DBN-SVR) = 8.4 | RMSE 12.65 16.01 16.15 20.20/ | MAE for flight delay prediction for DBN-SVR, kNN, SVM, and LR are 8.4%, 11.96%, 12.04%, and 15.56%, respectively. | |
| k- nearest neighbour k-NN = 11.96 | RMSE for flight delay prediction for DBN-SVR, kNN, SVM, and LR are 12.65%, 12.01%, 16.15%, and 20.20%, respectively. | |||
| SVM = 12.04 | MAE of proposed Neural Network Regression, Decision Forest Regression, Boosted Decision Tree Regression are approximately 2%. RMSE for Neural Network Regression, Decision Forest Regression, Boosted Decision Tree Regression are approximately, 11%, 12%, 11%, respectively. Depicts that the MAE and RMSE are better than Yu et al., [21]. | |||
| Linear Regression LR = 15.56 |
The proposed research can be extended in many directions. It can be extended to predict flight delays in other disrupted situations. AI based Flight delay predictions can be implemented in situations such as floods, snowfall, earthquake, winds, hurricane, blizzards and agitated weather conditions. Moreover, the various air transport issues can be addressed using the techniques of the artificial intelligence and machine learning. For example airline revenue maximization, security checking, on-time operations, air traffic prediction, flight to gate assignment, crew scheduling, fleet scheduling, and flight operations.
10Conclusions
Artificial intelligence techniques namely neural network regression, decision forest regression, boosted decision tree regression and multi class logistic regression are used for airline flight delay prediction. The performances of all the methods used are satisfactory. The mean absolute error of the boosted decision tree and decision forest regression is 0.02697. The coefficient of determination for the neural network regression is 0.86 and for decision forest regression is 0.85, respectively. The coefficient of determination for the boosted decision tree is 0.870984. This shows that 87% of the variations in the arrival delay are explained by the model. Thus the performance of the boosted decision tree regression is better. Multi class logistic regression gives an overall accuracy and precision of 98.4%. Recalling/remembering performance is 99%. Thus multi class logistic regression is the best prediction model for prediction of flight delays in the COVID-19 situations. The confusion matrix for the multi class logistic regression shows that 87.2% flights which are not delayed and predicted not delayed by the proposed model. The flights which are actually not delayed but wrongly predicted as delayed by the model are 12.7%. The proposed models have MAE of 2% for proposed Neural Network Regression, Decision Forest Regression, Boosted Decision Tree Regression, respectively. RMSE for Neural Network Regression, Decision Forest Regression, Boosted Decision Tree Regression are approximately, 11%, 12%, 11%, respectively. The strength of relation with departure delay, carrier delay, Late aircraft delay, weather delay and Nas delay, 94%, 53%, 35%, 21%, and 14%, respectively. There is a weak negative relation (almost unrelated) with the air time and arrival delay. Security delay and arrival delay are almost unrelated with strength of 1% relationship. The research can be extended in many directions in future. Possible future proposals may be the flight delays prediction in agitated weather conditions for example heavy snow, flood, hurricane, blizzards, and naturally disrupted situations. New methods can be applied to explore dynamics of the system. The model can be extended for coordinated delays. The future models can address the uninformed situations such as storms, strikes, security breaches. Alternative flight plans should be sorted out for future scheduling in disruptions.
Acknowledgments
We thank the respectable reviewers and editors for their reviews and suggestions.
Compliance with Ethical Standards:
Funding
This study was funded by no agency / grant.
Ethical approval
The article does not contain any studies with human participants performed by any of the authors.
Conflict of interest
The authors declare that they have no conflict of interest.
Informed consent
The research does not involve any treatment performed on human participants / animals.
Authorship contributions
Faiza
Write up, programming, literature review, results and discussions, and presentation.
Khairir Khalil
Guiding, suggestions, improvements, supervision and reviews.
Data availability statement
The data can be provided on reasonable demand. For more information check Kaggle (2020) and Bureau of Transportation Statistics (2021).
References
[1] | Times N.Y. , Coronavirus travel restrictions, across the globe, (2020), Available from: https://www.nytimes.com/article/coronavirus-travel-restrictions.html |
[2] | Worldatlas. (2020), Which countries in mandatory lock-down due to COVID-19?, Available From: https://www.worldatlas.com/which-countries-are-in-mandatory-lockdown-due-to-covid-19.html |
[3] | U.D.O. State, (2020), Global level 4 health advisory - do not travel, Available From, https://travel.state.gov/content/travel/en/traveladvisories/ea/travel-advisory-alert-globallevel-4-health-advisory-issue.html |
[4] | U.S Customs and Border Protection. (2020), Airport wait times, Available from: https://awt.cbp.gov |
[5] | Monmousseau P. , Marzuoli A. , Bosson C. , Feron E. and Delahahe D. , Doorway to the United States: an exploration of customs and border protection data, IEEE/AIAA 38th Digital Avionics Systems Conference (DASC). (2019). DOI: 10.1109/DASC43569.2019.9081692 |
[6] | Namilae S. , Srinivasan A. , Mubayi A. , Scotch M. and Pahle R. , Self-propelled pedestrian dynamics model: Application to passenger movement and infection propagation in airplanes, Physica A: Statistical Mechanics and its Applications 465: ((2017) ), pp. 248–260. |
[7] | Chinazzi M. , Davis J.T. , Ajelli M. , Gioannini C. , Litvinova M. , Merler S. , Pastore Y.P.A. , Rossi L. , Sun K. , Viboud C. , Xiong X. , Yu H. , Halloran M.E. , Longini I.M. Jr. and Vespingnani A. , The effect of travel restrictions on the spread of the novel coronavirus (COVID-19) outbreak, Science 368: (6489) ((2020) ), pp. 395–400. |
[8] | Sobieralski J.B. , COVID-19 and airline employment: Insights from historical uncertainty shocks to the industry, Transportation Research Interdisciplinary Perspective 5: ((2020) ), Article No. 100123. |
[9] | Business Insider France. (2020), Airlines are burning thousands of gallons of fuel flying empty ‘ghost’ planes so they can keep their flight slots during the coronavirus outbreak, Available from: https://www.businessinsider.fr/us/coronavirus-airlines-run-empty-ghost-flights-planes-passengers-outbreak-covid-2020-3 |
[10] | C.O.T.U.S.O. America, Coronavirus Aid, Relief, and Economic Security (CARES) Act (2020), (H.R. 748, Public Law 116-136), Available from: https://www.congress.gov/116/bills/hr748/BILLS-116hr748 |
[11] | Truong D. , Estimating the impact of COVID-19 on air travel in the medium and long term using neural network and Monte Carlo simulation, Journal of Air Transport Management 96: ((2021) ), 102126. |
[12] | Seok B.W. , Wee K. , Park J. , Kumar D.A. and Reddy N.S. , Modeling the teacher job satisfaction by artificial neural networks, Soft Computing 25: ((2021) ), pp. 11803–11815. https://doi.org/10.1007/s00500-021-05958-023 |
[13] | Britto R. , Dresner M. and Voltes A. , The impact of fight delays on passenger demand and societal welfare, Transp Res Part E Logist Transp Rev 48: ((2012) ), 460–469. |
[14] | Chen Z. , Wanke P. , Antunes J.J.M. and Zhang N. , Chinese airline efciency under co2 emissions and fight delays: a Stochastic network dea model, Energy Econ 68: ((2017) ), pp. 89–108. |
[15] | Zhixing T. , Shan H. and Songchen H. , Recent Progress about Flight Delay under Complex Network, Complixity 2021: ((2021) ), Article ID 5513093. |
[16] | Wang Y. , Zheng H. , Wu F. , Chen J. and Hansen M. , A Comparative Study on Flight Delay Networks of the USA and China, Journal of Advanced Transportation 2020: ((2020) ), Article ID 1369591. |
[17] | Zhou F. , Jiang G. , Lu Z. and Wang Q. , Evaluation and Analysis of the Impact of Airport Delays, Scientific Programming 2022: ((2022) ), Article ID 7102267. |
[18] | Tu Y. , Ball M.O. and Jank W.S. , Estimating flight departure delay distributions—A statistical approach with long-term trend and short-term pattern, J Am Stat Assoc 103: ((2008) ), pp. 112–125. |
[19] | Rebollo J.J. and Balakrishnan H. , Characterization and prediction ofair traffic delays, Transportation Research Part C: EmergingTechnologies 44: ((2014) ), pp. 231–241. |
[20] | Rodŕýguez-Sanz A. , Comendador F.G. , Valdés R.A. , Pérez-Castán J. , Montes R.B. and Serrano S.C. , Assessment ofairport arrival congestion and delay: prediction and reliability, Transportation Research Part C: Emerging Technologies 98: (2019), pp. 255–283. |
[21] | Yu B. , Guo Z. , Asian S. , Wang H. and Chen G. , Flight delay prediction for commercial air transport: a deep learning approach, Transportation Research Part E: Logistics and Transportation Review 125: ((2019) ), pp. 203–221. |
[22] | Kalliguddi A.M. and Leboulluec A.K. , Predictive Modeling of Aircraft Flight Delay, Univers J Manag 5: ((2017) ), pp. 485–491. |
[23] | Ding Y. , Predicting flight delay based on multiple linear regression, IOP Conf. Series: Earth and Environmental Science 81: ((2017) ), Article I.D, 012198. |
[24] | Kenan N. , Jebali A. and Diabat A. , The integrated aircraft routing problem with optional flights and delay considerations, Transportation Research Part E: Logistics and Transportation Review 118: ((2018) ), pp. 355–375. |
[25] | Gui G. , Liu F. , Sun J. , Yang J. , Zhou Z. and Zhao D. , Flight delay prediction based on aviation big data and machine learning, IEEE Trans Veh Technol 69: ((2019) ), pp. 140–150. |
[26] | Lambelho M. , Mitici M. , Pickup S. and Marsden A. , Assessing strategic flight schedules at an airport using machine learning-based flight delay and cancellation predictions, J Air Transp Manag 82: ((2020) ), 101737. |
[27] | Stefanovic P. , Strimaitis R. and Kurasova O. , Prediction of flight time deviation for lithuanian airports using supervised machine learning model, Computational Intelligence and Neuroscience 2020: ((2020) ), Article ID 8878681, pp. 10. |
[28] | Yazdi M.F. , Kamel S.R. , Chabok S.J.M. and Kheirabadi M. , Flight delay prediction based on deep learning and Levenberg-Marquart algorithm, Journal of Big Data 7: ((2020) ), 106, pp. 1–28. |
[29] | Baspinar B. and Koyuncu E. , A data-driven air transportation delay propagation model using epidemic process models, Int J Aerospace Eng 2016: ((2016) ), Article ID 4836260. |
[30] | Nowzari C. , Preciado V.M. and Pappas G.J. , Analysis and control of epidemics: a survey of spreading processes on complex networks, IEEE Control Syst Mag 36: ((2016) ), pp. 26–46. |
[31] | Perotti J.I. , Jo H.H. , Holme P. and Saramäki J. , Temporal network sparsity and the slowing down of spreading, Corenell Univesity, (2014), https://doi.org/10.48550/arXiv.1411.5553 |
[32] | Mou J. , Liu C. , Chen S. , Huang G. and Lu X. , Temporal characteristics of the Chinese aviation network and their effects on the spread of infectious diseases, Sci Rep 7: ((2017) ), pp. 1–9. |
[33] | Bussell E.H. , Dangerfeld C.E. , Gilligan C.A. and Cunnife N.J. , Applying optimal control theory to complex epidemiological models to inform real-world disease management, Philos Trans R Soc B 374: ((2019) ), 20180284. |
[34] | Alamo o. , Reina D.G. , Gata P.M. , Preciado V.M. and Giordano G. , Data-driven methods for present and future pandemics: Monitoring, modelling and managing, Annual Reviews in Control 52: ((2021) ), pp. 448–464. |
[35] | Li S. , Xie D. , Zhang X. , Zhang Z. and Bai W. , Data-Driven Modeling of Systemic Air Traffic Delay Propagation: An Epidemic Model Approach, Journal of Advanced Transportation, (2020), Article ID, 8816615. |
[36] | Alla H. , Moumoun L. and Balouki Y. , A multilayer perceptron neural network with selective-data-training for flight arrival delay prediction, Scientific Programming 2021: ((2021) ), Article No, 5558918. |
[37] | Zeng W. , Li J. , Quan Z. and Lu X. , A deep graph-embedded LSTM neural network approach for airport delay prediction, Journal of Advanced Transportation 2021: ((2021) ), Article ID 6638130. |
[38] | Niu X. , Jiang C. , Gao J. , Korniss G. and Szymanski B.K. , From datato complex network control of airline flight delays, Scientific Reports 11: ((2021) ), Article ID 18715. |
[39] | Zoutendijk M. and Mitici M. , Probabilistic flight delay predictions using machine learning and applications to the flight-to-gate assignment problem, Aerospace 8: (152), 2021. |
[40] | Bandyopadhyah S.K. , Goyel V. and Dutta S. , Prediction of air flight cancellation during COVID-19 using deep learning methods, Science Open (2020), 10.14293/S2199-1006.1.SOR-.PPB0TJS.v1. |
[41] | Bratu S. and Barnhart C. , An analysis of passenger delays using flight operations and passenger booking data, Air Traffic Control Quarterly 13: (1) ((2005) ), pp. 1–27. |
[42] | Bratu S. and Barnhart C. , Flight operations recovery: New approaches considering passenger recovery’, Journal of Scheduling 9: (3) ((2006) ), pp. 279–298. |
[43] | Wang D. , Sherry L. and Donohue G. , Passenger trip time metric for air transportation, In: The 2nd International Conference on Research in Air Transportation, (2006), 2006. |
[44] | Wang D. , Methods for analysis of passenger trip performance in a complex networked transportation system, PhD Thesis, George Mason University, (2007), Publication No. |
[45] | Gawdiak Y.O. and Diana T. , Next Gen Metrics for the Joint Planning and Development Office, In 11th AIAA Aviation Technology, Integration, and Operations (ATIO) Conference, including the AIAA Balloon Systems Conference and 19th AIAA Lighter-Than 2011: ((2011) ). |
[46] | Darecki M. , et al., Flightpath Europe’s vision for aviation, Fiona McFadden, High level group on aviation research 2011: ((2011) ). |
[47] | Cook A. , Tanner G. , Cristobal S. and Zanin M. , Passenger oriented enhanced metrics, Second SESAR Innovation Days, 27th -29th November, (2012). 2012. |
[48] | Kim S.H. , Marzuoli A. , Clarke J. , Delahaye D. and Feron E. , Airport gate scheduling for passengers, aircraft, and operation, Tenth USA/Europe Air Traffic Management Research and Development Seminar (ATM2013) 2013: ((2013) ). |
[49] | Marzuoli A. , Laplace I. and Féron E. , META-CDM: Multimodal, efficient transportation in airports and collaborative decision making, 4th International Air Transport and Operations Symposium, Toulouse, France, (2013). |
[50] | Dray L. , Marzuoli A. and Evans A. , Air transportation and multimodal, collaborative decision making during adverse events, In Eleventh USA/Europe Air Traffic Management Research and Development Seminar (ATM2015) 2015: ((2015) ). |
[51] | EUROCONTROL and FAA, (2013), Comparison of air traffic management-related operational performance: US/Europe, 2014, EUROCONTROL and FAA Washington/Brussels. |
[52] | Lemer A.C. , Measuring performance of airport passenger terminals, Transportation Research A: Policy and Practice 26: (1) ((1992) ), pp. 37–45. |
[53] | Tsaur S. , Chang T. and Yen C. , The evaluation of airline service quality by fuzzy MCDM, Tourism Management 23: (2) ((2002) ), 107–115. |
[54] | Hunter J.A. , A correlational study of how airline customer service and consumer perception of airline customer service affect the air rage phenomenon, Journal of Air Transportation 11: (3) ((2006) ), pp. 78–109. |
[55] | De-Oña J. and De-Oña J. , Quality of service in public transport based on customer satisfaction surveys: A review and assessment of methodological approaches, Transportation Science 49: (3) ((2015) ), pp. 605–622. |
[56] | Pakdil F. and Aydın O. , Expectations and perceptions in airline services: An analysis using weighted SERVQUAL scores, Journal of Air Transport Management 13: (4) ((2007) ), 229–237. |
[57] | Nikoue H. , Marzuoli A. , Clarke J.P. , Feron E. and Peters J. , Passenger flow predictions at Sydney international airport: a data-driven queuing approach, (2015), ArXiv. |
[58] | Huang W. , Lin Y. , Lin B. and Zhao L. , Modeling and predicting the occupancy in a China hub airport terminal using Wi-Fi data, Energy and Buildings 203: ((2019) ), pp. 109439. |
[59] | Heuvel J.V. , Ton D. and Hermansen K. , Advances in Measuring Pedestrians at Dutch Train Stations Using Bluetooth, WiFi and Infrared Technology, In Traffic and Granular Flow’15, Springer (2016), pp. 11–18. |
[60] | García-Albertos P. , Ros O.G. and Herránz R. , Understanding door-to-door travel times from opportunistically collected mobile phone records, A Case Study of Spanish Airports 2017. |
[61] | Marzuoli A. , Monmousseau P. and Féron E. , Passenger-centric metrics for Air Transportation leveraging mobile phone and Twitter data, In 2018 IEEE International Conference on Data Mining Workshops (ICDMW). 2018, Singapore. (2018). |
[62] | Marzuoli A. , Boidot E. , Féron E. and Srivastava A. , Implementingand validating air passenger–centric metrics using mobilephone data, Journal of Aerospace Information Systems 16: (4) ((2019) ), pp. 132–147. |
[63] | Kaggle, (2020), Starter: Covid-19 Airline Flight Delays 5c3b1e9a-3. (2020). Available From: Starter: COVID-19 Airline Flight Delays 5c3b1e9a-3 | Kaggle. |
[64] | Bureau of Transportation Statistics. (2021), COVID-19 Related Transportation Statistics. (2021), Available From: COVID-19 Related Transportation Statistics | Bureau of Transportation Statistics (dot.gov). |
[65] | Hagan M.T. , Demuth H.W. , Beale M.K. and De-Jesus O. , Neural Network Design, 2nd Edition, Martin Hagan, (2014), pp. 2.10–.2.23. |
[66] | Lee W.M. , Python Machine Learning, JohnWiley and Sons, Inc. (2019). |
[67] | Vortarus T. , (2022), Simulation vs. Machine Learning, Available from: Simulation vs. Machine Learning -Vortarus Technologies. |
[68] | Surana S. , (2022), Computational Complexity of Machine Learning Models - II | Data Science and Machine Learning | Kaggle, Accessed [27-11-2022]. |


