
Artificial intelligence effectively predicts the COVID-19 death rate in different UK cities
Abstract
The emergence of a new variant of SARS-CoV-2 in the UK that is spreading more rapidly has raised great concerns not only in the UK but also whole Europe and other parts of the globe. The newly identified variant of SARS-CoV-2 that is reported to be more contagious has prompted many countries to ban travel to and from the UK. As of April 2, 2021, nearly 4.35 million confirmed cases of coronavirus (COVID-19) have been reported in the UK out of which more than 127,000 people have died. These numbers reveal a need for predictor models to assist with management, prevention, and treatment decisions. Here, we presented an Artificial Intelligence (AI) model to predict the death rate in various cities of the United Kingdom. Training and testing the model using the data available on the European data portal showed promising results with predicted R2 = 0.88.
1Introduction
Experience COVID-19 was first reported in early December 2019 in Wuhan, the capital of Hubei Province in the People’s Republic of China [1]. In the UK, On January 22, 2020, the first news report on the novel coronavirus was published by Public Health England (PHE). One day later, on January 23, 2020, the Emergency Department of the Royal London Hospital tested its first patient who was suspected to be infected by SARS-CoV-2 [2]. On 29th January, the first officially confirmed COVID-19 case was reported in the UK [3]. It is known that the sooner the measures are put in place to limit the transmission of a viral infection amid a pandemic such as COVID-19, the less would be the total number of infected people and the concomitant morbidity and mortality. However, reports show that lockdown measures in the UK were put in place too late to alleviate the rapid transmission of the infection [4]. It has been claimed that if the lockdown in the UK had started two weeks earlier, the epidemic suppression could have begun with less than 5% of the infections occurred by March 23, and the majority of the COVID-19 deaths might have been prevented [5]. Reports are claiming that UK has failed in its approach of effective managing of COVID-19 [3].
Now, almost everywhere, dramatic changes in people’s daily lives can be observed due to key factors such as social isolation and universal quarantining [6]. SARS-CoV-2 can infect new people by both human-to-human contact and touching contaminated surfaces or objects. While the incubation period of COVID-19 is around 3 to 7 days, it can be over 3 weeks [7]. As of April 2, 2021, the COVID-19 pandemic caused more than 283 million deaths. Now, 130 million confirmed COVID-19 cases are reported worldwide. The emergence of a new variant of SARS-CoV-2 in the UK that is spreading more rapidly has raised great concerns not only in UK but also whole Europe and other parts of the globe. As the newly identified variant of SARS-CoV-2 is reported to be more contagious, now many countries have banned travel from the UK. As of April 2, 2021, nearly 4.35 million confirmed cases of coronavirus (COVID-19) have been reported in the UK out of which more than 127,000 people have died.
2Related works
New Findings show that Artificial Intelligence (AI) can be used as an effective tool in the worldwide fight against the pandemic caused by SARS-CoV-2, the virus that causes COVID-19 [8]. Using chest X-ray images, deep learning models have previously been used as fast and accurate methods to detect COVID-19 [9]. Moreover, an automatic prediction system for COVID-19 that uses deep feature maps from the chest CT scans has been developed that not only detects COVID-19 but also predicts its severity [10]. AI can also be recognized as a tool for predicting whether new confirmed cases will progress to acute respiratory distress syndrome (ARDS) or not. Moreover, Mortazavi et al. have previously reported that AI techniques might help employers choose non-vulnerable workers for positions with the highest possible levels of exposure to the virus [11]. They stated that such an AI-based tool can be utilized in several workplaces including reception desks, shops’ cashiers, libraries, banks, and pharmacies to reduce the risk of severe COVID-19 infections in employees and to ensure the labor force safety as well as to ensure the businesses and jobs sustainability [11]. In the current paper, we introduce an AI tool to predict the death rate in different cities of the UK using the European data portal including many different medical, biological, ethnical, and economical features that can be considered relevant to covid-19.
3Methods
As with any AI-based prediction method, the developing process consists of three major steps: data collection, dimension reduction, and model development. Following is a description of each step.
3.1Data collection
We used the public death rate data in different cities of the United Kingdom from the European data portal. This data set includes various medical, biological, ethnical, and socio-economic and lifestyle features that may be relevant to covid19 death rate in different cities. This data set and complementing description are available from the European data portal.
In terms of features, we used five categories of initial features:
1. Occupation.
All estimates of the number of people in each occupation were from the 2011 Census.
Proportion_at_risk_jobs: We defined an occupation as at-risk using data published on 11/05/2020 by ONS, which provides all occupations, using 4-digit Standard Occupational Classification codes, with a score indicating how closely those occupations work to others. The score ranges from 0 –not near people, to 100 –touching. Any occupation with a proximity score over 72 is defined here as being at-risk.
Insecure_proportion: Insecure occupations are defined at the UK level by calculating the proportion of all employed in each 3-digit Standard Occupational Classification code who are employed on an insecure basis. Those occupations with more than 10 percent insecure workforce are classified as an insecure occupation. The GLA defines insecure employment as having a job with a temporary contract, either working through an employment company or self-employed in Standard Occupational Classification major groups 6, 8, or 9.
2. Population_age
Total_population_mid_2018: Estimated total usually resident population from ONS’s mid-2018 Small Area Population Estimates
Over_70_prop: Proportion of the population over age 70 at mid-2018
3. Ethnic group Note: All estimates of ethnic group are from the 2011 Census.
All_bame_prop: Proportion of the population which is BAME
All_black_prop: Proportion of the population which has a Black ethnicity
Pakistani_or_bangladeshi_prop: Proportion of the population that has a Pakistani or Bangladeshi ethnicity
All_indian_prop: Proportion of the population which is of Indian ethnicity
4. Child poverty
Child_poverty_prop: the proportion of under-16 s estimated to live in households with a household income of less than 60% of the median.
5. Medical_conditions
Hypertension: Estimated proportion of individuals with established hypertension, as recorded on practice disease registers.
Obesity (18+): Estimated proportion of individuals aged≥18 y with a body mass index (BMI) of 30 or above.
Diabetes: Estimated proportion of patients aged≥17 y with diabetes mellitus.
Asthma: Estimated proportion of individuals with asthma, excluding the patients prescribed medications not related to asthma over the past 12 months.
Coronary heart disease: Estimated proportion of patients on the coronary heart disease (CHD) registe
3.2Dimension reduction
In this step, we aimed to remove the irrelevant variables. Selecting a subset of variables or predictors which could be used in the predictive model construction was another objective. To simplify the model, fasten the process of training, avoid the curse of dimensionality, improve generalization or in other words improve the model’s ability to predict the output for new data, and finally, to make the model simpler to interpret and understand by all users, feature selection should be used.
Here, we employed a backward elimination method which starts with the full set of features and then at each iteration removes the least significant variable which improves the performance of the model. The significance of variables is calculated using mean decrease impurity. This process is repeated until either no improvement is observed or the performance of the classifier starts to decrease. Ultimately 9 features out of all 13 features were selected.
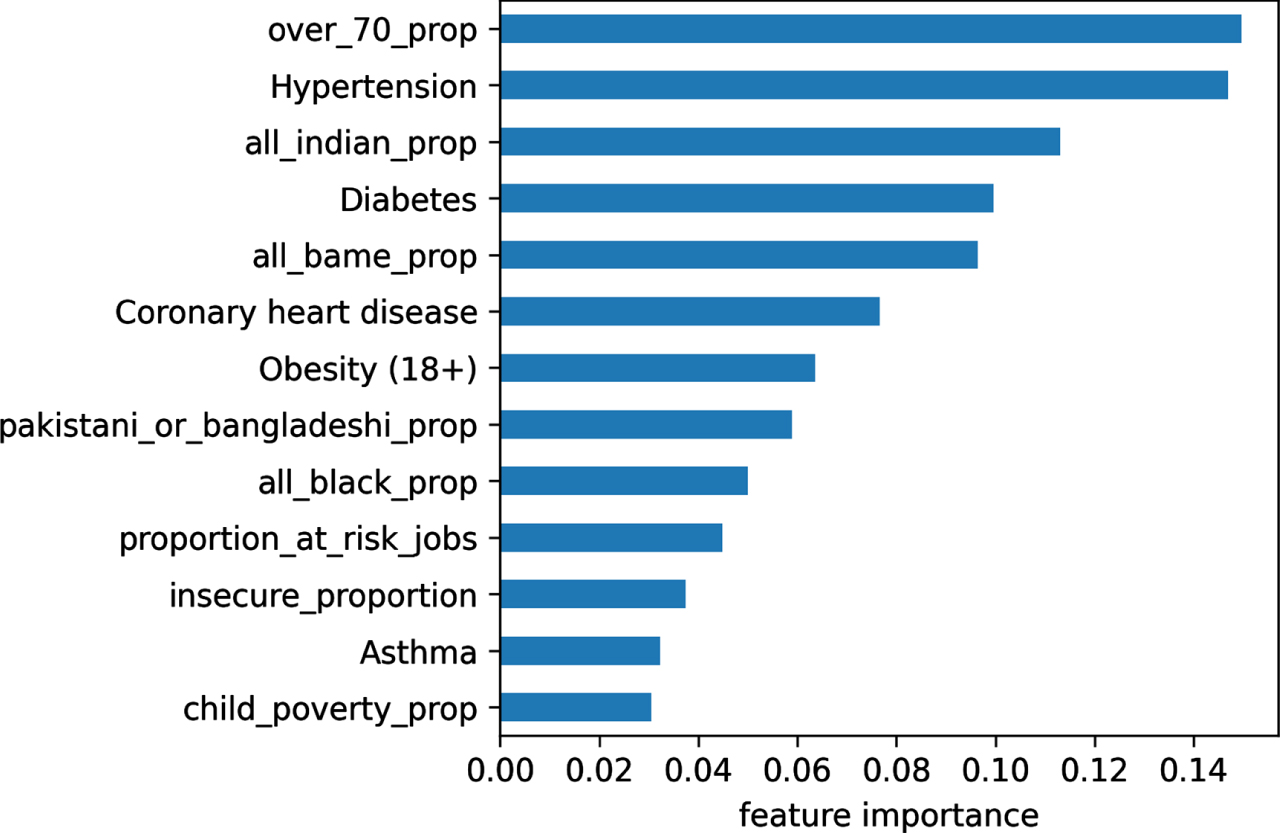
The initial feature importance is shown in the Fig. 1:
Fig. 1
The initial importance of the features used in the AI-based prediction model.
3.3Model development
Two machine learning techniques were examined: random forest regressor (RFR) and xGboost. These models were used due to their robustness and reliability. Considering limited details of these two methods were not provided here as such information can be found elsewhere [12, 13].
Due to different populations in different regions, we used the population of each region as the weight of each sample. Furthermore, we used randomized search and internal cross-validation to optimize different hyperparameters of the RFR, including ‘max depth’, ‘max features’, ‘min sample leaf’, ‘mean sample split’, and ‘number of estimators. The same procedure was used in developing the parameters of the xGboost models including ‘lambda’, ‘subsample’, gamma’.
4Results
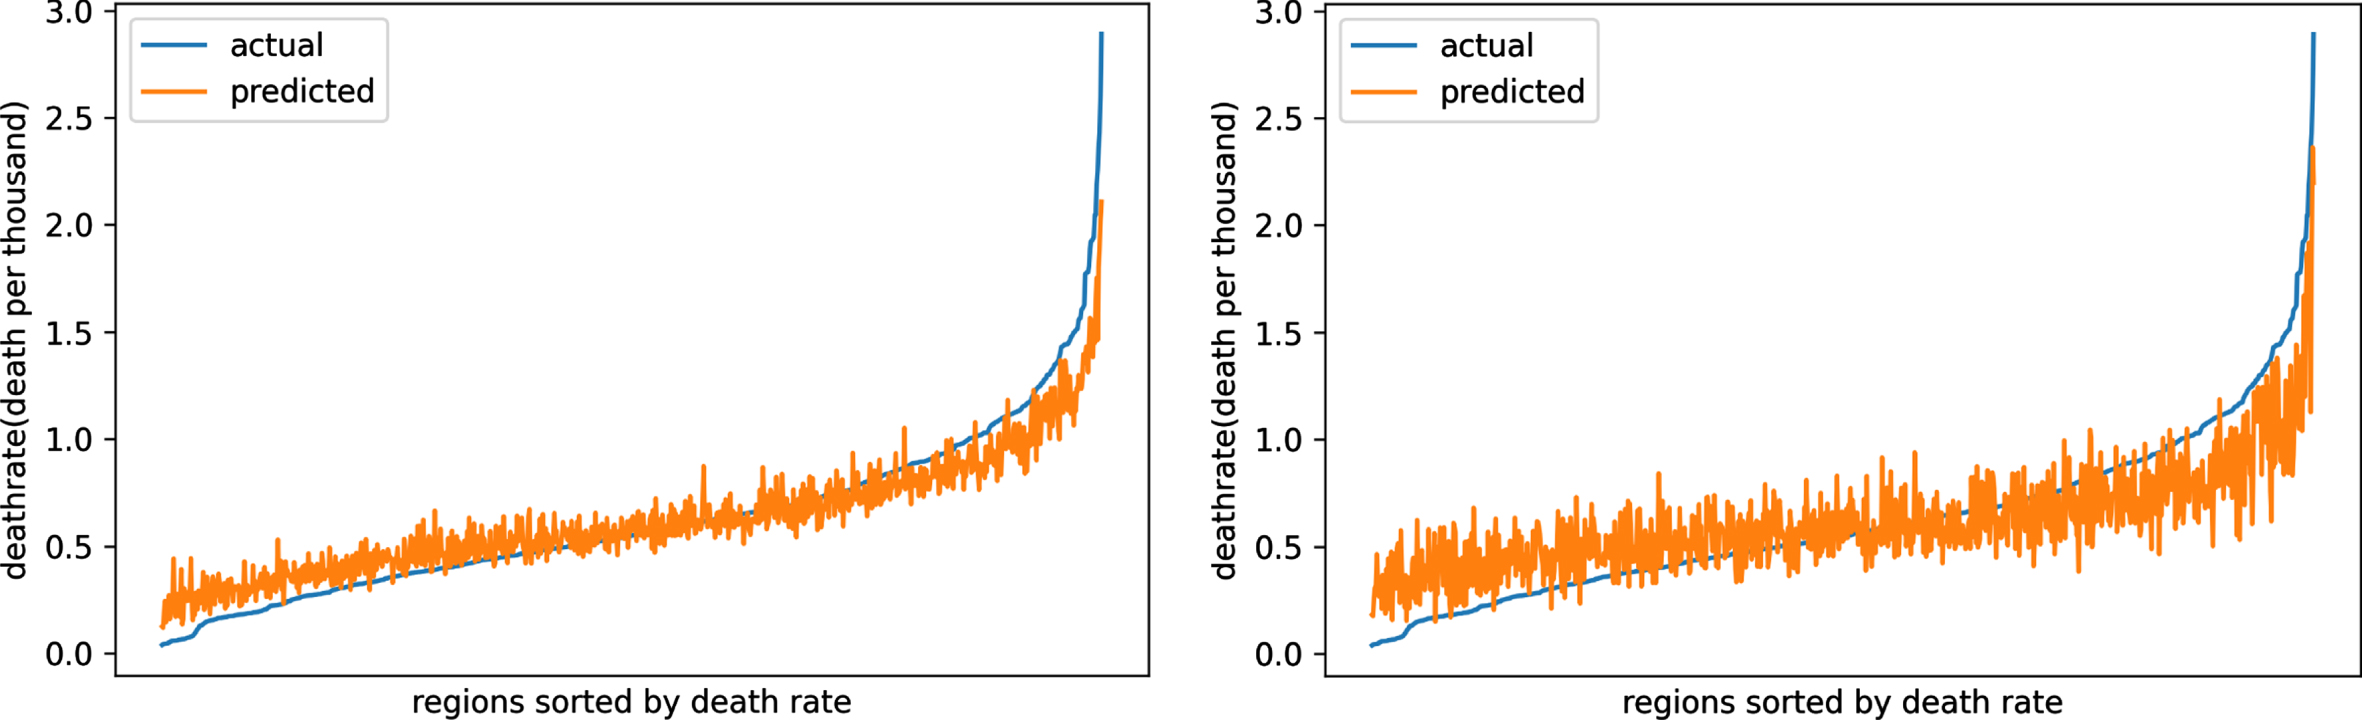
The results of the developed models are shown in Fig. 2. In this figure predicted death rate versus the actual death rate is provided. As shown, both models, the RFR-based model and the xGboost-based model provided promising results in predicting the death rate in different cities of the UK. Nevertheless, the RFR-based model with predicted R2 = 0.88 performed better than the xGboost-based model with predicted R2 = 0.78.
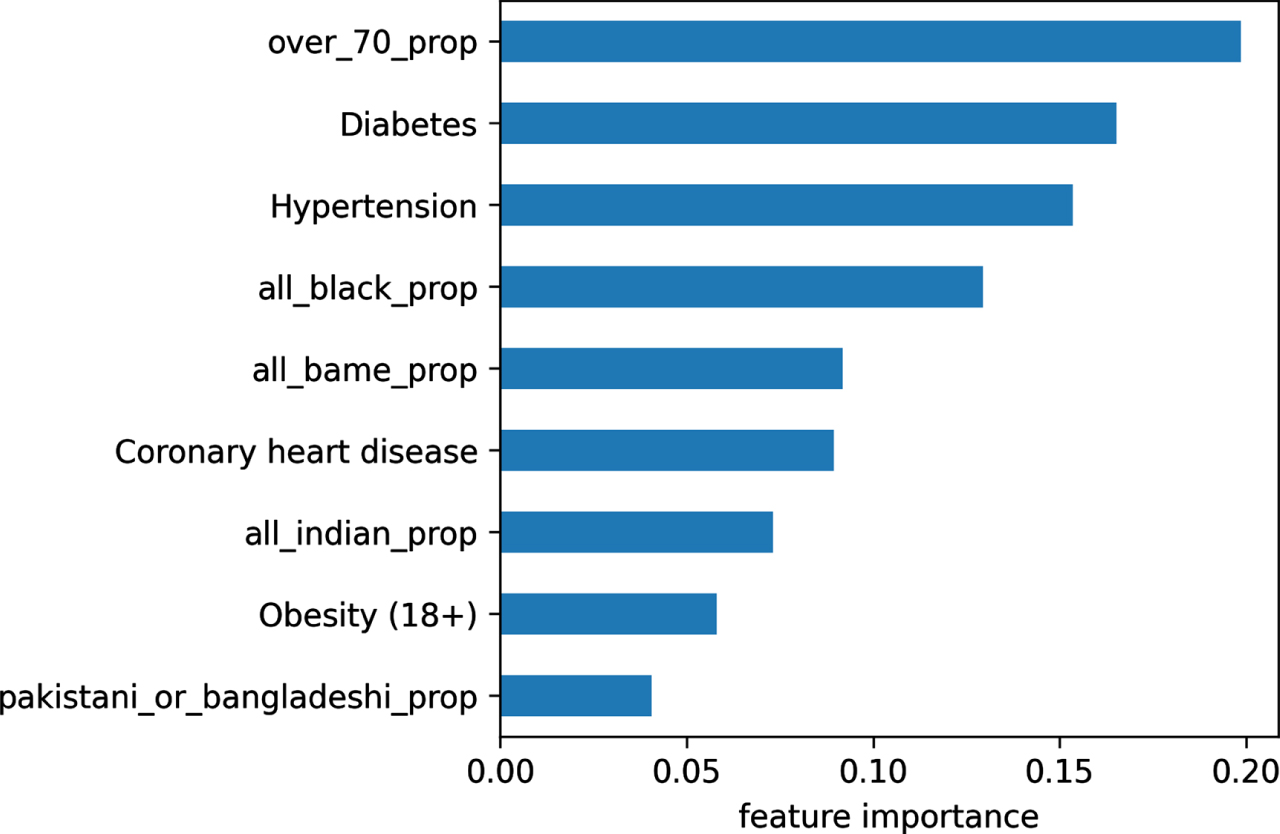
In terms of the selected features, the RFR-based model found that the nine variables ‘over_70_prop’, ‘all_bame_prop’, ‘all_black_prop’, ‘pakistani_or_bangladeshi_prop’, ‘all_indian_prop’ ‘Hypertension’, ‘Obesity (18+)’, ‘Diabetes’, and ‘Coronary heart disease’ contributed significantly to the death rate. The importance of each feature is depicted in Fig. 3. This can be used to get a view of the factors contributing to the death rate caused by the coronavirus.
Fig. 2
Predicted death rate versus actual death rate for the two developed models random forest regressor- based model (top) and xGboost-based model (bottom).
5Discussion
Predicting mortality rate can help health authorities such as the US CDC and its partners to make the right choices and solid activities. In this work, we investigated the capability of AI models in predicting the number of deaths. Two machine learning methods random forest regressor (RFR) and xGboost that have been shown to be robust in regression problems were examined. The performance of both models was promising, but the RF-based model (predicted R2 = 0.88) performed slightly better the xGboost-based model (predicted R2 = 0.78).
Fig. 3
The ultimate importance of the features used in the AI-based prediction model.
The contribution along with the effect of the selected features in the prediction model depicted in Fig. 1 provides valuable information regarding the critical parameters that affect high-risk individuals. As shown, the top two parameters are age and diabetic. These findings are in line with previous studies. CDC, as an example, defined the following criteria to consider a patient as high risk: age≥65 years, living in nursing homes, having at least one of the following diseases including chronic lung disease, serious heart conditions, severe obesity, diabetes, chronic kidney disease, liver disease. Moreover, people who are immunocompromised should also be considered as high-risk patients [14].
In terms of application, this model can be deployed and utilized in a healthcare organization to prevent the spread of diseases. This model can also be used for testing and treatment decisions. However, care should be considered in directly using this model as the risk factors used in the model and found to be important may not be exactly similar to those in other countries. Nevertheless, one can follow the same procedure and develop its own prediction model.
Last and most important, this model is applicable to the data in which the value for all 9 predictors used in the model are available. So, for the cases that one or more of these important variables are missed the model should not be applied.
6Conclusion
Some reports suggest that AI may be used as an effective tool in the worldwide fight against the current tragic COVID- 19 pandemic. In this work, we investigated the capability of AI models in predicting the COVID -19 mortality rate in various cities of the UK. The results of assessing the model revealed that it is likely to derive a reliable and accurate model for predicting COVID-19 death rate.
References
[1] | Pan A. , et al., Association of Public Health Interventions With the Epidemiology of the COVID-19 Outbreak in Wuhan, China, JAMA, 2020. doi: 10.1001/jama.2020.6130. |
[2] | Avery J. and Bloom B. , COVID-19, a UK perspective, (in eng), Eur J Emerg Med 27: (3) ((2020) ), 156–157. doi: 10.1097/MEJ.0000000000000700. |
[3] | Khan S. and Cheng S.O. , What led to the UK’s COVID-19 death toll? –An insight into the mistakes made and the current situation, (in eng), Int J Surg 79: ((2020) ), 327–328. doi: 10.1016/j.ijsu.2020.05.083. |
[4] | Anderson R.M. , Hollingsworth T.D. , Baggaley R.F. , Maddren R. and Vegvari C. , COVID-19 spread in the UK: the end of the beginning? (in eng), Lancet (London, England) 396: (10251) ((2020) ), 587–590. doi: 10.1016/S0140-6736(20)31689–5. |
[5] | Colbourn T. , Unlocking UK COVID-19 policy, (in eng), Lancet Public Health 5: (7) ((2020) ), e362–e363. doi: 10.1016/S2468-2667(20)30135-3. |
[6] | Shanafelt T. , Ripp J. and Trockel M. , Understanding and Addressing Sources of Anxiety Among Health Care Professionals During the COVID-19 Pandemic, JAMA, 2020. doi: 10.1001/jama.2020.5893. |
[7] | Yang Y. , et al., Epidemiological and clinical features of the 2019 novel coronavirus outbreak in China, medRxiv, p. 2020.02.10.20021675, 2020. doi: 10.1101/2020.02.10.20021675. |
[8] | Pourhomayoun M. and Shakibi M. , Predicting Mortality Risk in Patients with COVID-19 Using Artificial Intelligence to Help Medical Decision-Making, medRxiv, 2020. |
[9] | Panahi A.H. , Rafiei A. and Rezaee A. , FCOD: Fast COVID-19 Detector based on deep learning techniques, Informatics in Medicine Unlocked 22: ((2021) ), 100506. doi: https://doi.org/10.1016/j.imu.2020.100506. |
[10] | Abbasi W.A. , et al., COVIDC: An expert system to diagnose COVID-19 and predict its severity using chest CT scans: Application in radiology, Informatics in Medicine Unlocked 23: ((2021) ), 100540. doi: https://doi.org/10.1016/j.imu.2021.100540. |
[11] | Mortazavi S. , Mortazavi S. and Parsaei H. , COVID-19 Pandemic: How to Use Artificial Intelligence to Choose Non-Vulnerable Workers for Positions with the Highest Possible Levels of Exposure to the Novel Coronavirus, Journal of Biomedical Physics and Engineering 10: (3) ((2020) ), 383–386. |
[12] | Ho T.K. , The random subspace method for constructing decision forests, IEEE Transactions on Pattern Analysis and Machine Intelligence 20: (8) ((1998) ), 832–844. |
[13] | Chen T. and Guestrin C. , Xgboost: A scalable tree boosting system, in Proceedings of the 22nd acm sigkdd international conference on knowledge discovery and data mining, 2016, pp. 785–794. |
[14] | CDC, PeopleWhoAre at Higher Risk for Severe Illness, vol. 2020 (Centers for Disease Control and Prevention, Centers for Disease Control and Prevention (CDC), 2020. [Online]. Available: https://www.cdc.gov/coronavirus/-ncov/need-extra-precautions/people-at-higher-risk.html |

