
Deep spatio-temporal emotion analysis of geo-tagged tweets for predicting location based communal emotion during COVID-19 Lock-down
Abstract
Due to the COVID-19 pandemic, countries across the globe has enforced lockdown restrictions that influence the people’s socio-economic lifecycle. The objective of this paper is to predict the communal emotion of people from different locations during the COVID-19 lockdown. The proposed work aims in developing a deep spatio-temporal analysis framework of geo-tagged tweets to predict the emotions of different topics based on location. An optimized Latent Dirichlet Allocation (LDA) approach is presented for finding the optimal hyper-parameters using grid search. A multi-class emotion classification model is then built via a Recurrent Neural Network (RNN) to predict emotions for each topic based on locations. The proposed work is experimented with the twitter streaming API dataset. The experimental results prove that the presented LDA model-using grid search along with the RNN model for emotion classification outperforms the other state of art methods with an improved accuracy of 94.6%.
1Introduction
COVID-19 has turned into a paradigm-changing incident across the globe, affecting millions of people. Recent coronavirus pandemic has raised problems that affect the people’s social-economic life cycle aspects such as emotions, mental health, relationship, sentiments, commercial and work [17]. Online social media is a popular communication platform used by millions of people to express their opinions, interest, and emotions [14]. Twitter is one of the popular micro-blog social media used by the public to share their interests and opinions via short messages [12]. During this COVID 19 lockdown, twitter is widely used by the public to express their state of health and emotions. Disease-related subjects and personal health can be tracked and predicted by analysing tweet data [19]. Moreover, the advancement in mobile telecommunications has made geographical location as a key component in investigating twitter data [24]. Multiple research studies have been carried out to analyse the tweet’s opinion and emotion. However, these researches have restrictions in considering spatial and temporal characteristics of tweet data in the emotional analysis. Tweets contain several useful temporal and spatial characteristics like the time-stamp data that refers to when the tweet was sent, geo-location data that points to the approximate locality of the tweet source, the actual text present in the tweet, and other assorted data such as the re-tweets, number of likes which determines the popularity of various tweets. This paper presents a deep spatio-temporal analysis framework of geo-tagged tweets to predict the emotions of different topics based on location. The features of tweets are determined by two significant criteria namely topics and sentiments (emotion). The emotion of each tweet depends on each word present in the sentence and the associations between the words. Sentiment analysis extracts information about the nature of text content. It is widely employed in numerous practical applications namely, media reviews, monitor online conversations, brand analysis, and more. Sentiment analysis commonly uses a binary classification scheme. However, it is limited by the statement which it is simply a binary classifier. While it only classifies the sentiment to be positive or negative, it is known that humans exhibit a range of complex emotions within the positive and negative categories [1, 12, 18]. Thus, a more specialized system is needed to achieve better results. This is where emotion classification comes into the picture. Emotions could either be considered as a discrete category consisting of certain base emotions or as a dimensional category with certain levels of activation.
In this pandemic situation, emotion and sentiment analysis aids to identify people’s anxiety over medical illness and health conditions [2]. In a multi-class classification technique, the outcomes would be a certain emotion; the conclusion presents more detailed and valuable yield as more knowledge about the internet user’s sentiments and emotions are mined from the portion of text. Topic modeling is another area of research where a good amount of research has been done and various topic modeling methodologies have been investigated. Topics are significant criterion that relates several tweets [28]. Topics are determined for the subject of each tweet. Hence, multiple tweets can be clustered depends on the topic via a suitable model. Latent Dirichlet Allocation (LDA) is a statistical model which operates on the assumption that each document is a mixture of a small number of topics and that each word’s presence is attributable to one of the document’s topics [28]. Finally, the multi-class model is trained by RNN which is composed of Long Short-Term Memory (LSTM) units. This multi-class model has been upgraded to classify tweets depends on different human emotions like anger, sadness, and excitement.
The major contributions of this paper are outlined as follows:
• This paper aims to construct a framework for spatio-temporal analysis of geo-tagged tweets to predict the communal emotion of people during this COVID-19 lockdown.
• This prediction aids to find the factors influencing sentiments in different geo-locations and the impacts of topics on emotions.
• An optimized version of LDA for discovering the optimal hyper-parameters using a grid search is presented.
• A Multi-class emotion classification model is built via Recurrent Neural Network-Long Short Term Memory.
• The optimized LDA topic model associated with the multi-class emotion classification model is utilized in the prediction.
The rest of the paper is organized as follows. A more detailed literature review is represented in Section 2. Section 3 describes the methodology of the proposed system, the dataset, and the modules. The results of the proposed system and comparative performance analysis are presented in Section 4. The conclusions of this work are presented in Section 5.
2Related works
This section presents the literature review about user’s emotion analysis via twitter, multi-class emotion classification, and topic modeling using LDA.
2.1User’s emotion analysis via Twitter
Recently, internet user’s emotions have been considered either to realize the user’s physiologic emotional state or to represent the user’s actions and their custom patterns in online social media [20]. The rate of recurrence at which people’s usage relationship with twitter and the period of usage per session have been calculated. Research studies have investigated how to enhance the act of content sharing schemes by using user activity information. In [4], user activities’ data is used to determine abnormal actions and justify the consistency of the user profiles. Further analysis in [7, 13] has helped forecast the user activities for learning online social media. In twitter, the user actions can also be categorized relative to the succeeding actions: tweeting, re-tweeting, and commenting. It is significant to notice that these reports do not discover the modifications of topics sent by users. Furthermore, some actions can capture more people’s interest, and these are either determined by the total number of messages or message interactions within people attracted to some topics [9]. Therefore, among the total number of messages in online social media, it is feasible to calculate the total number of people correlated to possible actions, and regarding particular areas within a certain interval of time and also respective to a geographical site.
2.2Multi-class emotion classification
An event detection scheme [25] is presented at the time of early phases of an incident, depending upon alterations in the internet user’s activities in an Online Social Network (OSN). This method can identify an incident of several topics, which could be useful for various purposes. The suggested event detection scheme is comprised of the succeeding key sections: (1) estimation of the internet user’s site, (2) message abstraction via OSN, (3) topic recognition by using natural language processing (NLP) depends upon the Deep Belief Network (DBN), (4) the internet user’s variation of action examiner in OSN, and (5) sentimental examination for emotion classification depends upon a tree convolutional neural network (tree-CNN). In the instance of public healthiness, early event detection is very applicable for the populace and the experts can proceed with remedial actions. Therefore, the new coronavirus disease (COVID-19) is applied as an instance report in this work. For implementation validation, the sections related to the topic classification and emotional analysis were evaluated with various similar results or applied with various machine learning algorithms. In performance calculation, the suggested event detection system attained accuracy higher than 0:90, whereas various similar approaches attained accuracy rates less than 0:74. Moreover, the proposed technique discovers an incident nearly 3 days before the various other approaches.
According to Savigny et al. [18], experiments are conducted for emotion classification with Indonesian YouTube comments. The dataset consisted of 8000 comments, categorized by using 6 emotion categories. 43000 uncategorized comments have been applied as the corpus to train word embedding simulations. A relative study of various word embedding approaches called Average Word Vector, Aver-age Word Vector with TF-IDF, Paragraph Vector, and Convolutional Neural Network (CNN) was completed. Amongst numerous embedding approaches, the CNN technique outperformed the rest by far, attaining an accuracy of 76.2%, which is an enhancement from the model. Nguyen et al. [9] categorize the collections of geo-tagged documentations correlated to a specific point of interest on public modes, perceiving single input info that gets an incomplete image of clusters because of noisy regions. To overcome this, the enhanced version of the Density-Based Spatial Clustering of Applications with Noise (DBSCAN) algorithm was introduced to the density-based clustering algorithm using spatial-textual information (DBSTexC). The reason for avoiding the geographic areas is due to a large amount of point of interest-irrelevant geo-tagged tweets in the corresponding clusters by using the DBSTexC. To increase the quality of clustering, the fuzzy DBSTexC (F-DBSTexC) was also introduced which allows an increase in performance gain up to 27.33% higher than DBSTexC.
A deep-learning technique [1] is employed to categorize the internet user’s opinion stated in reviews (named as RNSA). The RNSA utilizes the RNN along with LSTM to yield the benefit of successive processing and overcome numerous faults in existing techniques. The RNSA consists of 2 key sections such as sentiment analysis and pre-processing. They conduct sentence-level emotion classification by large-scale movie review datasets. The outcomes show that the proposed method (RNSA) yields better performance in which the precision rate is 0.8675 when compared to the existing techniques. Li et al. [20] characterized Coronavirus-oriented online social media posts into 7 situational data classes. They also recognized the specific important features in forecasting the reposted amount in every data class. The accuracy rate of classification of various supervised learning approaches was altered. The accuracy rate of the Support Vector Machine (SVM) is 54%. The accuracy rate of Naive Bayes and Random Forest is 45% and 65%, correspondingly.
A technique of topic recognition based on NLP has been used for Coronavirus detection using a hybrid artificial intelligence pattern [21]. The alteration in the infective capability of the disease was scrutinized in a few days next to the infection and also improved susceptible-infected (ISI) model was recommended. The NLP segment and Long Short Term Memory (LSTM) network were inserted within the ISI model to construct a hybrid AI model for coronavirus detection. NLP + LSTM constructed into the hybrid AI model, the mean absolute percentage (%) mistakes of the detection outcomes, considering the succeeding 6 days, were 0.52%, 0.38%, 0.05%, 0.86% in Wuhan, Beijing, Shanghai, and nationwide respectively.
2.3Topic modeling using LDA
Vaduva et al. [5] represented a model to predict latent semantic classes consisting of pairs of objects characterized by a specific spatial positioning. A hierarchical structure is suggested for the image content. In which invariant spatial signatures are calculated for pairs of objects and several statistics are prepared to succeed in a good understanding of the spatial distributions inside the predicted semantic classes. A hybrid Latent Dirichlet Allocation (LDA) model [6] is projected to use the Genetic Algorithm (GA) in discovering optimal weights for LDA topics to upgrade the topic classification performance. This study uses LDA to scrutinize the topics of online comments of game applications in a supervised manner. Meanwhile, Chinese contents are generally less structured and too complicated to evaluate. The outcome demonstrates that a hybrid LDA classification mechanism with GA improves the accuracy of LDA in highlighting the meaning of topics and the words representing a topic.
A Variational Auto-Encoder Topic Model (VAETM) [30] is proposed by fusing word vector demonstration & entity vector demonstration to extracts the high-quality topics using short texts. Furthermore, an enhanced supervised VAETM (SVAETM) is suggested to improve the VAETM via label data in the training phase to organize the implication of latent illustration of topic distributions & topic generation. Finally, KL-divergence-based inference algorithms are presented to gather approximate posterior distribution. Experiments are conducted over three public short text datasets such as 20 Newsgroups, IMDB, and Standard literature that show better performance by the proposed method (VAETM and SVAETM) in terms of perplexity, Normalized Point-wise Mutual Information (NPMI), and accuracy. The proposed method achieves accuracy, Precision, and Recall rate are 0.84, 0.84, and 0.83 for topic modeling.
A novel probabilistic model called tpLDA [22] presents prior knowledge like topic & its inner popularity of cluster to build the LDA hyper-parameters which are constantly problematic to describe. The constructed distribution directs the innovative reproductive procedure learning that redirects the dynamic variations in the information on continuous-time slices. The proposed method (tpLDA) attains a high Fowlkes-Mallows index (FMI) at every single time step associated with 15% higher FMI compared to the existing better one & 4% greater FMI at least. Moreover, the proposed technique yields 28.06 % of the Jaccard Index (JC) at the 6th time slice and is less than 1.87% related to the existing optimal models. A unique Fuzzy Topic Modeling (FTM) method [16] is represented to deal with the sparsity problem in short content via fuzzy perception. The global and local period frequencies are calculated by using the Bag-Of-Words model (BOW). The Principal Component Analysis (PCA) is used to reduce the high dimension on global period weighting and also fuzzy c-means algorithm is utilized to extract the related area from the files. The experimental analysis is performed on the 3 short text datasets namely, snippets (small datasets), Twitter, and questions (bigger datasets). Fuzzy Topic Modeling classification accuracy rate for snippets and question datasets are 95%, 94%, 91%, 89%, 87%,73%, 74%, 70%, 68%, 78% is associated with 50, 75, 100, 125 and 200 number of topics (CSTM, GLTM, Mix-gram, SATM, BTM, LTM, DREx + LDA) with SVM classifier.
The proposed work differs from the discussed literature in the following ways: Many types of research have been carried out to analyse the tweet’s opinion and emotion. Still, these researches have restrictions concerning spatial-temporal evaluation of emotion analysis. To overcome these issues, this paper introduces a deep spatio-temporal analysis framework of geo-tagged tweets to predict the communal emotion of people from different locations during a lockdown. This obtained framework presents an optimized version of Latent Dirichlet Allocation (LDA) for finding the optimal hyper-parameters using grid search. The classification model is built using Recurrent Neural Network (RNN) to predict emotions for each topic based on locations. An experimental result provides advancement in topic modeling as well as comparison to the classical LDA model.
3Methodology
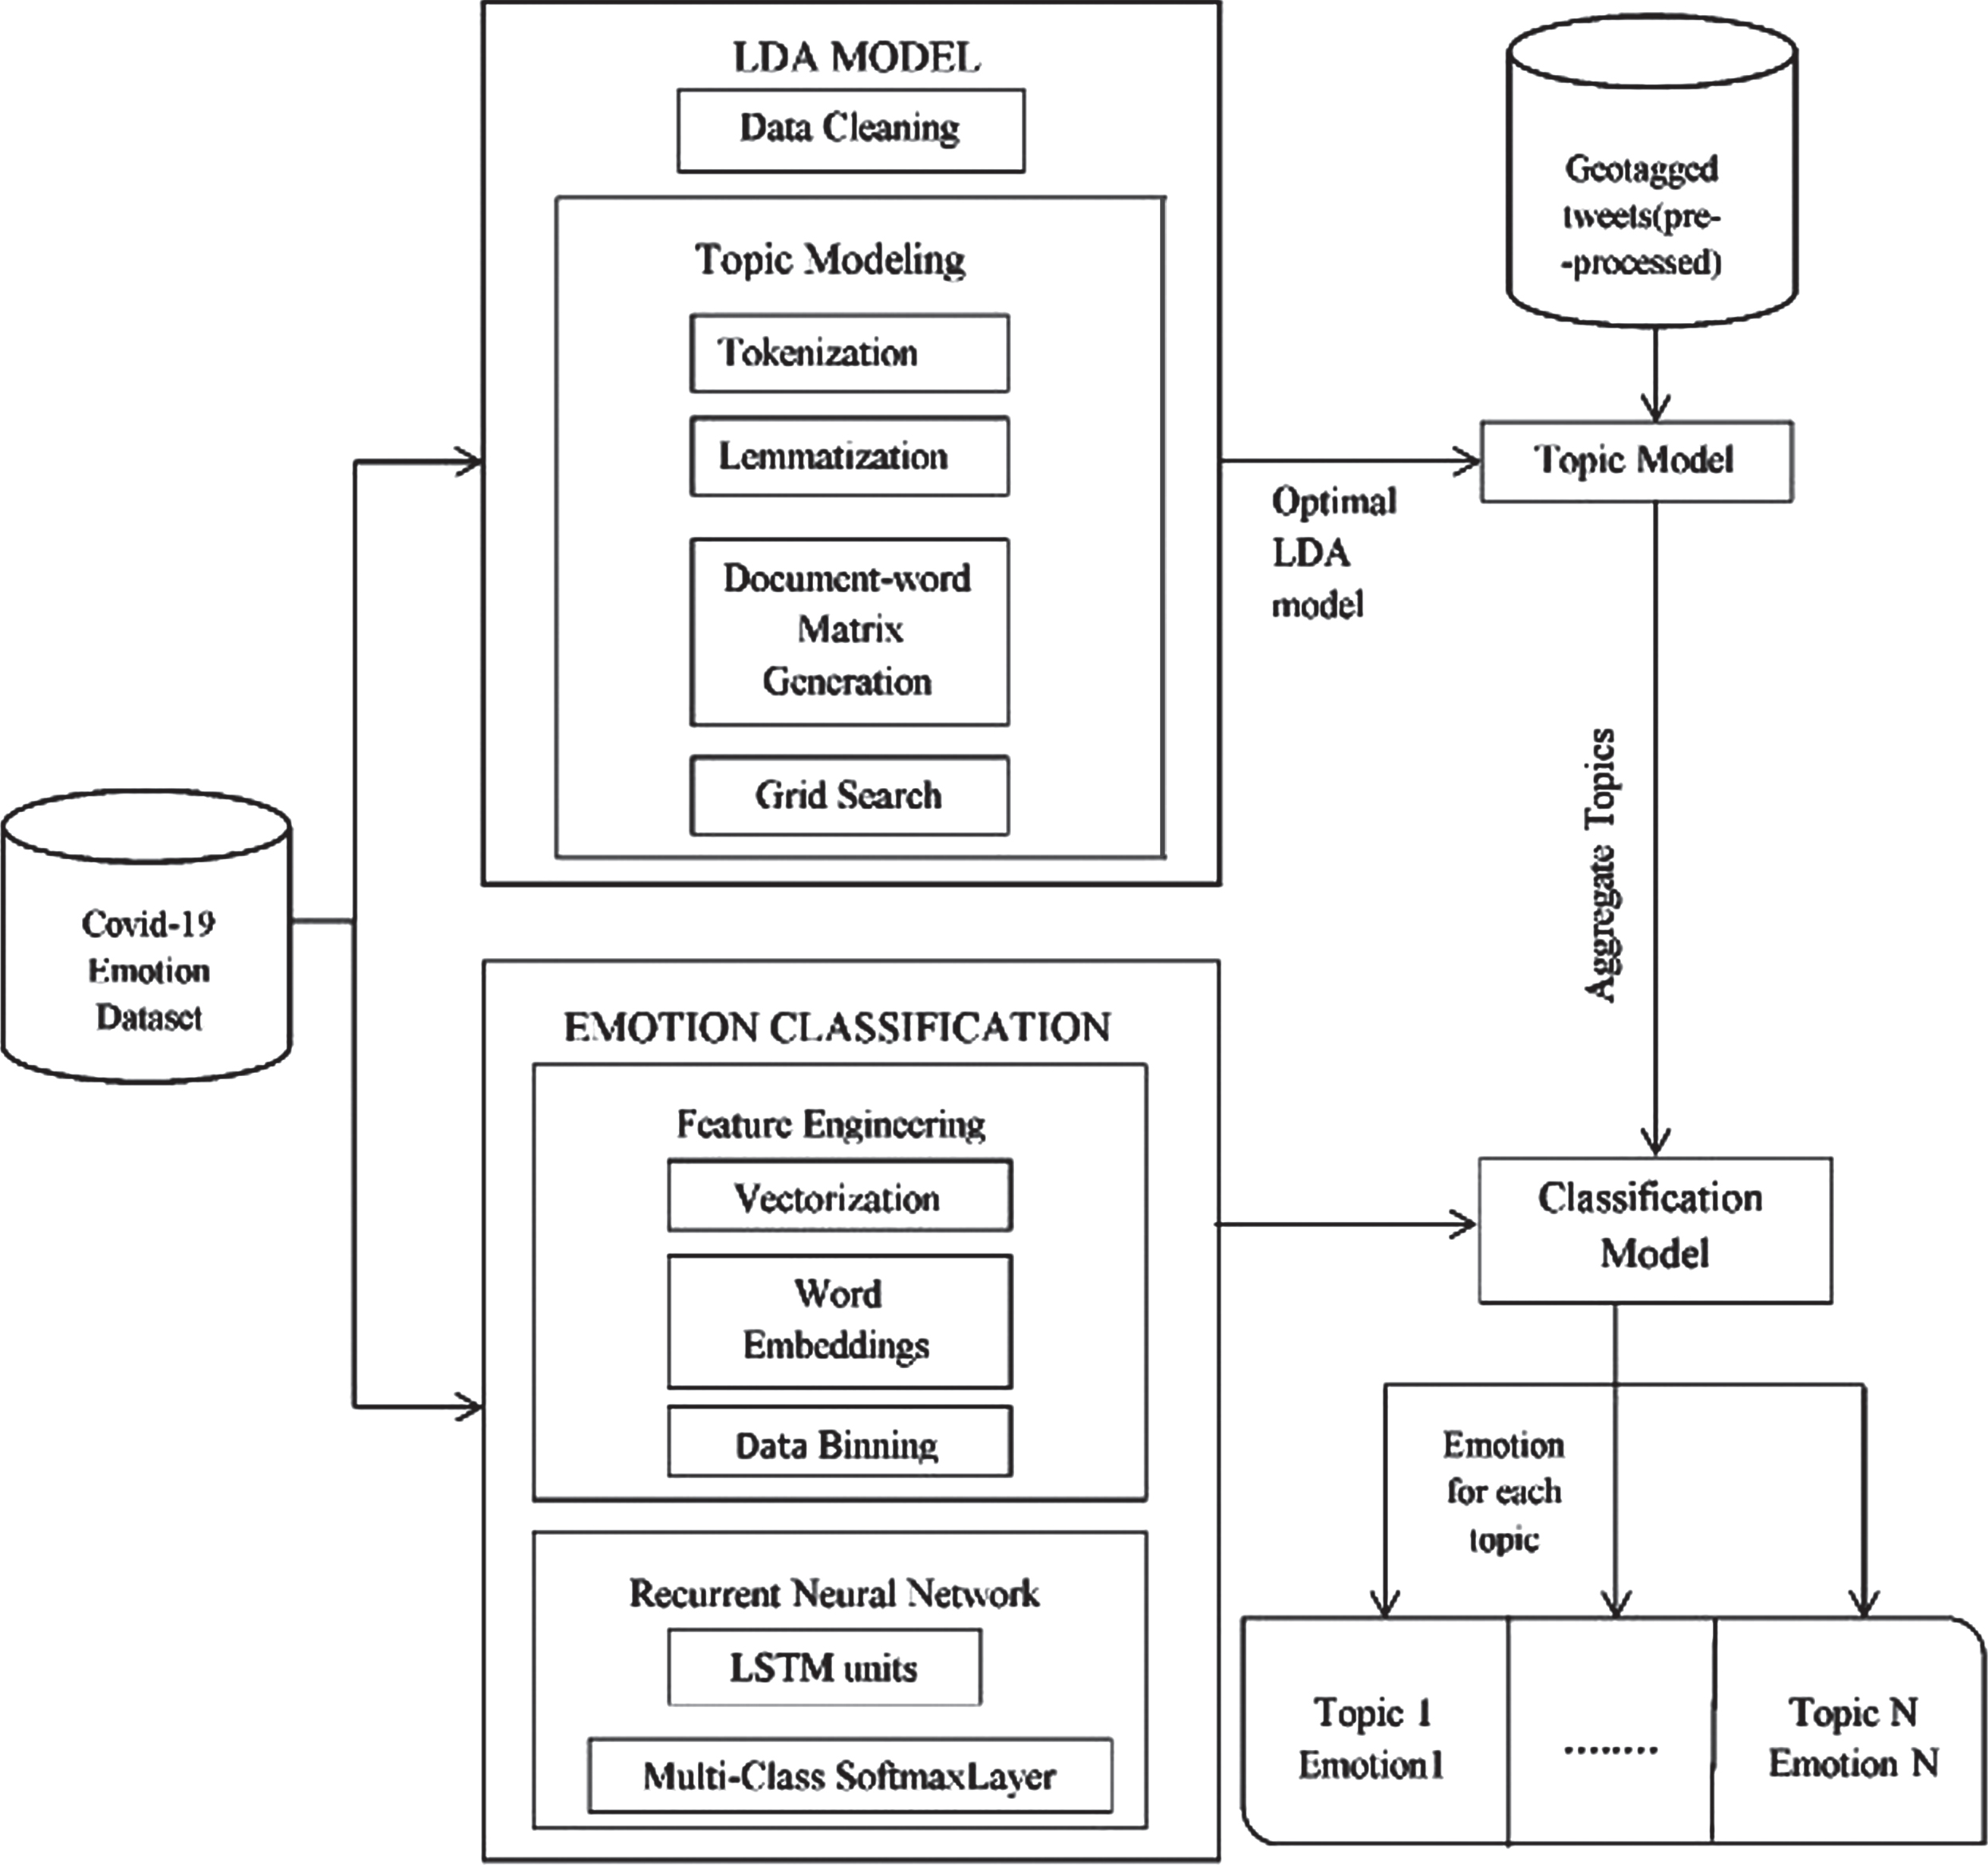
This section describes the architecture of the proposed system, the datasets, and the actual workflow of the proposed work. The presented deep learning framework is split into two significant phases. In the first phase, an optimal LDA model is built for topic modeling using a grid search algorithm with COVID-19-related twitter dataset. Second, to construct a multi-class emotion classification model that is efficient for categorizing raw text data into one of the numerous emotions. Once these models are constructed, they are applied in tandem to map a topic to an emotion. This process is completed by going through each tweet in a specific topic, grouping it into emotions, and finding the emotion that has the maximum occurrence on that topic. The predominant feeling is recognized and assigned to the topic.
3.1Datasets
This work is experimented with two twitterdatasets that are collected from 27th January 2020 to 15th March 2020, which are in english language and gathered across the globe. The first dataset is the primary COVID-19-related dataset, which is downloaded from twitter streaming API that supplies real-time tweets based on specific filters [11]. The second dataset is an emotion dataset consisting of 40000 tweets classified with 11 emotion labels. The extracted dataset that was considered for experimentation contains numerous set of keywords that satisfies the training threshold for Latent Dirichlet Allocation (LDA) based Grid search and multi-class recurrent neural network-long short term memory (RNN-LSTM) classification model. Significant keyword lists are used to gather tweets about COVID-19 as shown in Table 1. From these two datasets, arbitrarily ten percentage is selected as test data and ninety percentage is selected as training data. Significant keyword lists are used to gather tweets about COVID-19 as shown in Table 1. The twitter streaming API contains the Covid-19 related tweets along with the valuable attributes, which are described in Table 2.
Table 1
Covid-19 Related Keywords
| Keyword | Number of Tweets |
| Covid | 6,54,897 |
| Corona | 45,685 |
| Coronawarrior | 3,49,864 |
| Coronavirus | 5,64,830 |
| Covid-19 | 4,63,738 |
| Covid_19 | 5,34,663 |
| Fightagainstcorona | 2,86,763 |
| Fightcoronatogether | 33,649 |
| Fightcovid19 | 6,45,379 |
| Lock down | 4363 |
| Lockdownextension | 23367 |
| Sanitizer | 98,764 |
| Sars-cov-2 | 76,543 |
| Social distance | 12,657 |
| Socialdistance | 48,765 |
| Socialdistancing | 280,345 |
| Standtogether | 1,23,875 |
| Stay at home | 09,646 |
| Stay home challenge | 4,38,759 |
| Stay safe stay home | 3,76,589 |
| Stay_home_safe | 27,654 |
Table 2
Twitter Attributes
| Attributes | Description |
| Tweet_ID | The novel identifier for specific covid-19 related tweet |
| Tweet_created_at | when the covid-19 tweet was initiated by the users |
| Retweet_count | Number of times the covid-19 tweet was retweeted |
| Text | The opinion about the covid-19 was explained via tweet |
| hashtag_text | By inserting the ’#’ symbol before the text, twitter users can easily find the searching text |
| user_ID | The novel identifier for the twitter user who initiated the tweet |
| user_created_at | When the user account was initiated on Twitter (UTC date &time) |
| location | The user who is activating the twitter account that the location is well-defined |
3.2System architecture
The overall system architecture for the proposed work is shown in Fig. 1. The system architecture of the proposed work begins with the collection of COVID-19-related raw data from twitter streaming API, towards performance and result analysis. The proposed framework comprises two significant models namely, the optimal LDA model and multi-class emotion classification model. LDA is a generative modeling process that arises to identify topics in each document [6]. In this work, an optimized LDA model using grid search is used to perform topic modeling. This paper adopts general notations to refer the few basic terminologies like word, document and corpus [8]. A document contains the sequence of T words represented by R ={ r1, r2, … . rT }, where rT is the Tth word in the sequence. A corpus is a set of N documents represented by C ={ R1, R2, …… . , RN }. Let ‘Ķ’ represents the total count of topics, ‘T’ signifies the total count of words in documents and ‘N’ refers total count of documents. In multinomial distribution,
(1)
Fig. 1
Architectural diagram of the overall system model.
The LDA parameters are described by differential bound maximization as specified in Equation (2),
(2)
3.3Expectation-maximization (EM) Approach for optimal LDA model
The objective of utilizing a grid search is to acquire the optimal LDA model for topic modeling. The algorithm 1 is designed in the expectation-maximization (EM) strategy, which is a cyclic method to calculate the maximum log-likelihood of a specific model. EM process increases a lower bound based on the factors α and β. The derivation generates the succeeding iterative algorithm:
• E-step: For every document, discover the optimum values of the dirichlet factors.
• M-step: The log-likelihood based on the dirichlet factor α and β is maximized. These factors are employed to discover the extreme log-likelihood values for every document that is calculated in the E-step.
The M-step upgrade for the conditional multinomial dirichlet factor α and Dirichlet distribution p (θ|α)is written out methodically in Equation (3) [8],
(3)
The parameter ′α′ is a Ķ-vector with components αl > 0; 1 ={ 1, 2, … . , Ķ ; } where Ķ denotes total count of topics,
In the E-step, the θ is fixed which presents the topic distribution of document likewise φ which correlates to the word distribution under a topic. The topic assignment of every word is calculated with the help of these factors. In the M-Step, θ and φ are updated to boost the expected log-likelihood. In specific, calculated the perplexity of a held-out test set to evaluate the models. The perplexity, utilized by tradition in language modeling, is monotonically diminishing in the likelihood of the test data & algebraically equal to the transposed of the geometric mean per-word likelihood. A lesser perplexity score specifies improved generalization performance. Perplexity measures the performance of the LDA topic model [8]. It is explained by Equation (4) using Equation (5),
(4)
(5)
| Algorithm 1. LDA Using Grid Search algorithm |
| Input: |
| n_topics, number of topics |
| decay,learning decay |
| Output: |
| best model, optimal LDA model |
| Method: |
| initialize search_params k_topics, →decay |
| 1. while comparative improvement in loss function do |
| 2. expectation (E) step: |
| 3. for d = 1 to D do |
| 4. repeat |
| a. update document/topic distribution for docs [c] |
| b. update topic/word assignments for docs [c] |
| 5. until convergence |
| 6. maximization (M) step: |
| 7. update topic/word distribution |
| 8. update search_params |
| 9. get model |
| 10. if perplexity (model) <perplexity (best_model) |
| a. best_model = model |
| End algorithm |
Hence, by presenting a grid search in this manner on all the feasible models, the model along with the highest log-likelihood / lowest perplexity is preferred as the better model for topic modeling.
4Experimental results and discussions
This section describes the experimentation settings and metrics used for analyzing the performance of the proposed framework. The experimentation process comprises of the generation of optimized topic model using grid search and construction of an emotion classification model using a recurrent neural network with LSTM units and a softmax multiclass output layer. The experimentation is carried out with two datasets namely twitter streaming API and emotion datasets. Twitter streaming API provides real-time COVID-19-related tweets depends on filters. Emotion datasets contain 40000 tweets associated with 11 emotion class labels.
4.1LDA with grid search
The objective of this module is to construct an optimal LDA model for topic modeling using a grid search. The COVID-19-related tweets are initially preprocessed to eliminate extra spaces, remove unicode strings, remove a duplicated character that exceeds three, eliminate retweet & username, and other special characters. Tokenization is completed by converting text to a word’s list. Lemmatization is carried out to reduce the total number of unique words in the dictionary by converting each word to its root word. The document word matrix is then generated using a count-vectorizer which is an important input to the LDA topic model algorithm. The optimal LDA model is constructed using two search parameters namely the number of topics and learning decay. Table 3 shows the parameter settings used in optimizing the LDA model. The optimal LDA model using grid search is designed based on an expectation-maximization strategy. Figure 2 visualizes the optimal values of the topic model, namely learning decay and the number of topics. An optimal combination of learning decay and a number of topics are thus obtained for the proposed optimized LDA model.
Table 3
LDA model parameters
| Model | Standard LDA model | LDA model with grid search |
| Number of topics | 20 | 10 |
| Learning Decay | 0.7 | 0.5 |
| Log-Likelihood | –261510.23 | –564239.45 |
| Perplexity | 2589.69 | 2185.46 |
Fig. 2
Optimal LDA Model.
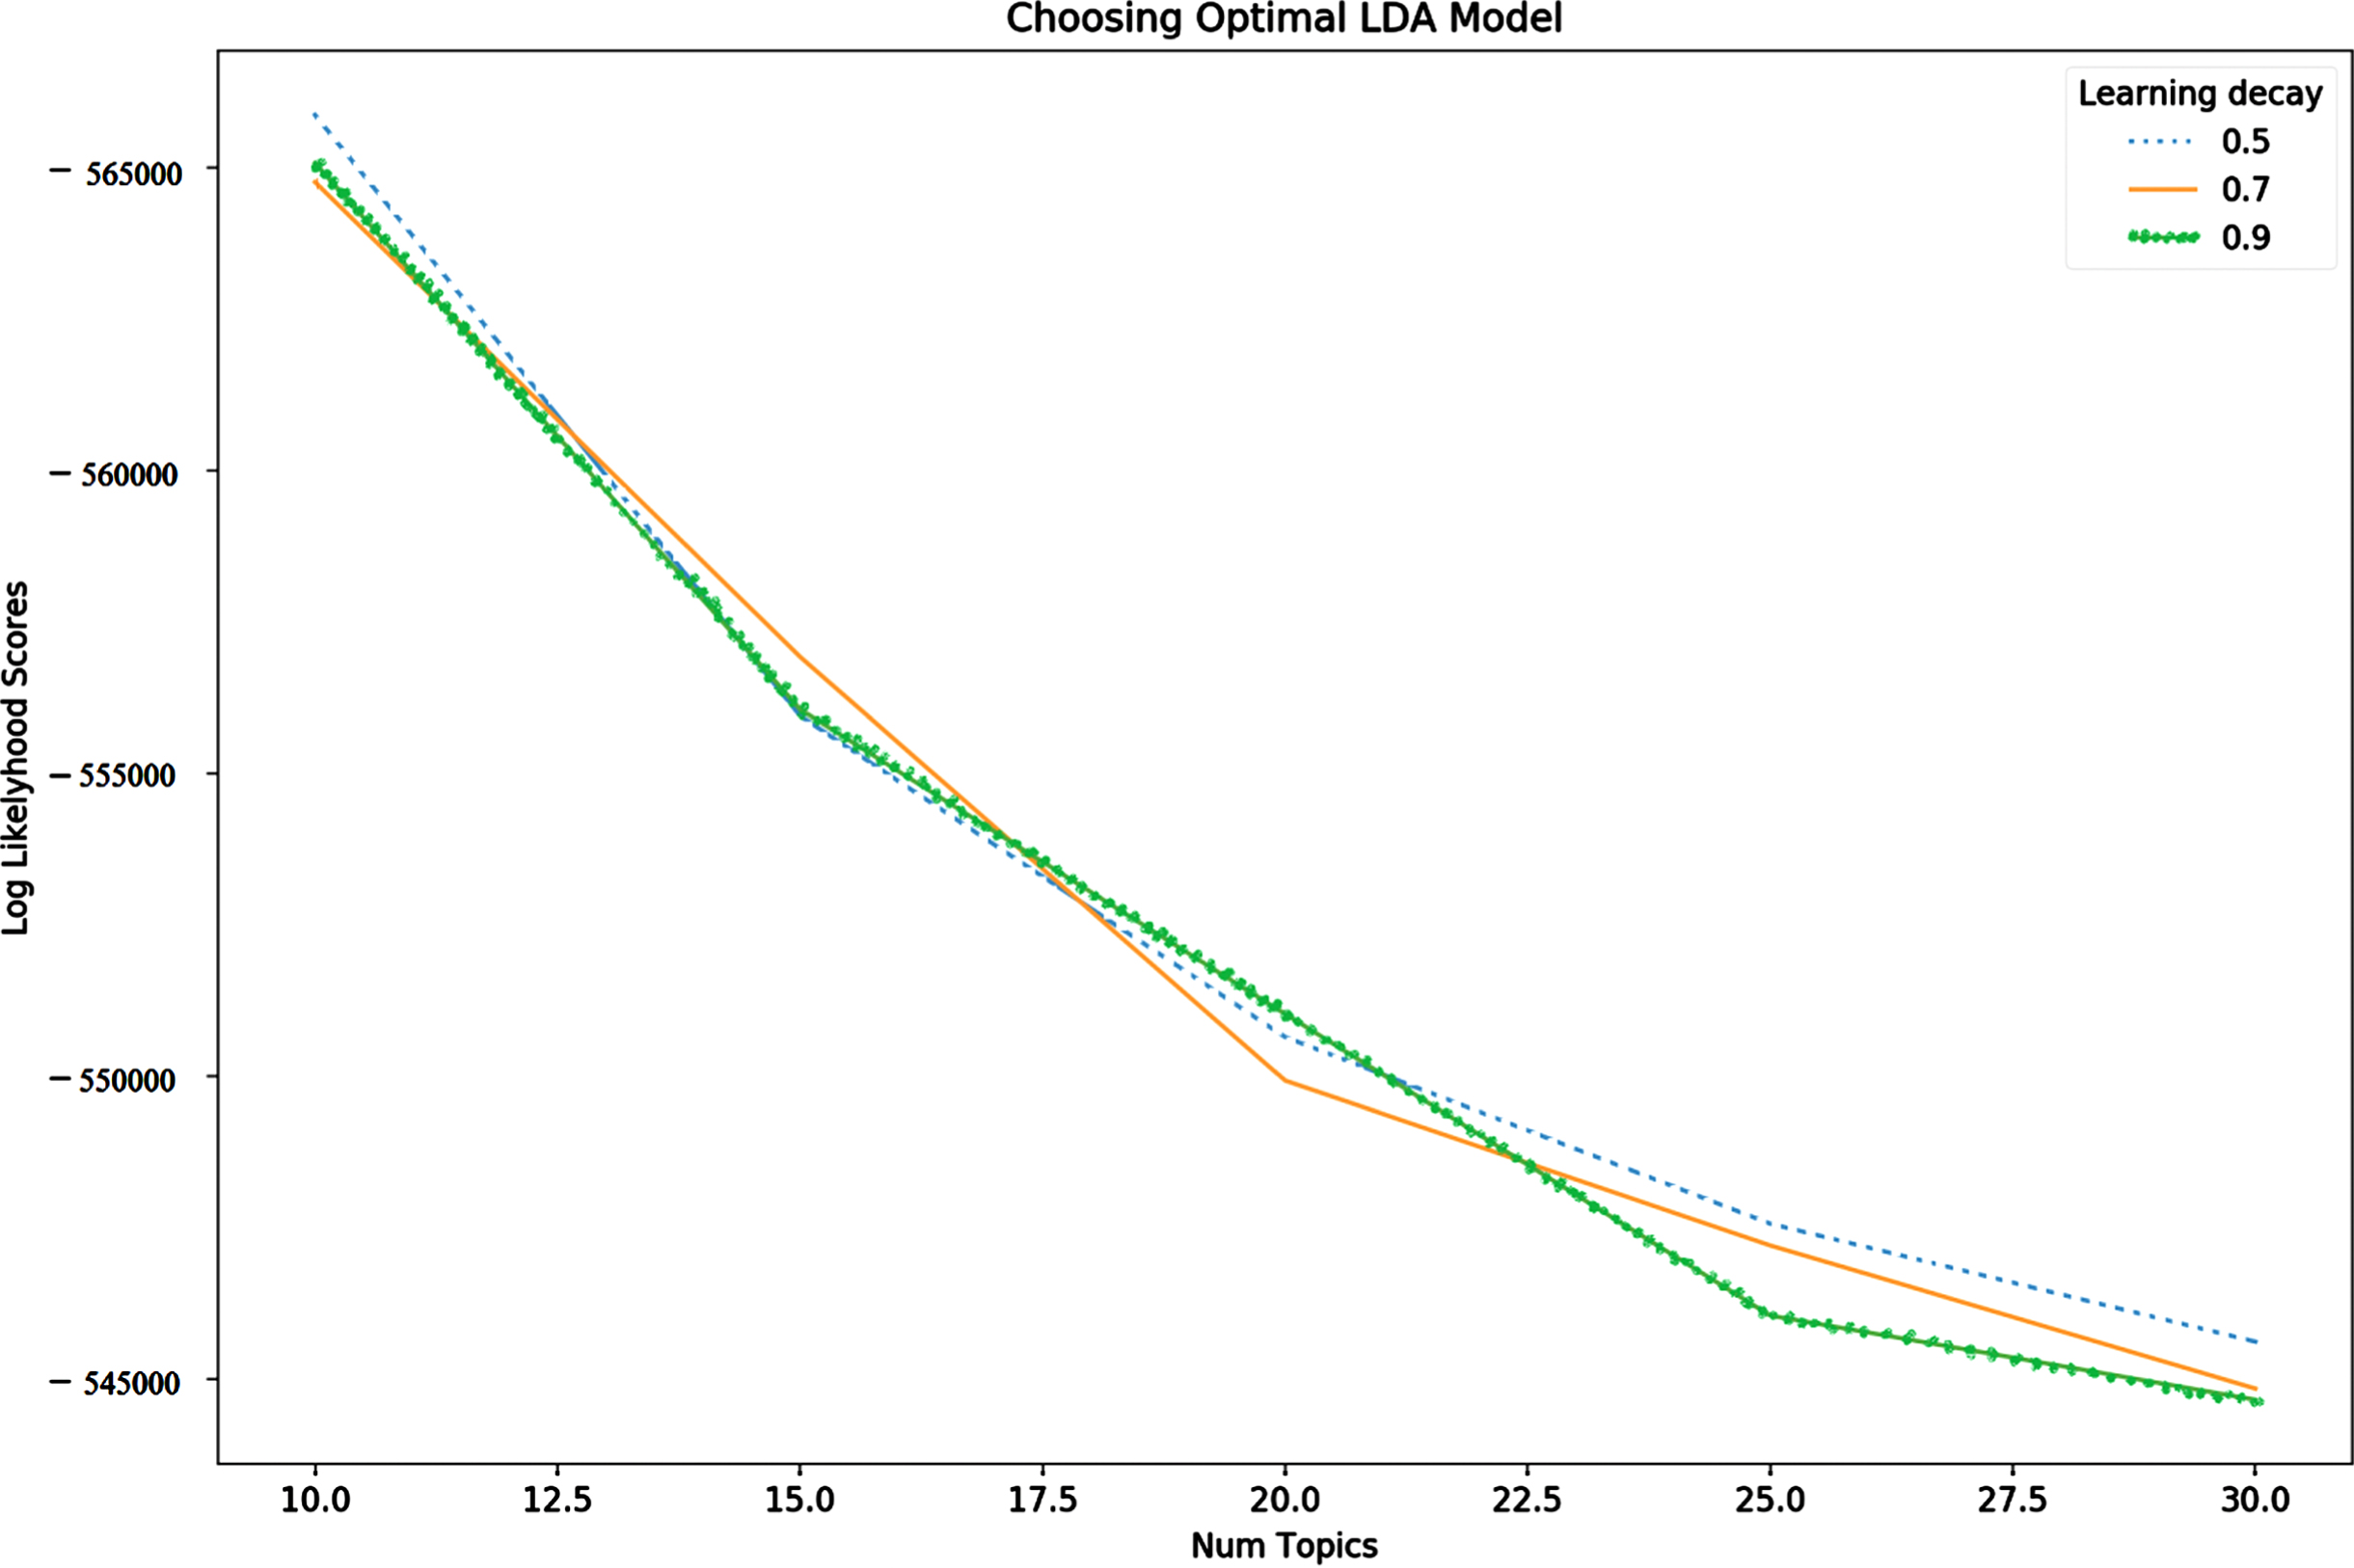
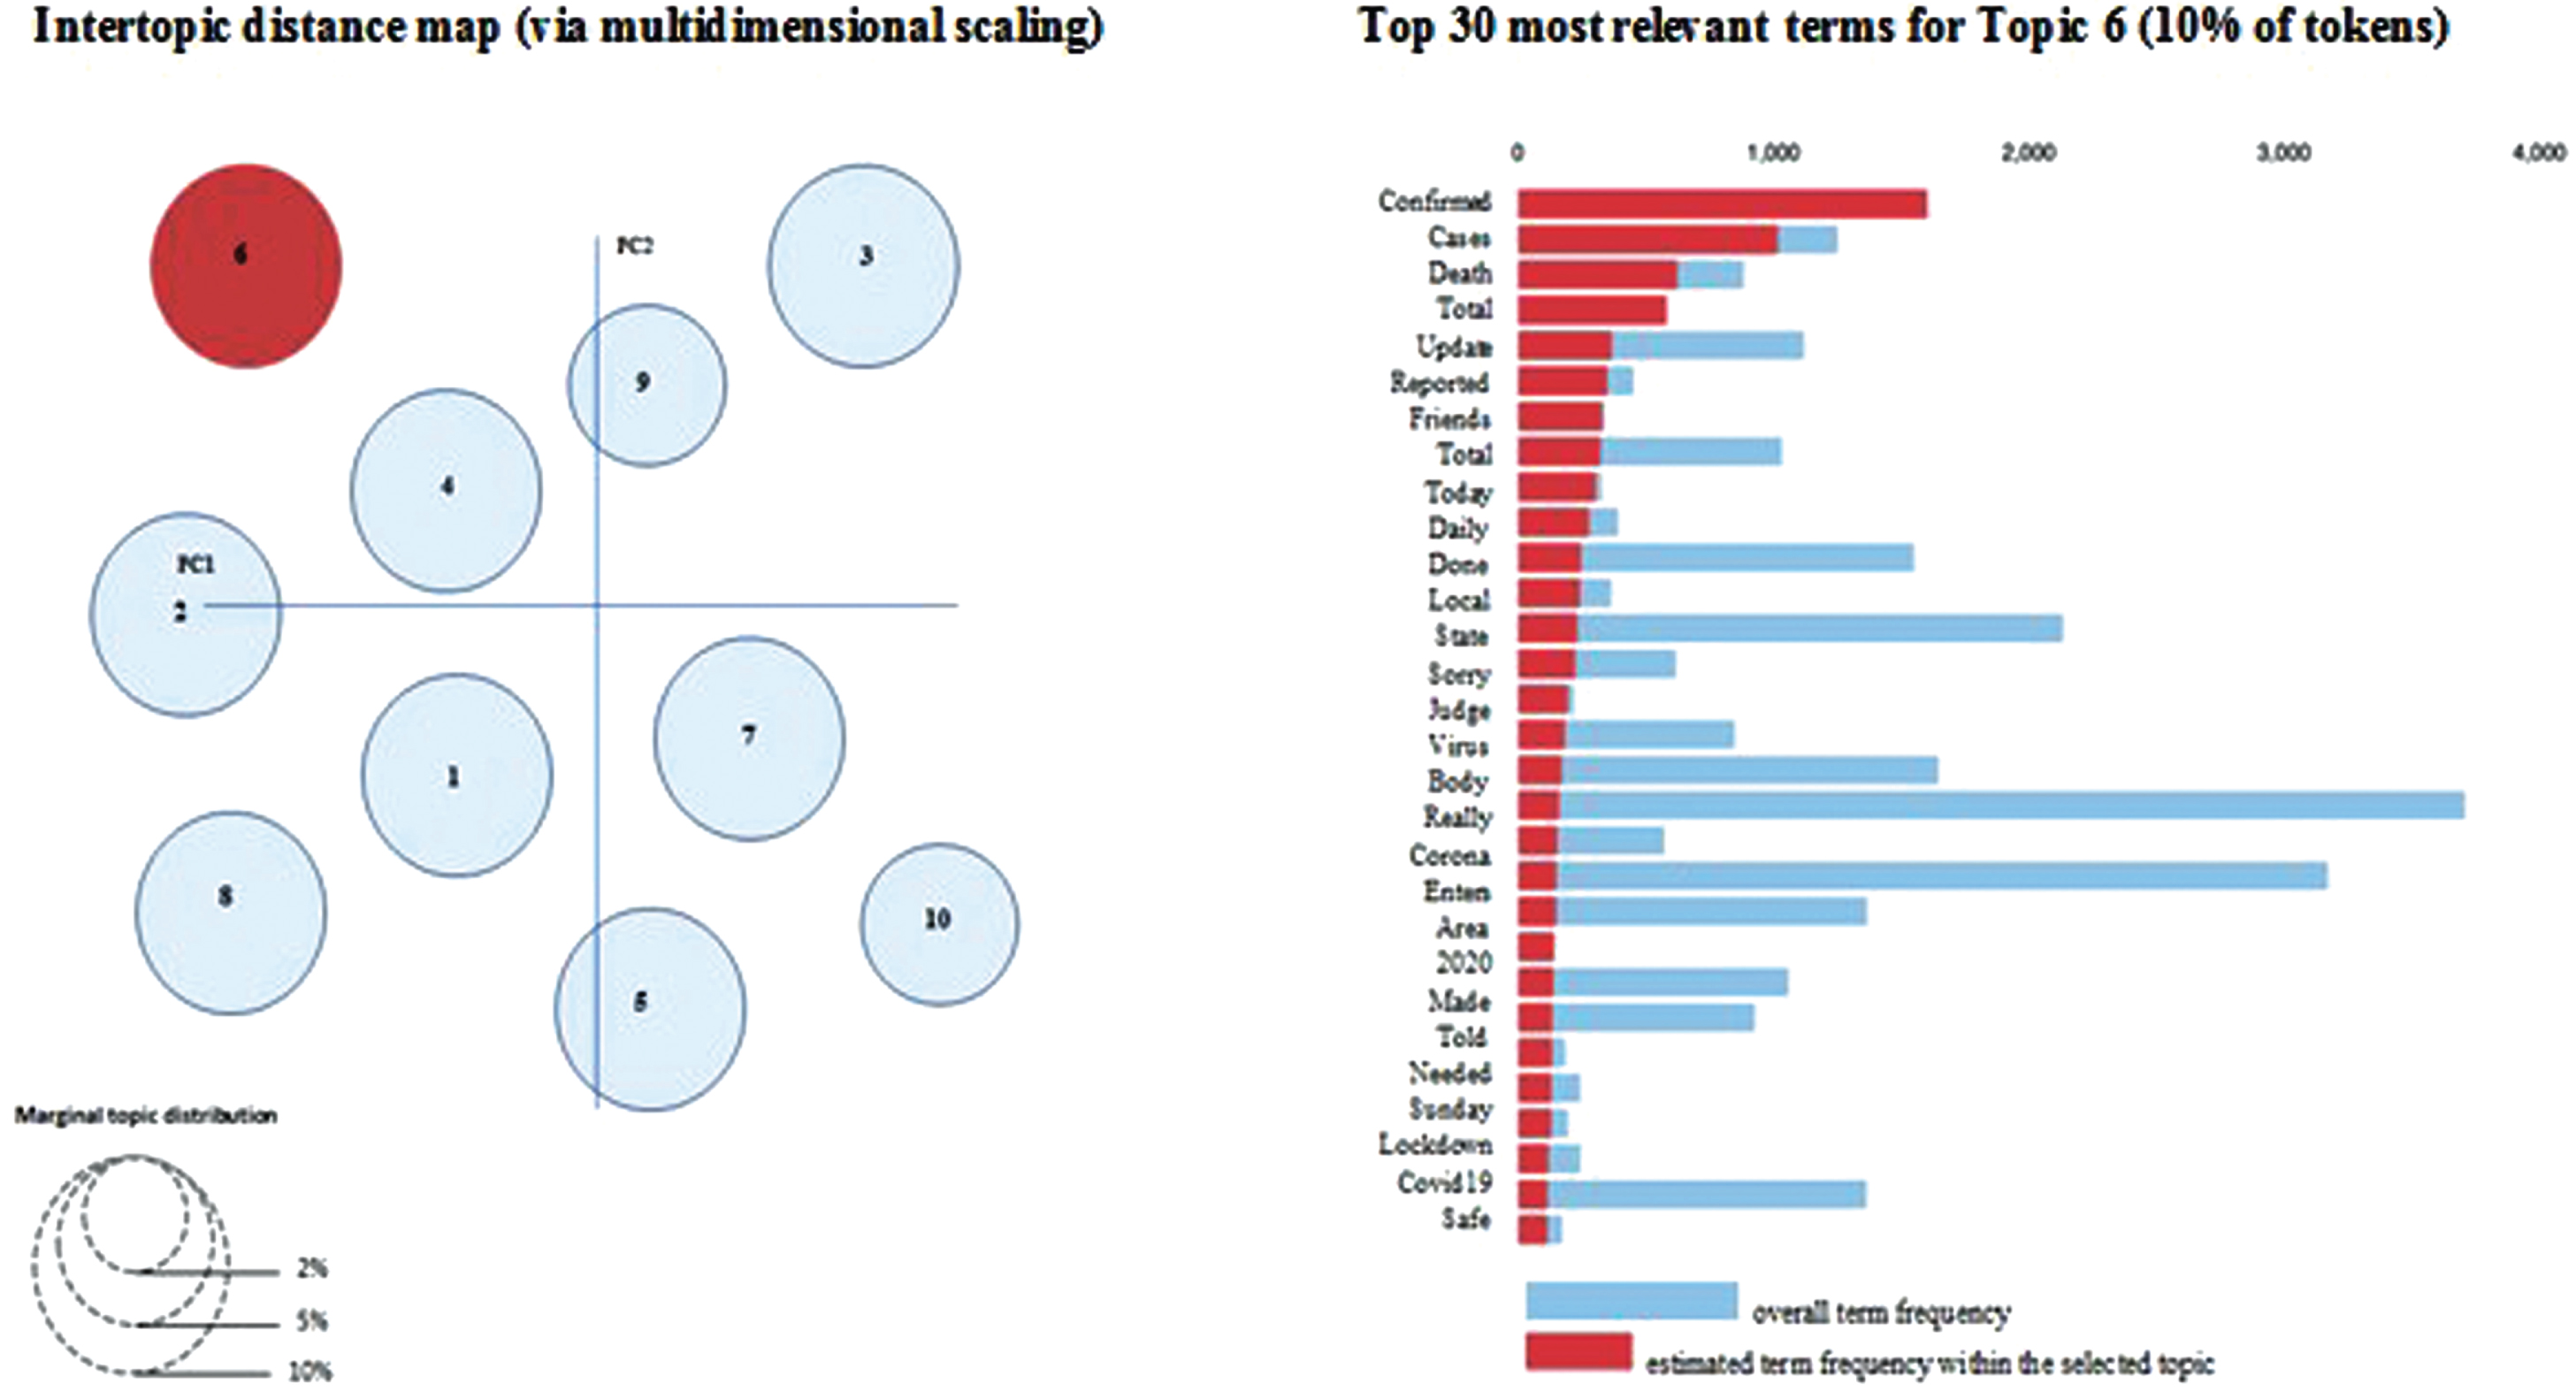
The higher log-likelihood, the more accurate model is as a high likelihood shows that the most unseen portions of COVID-19-related text data. These are categorized within one of the topics which are generated by utilizing the model, and only very few are turned out to not be involved in the topics. The graph depicts the changes in the log-likelihood of the LDA model as a function of the total number of topics and learning decay. From the graph, the optimal number of topics is 10 and the optimal learning decay is 0.5 as the log-likelihood value is maximum at this point is gathered. The most frequently arising keywords are depicted in Fig. 3 for one of the 10 topics. These words had the most influence on the creation of the topics. A topic distance map is represented along with the most important words which were part of each topic is shown in Fig. 3. The circular blobs depict one of the 10 topics which are sufficiently spaced from everyone with a lack of overlapping which represents a good topic model. Thus, the topic distance [8] is computed and the Intertopic distance map [15] is shown in Fig. 3. The succeeding list shows the topmost 10 topics discovered in the Covid-19-related dataset (example., “topic 1”) and the 10 most typical words related to every identified topic (example., “public, cases, fresh, death, period, china, fight, lockdown” for “topic 1”), correspondingly.
Fig. 3
LDA model visualization.
– topic 1: public, cases, fresh, death, period, china, fight, lockdown
– topic 2: Soap water, test kits, toilet paper, wearing the mask, 20 seconds
– topic 3: pandemic, help, need, wait, looks, care, sorry
– topic 4: health, month, people, question, think, vaccine, impact, support
– topic 5: Florida, drink, ice, focus, marketing, page, zero hedge
– topic 6: covid-19, total, confirmed, virus, corona, 2020, update
– topic 7: pmofindia, Narendra Modi, test positive, disease control, physicians
– topic 8: behavior, brought, lie, yup, smell, odds, salary, rats beard
– topic 9: travel ban, stay home, self-isolate,14 days, work home
– topic 10: internet, crush, joke, teacher, health
Several common themes is identified about each topic by observing the topic-wise common keywords. To compute the difference between the default LDA model and the optimized LDA model using a grid search, the likelihood, and perplexity of both the models are calculated and compared. The outcomes are shown in Table 3, which shows the log-likelihood and perplexity of both models that are computed and illustrated. A higher likelihood and lower perplexity denote a good topic model. The outcomes illustrate that the LDA model optimized using grid search is an enhancement over the standard LDA model.
4.2Emotion classification
A multi-class model is constructed for emotion classification in this module. The labeled Covid-19-related twitter dataset consisting of 40000 tweets and 11 emotion classes is the base dataset. All the emotion labels are transformed into integers with the help of a label encoder. Then, data binning is completed to provide the word count distribution of the Covid-19-related tweets in the dataset. The network trains much more effectively if an arbitrary sequence length was fixed for the model. The layers of the model are designed with an embedding layer, an LSTM layer comprising of 64 LSTM units, two dense layers utilizing the relu activation function, and a softmax output layer for emotion classification which are shown in Table 4.
Table 4
Layers of the RNN
| Layer (Type) | Output shape | Param |
| Input1 (input layer) | (None, 500) | 0 |
| Embedding1 (embedding) | (None, 500, 128) | 7382855 |
| Lstm1 (LSTM) | (None, 64) | 50529 |
| Dense1 (dense) | (None, 32) | 3191 |
| Dense2 (dense) | (None, 13) | 530 |
An embedding layer is created next to the input layer by calculating the vocabulary size for the dataset, the inputs, and the sequence length of each input. This is ensued with the help of the LSTM layer consisting of 64 units. Since the outcome of LSTM is not a softmax, 2 dense layers are organized after the LSTM layer to match the dimensionality of the expected target. Finally, a softmax output layer is used for multi-class emotion classification. The multi-class model is built to run for 100 epochs that include 27000 batch iterations and the model training loss curve of the model is shown in Fig. 4. As seen, the loss value declines rapidly around the 70 epoch after which it stabilizes to a value of approximately 0.2. The accuracy and additional evaluation metrics are calculated based on the trained model for emotion classification. The trained multi-class models are also used in prediction with Covid-19-related raw text data presented as an input for classification. The model classifies the text to one of 11 emotion classes depending on the probability of the text being appropriate to every class. The usage of the softmax layer restricts the generation of multiple emotions as output from a single piece of text. This is encountered because the dependent probability is used by the softmax for classifying each text into a single dominant emotion. Emotion prediction for Covid-19-related raw text data and different pieces of text data are presented as input, which is depicted in Fig. 5. To relate each topic with emotion, the model predicts an emotion for each of the tweets belonging to each topic and the dominant emotion for each topic is found by selecting the emotion with the highest frequency belonging to each topic. The twitter streaming API is used to obtain a sample of geo-tagged tweets from various locations to classify the emotions of tweets based on location. The different locations are clustered followed by plotting the frequency of occurrence of each emotion for each location.
Fig. 4
Model Training Loss.
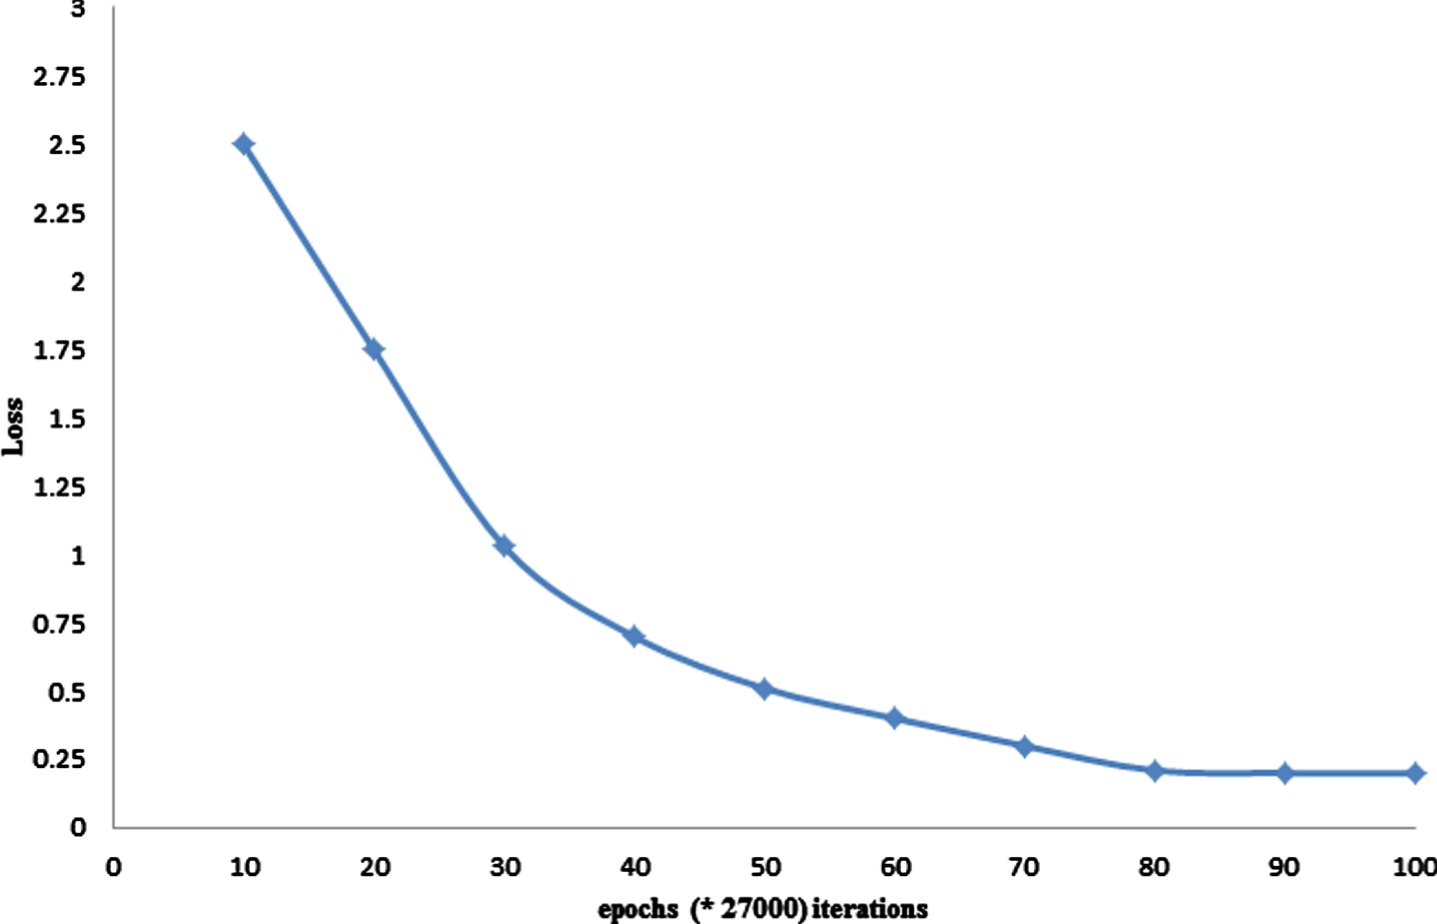
Fig. 5
Emotion Prediction for (a) Raw Text Data, (b) each Topic.
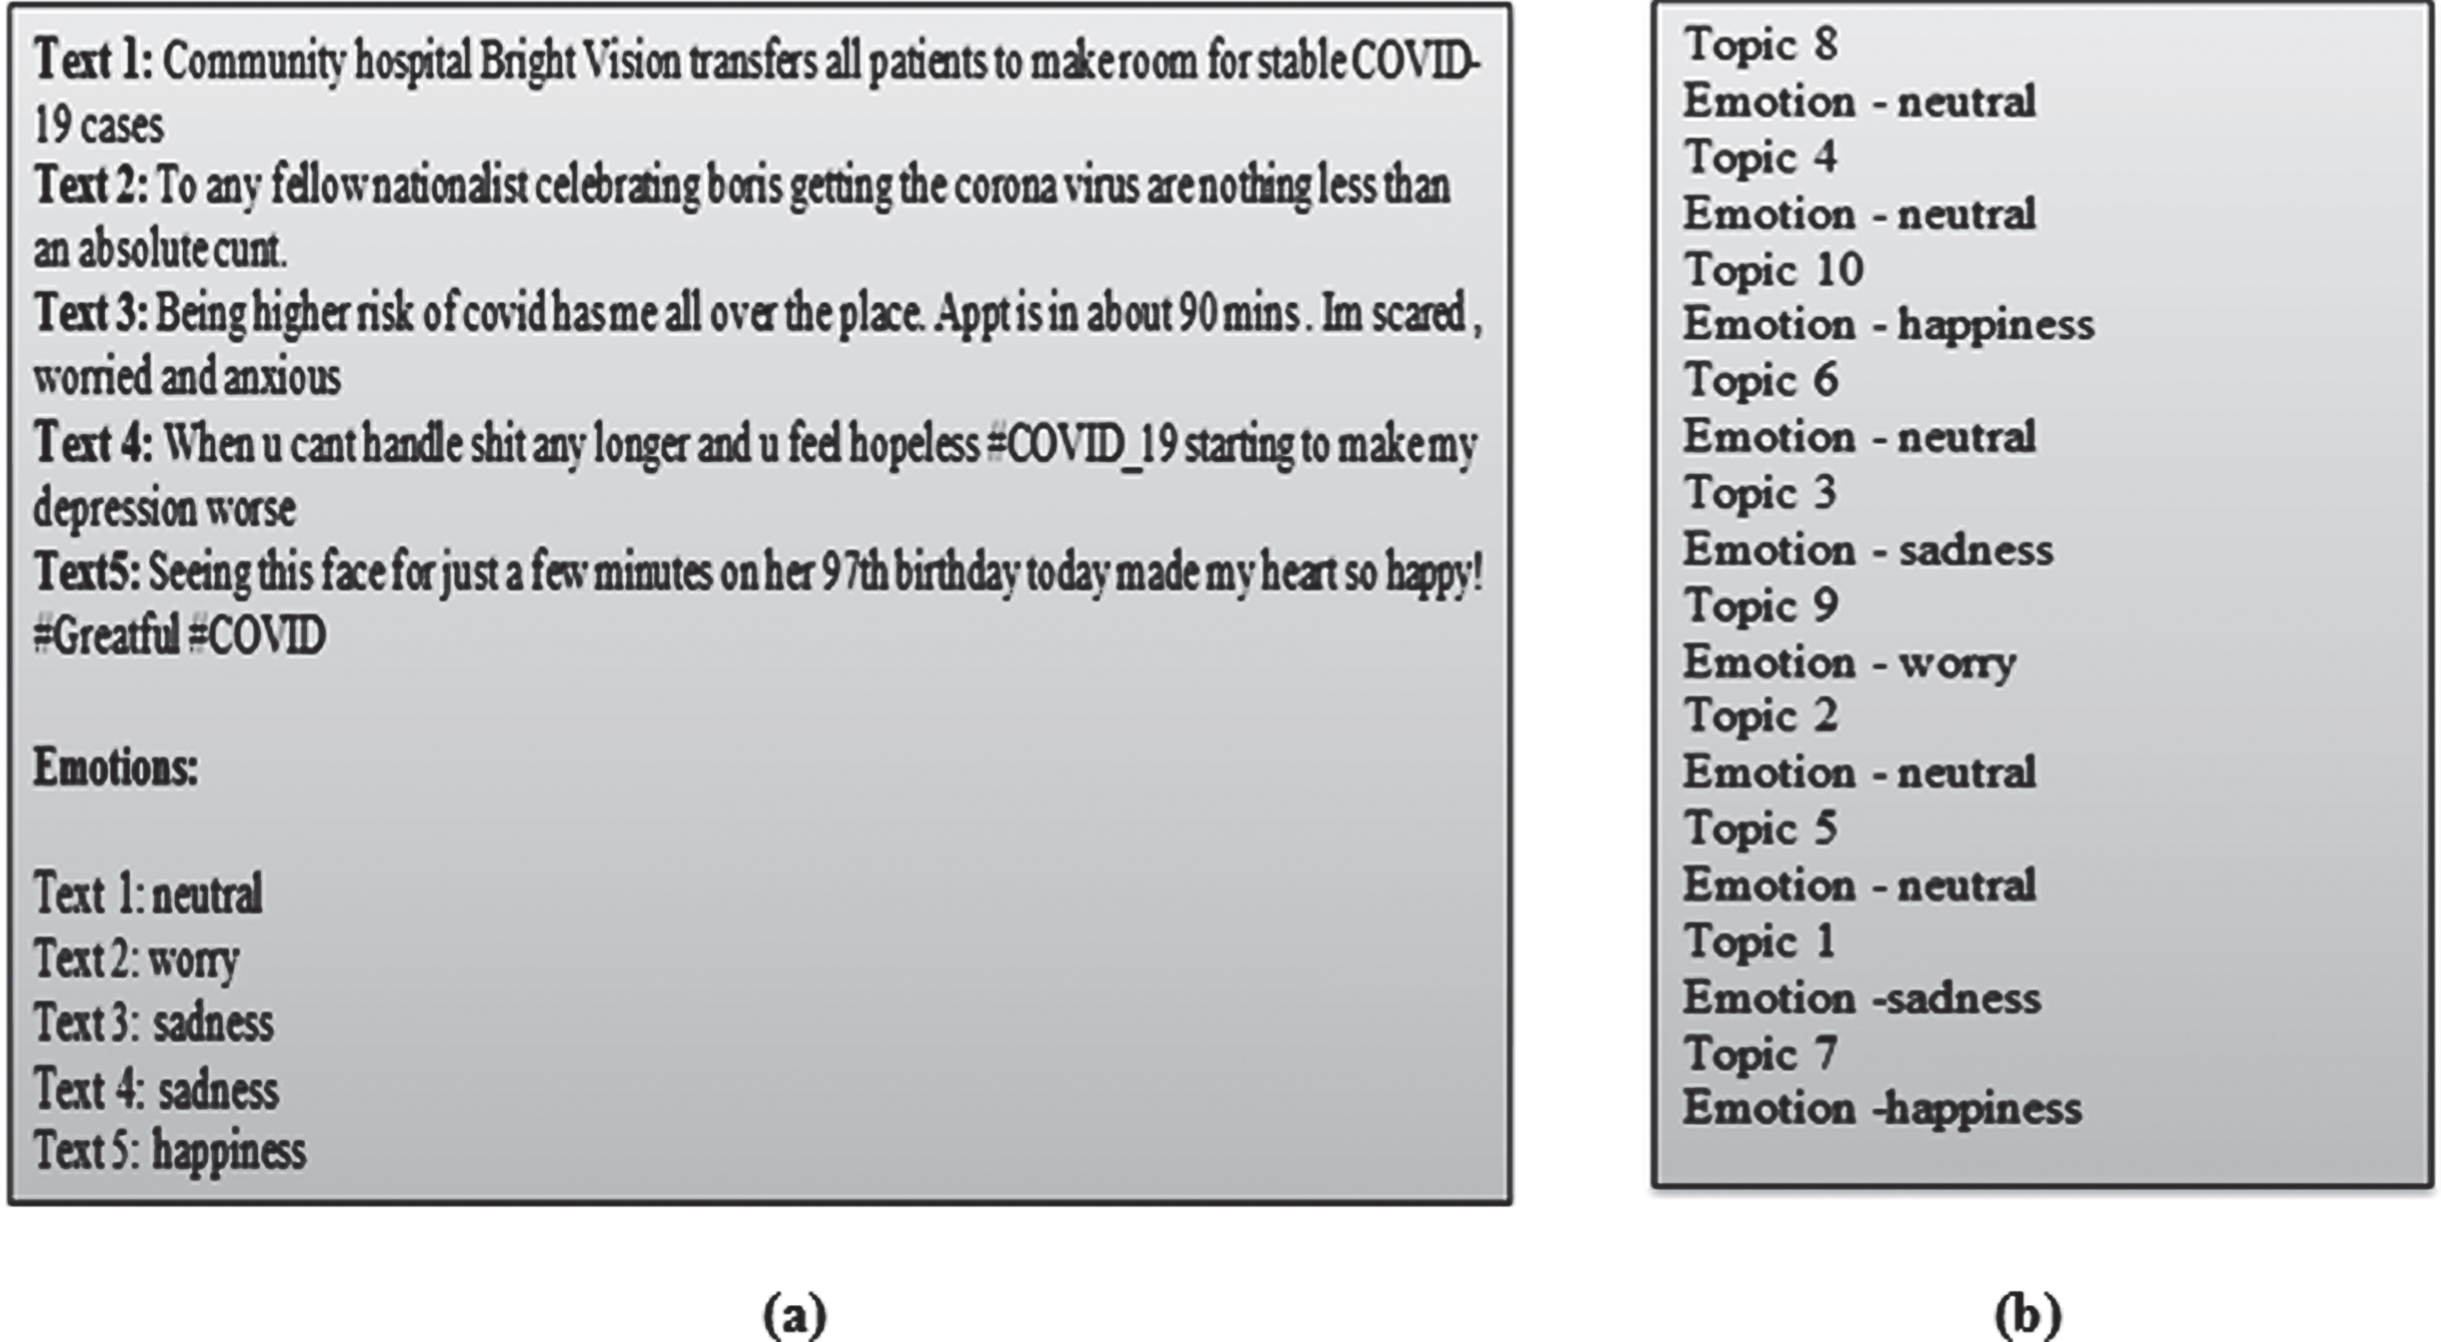
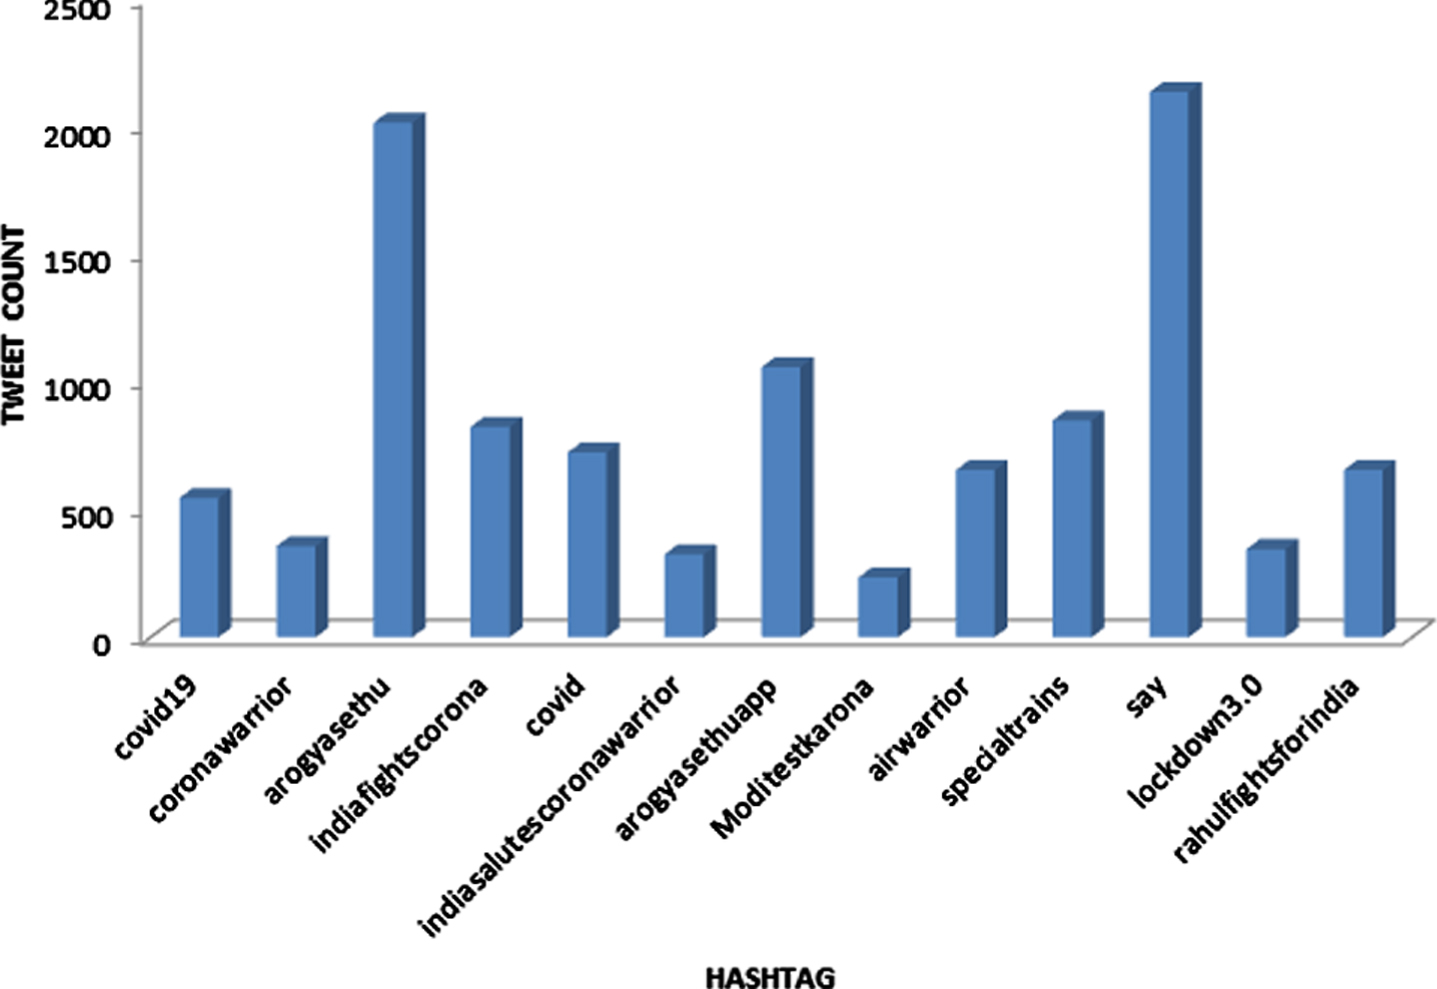
Tweets from different areas are grouped together country-wise. This will help in giving an overall view of the popular emotions in different countries. Prediction outcomes classifying each text into one of the 11 emotion classes (positive, worry, negative, fear, happiness, anger, anticipation, sadness, love, neutral, boredom) is shown in Fig. 6. The topmost positive and negative hashtag during the lockdown in India is shown in Figs. 7, 8.
Fig. 6
Emotional analysis of twitter users during lockdown in (a) United Kingdom, (b) United States of America, and (c) India.
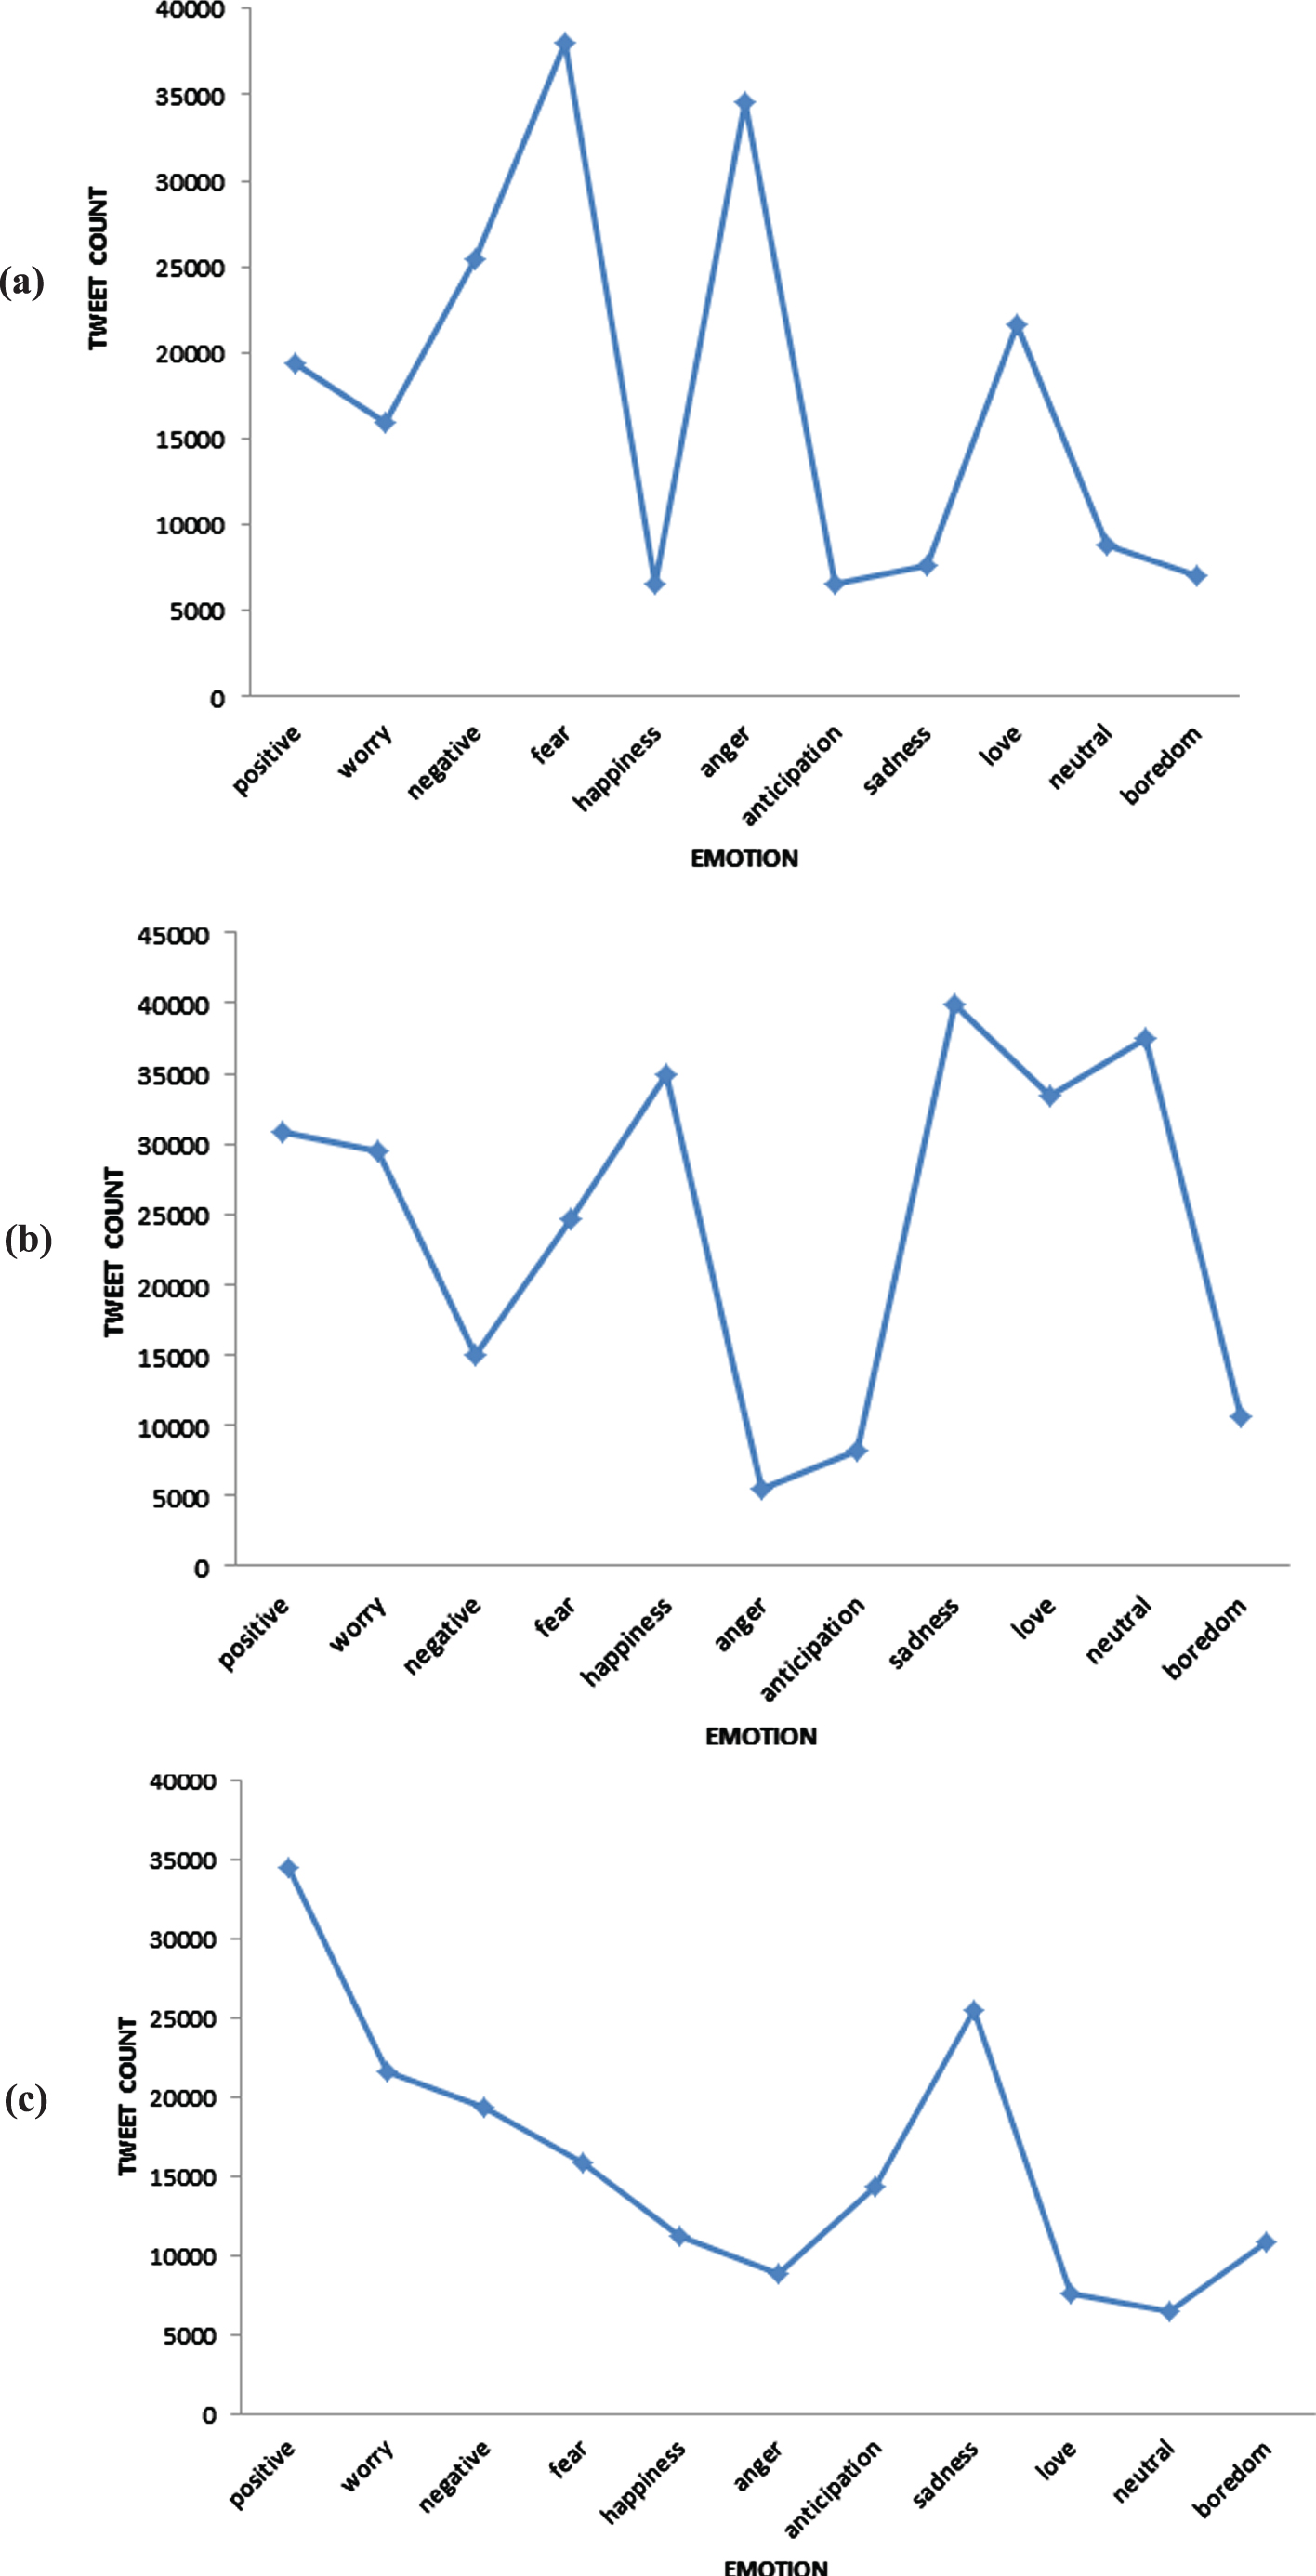
Fig. 7
Topmost positive hashtag during lockdown in India.
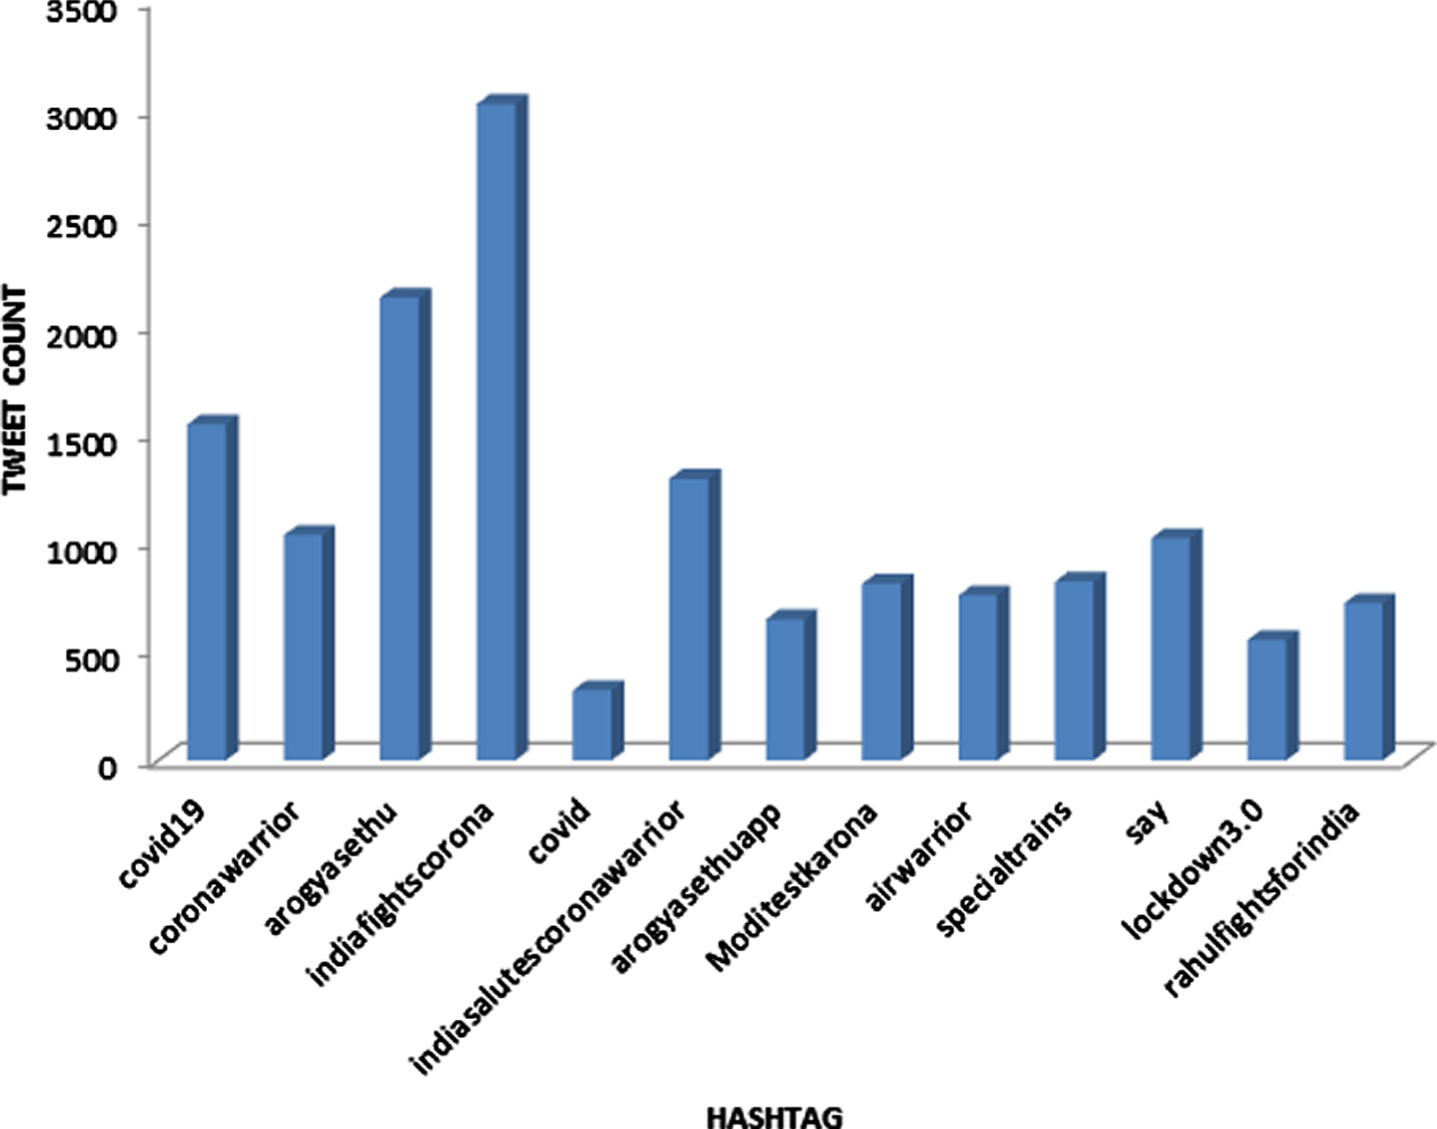
Fig. 8
Topmost negative hashtag during lockdown in India.
4.3Comparative analysis
As seen from Table 5, the evaluation metrics, namely the Precision, Recall, F1-score, and accuracy of the model are represented. The equations for these four evaluations metrics are:
(6)
(7)
(8)
(9)
Table 5
The comparative analysis of performance metrics with different LDA techniques
| Techniques | Precision | Recall | F1-score | Accuracy |
| Standard LDA [23] | 88.6 | 81.1 | 84.6 | 81.5 |
| LDA + Word2vector [31] | 92.0 | 84.1 | 87.9 | 85.4 |
| LDA + Maximum Entropy [29] | 96.0 | 86.4 | 90.8 | 89.3 |
| Hybrid HDP + LDA [27] | 95.1 | 91.7 | 93.3 | 92.0 |
| LDA + Synonym Lexicon [3] | 85.4 | 89.8 | 87.5 | 84.6 |
| LDA + SVM [26] | 97.4 | 92.6 | 94.9 | 93.8 |
| LDA + Feature ontology tree [10] | 95.2 | 87.1 | 90.9 | 89.1 |
| LDA + Grid Search (proposed) | 96.5 | 94.8 | 95.6 | 94.6 |
5Conclusion
In recent years, social media has been widely used by millions of people to express their opinions and emotions in real-time for an event or topic that has taken place. There is a rising demand to identify and categorize people’s emotions from various locations based on specific topics for communal emotion analysis. The objective of this paper is to predict the emotions of people during COVID-19 lockdown in different locations using a multi-class emotion classification model in coordination with the LDA topic model. This work presents an optimized LDA model based on grid search for topic modeling and constructs a multi-class emotion classification model by RNN. The developed model realizes the factors that influence the sentiments of various regions and how topics affect sentiments. The emotion model is used for predicting emotions in different locations and to classify the emotions for each topic that was generated using the LDA model. The results are useful in determining the emotions of COVID-19 tweets for various topics in different locations. In the future, the model can be extended to automatically name the title of every subject dependent on the tweets that it contains. This would help to gain knowledge about the topic instead of representing it in numbers as found in the current LDA models. Additionally, the current COVID-19-related twitter dataset needs more balancing, as there are a more significant number of tweets for specific classes than others. This would further reduce the model having a bias to those classes influencing the accuracy rate of recognition. Thus, combinations of the dataset which are balanced could be used. Our investigation likely paves a way to uncover the public’s emotional status and assist organizations in understanding the traits of human emotions during this COVID 19 lockdown.
Acknowledgments
The authors thank Anna Centenary Research Fellowship (ACRF) which is provided by Anna University, Chennai for the financial support of the research work.
References
[1] | Abdi A. , Shamsuddin S.M. , Hasan S. and Piran J. , Deep learning-based sentiment classification of evaluative text based on Multi-feature fusion, Information Processing & Management 56: (4) ((2019) ), 1245–1259. doi: 10.1016/j.ipm.2019.02.018. |
[2] | Menychtas A. , Galliakis M. , Tsanakas P. and Maglogiannis I. , Real-time integration of emotion analysis into homecare platforms, 2019 41st Annual International Conference of the IEEE Engineering in Medicine and Biology Society (EMBC) (2019), 3468–3471. doi:10.1109/embc.2019.8857484 |
[3] | Ma B. , Zhang D. , Yan Z. and Kim T. , An LDA and Synonym Lexicon Based Approach to Product Feature Extraction from Online Consumer Product Reviews, Journal of Electronic Commerce Research 14: (4) ((2013) ), 304–314. |
[4] | Viswanath B. , Bashir M.A. , Crovella M. , Guha S. , Gummadi K.P. , Krishnamurthy B. and Mislove A. , Towards detecting anomalous user behavior in online social networks, In Proc 23rd USENIX Conf Secur Symp (SEC) (2014), 223–238. |
[5] | Vaduva C. , Gavat I. and Datcu M. , Latent Dirichlet allocation for spatial analysis of satellite images, IEEE Transactions on Geoscience and Remote Sensing 51: (5) ((2013) ), 2770–2786. doi: 10.1109/tgrs.2012.2219314. |
[6] | Hsu C.-I. and Chiu C. , A hybrid Latent Dirichlet Allocation approach for topic classification, IEEE International Conference on INnovations in Intelligent SysTems and Applications (INISTA) (2017), 312–315. doi:10.1109/inista.2017.8001177 |
[7] | Lian D. , Zhao C. , Xie X. , Sun G. , Chen E. and Rui Y. , Geomf: Joint geographical modeling and matrix factorization for point-of-interest recommendation, In: Proc. 20th ACM SIGKDD Int. Conf. Knowl. Discovery Data Mining, New York, NY, USA, (2014), 831–840. doi:10.1145/2623330.2623638 |
[8] | Blei D.M. , Ng A.Y. and Jordan M.I. , Latent dirichlet allocation, Journal of Machine Learning Research (2003), 993–1022. |
[9] | Nguyen D.T. and Jung J.E. , Real-time event detection for online behavioral analysis of big social data, Future Gener Comput Syst 66: ((2017) ), 137–145. doi: 10.1016/j.future.2016.04.012 |
[10] | Santosh D.T. , Vardhan B.V. and Ramesh D. , Extracting product features from reviews using Feature Ontology Tree applied on LDA topic clusters, In Advanced Computing (IACC), IEEE 6th International Conference on IEEE, (2016), 163–168. |
[11] | Dataset. Twitter: Filter realtime tweets. https://developer.twitter.com/en/docs/tweets/filter-realtime/overview, (2020). |
[12] | Bravo-Marquez F. , Frank E. , Mohammad S.M. and Pfahringer B. , Determining Word-Emotion Associations from Tweets by Multi-Label Classification, 2016 IEEE/WIC/ACM International Conference on Web Intelligence (WI) (2016), 536–539. doi:10.1109/wi.2016.0091 |
[13] | Yin H. , Hu Z. , Zhou X. , Wang H. , Zheng K. , Nguyen Q.V.H. and Sadiq S. , Discovering interpretable geo-social communities for user behavior prediction, In: Proc. IEEE 32nd Int. Conf. Data Eng. (ICDE) (2016), 942–953. |
[14] | Hafzullah and Tuncer T. , Confidence index analysis of Twitter users timeline, In: Proc. Int. Conf. Artif. Intell. Data Process. (IDAP) (2018), doi: 10.1109/idap.2018.8620917 |
[15] | Chuang J. , Ramage D. , Manning C. and Heer J. , Interpretation and trust: designing model-driven visualizations for text analysis, Proceedings of the 2012 ACM Annual Conference on Human Factors in Computing Systems - CHI ’12, (2012). doi:10.1145/2207676.2207738 |
[16] | Rashid J. , Shah S.M.A. and Irtaza A. , Fuzzy topic modeling approach for text mining over short text, Information Processing & Management 56: (6) ((2019) ), 102060. doi: 10.1016/j.ipm.2019.102060 |
[17] | Samuel J. , Rahman MD.M. , Ali G.G.MD.N. , Samuel Y. , Pelaez A. , Chong P.H.J. and Yakubov M. , Feeling Positive About Reopening? NewNormal Scenarios FromCOVID-19 US Reopen Sentiment Analytics, IEEE Access (8) (2020), 142173–142190. doi:10.1109/access.2020.3013933 |
[18] | Savigny J. and Purwarianti A. , Emotion classification on you tube comments using word embedding, 2017 International Conference on Advanced Informatics, Concepts, Theory, and Applications (ICAICTA) (2017). doi:10.1109/icaicta.2017.8090986 |
[19] | Zhang J. , Chen Y. , Zhao Y. , Wolfram D. and Ma F. , Public health and social media: A study of Zika virus-related posts on yahoo! answers, J Assoc Inf Sci Technol 71: ((2020) ), 282–299. doi: 10.1002/asi.24245 |
[20] | Li L. , Zhang Q. , Wang X. , Zhang J. , Wang T. , Gao T.-L. , Duan W. , Tsoi K.K.-F. and Wang F.-Y. , Characterizing the propagation of situational information in social media during COVID-19 epidemic: A case study on weibo, IEEE Trans Comput Social Syst 7: (2) ((2020) ), 556–562. |
[21] | Zheng N. , Du S. , Wang J. , Zhang H. , Cui W. , Kang Z. , Yang T. , Lou B. , Chi Y. , Long H. , Ma M. , Yuan Q. , Zhang S. , Zhang D. , Ye F. and Xin J. , Predicting COVID-19 in China using hybrid AI model, IEEE Trans Cybern 50: (7) ((2020) ), 2891–2904. |
[22] | Yang P. , Yao Y. and Zhou H. , Leveraging Global and Local Topic Popularities for LDA-Based Document Clustering, IEEE Access 8: ((2020) ), 24734–24745. doi: 10.1109/access.2020.2969525 |
[23] | Liu Q. , Employing Latent Dirichlet Allocation Model for Topic Extraction of Chinese Text, Theory and Application 9: (7) ((2016) ), 51–66. |
[24] | Ahuja R. , Gupta R. , Sharma S. , Govil A. and Venkataraman K. , Twitter based model for emotional state classification, 2017 4th International Conference on Signal Processing, Computing and Control (ISPCC) (2017), 494–498. |
[25] | Rosa R.L. , Schwartz G.M. , Ruggiero W.V. and Rodríguez D.Z. , A knowledge-based recommendation system that includes sentiment analysis and deep learning, IEEE Trans Ind Informat 15: (4) ((2019) ), 2124–2135. |
[26] | Raja Mohana S.P. , Umamaheswari K. and Karthiga R. , Sentiment Classification based on Latent Dirichlet Allocation, International Conference on Innovations in Computing Techniques (2015), 14–16. |
[27] | Ding W. , Song X. , Guo L. , Xiong Z. and Hu X. , A Novel Hybrid HDP-LDA Model for Sentiment Analysis, 2013 IEEE/WIC/ACM International Joint Conferences on Web Intelligence (WI) and Intelligent Agent Technologies (IAT) (2013), 329–336. doi:10.1109/wi-iat.2013.47 |
[28] | Hong W. , Zheng X. , Qi J. , Wang W. and Weng Y. , Project Rank: An Internet Topic Evaluation Model Based on Latent Dirichlet Allocation, IEEE 13th International Conference on Computer Science & Education (ICCSE) (2018). doi:10.1109/iccse.2018.8468739 |
[29] | Zhao W.X. , Jiang J. , Yan H. and Li X. , Jointly Modeling Aspects and Opinions with a MaxEnt-LDA Hybrid, Proceedings of the 2010 Conference on Empirical Methods in Natural Language Processing (2010), 56–65. |
[30] | Zhao X. , Wang D. , Zhao Z. , Liu W. , Lu C. and Zhuang F. , A neural topic model with word vectors and entity vectors for short texts, Information Processing and Management 58: ((2021) ), 102455. doi: 10.1016/j.ipm.2020.102455 |
[31] | Wang Z. , Ma L. and Zhang Y. , A Hybrid Document Feature Extraction Method Using Latent Dirichlet Allocation and Word2Vec, 2016 IEEE First International Conference on Data Science in Cyberspace (DSC), (2016), 98–103. doi:10.1109/dsc.2016.110 |

