
Assessing Chinese campus building energy performance using fuzzy analytic network approach
Abstract
Buildings were responsible for over 30% of total Chinese energy consumption in 2010. With a wild range of climate conditions and a separate air conditioning structure in campus buildings, it is significant but difficult to assess the energy performance of campus buildings in China. This paper proposes a novel mechanism to assess energy performance of campus buildings, using a fuzzy analytic network process (FANP). Six criteria are used as key performance indicators based on climate conditions in China and the air conditioning device deployment structure in campus buildings: 1) building envelope; 2) renewable energy; 3) illumination; 4) thermal comfort; 5) window and door; and 6) occupation status. A simulation is presented to illustrate the effectiveness of the proposed approach, analyzing three different rooms in the International School of Software, at Wuhan University. Assessment results are discussed in terms of optimizing future energy performance of campus buildings.
1Introduction
Globally, buildings are responsible for 40% of the total energy consumption and contribute to more than 30% of CO2 emissions [1]. In China, buildings accounted for approximately 24.1% of total national energy use in 1996, rising to over 30% in 2010 [17]; this was projected to increase to nearly 40% by 2020 [16, 35]. In addition, power shortages are a serious problem for countries worldwide [18, 29]. For example, China had a second quarter electrical power deficit of 44.85–49.85 GW in 2011 [12] and that number experienced a dramatic increase later [22]. With the projected increase of the global population from 6.5 billion in 2005 to approximately 9.0 billion in 2035, the power shortage problem is expected to continue to grow [27]. Improving energy performance of buildings is therefore becoming a key international objective [24].
In order to optimize building energy performance [46], many research organizations have invested significant resources to create sustainably-built environments, emphasizing sustainable building renovation processes in order to reduce energy consumption and carbon dioxide emissions [25, 50]. Many building rating systems (BRS) have been designed and implemented for building engineers and building managers to assess building energy performance [3, 21, 32]. The Building Research Establishment Environmental Assessment Method (BREEAM) [13] and Leadership in Energy and Environmental Design (LEED) [9] are the two most widely-recognized building energy performance assessment methodologies and are used globally in buildings and construction industries [26].
China has an area of approximately 9.6 million km2, approximately 98% of the land area stretches between a latitude of 20°N and 50°N, from subtropical zones in the south to temperate zones (including warm-temperate and cool-temperate zones) in the north [4]. The maximum solar altitudes vary considerably and there is a large diversity in climates [20]. China has over 2000 universities, and each university has hundreds of buildings [47]. Most of these buildings are deployed with separate air conditioning devices, meaning that a single device heats and cools only one room and is independent from other devices [19]. In order to improve the energy performance of these buildings, it is essential to assess the energy performance of rooms in buildings. Due to the complex climate conditions and the unique air conditioning device structure, current BRS methods cannot be directly adopted to assess Chinese campus building energy performance.
Based on the Analytic Hierarchic Process (AHP) [41], the Analytic Network Process (ANP) [43] was designed as a more generalized model to solve multi-decision making problems. ANP does not assume any preconditions about the independence of higher level elements from lower level elements. Fuzzy theory [30] is used to address the disadvantages of accurate mathematical logic and language, and focuses on the fuzziness of factors used in multi-criteria evaluation problems [28]. Researchers have attempted to integrate APN and fuzzy theory to construct a fuzzy analytic network process (FANP) method [48] for multi-criteria decision making problems. The FANP allows complex interrelationships among decision levels and attributes, and can deal with the uncertainty of imprecision and vagueness of language [33]. This paper utilizes the FANP to assess the energy performance of Chinese campus buildings. Six key performance indicators were chosen for the proposed approach: 1) building envelope; 2) renewable energy; 3) illumination system; 4) thermal comfort; 5) window and door; and 6) occupation status. An example documents three rooms (i.e., one classroom, one computer lab and one office) in the International School of Software at Wuhan University, to illustrate the effectiveness of the proposed approach.
The reminder of this paper is organized as follows: Section 2 describes related works that have attempted to assess building energy performance and optimize building operation. The primary characteristics and key performance indicators of the proposed approach are documented in detail in Section 3. Section 4 presents a case study utilizing the proposed approach to illustrate its effectiveness. Finally, conclusions are provided in Section 5.
2Related works
2.1Building rating system
Building Research Establishment was developed BREEAM in 1990 [44] as an assessment, rating, and certification method for building energy performance. BREEAM accomplishes an assessment process with independent, licensed assessors and nine criteria (i.e., water, waste, transport, innovation, pollution, management, materials, health and wellbeing, and energy). Each criterion contains a number of sub-criteria and is weighted (Table 1) [26] for overall evaluation of building performance. Building performance is rated and certified on a scale of “Unclassified”, “Pass”, “Good”, “Very good”, “Excellent” and “Outstanding”.
The U.S. Green Building Council designed the LEED, a set of evaluation systems for the design, construction, operation, and maintenance of buildings [8]. LEED provides building owners and managers with an evaluation framework, which is environmentally responsible and uses resources efficiently. LEED assesses building energy performance based on seven criteria (i.e., regional priority, innovation in operations, material and resources, water efficiency, sustainable sites, energy and atmosphere, and indoor environmental quality). Weights of these criteria are listed in Table 2 [26]. LEED classifies building performance on a scale of “Unclassified”, “Certified”, “Silver”, “Good”, and “Platinum”.
The BREEAM approach and the LEED approach have been widely adopted to assess building energy performance [2, 49], but the two methods also require building performance expertise to conduct and supervise the assessment processes. This engenders additional cost for building energy performance assessment. In addition, the two methods do not take the Chinese climate condition and unique air conditioning device structure in campus buildings into account. Therefore, they cannot be directly used to assess energy performance of campus buildings in China.
2.2Multi criteria decision analysis
The nature of building energy performance assessment is a multiple criteria evaluation problem, which can be addressed using a multiple criteria decision analysis (MCDA) method (also called multiple criteria decision making) [10]. MCDA is a sub-discipline of operations research that explicitly considers multiple criteria in decision-making environments [15]. A number of criteria work as alternatives to a problem, which is defined as obtaining the best criterion for a decision maker (DM), based on the weights of the set of criteria. However, it is often difficult to conduct an accurate evaluation, considering feelings and recognition of objects for DMs. The reason for this is the ambiguity of human recognition and feeling, as well as the availability and uncertainty of information in evaluation processes [26].
In order to help DMs accomplish a comprehensive evaluation result, fuzzy set theory is widely employed by MCDA methods [5, 38]. The fuzzy set theory utilizes a number of sets, whose elements have degrees of membership, to illustrate the availability and uncertainty of information, which is essential to solving multi-criteria decision making problems [23]. Fuzzy linguistic models can be used to translate verbal expressions into numerical ones. Multiple criteria methods use fuzzy relations to quantitatively handle imprecision in the expression of the importance of each criterion [51]. Fuzzy multiple criteria decision analysis (FMCDA) has been widely adopted to deal with decision making problems (i.e., multiple criteria evaluation/selection of alternatives) [45] and have shown advantages in dealing with unquantifiable/qualitative issues and achieving reliable results [11, 34].
In order to comprehensively assess building energy performance, a set of criteria must be used as performance indicators. The ANP can empower building performance expertise to analyse the impact of each criterion on every other criterion, according to pairwise comparisons [42]. However, building performance experts cannot always explain their judgments about certain attributes, such as quality or performance, with distinct and discrete scales. The fuzzy set theory allows expertise to illustrate evaluation models in linguistic terms.
Based on the advantages of fuzzy set theory and the ANP, this paper applies a fuzzy analytic network process to the assessment Chinese building energy performance. The approach chooses six key performance indicators, taking into consideration the climate condition in China and the air conditioning device structure in Chinese campus buildings. The six indicators are: building envelope, renewable energy, illumination, thermal comfort, window and door, and occupation status. The proposed approach enables campus building managers to assess building energy performance with knowledge of building performance expertise, to serve as a basis for future building operation optimization.
3The fuzzy analytic network process approach
3.1The FANP approach
A fuzzy set is a class of objects with a continuum of grades of membership. Such a set is characterized by a membership function, which assigns to each object a grade of membership ranging between zero and one.
A triangular fuzzy number (TFN) M (Fig. 1) is a fuzzy number represented by three parameters (l, m, u). The parameter of l is the smallest possible value in a fuzzy event; the parameters m and u are the most promising value and the largest possible value, respectively. A TFN has linear representations on its left and right side, and its membership function is defined by Equation (1), where f M (x) : R → [0, 1].
(1)
Based on the TFN, the process of the FANP comprises the following four steps:
– Model construction
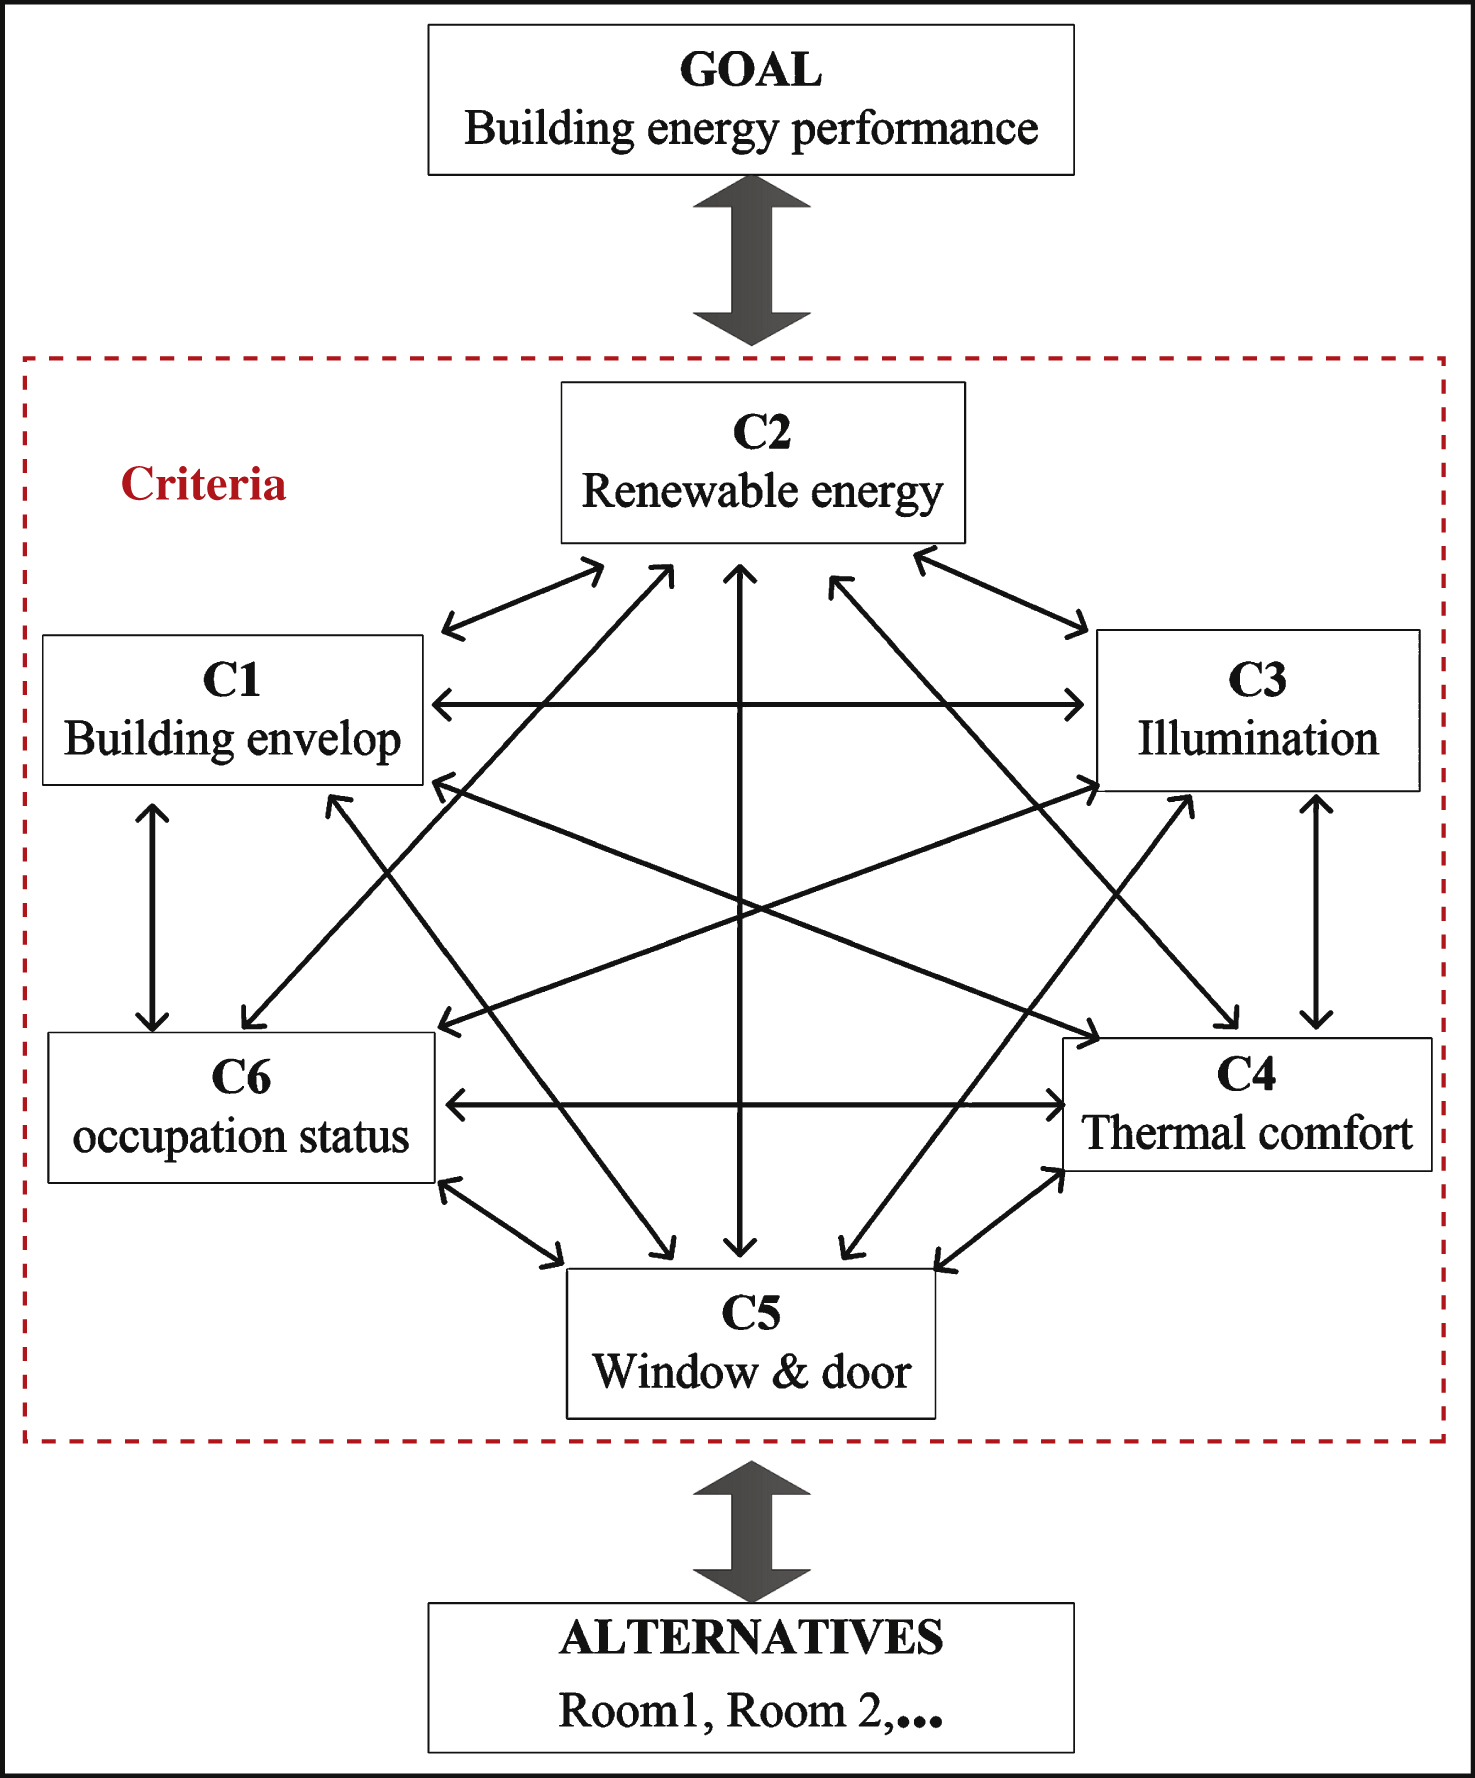
An ANP approach consists of two main parts. The first part is a control network, containing a set of criteria and sub-criteria, which is used to control the interactions in the approach under evaluation. The second part is an impact network containing influences among elements and clusters in the model. The impact network varies by criterion. The ANP approach decomposes a problem into a set of criteria, and each criterion can have a set of sub-criteria. Sub-criteria of a criterion can interact with some or all sub-criteria of another criterion. Relationships among elements in the same criterion are represented by arcs with directions. The model of the proposed approach is shown in Fig. 2.
– Pairwise comparisons matrix establishment
In order to construct a pairwise comparison matrix, pairwise criteria are compared with respect to their impacts on other criteria. The method of conducting pairwise comparisons and obtaining priority vectors is the same as in AHP. The relative importance values are computed using the linguistic scales of relative importance, as illustrated in Table 3. A score of 0.5 indicates equal importance of the two criteria, while 0.9 represents the extreme importance of one criterion compared to another.
In a pairwise comparison matrix Equation (2), the score of p ij Equation (3) represents the relative importance of the component in the ith row over the component in the jth column (Table 3); the complementary value Equation (3) is used when the component j is compared to component i. The proposed approach selects one criterion (criterion k) from all criteria, and assign the component i of a pairwise comparison matrix to the relative importance value of criterion i and criterion k. The value of component j in the pairwise matrix is the relative importance value of criterion j and criterion k. Therefore, a pairwise comparison matrix is constructed by regarding criterion k as the reference criterion, and n pairwise comparison matrices are constructed for a multi-criteria problem with an n number of criteria.
(2)
(3)
The inconsistency ratio (IR) is used to identify possible errors and actual inconsistencies in comparison matrices. For example, if criterion C is less important than criterion B and criterion B is less important than criterion A, then criterion A is definitely more important than criterion C. If the value of IR is smaller or equal to 10% , comparison matrices are acceptable for the next step; if the IR is greater than 10% , comparison matrices should be evaluated and revised. The inconsistency value is considered during all stages of pairwise comparison construction [7].
– Weighted supermatrix formatting
Based on pairwise comparison matrices, a priority value of criterion j (C j ) is calculated according to Equation (4), and a probability value P (C j ≥ C k ) is calculated according to Equation (5). The minimum probability of criterion j is obtained according toEquation (6).
(4)
(5)
(6)
A local priority vector is constructed using minimum probabilities. If criterion i functions as the reference criterion of a pairwise comparison matrix, the local priority vector of the comparison matrix is calculated according to Equation (7).
(7)
After normalization, local priority vectors are entered into appropriate columns of a supermatrix Equation (8). The supermatrix is used to calculate globalpriorities.
(8)
– Comprehensive weight calculations
A supermatrix is constructed with n (number of criteria) local priority vectors according to step 3. Final priorities of criteria can be obtained in corresponding columns in a limit supermatrix. The limit supermatrix is constructed with the supermatrix by raising it to exponents Equation (9). The purpose of the Equation (9) is to compute influence transmission along all possible paths in the supermatrix.
(9)
3.2Key performance indicators
The proposed approach uses six key performance indicators to assess the energy performance of campus buildings in China. These indicators are chosen based on Chinese climate conditions and the air conditioning device deployment structure in campus buildings, namely: building envelop, renewable energy, illumination, thermal comfort, window and door, and occupation status (Fig. 2).
– Building envelop
Building envelop is a type of building component, which is used to separate indoor space from outdoor space, e.g. windows and doors, roofs, and exterior walls. Building envelop is essential to the heat transfer between indoors and outdoors, and works as a key factor affecting building energy performance. In order to evaluate heat gain and loss of the building envelope, three design parameters were identified by previous research [20]: 1) the U-values of external walls, windows and roof; 2) window-to-wall ratio (i.e., ratio of the window area to the total external wall area, including windows) and skylight-to-roof ratio (i.e., ratio of the skylight area to the total roof area, including skylight); and 3) shading coefficients of the glazing materials.
– Renewable energy
Renewable energy (e.g., sunlight and wind) is a special type of energy from resources that are naturally replenished on a human timescale [14].
REN21’s 2014 report [36] concluded that renewable energy comprises 19% of the global energy consumption in 2012 and 22% of the electricity generation in 2013. Renewable energy provides resources and significant opportunities to improve building energy efficiency over wide geographical areas, whereas other types of energy sources are concentrated in a limited number of countries. The proposed approach used the proportion of renewable energy in buildings to evaluate building energy performance in regard to this indicator.
– Illumination
Illumination is important for teachers and students to conduct teaching, research and learning. Illumination stems from two sources: 1) the natural light from the sun; and 2) the light from illumination systems deployed in buildings. The effectiveness of the natural light depends on the weather and the design of windows in rooms. The effectiveness of the illuminating system comes from the lamp material and the structure of the system. This approach utilizes indoor illumination, outdoor illumination, the design of the illumination system, and the status of the illuminating system (on/off) to evaluate the illumination performance of a room.
– Thermal comfort
The thermal comfort of occupants is considered a key requirement by most research organisations. The Predicted Mean Vote (PMV) and Predicted Percentage Dissatisfied (PPD) [31] are two thermal comfort indicators, which form the basis of the ISO 7730 thermal comfort standard [6]. The two indicators are used to predict the mean response of a large group of people to thermal conditions. Due to a shortage of corresponding environment data required by PMV and PPD, the proposed approach evaluates thermal comfort of occupants according to outdoor temperature, indoor temperature and indoor relative humidity (Fig. 3).
– Window and door
The design, the materials used, and the status (open/close) of windows and doors affect the energy performance of rooms, particularly in summer when the average temperature is greater than 30°C and in winter when the average temperature is lower than 10°C in China. Windows and doors should be closed to improve energy efficiency of air conditioning devices in summer and winter. However, they should be open to improve natural ventilation when the outdoor temperature is suitable for occupants in spring and autumn. This paper calculates the score of the window and door criterion according to the area of windows and doors in rooms, as well as their status as opened or closed.
– Occupation status
The purpose of energy consumption devices in buildings is to provide bright and comfort environment for occupants. Rooms should achieve zero energy consumption by turning off all devices, if there are no occupancies. Therefore, occupied status is very important in assessing building energy performance. The longer the unoccupied status of a room with devices turned on, the lower the energy performance of the room. This paper evaluates the performance of the occupation status criterion through the time of unoccupied status of a room and the status of illumination and air conditioning devices.
4Demonstrator
This paper proposes a FANP to assess energy performance campus buildings in China. In order to test its effectiveness, a demonstrator is built in International School of Software, in Wuhan University. This section constructs six pairwise comparison matrixes based on the climate condition of Wuhan city and air conditioning devices deploying structure in International School of Software.
(10)
(11)
One comparison matrix, viewing C1 as the reference criterion, is illustrated in Table 4. The weighted supermatrix Equation (10) is generated using the six comparison matrixes. The limit supermatrix Equation (11) is computed through the weighted supermatrix.
A sensitivity analysis is performed using criteria weights in the limit supermatrix. It is obvious that the occupied status is the most import criterion among these criteria. The reason is that the purpose of energy consumption in buildings is to provide a comfortable environment for occupancies, especially teachers and students in universities. The second most important factor is the thermal comfort criterion. The thermal comfort of occupants is considered a key stakeholder requirement by most research organizations. The thermal comfort level of occupants directly affects energy consumption in buildings. Follow next is the renewable energy criterion and the building envelope criterion. The renewable energy utilization can smooth the power shortage problem of the world, without damaging the environment. Performances of the renewable energy exploitation strongly affect the energy performance of buildings, especially in China with huge electricity shortage in summer and winter. The building envelope is essential to heating and cooling efficiency of air conditioning systems deployed in buildings, especially in summer in Wuhan (i.e. temperature higher than 30°C). The last two factors are the window & door criterion and the illumination criterion. The window & door systems moderately affect the heating and cooling efficiency of air conditioning systems in rooms. The illumination systems are consisted of low power devices and the natural sun light can provide much illumination during day time. The illumination criterion is the least important factor among other criteria.
The International School of Software, in Wuhan University, has 3 departments including the Department of Software engineering the Department of Spatial Information & Digital Techniques, and the Department of the Internet of Things. The school has nearly 100 staffs, and 1,500 students, and has three main buildings containing tens of classrooms, offices and computerlabs.
This demonstrator picks three rooms (one classroom, one computer lab, one office) and evaluates their energy performance. The three rooms locate in three different buildings. The classroom is 100 m2 with 70 m2 windows and doors, approximately. 100 students can sit in the classroom for lectures. Three air conditioners (i.e. each 2 Kilowatt (KW)) are deployed in the classroom. The computer lab is 120 m2 with 40 m2 windows and doors, approximately. 80 computers and three 2 KW air conditioners are deployed in this lab. The office is 20 m2 with 8 m2 windows and doors, approximately. One 1 KW air conditioner is installed in this office.
The proposed approach is used to evaluate energy performance of the three rooms. The energy performance of the classroom is illustrated in Fig. 4. The classroom achieves stable performance according to three criteria (i.e. the building envelope criterion (7.8), the renewable energy (0), and the illumination criterion (8.6)). Due to zero performance on the renewable energy, the classroom just achieves a good energy performance (score 6.56, Table 5). An outstandingperformance on the occupied status is showed in the Fig. 4, due to nearly 90 students having lecture. Two fluctuations can be seen during the evaluating process, due to the breaks between lectures. At last, the classroom achieves zero energy consumption after 10:35, when there are no lectures in the classroom.
The energy performance of the computer lab is illustrated in Fig. 5. The lab also achieves stable performance on three criteria (i.e. the building envelope criterion (7.9), the renewable energy (0), and the illumination criterion (6.8)). Duet to the same reason with the classroom (i.e. zero renewable energy), the lab just achieves a good energy performance (score 6.38, Table 5). An outstanding performance on the occupied status also is shown in Fig. 5. However, a worse performance on the thermal comfort criterion, compared with the classroom (the lab: 6, the classroom: 7.2), is detected in the lab. The reason is the heat generated by computers in the lab. Two fluctuations also can be seen during the evaluating process with breaks between lab-based lectures. Zero energy consumption is achieved after 10:35, without lectures in the lab.
The energy performance of the office is illustrated in Fig. 6. The performance of the office according to three criteria is stable (i.e. the building envelope criterion (7.7), the renewable energy (0), and the illumination criterion (6.8)). Due to the same reason with the previous two rooms (zero renewable energy), the office just achieves a good energy performance (score 6.0, Table 5). With only one teacher occupying the office, it just gets a good performance on the occupied status (6.9), but a better performance on the thermal comfort (8.2). Two fluctuations can be seen in the chart, due to two unoccupied periods in the office when the air conditioning device is turned on. In general, the energy performance of the office is the worst among the three rooms.
On the basis of assessments results, several suggestions are provided to improve energy performance of these rooms as follows: 1. All three rooms have a very bad performance on the renewable energy. Although it is still difficult to use much renewable energy in Wuhan, some devices can be deployed to obtain solar energy for these buildings. 2. Energy saving lamps should be used for all rooms to improve performance on the illumination criterion. 3. Precooling technology [40] and preheating technology [37] can be used to improve the performance of air conditioning devices for the classroom and the lab. 4. Laptops should be deployed to reduce energy consumption and heating generation in the computer lab. 5. Bigger offices, allowing several staffs work together, should be used to replace separate small offices to improve performance on the occupation criterion.
5Conclusion
China has various climate conditions and most Chinese campus buildings have separate air conditioning devices structure. In order to assess energy performance of campus buildings, this paper proposes a fuzzy analytic network process approach based on six criteria, namely building envelope, renewable energy, illumination, thermal comfort, window and door, and occupation status. A detailed description is documented to illustrate how to integrate the triangular fuzzy number and analytic network process to calculate a limit supermatrix, which is used to assess building energy performance. The paper also estimates the fuzzy algorithm on three rooms (a classroom, a computer lab, and an office) in the International School of Software, Wuhan University. Six complementary comparison matrixes are obtained, through climate condition in Wuhan city and air conditioning devices structure of the three rooms. With a limit supermatrix calculate with the six matrixes, the proposed approach accomplishes energy performance assessments for the three rooms, illustrating that its effectiveness upon assessing energy performance of campus buildings, using the defined six criteria.
Acknowledgments
The work presented in this paper was supported by the International S&T Cooperation Program of China under grant No. 2013DFA12460, and Science Foundation Ireland (SFI) under the International Strategic Cooperation Award (Grant Number SFI/12/ISCA/2496).
References
1 | Costa A, Keane MM, Torrens JI, Corry E (2013) Building operation and energy performance: Monitoring, analysis and optimisation toolkit Applied Energy 101: 310 316 |
2 | GhaffarianHoseini A, Dahlan ND, Berardi U, GhaffarianHoseini A, Makaremi N, Ghaffarian Hoseini M (2013) Sustainable energy performances of green buildings: A review of current theories, implementations and challenges Renewable andSustainable Energy Reviews 25: 1 17 |
3 | Joudi A, Svedung H, Cehlin M, Rönnelid M (2013) Reflective coatings for interior and exterior of buildings and improving thermal performance Applied Energy 103: 562 570 |
4 | Zhang B, Fan YZ, Dyks J, Kobayashi S, Mészáros P, Burrows DN, Nousek JA, Gehrels N (1992) Climate of China New York Wiley |
5 | Celik E, Bilisik ON, Erdogan M, Gumus AT, Baracli H (2013) An integrated novel interval type-2 fuzzy MCDM method to improve customer satisfaction in public transportation for Istanbul Transportation Research Part E, Logistics and Transportation Review 58: 28 51 |
6 | Iso E (2005) Ergonomics of the thermal environment–Analytical determination and interpretation of thermal comfort using calculation of the PMV and PPD indices and local thermal comfort criteria International Organization for Standardisation Geneva |
7 | Demirtas EA, Üstün Ö (2008) An integrated multiobjective decision making process for supplier selection and order allocation Omega 36: 1 76 90 |
8 | Boeing G, Church D, Hubbard H, Mickens J, Rudis L (2014) LEED-ND and livability revisited Berkeley Planning Journal 27: 1 31 55 |
9 | Newsham GR, Mancini S, Birt BJ (2009) Do LEED-certified buildings save energy? Yes, but… Energy and Buildings 41: 8 897 905 |
10 | Wei G, Zhang N (2014) A multiple criteria hesitant fuzzy decision making with Shapley value-based VIKOR method Journal of Intelligent & Fuzzy Systems: Applications in Engineering and Technology 26: 2 1065 1075 |
11 | Aplak HS, Türkbey O (2013) Fuzzy logic based game theory applications in multi-criteria decision making process Journal of Intelligent & Fuzzy Systems: Applications in Engineering and Technology 25: 2 359 371 |
12 | J. Bai and T. Miles, TABLE-China power shortage forecasts by region, 2011, Available: http://af.reuters.com/article/energyOilNews/idAFL3E7H20ZT20110602 |
13 | Prior J (1993) Building research establishment environmental assessment method, BREEAM) Version 1 93 |
14 | Twidell J, Weir T (2015) Renewable energy resources Routledge |
15 | Ye J (2014) A multicriteria decision-making method using aggregation operators for simplified neutrosophic sets Journal of Intelligent & Fuzzy Systems: Applications in Engineering and Technology 26: 5 2459 2466 |
16 | Wang J, Zhai ZJ, Jing Y, Zhang C (2011) Influence analysis of building types and climate zones on energetic, economic and environmental performances of BCHP systems Applied Energy 88: 9 3097 3112 |
17 | Chmutina K (2010) Building Energy Consumption and its Regulations in China China Policy Institute, School of Contemporary Chinese Studies, International House, The University of Nottingham |
18 | Hernandez L, Baladron C, Aguiar JM, Carro B, Sanchez-Esguevillas AJ, Lloret J, Chinarro D, Gomez-Sanz JJ, Cook D (2013) A multi-agent system architecture for smart grid management and forecasting of energy demand in virtual power plants Communications Magazine, IEEE 51: 1 106 113 |
19 | Ni L, Dong J, Yao Y, Shen C, Qv D, Zhang X (2015) A review of heat pump systems for heating and cooling of buildings in China in the last decade Renewable Energy 84: 30 45 |
20 | Yang L, Lam JC, Tsang CL (2008) Energy performance of building envelopes in different climate zones in China Applied Energy 85: 9 800 817 |
21 | Yang L, Yan H, Lam JC (2014) Thermal comfort and building energy consumption implications–A review Applied Energy 115: 164 173 |
22 | Zhang L, Ruan J, Ding J (2014) The institutional power shortage in China: Capacity shortage or capacity under-utilisation? Applied Energy 136: 480 494 |
23 | Zadeh LA (1965) Fuzzy sets Information and Control 8: 3 338 353 |
24 | Hamdy M, Hasan A, Siren K (2013) A multi-stage optimization method for cost-optimal and nearly-zero-energy building solutions in line with the EPBD-recast Energy and Buildings 56: 189 203 |
25 | Indraganti M, Ooka R, Rijal HB, Brager GS (2014) Adaptive model of thermal comfort for offices in hot and humid climates of India Building and Environment 74: 39 53 |
26 | Kabak M, Köse E, Kirilmaz O, Burmaoğlu S (2014) A fuzzy multi-criteria decision making approach to assess building energy performance Energy and Buildings 72: 382 389 |
27 | Dixit MK, Fernácute andez-Solís JL, Lavy S, Culp CH (2010) Identification of parameters for embodied energy measurement: A literature review Energy and Buildings 42: 8 1238 1247 |
28 | Tseng M-L, Lin Y, Chiu A, Liao J (2008) Using FANP approach on selection of competitive priorities based on cleaner production implementation: A case study in PCB manufacturer Clean Technologies and Environmental Policy 10: 1 17 29 Taiwan |
29 | Aman M, Jasmon G, Ghufran A, Bakar A, Mokhlis H (2013) Investigating possible wind energy potential to meet the power shortage in Karachi Renewable and Sustainable Energy Reviews 18: 528 542 |
30 | Cordón O (2011) A historical review of evolutionary learning methods for Mamdani-type fuzzy rule-based systems: Designing interpretable genetic fuzzy systems International Journal of Approximate Reasoning 52: 6 894 913 |
31 | Fanger PO (1970) Thermal comfort, Analysis and applications in environmental engineering Copenhagen, Denmark Danish Technical Press |
32 | Xu P, Chan EH (2013) ANP model for sustainable Building Energy Efficiency Retrofit (BEER) using Energy Performance Contracting (EPC) for hotel buildings in China Habitat International 37: 104 112 |
33 | He Q, Luo L, Hu Y, Chan AP (2015) Measuring the complexity of mega construction projects in China— A fuzzy analytic network process analysis International Journal of Project Management 33: 3 549 563 |
34 | Lin R, Zhao X, Wei G (2014) Models for selecting an ERP system with hesitant fuzzy linguistic information Journal of Intelligent & Fuzzy Systems: Applications in Engineering and Technology 26: 5 2155 2165 |
35 | Yao R, Li B, Steemers K (2005) Energy policy and standard for built environment in China Renewable Energy 30: 13 1973 1988 |
36 | REN21, Renewables 2014: Global Status Report, 2014, Available: http://www.ren21.net/Portals/0/documents/Resources/GSR//GSR_full%20report_low% 20res.pdf |
37 | Mekhilef S, Saidur R, Safari A (2011) A review on solar energy use in industries Renewable and Sustainable Energy Reviews 15: 4 1777 1790 |
38 | Tadić S, Zečević S, Krstić M (2014) A novel hybrid MCDM model based on fuzzy DEMATEL, fuzzy ANP and fuzzy VIKOR for city logistics concept selection Expert Systems with Applications 41: 18 8112 8128 |
39 | Standard A.S.H.R.A.E., Standard 55–2010, Thermal Environmental Conditions for Human Occupancy. Atlanta: American Society of Heating, Refrigerating, and Air–Conditioning Engineers, in, Inc 2010. |
40 | He S, Gurgenci H, Guan Z, Alkhedhair AM (2013) Pre-cooling with Munters media to improve the performance of Natural Draft Dry Cooling Towers Applied Thermal Engineering 53: 1 67 77 |
41 | Saaty TL (1988) What is the analytic hierarchy process? Berlin Heidelberg Springer |
42 | Saaty TL (1996) RWS publications Pittsburgh Decision making with dependence and feedback: The analytic network process |
43 | Saaty TL, Vargas LG (2006) Decision making with the analytic network process Springer |
44 | Olgyay V, Herdt J (2004) The application of ecosystems services criteria for green building assessment Solar Energy 77: 4 389 398 |
45 | Chen VY, Lien H-P, Liu C-H, Liou JJ, Tzeng G-H, Yang L-S (2011) Fuzzy MCDM approach for selecting the best environment-watershed plan Applied Soft Computing 11: 1 265 275 |
46 | Preiser W, Vischer J (2006) Assessing building performance Routledge Oxford |
47 | Wikipedia, List of universities in China, 2014, Available: https://en.wikipedia.org/wiki/List_of_universities_in_China |
48 | Zhou X (2012) Fuzzy analytical network process implementation with matlab INTECH Open Access Publisher Rijeka, Croatia |
49 | Schwartz Y, Raslan R (2013) Variations in results of building energy simulation tools, and their impact on BREEAM and LEED ratings: A case study Energy and Buildings 62: 350 359 |
50 | Juan Y-K, Gao P, Wang J (2010) A hybrid decision support system for sustainable office building renovation and energy performance improvement Energy and buildings 42: 3 290 297 |
51 | Güngör Z, Serhadlioğlu G, Kesen SE (2009) A fuzzy AHP approach to personnel selection problem Applied SoftComputing 9: 2 641 646 |
Figures and Tables
Fig.1
A triangular fuzzy number M.
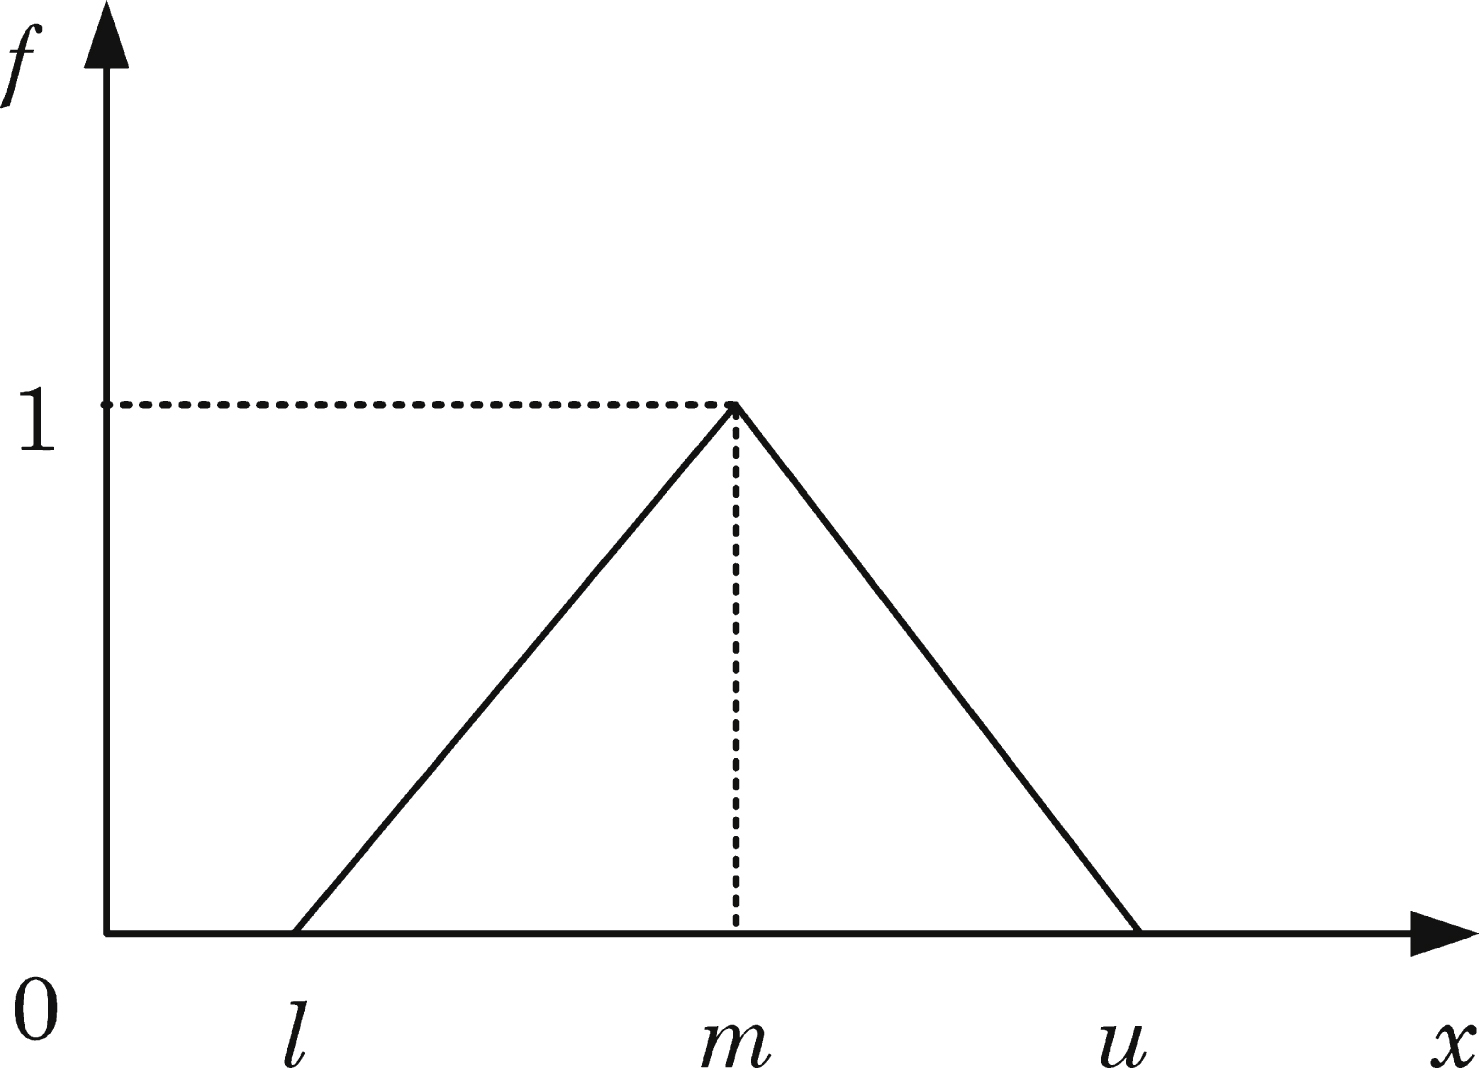
Fig.2
Network structure of the proposed approach to assess building performance.
![Acceptable range of operative temperature and humidity for the thermal comfort rooms [21, 39].](https://content.iospress.com:443/media/ifs/2015/29-6/ifs-29-6-ifs1966/ifs-29-6-ifs1966-g003.jpg)
Fig.4
Energy performance assessments of the classroom using the approach.
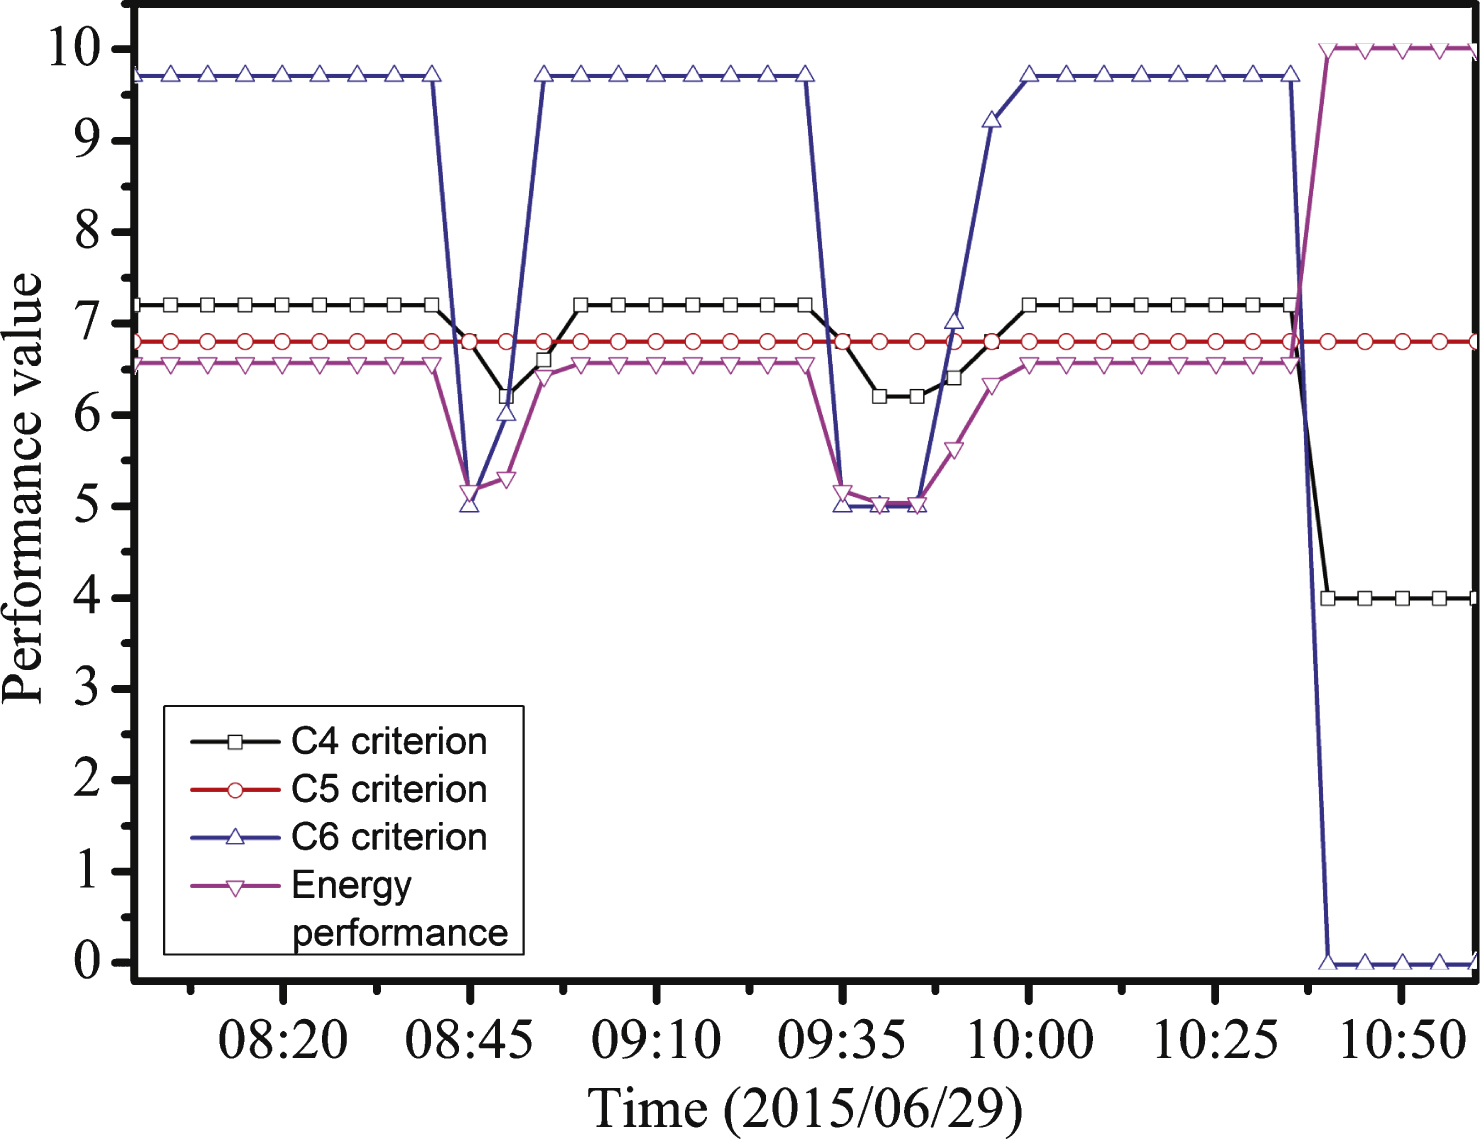
Fig.5
Energy performance assessments of the lab using the approach.
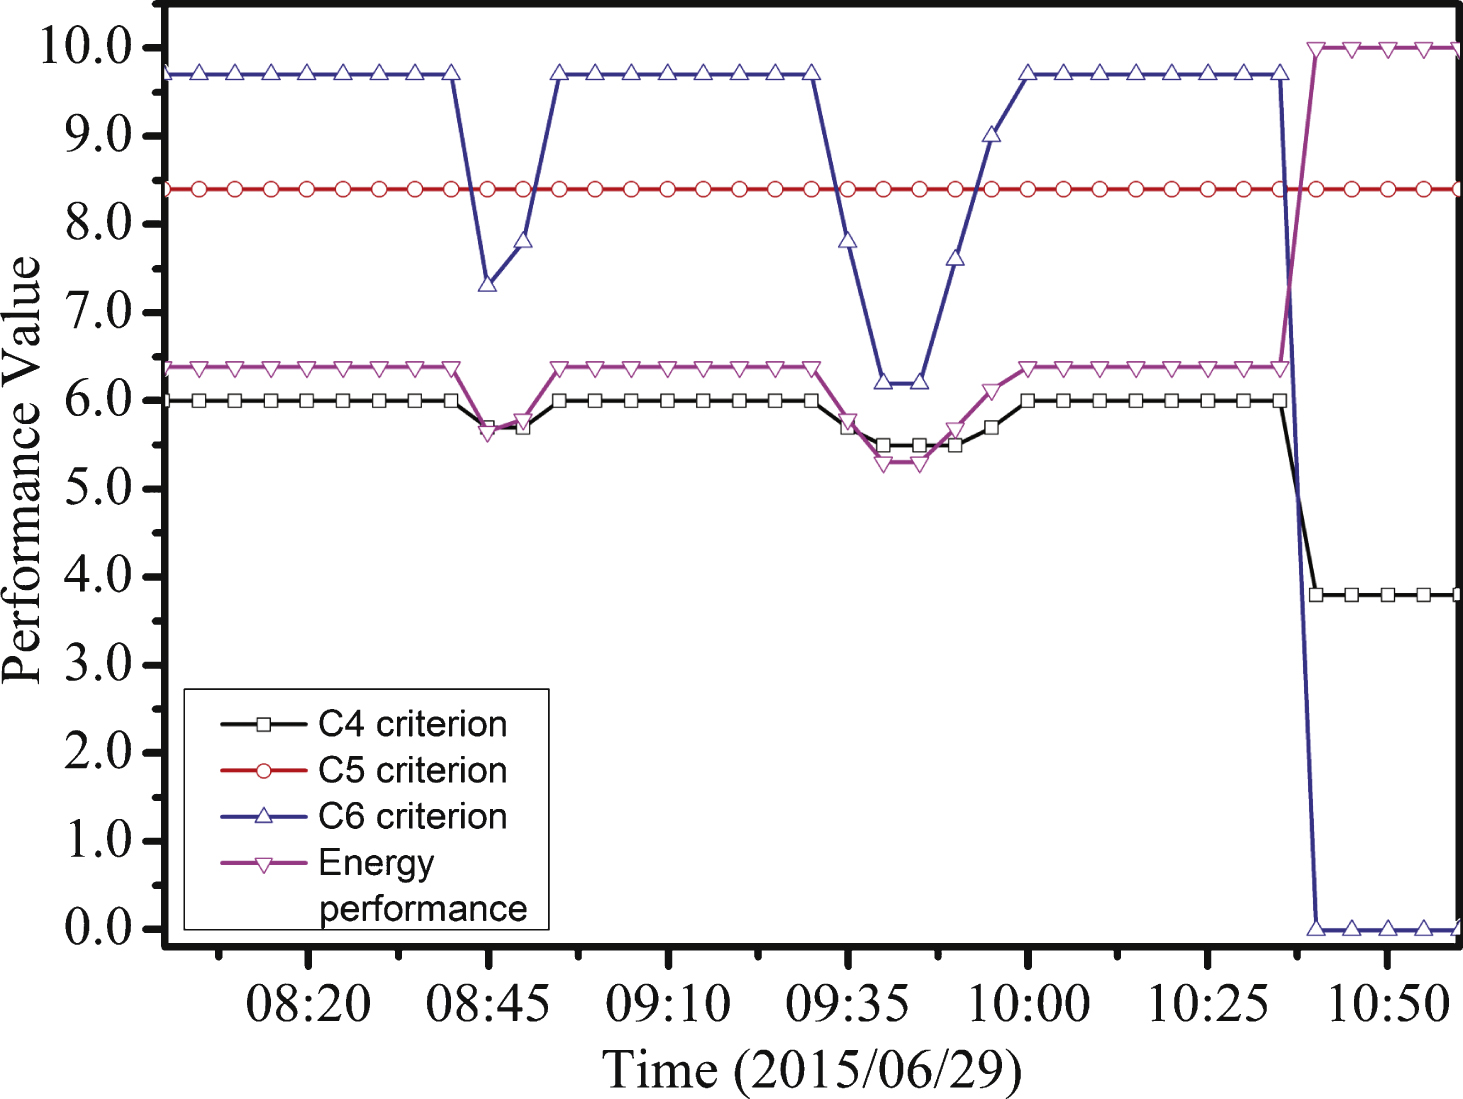
Fig.6
Energy performance assessments of the office using the approach.
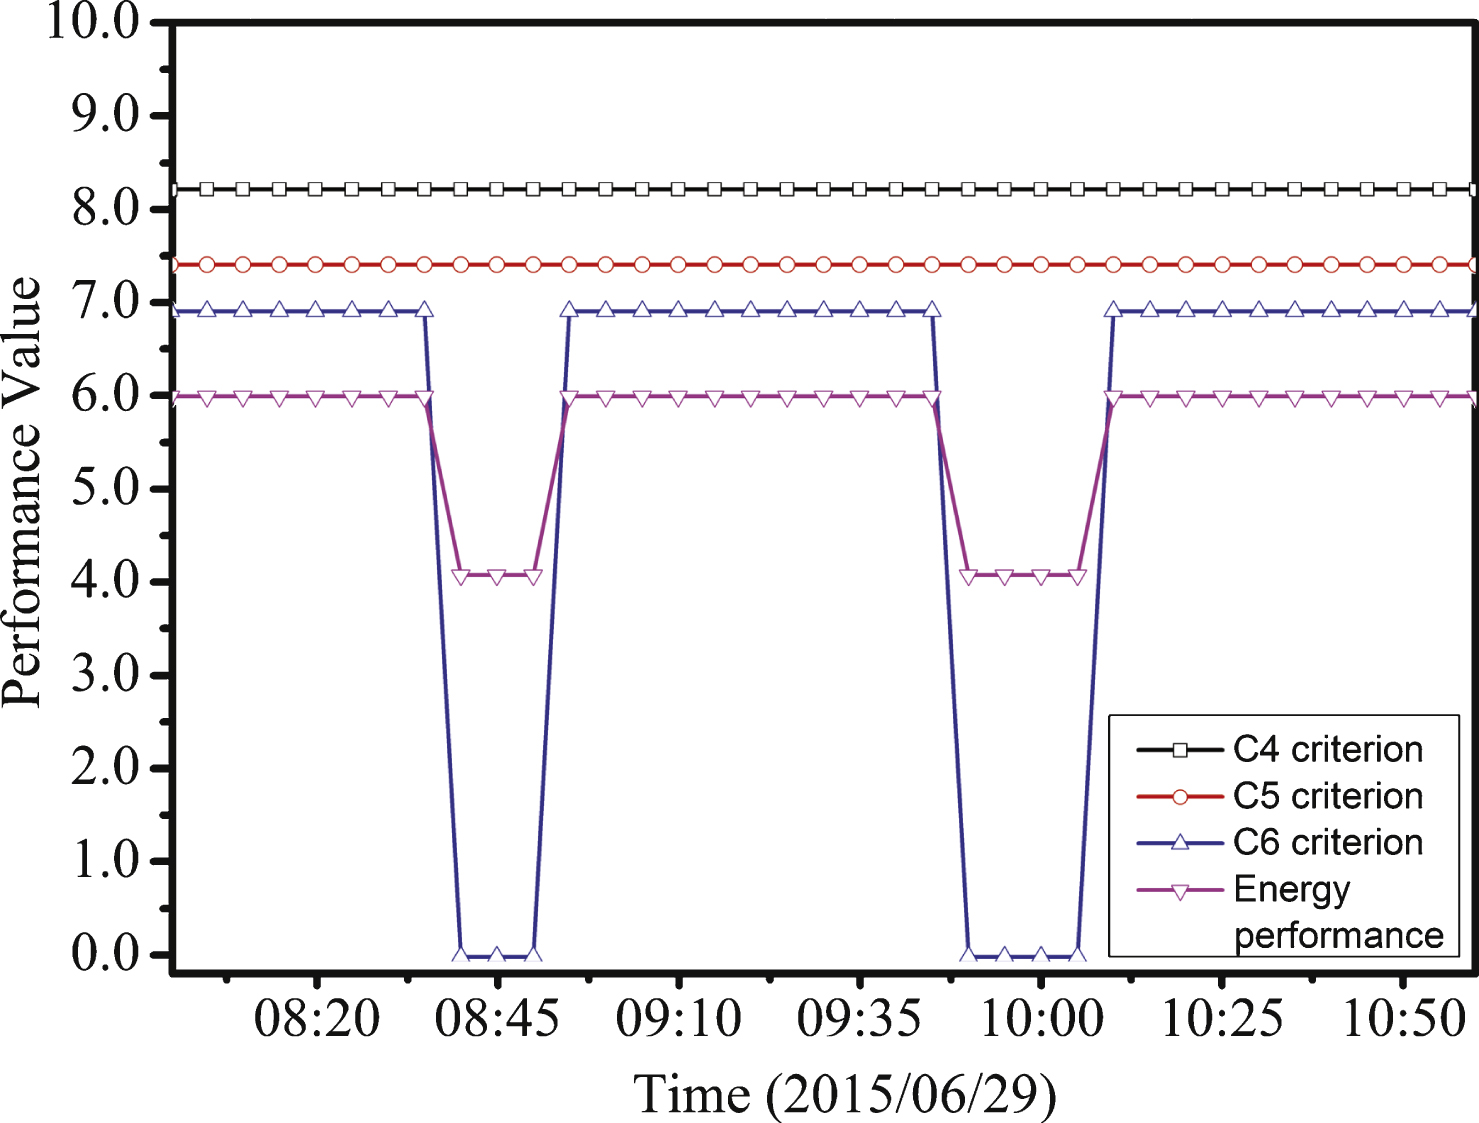
Table 1
BREEAM system criterion weights
| Criterion | Weight (%) |
| Water | 7 |
| Waste | 8 |
| Transport | 9 |
| Innovation | 10 |
| Pollution | 11 |
| Management | 13 |
| Materials | 14 |
| Health and wellbeing | 17 |
| Energy | 21 |
Table 2
LEED system criterion weights
| Criterion | Weight (%) |
| Regional priority | 4 |
| Innovation in operations | 6 |
| Material and resources | 10 |
| Water efficiency | 14 |
| Indoor environmental quality | 15 |
| Sustainable sites | 26 |
| Energy and atmosphere | 35 |
Table 3
Linguistic scales of relative importance of (C i , C j )
| Linguistic scale for importance | Relative importance |
| C i is absolutely more important than C j | 0.9 |
| C i is much more important than C j | 0.8 |
| C i is more important than C j | 0.7 |
| C i is slightly more important than C j | 0.6 |
| C i is equally important as C j | 0.5 |
| C i is slightly less important than C j | 0.4 |
| C i is less important than C j | 0.3 |
| C i is much less important than C j | 0.2 |
| C i is absolutely less important than C j | 0.1 |
Table 4
Pairwise comparison calculated with the six criteria and view C1 the referencing criterion
| C1 | C1 | C2 | C3 | C4 | C5 | C6 |
| C1 | (0.5,0.5,0.5) | (0.4,0.5,0.6) | (0.8,0.8,0.9) | (0.3,0.4,0.6) | (0.4,0.6,0.7) | (0.2,0.4,0.5) |
| C2 | (0.4,0.5,0.6) | (0.5,0.5,0.5) | (0.6,0.7,0.8) | (0.4,0.4,0.5) | (0.5,0.5,0.6) | (0.3,0.4,0.4) |
| C3 | (0.1,0.2,0.2) | (0.2,0.3,0.4) | (0.5,0.5,0.5) | (0.2,0.3,0.3) | (0.3,0.4,0.4) | (0.1,0.2,0.2) |
| C4 | (0.4,0.6,0.7) | (0.5,0.6,0.6) | (0.7,0.7,0.8) | (0.5,0.5,0.5) | (0.6,0.6,0.7) | (0.4,0.4,0.5) |
| C5 | (0.3,0.4,0.6) | (0.4,0.4,0.5) | (0.6,0.6,0.7) | (0.3,0.4,0.4) | (0.5,0.5,0.5) | (0.2,0.3,0.3) |
| C6 | (0.5,0.6,0.8) | (0.6,0.6,0.7) | (0.8,0.8,0.9) | (0.5,0.6,0.6) | (0.7,0.7,0.8) | (0.5,0.5,0.5) |
Table 5
Energy performance certification levels of the proposed approach
| Performance Level | Score |
| Unclassified | ≤5.0 |
| Pass | >5.0 |
| Good | >6.0 |
| Very Good | >7.0 |
| Excellent | >8.0 |
| Outstanding | >9.0 |


