
Model and application of green industry evaluation based on fuzzy control
Abstract
Economic development has resulted in a great threat to sustainability of human living environments. For sustainable development of the economy and the environment, green industry standards have gained preference. Proper evaluation of the green industry would elucidate its characteristics and provide a point of reference for regional green industrial planning. A novel model for fuzzy control model is here established which enable comprehensive and flexible evaluation. Working examples demonstrate the performance agility of the model.
1Introduction
In Chine, the economy is in a state of rapid development, with increasing standards of income, yet quality of living environments are generally worsening. For sustainable development of the economy and the environment, low-carbon green industry has become the choice. By analyzing the advantages and disadvantages of different green industries, a proper evaluation can be prepared to provide a planning reference for regional green industry. There are few studies available for evaluation of the green industry, most of which are based on limited screening indexes, not comprehensive, and lack quality indicators. In this paper, a fuzzy comprehensive evaluation model and a fuzzy control model are combined to make a new model, which uses qualitative variables as indices to evaluate the green industry from different angles. This will help to provide better flexibility and maneuverability.
In some studies, a precise mathematical model is not established, which problem is addressed here by the fuzzy theory, composed of three steps for complete evaluation study (Fig. 1). This article is presented in three parts to build a green industry evaluation model: the set of indicators, the design of fuzzy control rules, and the evaluation results.
2Literature review
Fuzzy theory has been used to study many aspects, which have come to include, through continuous development and improvement, medical, military, and management fields without previously-established mathematical models. Contributors to development of fuzzy theory include H.B. Zhou, who applied the fuzzy theory to practical industry [6], Y.C. Hsueh, who decomposed fuzzy systems and their application in direct adaptive fuzzy control [23] and Y.B. Liu, who used fuzzy logic control method to study airplane [22]. Fuzzy control was used to control finely-tuned robots by M. Fateh [10]. J.E. Feng used fuzzy control to study multiple fuzzy relations [8] and Liu Bing applied fuzzy control methods in the study of transformer cooling systems [2]. Essentially, fuzzy theory has been explored from a wide variety of perspectives and applied successfully within many disparate research areas [11, 12, 15]. Additionally, there has been research into scientific and technological aspects of fuzzy theory by L.D. Chen [9], S. Zhang [14] and C.P. Chen [3]. Currently, evaluations of China’s green industry are sparse, while most studies still focus on the selected-index system. Fuzzy theory is applied to evaluation, though it lacks sufficient flexibility for evaluation of the main subject based on targets, stages or levels of evaluation, to fill which void, the approach of combined comprehensive evaluation model and the fuzzy control is applied for flexible and comprehensive green industry evaluation.
This paper addresses several issues as follows. The green industry evaluation index set is presented in Section 3. The establishment of evaluation model is designed in Section 4. The application of green industry evaluation model is conducted in Section 5. And Section 6 presents the conclusion.
3Green industry evaluation index set
The key to green industry assessment is choice of evaluation indices system, selected based on the characteristics and evaluation of the main objective facts. The indices chosen comprehensively integrate those of foreign authorities [5, 7, 16–18] with those of domestic authority, according to the characteristics of the domestic green industry [1, 13]. Additionally, indices are divided into green production, green consumption, and green environment, with a specific indicator system shown in Table 1.
4The establishment of evaluating model for green industry
4.1Fuzzy comprehensive evaluation model
4.1.1Green industry evaluation factors identified targets set
Assume green industry evaluation factors set is B, which is divided into n subsets according its properties, such that B = B 1 ∩ B 2 ∩ B 3 … B n , where the intersection is an empty set for any two sets. Thus, a collection of the first layer of the evaluation factors may be: B 1 = [B 1 B 2 B 3 … B 8], consequently, a set of first k layer evaluation factors is B k = [B k,1 B k,2 B k,3 … B k,n ], where n is the number of each of the evaluation.
4.1.2Quantification science and technology index value
There are many methods to determine the environmental weight of the green industry, which are best selected according to specific characteristics and particulars of the situation. We applied the analytic hierarchy process to determine green industry impact, due to a hierarchy inherent in the factors shown above. First, the hierarchy system was formulated in response to the relationship between factors of the system, while indices of each floor were established in pair-wise comparison, under expert consultation, to obtain the judgment matrix, R = (r ij ). The elements of each layer with respect to weighted layer criteria were deduced according to the maximum Eigen values and their Eigenvectors, applicable to the above matrix. Here, W i is the weight of index, such that index level-indicator weights are given as: W i = [W i1 W i2 W i3 … W in ], while W i1 + W i2 + W i3 + … + W in = 1.
4.1.3Dividing reviews ratings
Let Z denote the reviews ratings, i.e. Z = [Z 1 Z 2 Z 3 … Z p ]. Let p denote the number of the evaluation objects. Fuzzy evaluation level cannot be applied directly here, so the reviews ratings are Z = [Z 1 Z 2 Z 3 Z 4 Z 5] = [A, B, C, D, E]= [1, 3, 5, 7, 9]. If the index is in the middle of these evaluation levels, [2, 4, 6, 8, 10] can also be used.
4.1.4Establish fuzzy evaluation matrix
The fuzzy evaluation matrix was established to build an evaluation index, where the degree, r ij , of B ij belonging to comment, t, was obtained by expert evaluation method or the actual survey methods. Thus, a fuzzy judgment decision matrix is as follows:
The determined membership should then be divided into qualitative and quantitative indicators. For qualitative indicators, may be obtained from the level metrics of comments Z = [Z 1 Z 2 Z 3 … Z p ] = [better, good, fair, poor, worse]= [1, 3, 5, 7, 9]. Quantitative indicators may be divided into three types to determine their value: partial small, partial large and intermediate. To determine the appropriate membership functions, specific characteristics of the object may be compared with the above three class-types. Membership functions may then be determined by fuzzy statistical method or fuzzy distribution. Following are trapezoidal distribution formulas.
Partial small indicators can be described thus,
(1)
For partial large indicators, we have
(2)
While intermediate targets are obtained from:
(3)
In Equation (1) to (3), f (x) represents the Eigen value, while max(f) represents the upper limit of the same index of all Eigen values. min(f) is the lower limit corresponding to the same index of all Eigenvalues.
4.1.5Fuzzy comprehensive evaluation
The weight vector and membership functions are coupled, so science and technology evaluation vectors can be drawn, vector H = W · R = [h 1 h 2 h 3 … h n ], from which comparison with the configured rating would be made the final evaluation. The total of the fuzzy comprehensive evaluation model is given as Equation (4).
(4)
4.2The establishment of fuzzy control rules
The fuzzy control rule, which is actually stated set of multiple conditions, is an important part of the fuzzy control [4]. In this paper, the rule statement mode settings, in which evaluation levels are given as Z = [Z 1 Z 2 Z 3 Z 4 Z 5] = [better, good, fair, poor, worse], which in turn = [A, B, C, D, E], behave as in the following partial example (space not permitting full):
1 If A and A and A, then AAA;
2 If A and B and A, then ABA;
3 If A and B and B, then ABB;
4 If B and B and B, then BBB;
5 If B and A and A, then BAA;
6 … …
7 If E and E and E, then EEE.
5Application of green industry evaluation model
The data for this evaluation came from Dalian municipality, spanning 2007–2009, selecting of expert evaluation method to evaluate the data and indicators. Due to space limitations, only the data from 2008 is given here to detail the evaluation process. In order to reduce the deviation of evaluated results, before evaluating green industry development, we applied the robust PLS approach [20], for prediction and diagnosis against outliers and missing KPI-related data.
During the evaluation process, qualitative variables take five evaluation ratings. Index systems were rated using the Delphi method to represent expert opinion. Weights of indices were obtained by using Analytic Hierarchy Process (AHP), from which the final result is given by:
1 W i = [0.16 0.16 0.07 0.11 0.16 0.11 0.09 0.14]
2 W 2 = [0.20 0.28 0.14 0.14 0.24]
3 W 3 = [0.22 0.18 0.18 0.15 0.15 0.12]
The level proportion method was used to grade indexes. Statistical results are shown as follows.
The membership coefficient vector R = W i · R i , may be obtained from the above, whose membership matrix composition is given by:
Based on the data above, the final results can be calculated as follows.
Compared the above results and the evaluation rating Z = [Z 1 Z 2 Z 3 Z 4 Z 5] = [A, B, C, D, E], we have Q 1 = 3.986 = D, Q 2 = 5.232 = C, Q 3 = 4.3 = D.
In order to ensure the accuracy and reliability of the evaluation results, this paper applied FDI method [21] to process the entire data inspection. Since this data contains qualitative variables, many of which are factors beyond measure, this paper references data-driven design of robust fault detection system [19] to test the entire inspection process. Results from the preceding showed no data-processing error, which indicates credible evaluation results.
Evaluation results can be obtained by fuzzy control rules. By the methods in rule here, if D and C and D, then DCD, thus the evaluation rating of green industry from DCD in Dalian (2008) showed that the ‘greenness’ of industry and environment were poor for that year in Dalian City. Additionally, ratings for the green industry for two other years in Dalian appear in Table 2, where the green industry rating for Dalian displays a downward trend, mainly in regard to green production. We believe this is to be caused by the rapid pace of industrial development causing increased waste emissions, while not being effectively controlled, thus reducing the level of evaluation. Additionally, the ratings for 2008 and 2009 were similar, due either to the number of factories reaching a stable level or effectively controlling waste emissions with an increase in number of factories. Nevertheless, the level of the green industry was in decline, and environmental pollution also may be intensified.
6Conclusions
As it can be seen from the above examples, the evaluated level of green industry in Dalian was low and showed a downward trend, suggesting that the local government should intensify supervision and management, and should encourage green business innovation and improvement, making for harmonious economic and environmental development. Environmental protection and economic development are equally important for the survival of mankind. We cannot simply focus on the development of our basic needs while ignoring the quality of living space. ‘Green’ industry is an inevitable choice for sustainable economic and environmental development. To evaluate the green industry, there is a need for greater in-depth and comprehensive understanding of the development of green industries, such that government may provide assistance to support environmental goals, and to encourage their creation. This model not only evaluates green businesses based on goals, stages or levels of evaluation, but can also be flexibly calculated, based on different indicator systems with strong functionality and extensive practical features. There is much room for improvement, which will lead to a better future.
Acknowledgments
The research was supported by National Natural Science Foundation of China (No. 71373207), Research Fund for the Doctoral Program of Higher Education of China (No. 20130204110034), New Century Excellent Talents Support Plan of Ministry of Education of China (No. NCET-11-0443), National Natural Science Foundation of China (No. 71373207) and China Postdoctoral Science Foundation Funded Project (No. 2015M572608).
References
1 | Beijing Municipal Commission Development and Reform, Green Beijing Construction Planning during the Twelve Fiveyear Plan, 2011 |
2 | Liu B, Han ZT (2014) A composite PID fuzzy control method for the transformer cooling system Advances in Intelligent Systems Research 113: 701 704 |
3 | Chen CP, Bi N, Lan XJ (2007) The analysis on the allocation capability of science and technology resources based on fuzzy evaluation PRMIA International Conference on Management Innovation 1–2: 1063 1068 Univ Academic Press Toronto |
4 | Türkay D, Koray A (2014) Technology evaluation through the use of interval type-2 fuzzy sets and systems Computers & Industrial Engineering 65: 4 624 633 |
5 | Government Statistic Office of UK, Indicators of Sustainable Development for the United Kingdom, HMSO Publications Center, London, 1996, pp. 29–137. |
6 | Zhou HB, Duan JA, Zhou ZY (2014) A simplified adaptive interval type-2 fuzzy control in practical industrial application Journal of Central South University 21: 7 2693 2700 |
7 | International Energy Conservation Environmental Protection Association (IECEPA), Ecological Safety StrategicKey Points of International Urban Ecological Construction, 2010 |
8 | Feng JE, Lv HL, Cheng DZ (2013) Multiple fuzzy relation and its application to coupled fuzzy control Asian Journal of Control 15: 5 1313 1324 |
9 | Chen LD, Ma SY (2009) Research on the science and technology innovation ability of undergraduates based on the fuzzy evaluation approach Advances in Intelligent and Soft Comuting 116: 1 505 512 |
10 | Fateh MM, Fateh S (2013) Fine-tuning fuzzy control of robots Journal of Intelligent & Fuzzy Systems 25: 4 977 987 |
11 | Mansouri M, Teshnehlab M (2015) Adaptive variable structure hierarchical fuzzy control for a class of high-order nonlinear dynamic systems ISA Transactions 56: 28 41 |
12 | Sanchez MA, Castillo OC, Juan R (2015) Generalized type-2 systems for controlling a mobile robot and a performance comparison with interval type-2 and type-1 fuzzy systems Expert Systems with Applications 42: 14 5904 5914 |
13 | Ministry of Environmental Protection of the People’s Republic of China, The urban environment quantitative evaluation index during the twelfth five-year plan and its implementing regulations, 2012. available at: http://www.mep.gov.cn/gkml/hbb/bgth/201111/t20111116_220023.htm |
14 | Zhang S, Chi GT, Zhang M (2009) The science and technology evaluation model and empirical study based on maximizing deviation and fuzzy comprehensive evaluation 2nd Conference of the International-Institute-of-Applied-Statistics-Studies 46 52 Qingdao |
15 | Derakhshan SF, Fatehi A (2015) Non-monotonic robust H-2 fuzzy observer-based control for discrete time nonlinear systems with parametric uncertainties International Journal of Systems Science 46: 12 2134 2149 |
16 | United Nations Environment Program (UNEP), Green Economy: Cities Investing in Energy and Resource Efficiency, Year of Publication, 2011. |
17 | United Nations Environment Program (UNEP), Guidelines for AEOcities integrated environmental assessment and reporting, United Nations Environment Program, 2005, pp. 52–143. |
18 | World Commission on Environment and Development (WCED), The Brundtland report, our common future, Oxford University Press, Oxford, 1987, pp. 55–72 |
19 | Shen Y, Wang G, Hamid RK (2014) Data-driven design of robust fault detection system for wind turbines Mechatronics 24: 298 306 |
20 | Shen Y, Wang G, Yang X (2014) Robust PLS approach for KPI-related prediction and diagnosis against outliers and missing data Systems Science 45: 7 1375 1382 |
21 | Shen Y, Yang XB, Hamid RK (2012) Data-driven adaptive observer for fault diagnosis Mathematical Problems in Engineering 2012: 1 21 |
22 | Liu YB, Yao KM, Lu YP (2014) Research on fuzzy logic control methods for Mars airplane Aircraft Engineering and Aerospace Technology 86: 5 415 422 |
23 | Hsueh YC, Su SF, Chen MC (2014) Decomposed fuzzy systems and their application in direct adaptive fuzzy control IEEE Transactions on Cybernetics 44: 10 1772 1783 |
Figures and Tables
Fig.1
Schematic of fuzzy control.
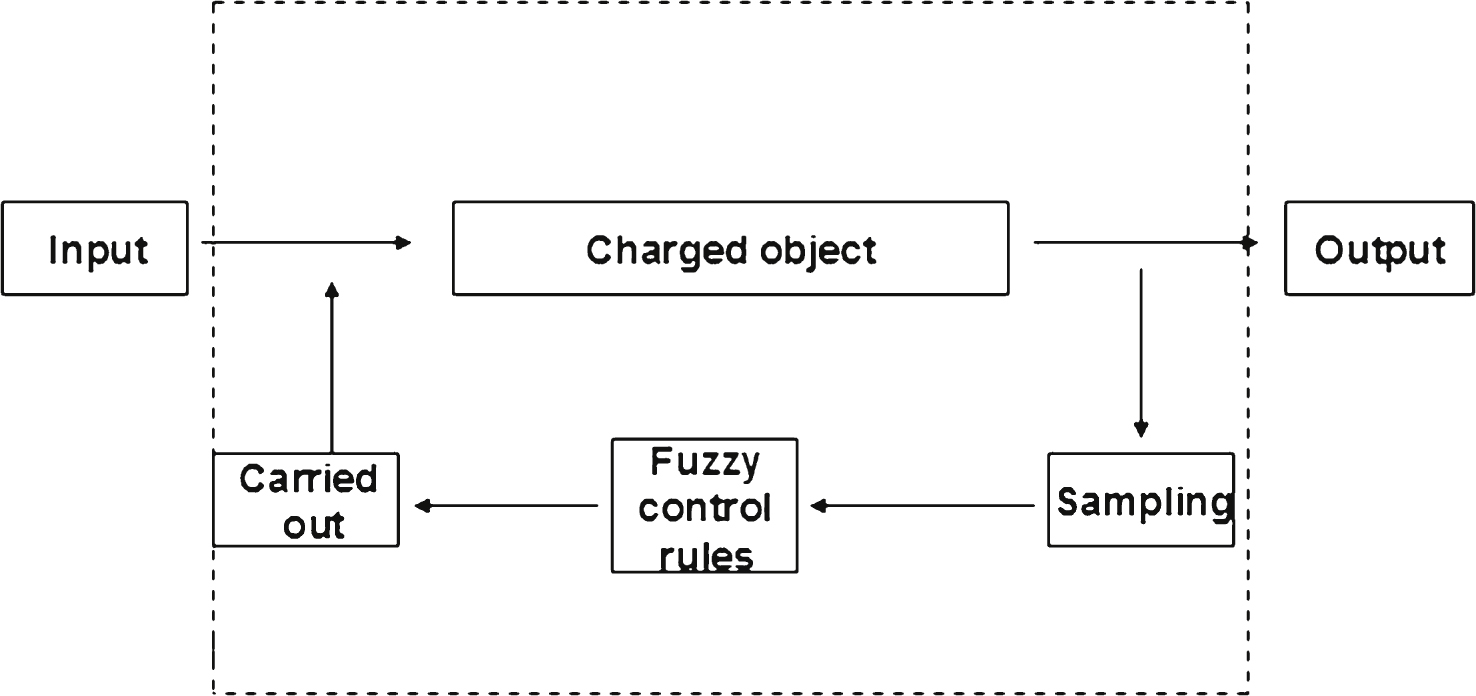
Table 1
Green industry evaluation index system
| No. | Level index | Secondary indicators |
| 1 | Green production | Total coal consumption |
| 2 | Tertiary Industry, agriculture, | |
| forestry and fishery, service sector | ||
| of primary industry output as | ||
| percentage of total regional GDP | ||
| 3 | Ratio of large-scale heavy chemical | |
| industrial output to industrial output | ||
| 4 | Total industrial soot emissions | |
| 5 | Ratio of the total environmental | |
| protection investment to GDP | ||
| 6 | Water recycling rate of | |
| large-scale industrial enterprises | ||
| 7 | Carbon production | |
| 8 | Zero-carbon energy accounting | |
| 9 | Green consumption | Percent of |
| urban public transport | ||
| 10 | Elasticity of energy consumption | |
| 11 | Per capita energy consumption | |
| 12 | Gas consumption of large-scale industry | |
| 13 | Utilization rate of green energy | |
| 14 | Green environment | Forest coverage (%) |
| 15 | Urban reforestation | |
| 16 | Sewage | |
| 17 | Erosion area (km2) | |
| 18 | Exhaust gas emissions | |
| 19 | Carbon emission intensity |
Table 2
The evaluation level of green industry in Dalian for 3 years
| Part1 | Part2 | Part3 | result | |
| 2007 | D | C | D | DCD |
| 2008 | C | C | C | CCD |
| 2009 | D | C | D | DCD |


