Wind power prediction interval estimation method using wavelet-transform neuro-fuzzy network
Abstract
Wind power point forecasting is the primary method to deal with its uncertainty. However, in many applications, the probabilistic interval of wind power is more useful than traditional point forecasting. Methods to determine the probabilistic interval of wind power point forecasting value is very essential to power system operations. Based on the bootstrap method, this paper proposed a wavelet transform combined with a neuro-fuzzy network model to estimate the prediction interval of wind power. In the model, to account for the ramp event of wind power series, a wavelet-based ramp event was used and the moving block bootstrap method, which considers the dependence of wind power series, was used to construct sampling datasets. Then, the bootstrapped datasets were estimated by a neuro-fuzzy network inference system. A case study provided a 90% confidence level of prediction intervals, which was constructed to examine the effectiveness of the model.
1Introduction
With the rapid increase of wind turbine installed capacity in power systems, wind energy has become the most important and efficient renewable energy from a marginal energy source. However the variability and uncertainty of wind power brings some new challenges to load balance, economic dispatch and unit commitment in power system operations. Reliable and accurate wind power forecasting systems are the primary method to deal with the uncertainty of wind power, which can smooth operation of power systems.
Based on the data used in the forecasting system, there are two primary groups of forecasting methods for wind power: physical methods and data mining methods [1, 8]. Physical methods use meteorological data and physical laws to obtain wind speed and wind direction information, which is then transformed into corresponding wind power based on the power curves of wind turbines. Data mining methods use historical datasets of wind power or wind speed to extract typical features and develop prediction models [2]. A variety of intelligent algorithms such as neural networks [16], fuzzy neural networks [25] and support vector machines [18] have been proposed for nonlinear forecasting model in the literatures.
Traditionally, most research has focused on developing accurate point forecasting methods for wind power [3]. However, due to the chaotic nature of meteorological systems and the non-stationarity of wind power series, the output of traditional point forecasting methods can hardly correlate to the real measured values, which may lead to uncertainties and risks for power system operations [9]. And Ferreira and Gama pointed out that dealing with the sudden and large changes of ramp events in wind power has become the major issue in wind power generation [10]. Previous Bossavy and Girard further pointed out that the deterministic point forecast models based on minimum least square criterion have poor performance on forecasting of ramp events [4]. Probabilistic interval forecasting provides a more effective approach to estimate and quantify the potential uncertainty of wind power than point forecasting method [11]. Therefore, the prediction of intervals of wind power generation considering ramp events is a significant research topic.
Custom interval estimation methods were based on the predefined probability distribution, so that many applications of wind power forecasting require the knowledge of the probability distribution of forecasting error before generating the interval. However, in practice, the wind power forecasting error is generally acquired from the real prediction value and measured values of one wind farm. The forecasting method and the topographic feature of the wind farm have remarkable influence on forecasting error. When the wind farm participates in the electric market with some bidding strategy as an independent participant, the statistical method of forecasting error distribution may no longer be valid. The bootstrap method as a statistical inference approach can be used to achieve interval estimation without a predefined probability distribution. However, the custom bootstrap method does not consider the dependence of data. Wind power series are a typical dependence time series, and have some special dependence features; especially the ramp event should be considered when using the bootstrap method to estimate the interval of wind power output.
Ramp forecasting is a relatively new study field compare to general wind power forecasting. Ramp is simply defined as a sudden change in wind power which has large amplitude in a relatively short period of time, but there is no consensus on the accepted formal definition of a ramp event [23]. So far, much literature has defined a ramp event as an indicator function by a specified threshold, but Gallego and Costa reported that wavelet transform can describe wind power ramp characterizations more efficiently than many ramp binary definitions using indicator functions [12].
Wavelet transform is a relatively new mathematical approach for signal analysis and wavelet analysis, has been used in many research fields in the last few decades. The time-frequency decomposition of wavelet analysis has been successfully applied in image processing [19], signal de-nosing [24] and condition monitoring [20]. Wavelet combined with some expert models such as neural networks was also used efficiently in stochastic time-series forecasting [21]. In the electrical engineering field, the wavelet transform has been successfully used to forecast electrical load and electricity price. Zhang reported a neural-wavelet model to determine short-term electrical load forecasting [6]. And a wavelet transform combined with ARIMA and GARCH models was developed for day-ahead electricity price forecasting [28]. Because the wavelet transform can efficiently describe wind power ramp characterizations [12] and wavelet transform can effectively deal with the dependence of wind power series when use with the bootstrap method, this paper combines a wavelet transform with a fuzzy neural network model to predict interval of wind powerconsidering ramp events.
The rest of the paper is organized as follows.Section 2 introduces the wavelet-based ramp event characterization. Section 3 describes the phase space reconstruction prediction interval formulation of wind power. A wavelet transform fuzzy neural network model is developed in Section 4. Comprehensive numerical studies are implemented and analyzed in Section 5. Finally, the conclusion is drawn.
2Wavelet-based wind power ramp event characterization
2.1Wavelet transforms
Wavelet is a set of mathematical functions which can scale and shift in a time period. The shifted and scaled mathematical function of wavelet is denoted as the mother wavelet, which can be expressed as in the following equation [17]:
(1)
2.2Wavelet-based ramp event
The ramp event makes reference to a large variation in wind power output that is observed on a wind farm over a short period of time. To characterize a ramp event, the following three parameters are usually employed [10, 23]: direction, duration and magnitude.
Many studies have relied on the definition of specific thresholds to decide whether a certain event can be considered a ramp in a binary manner. However, the thresholds which should be set by the end-user arise from different ramp definitions. Gallego and Costa developed a wavelet-based ramp event description which provides an alternative to avoiding the sensitivity inherent to the binary classification [12].Figure 2 depicts the coefficients of wind power time series after haar wavelet transform.
As shown in Fig. 2, the ramp event of wind power time series is visually defined by the coefficients of wavelet transform, i.e. the coefficients of wavelet transform contain information regarding a ramp event. Therefore, the reconstruction signal of the coefficients was used to predict intervals in the following section.
3Prediction interval formulation and neuro-fuzzy networks
3.1Prediction intervals
Given a set of distinct pairs
(2)
(3)
(4)
In real applications, the true regression function is difficult to obtain, so it is important to quantify the accuracy of our trained regression prediction model. For regression prediction problems, we can distinguish two different aspects: confidence intervals and prediction intervals. Confidence intervals are developed to measure the variance between the true regression function f (x
i
) and the trained regression function
(5)
A prediction interval with (1 - α)% confidence level of the measured target t
i
can be expressed as
(6)
such that the coverage rate is equal to:
(7)
(8)
(9)
3.2Neuro-fuzzy network
Due to the universal approximation and learning capabilities, neural network models are often developed and used for point forecasting and prediction. A neuro-fuzzy network is “a fuzzy inference system that uses learning algorithm derived from or inspired by neural network theory to determine its parameters by processing data samples” [14]. The fuzzy inference system is defined by a set of given fuzzy rules which have formal structures of the form “IF… Then… ” that associates a condition to a consequence by means of fuzzy sets.
The neuro-fuzzy network used as a prediction model for prediction intervals is the adaptive network-based fuzzy inference system [18] which is depicted in Fig. 3.
The rule set expressed by the model follows the schema:
IF x is A i , THEN
(10)
(11)
Once the membership values μ A i are available, the model output is inferred by the output layer with the following weighted average formula:
(12)
In this paper, the more popular Takagi-Sugeno fuzzy rule [26] is used to replace the formal IF-THEN rule. The Takagi-Sugeno fuzzy rule can be expressed as:
IF x 1 is A i1, x 2 is A i2, ⋯ , x n is A in , THEN
(13)
4Prediction intervals construction
4.1Moving block bootstrap method
Compared to other approaches, the bootstrap approach is able to flexibly approximate the non-constant variance and heterogeneous noise, so bootstrap as an approach has been popularly used to obtain prediction intervals for neural network based methods[5]. However, the standard bootstrap assumes that the observations in the data are independent and identically distributed [7]. The moving block bootstrap method extends the standard bootstrap method in include correlated observations [15]. To maintain the temporal dependence in data, sequential observations are randomly sampled in blocks, rather than single observations. Mathematically, the overlapping blocks with l observations can be expressed as:
There will be n - l + 1 blocks for a time series with n observations. Then, the sampled blocks are combined to form a time series of length n. One of the blocks must be truncated to form a sample of length n when n/l is not an integer. The entire procedure is repeated B times to form the datasets
4.2Prediction intervals construction
The bootstrap-based approach assumes that an ensemble of neural network models will reach approximation of true regression of the measured targets. According to this assumption, the true regression is estimated by averaging the point forecasts of B neural networks, expressed as:
(14)
The variance of model misspecification uncertainty can be estimated using the variance of B neuralnetworks outputs:
(15)
The framework of B neural networks is depicted in Fig. 5.
From Equations (4) and (5), the variance of errors
(16)
A set of variance squared residuals is developed:
(17)
Associated with the input x i , we can obtain the transformed datasets:
(18)
Then, a new neural network model can be indirectly trained to estimate the unknown values of
4.3Prediction intervals evaluation
Prediction interval coverage probability (PICP) is introduced to evaluate the performance of prediction interval.
The PICP is measured by counting the number of target values covered by the constructed prediction intervals:
(19)
(20)
5Case study
In the case study, the wind power data of a wind farm with a 114 MW nominal generation capacity was used to test the proposed approach. First, the wind power series was bootstrapped and sampled to obtain the test datasets
(21)
The autocorrelation function of the wind power time series is shown in Fig. 6. As shown in Fig. 6, the wind power series has obvious dependence of 16 lengths time interval span, so we chose a moving block with 16 lengths.
The bootstrapped datasets were then processed by wavelet transform to obtain the coefficients to describe the ramp event of wind power. For example, the coefficients of one dataset after wavelet transform by Harr wavelet in shown in Fig. 7.
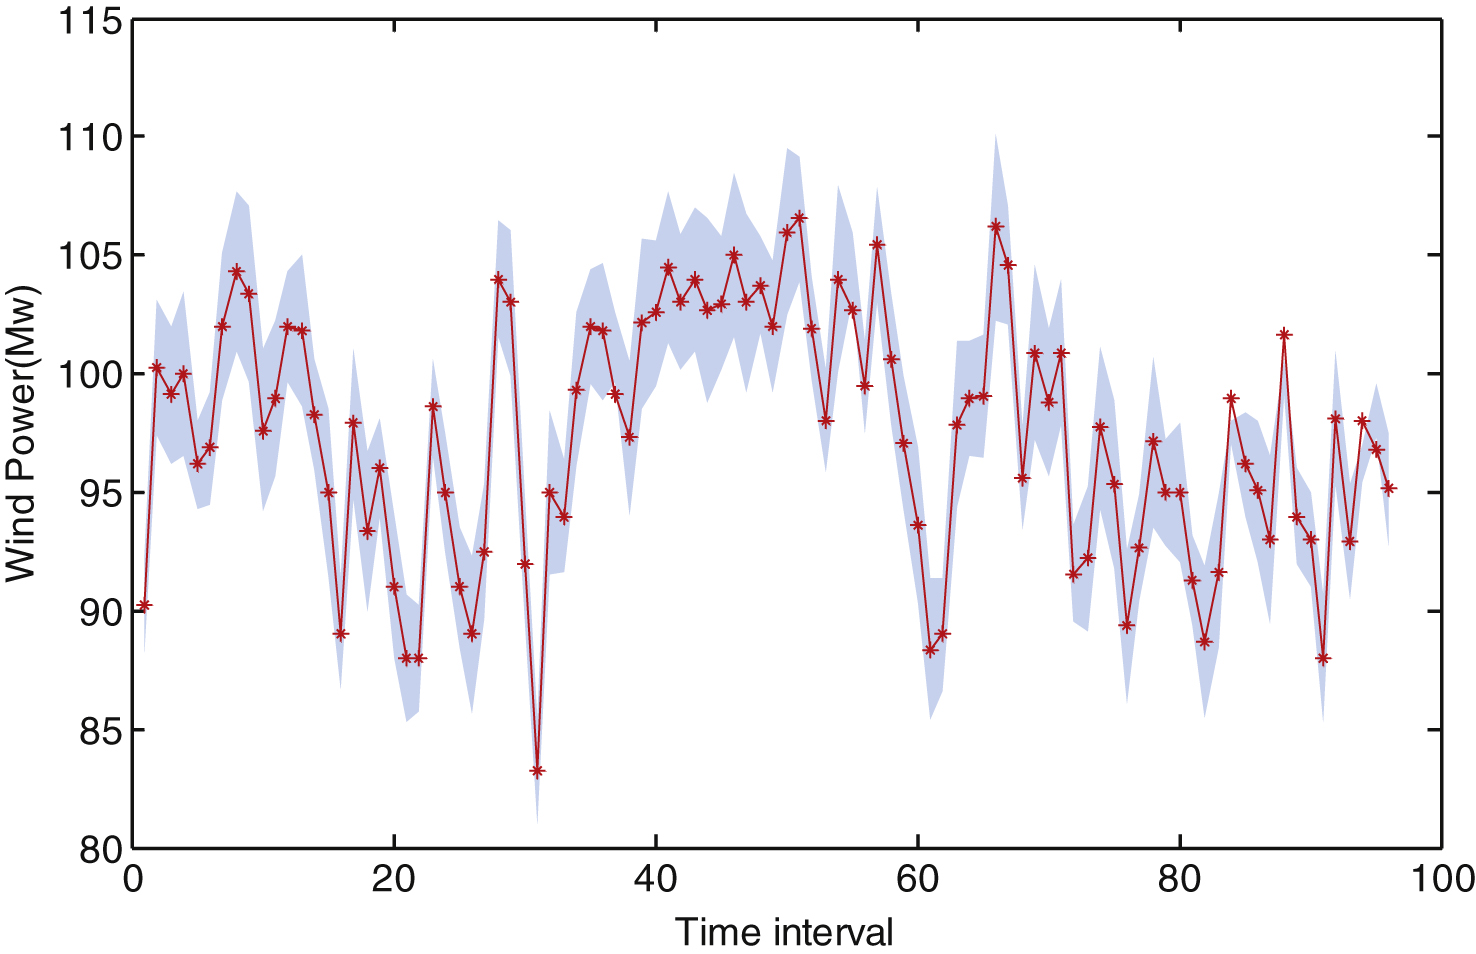
The coefficients with normal fuzzy membership function as input were trained by the fuzzy inference system. The prediction intervals with a 90% confidence level were predicted by the neural-fuzzy networks, as shown in Fig. 8.
6Conclusion
Accurate and reliable forecasting of wind power is essential for the optimal management of wind farms and power system operations. However, due to the chaotic nature of meteorological systems and the non-stationarity of wind power series, traditional point forecasting can hardly be accurate. Prediction interval forecasting provides an effective solution to estimate and quantify the potential impacts and risks facing system operation with wind penetration. In this paper, a neuro-fuzzy network model was proposed to estimate the prediction intervals of wind power. In the model, ramp events which have became a major issue in wind power generation can be flexibly expressed based on the shifted and scaled wavelet. The moving block bootstrap method with a matched length is more reasonable for the dependence of wind power stochastic series. The construction of prediction intervals with a confidence level of 90% based on historical wind power series shows the effectiveness of the neuro-fuzzy network model.
References
1 | Foley AM, Leahy PG, Marvuglia A, Mckeogh EJ (2009) Current methods and advances in forecasting of wind power generation Renewable & Sustainable Energy Reviews 13: 915 920 |
2 | Khosravi A, Nahavandi S, Creighton D (2013) Prediction intervals for short-term wind farm power generation forecasts IEEE Transactions on Sustainable Energy 3: 602 610 |
3 | Costa A, Crespo A, Navarro J (2008) A review on the young history of the wind power short-term prediction Renewable & Sustainable Energy Reviews 12: 1725 1744 |
4 | Bossavy A, Girard R, Kariniotakis G (2010) Forecasting uncertainty related to ramps of wind power production Journal of Climate & Applied Meteorology 2: 1 9 |
5 | Khosravi A, Nahavandi S, Creighton D, Srinivasan D (2011) Optimizing the quality of bootstrap-based prediction intervals Proceedings of International Joint Conference on Neural Networks 42: 4 3072 3078 |
6 | Zhang B, Dong Z (2001) An adaptive neural-wavelet model for short term load forecasting Electric Power Systems Research 59: 121 129 |
7 | Efron B, Tibshirani RJ (1993) An introduction to the bootstrap Chapman and Hall |
8 | Monteiro C, Bessa R, Miranda V, Botterud A, Wang J, Conzelmann G (2009) Wind power forecasting: State-of-the-art Argonne National Laboratory, ANL/DIS-10-1, Decision and Information Sciences Division 32: 2 124 130 |
9 | Wan C, Xu Z, Pinson P, Dong Z, Wong K (2014) Probabilistic forecasting of wind power generation using extreme learning machine IEEE Transactions on Power Systems 3: 1033 1044 |
10 | Ferreira C, Gama J, Matias L, Botterud A, Wang J (2010) A survey on wind power ramp forecasting, Argonne National Laboratory Report ANL/DIS 10-13 |
11 | Wan C, Xu Z, Pinson P, Dong Z, Wong K (2014) Optimal prediction intervals of wind power generation IEEE Transactions on Power Systems 29: 1166 1174 |
12 | Gallego C, Costa A, Cuerva A, Landberg L, Greaves B, Collins J (2013) A wavelet-based approach for large wind power ramp characterization Wind Energy 16: 257 278 |
13 | Mencar C, Castellano G, Fanelli A (2005) Deriving prediction intervals for neuro-fuzzy networks Mathematical and Computer Modelling 42: 719 726 |
14 | Nauck D, Klawonn F, Kruse R (1997) Foundations of neuro-fuzzy systems Wiley |
15 | Carlstein E, Künsch HR (1998) Matched-block bootstrap for dependent data Bernoulli 4: 305 328 |
16 | Kariniotakis GN, Stavrakskis GS, Nogaret EF (1996) Wind power forecasting using advanced neural networks models IEEE Transactions on Energy Conversion 4: 762 767 |
17 | Daubechies I (1992) Ten lectures on wavelets Society for Industrial and Applied Mathematics Press |
18 | Shing J, Jang R (1993) ANFIS: Adaptive-network-based fuzzy inference system IEEE Transaction on Systems Man & Cybernetics 23: 665 684 |
19 | Amolins K, Zhang Y, Dare P (2007) Wavelet based image fusion techniques— an introduction, review and comparison Journal of Photogrammetry and remote sensing 62: 249 263 |
20 | Zhu K, Wong Y, Hong G (2009) Wavelet analysis of sensor signals for tool condition monitoring: A review and some new results International Journal of Machines Tools and Manufacture 49: 537 553 |
21 | Milidiu L, Machado R, Renteria R (1999) Time-series forecasting through wavelets transformation and a mixture of expert models Neurocomputing 28: 145 156 |
22 | Mohandes MA, Halawani TO, Rehman S, Hassian A (2004) Support vector machines for wind speed prediction Renewable Energy 29: 939 947 |
23 | Tinghui O, Xiaoming Z, Liang Q (2013) A survey of wind power ramp forecasting Energy and Power Engineering 5: 368 372 |
24 | Mallat S, Hwang W (1992) Singularity detection and processing with wavelets IEEE Transactions on Information Theory 38: 617 643 |
25 | Barbounis TG, Theocharis JB (2007) A locally recurrent fuzzy neural network with application to the wind speed prediction using spatial correlation Neurocomputing 70: 1525 1542 |
26 | Takagi T, Sugeno M (1985) Fuzzy identification of systems and its applications to modeling and control IEEE Transactions on Systems Man & Cybernetics 15: 116 132 |
27 | Heskes T (1997) Practical confidence and prediction intervals Advances in Neural Information Processing Systems 9: 176 182 |
28 | Tan Z, Wang J, Xu J (2010) Day-ahead electricity price forecasting using wavelet transform combined with ARIMA and GARCH models Applied Energy 87: 3606 3610 |
Figures and Tables
Fig.1
Basic wavelets.
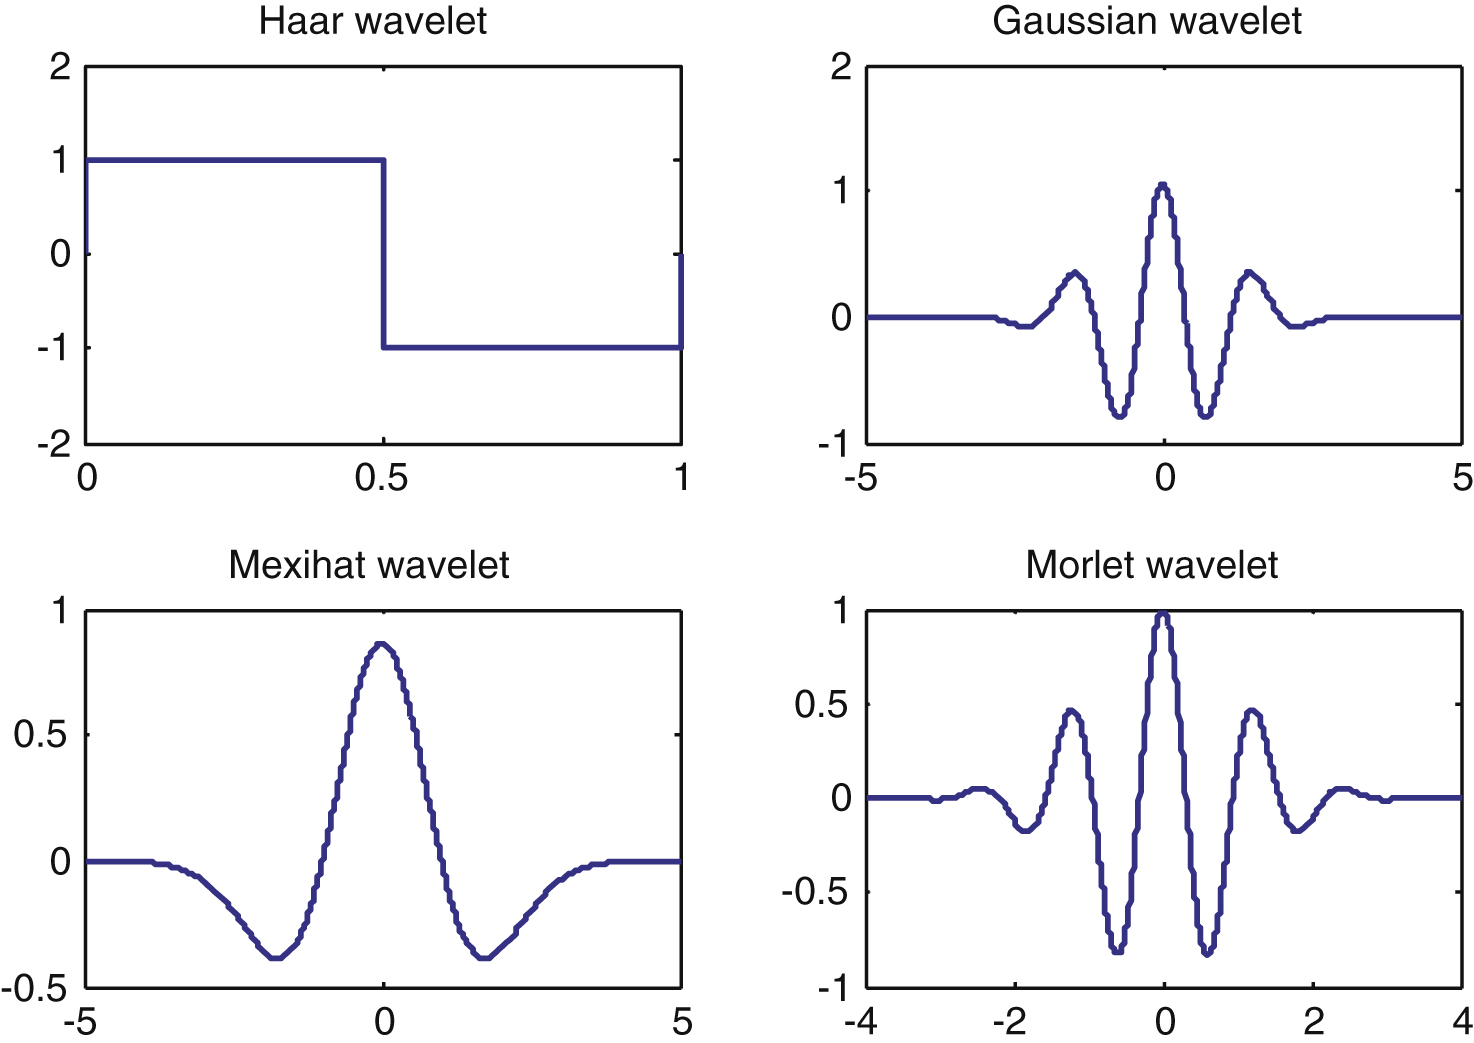
Fig.2
Wind power time series and coefficients after haar wavelet transform.
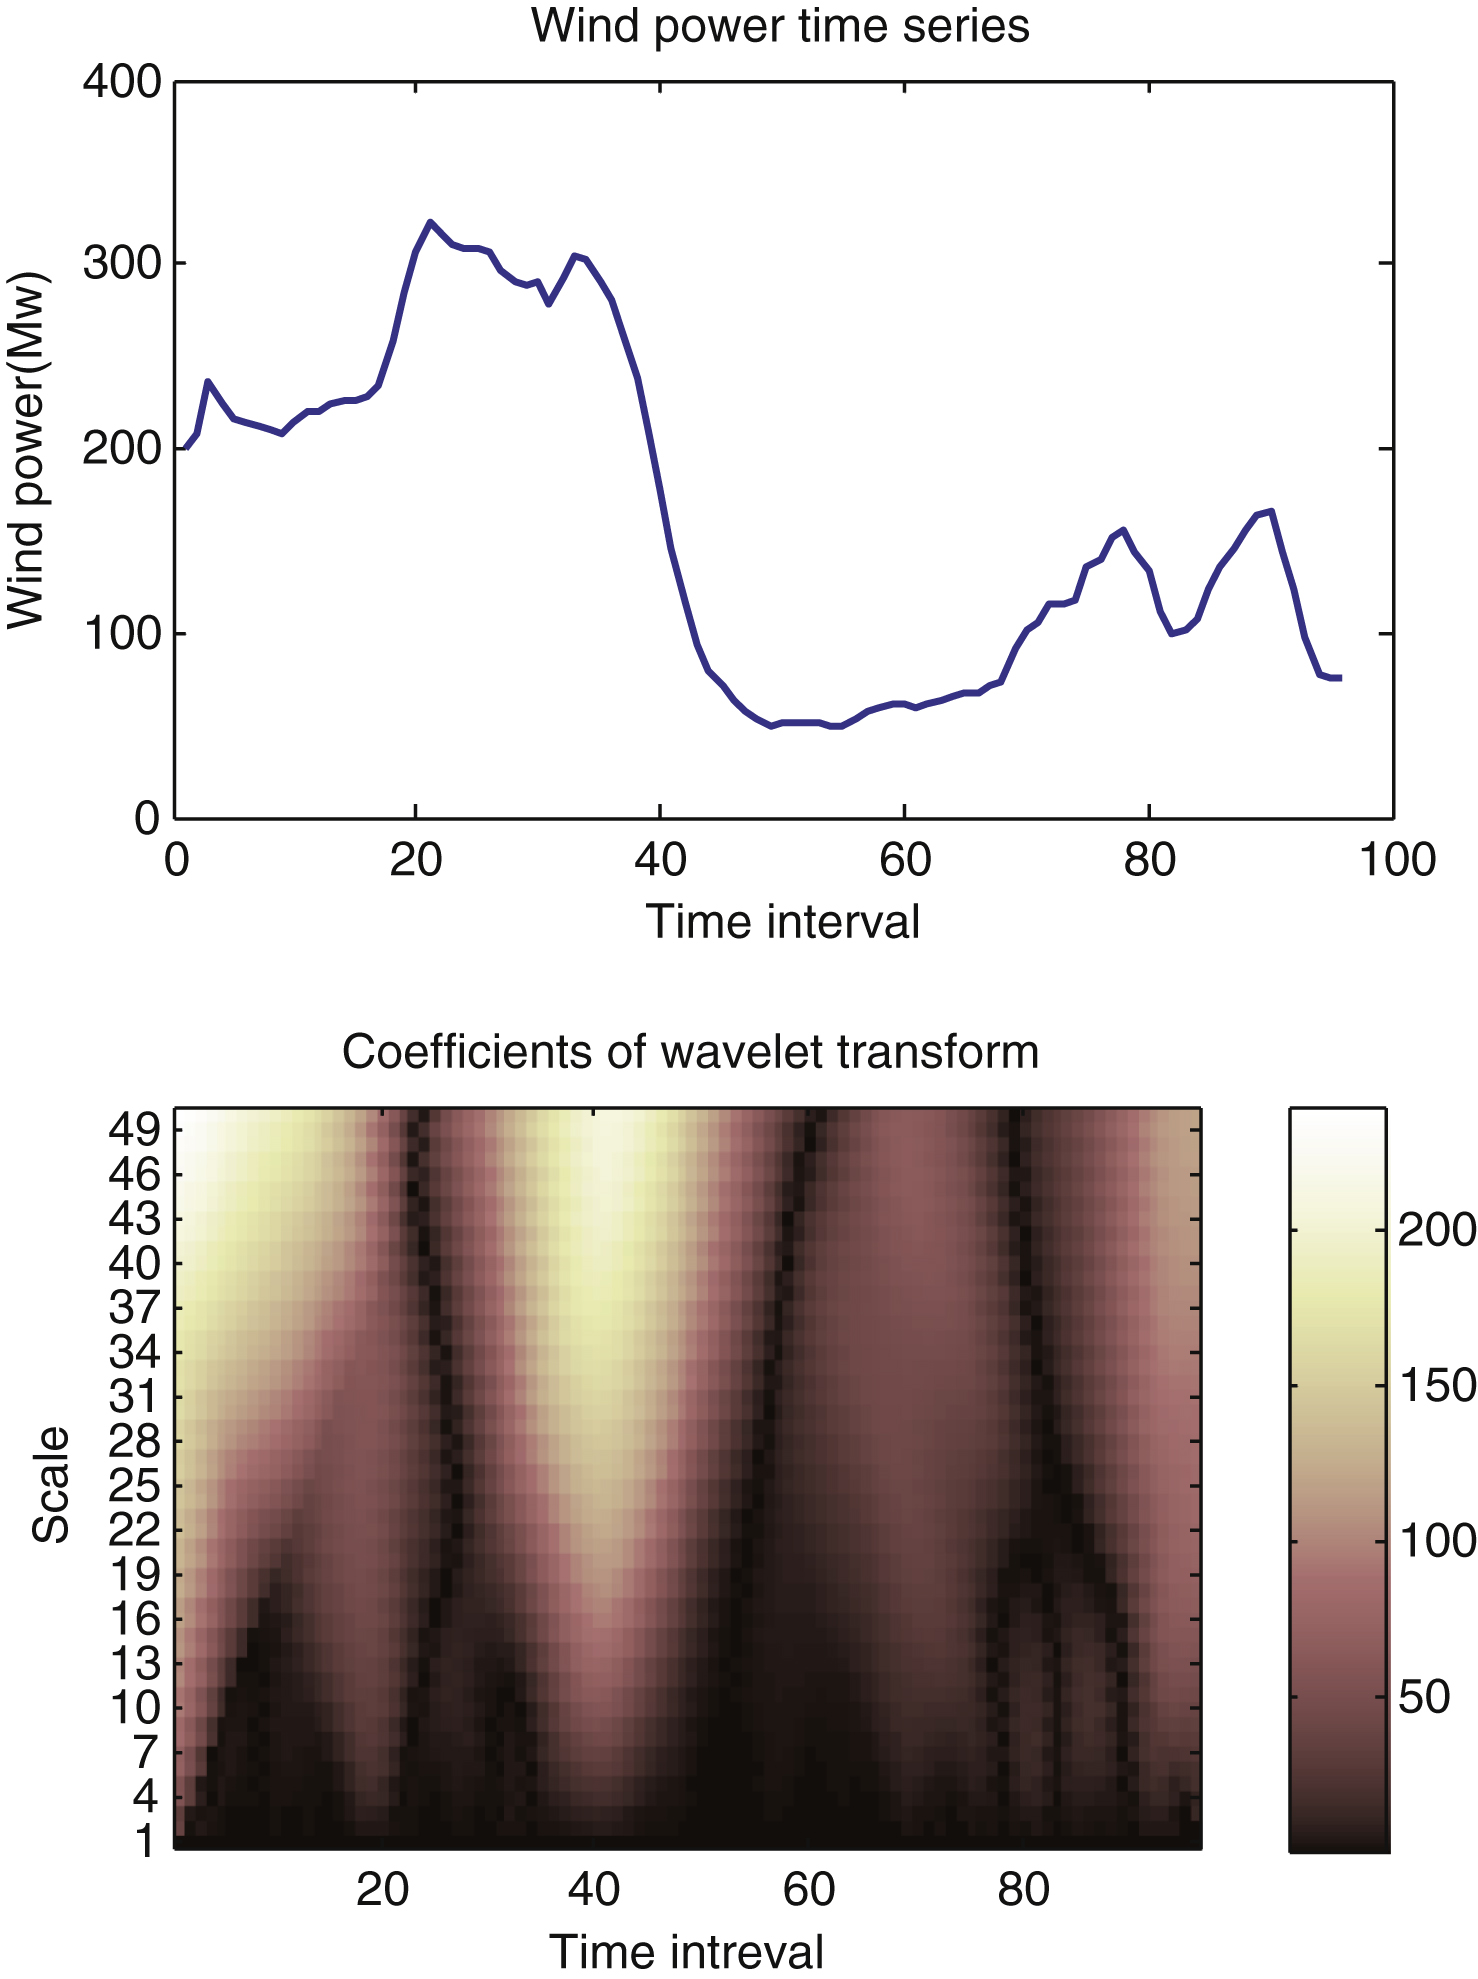
Fig.3
Adaptive network-based fuzzy inference system.
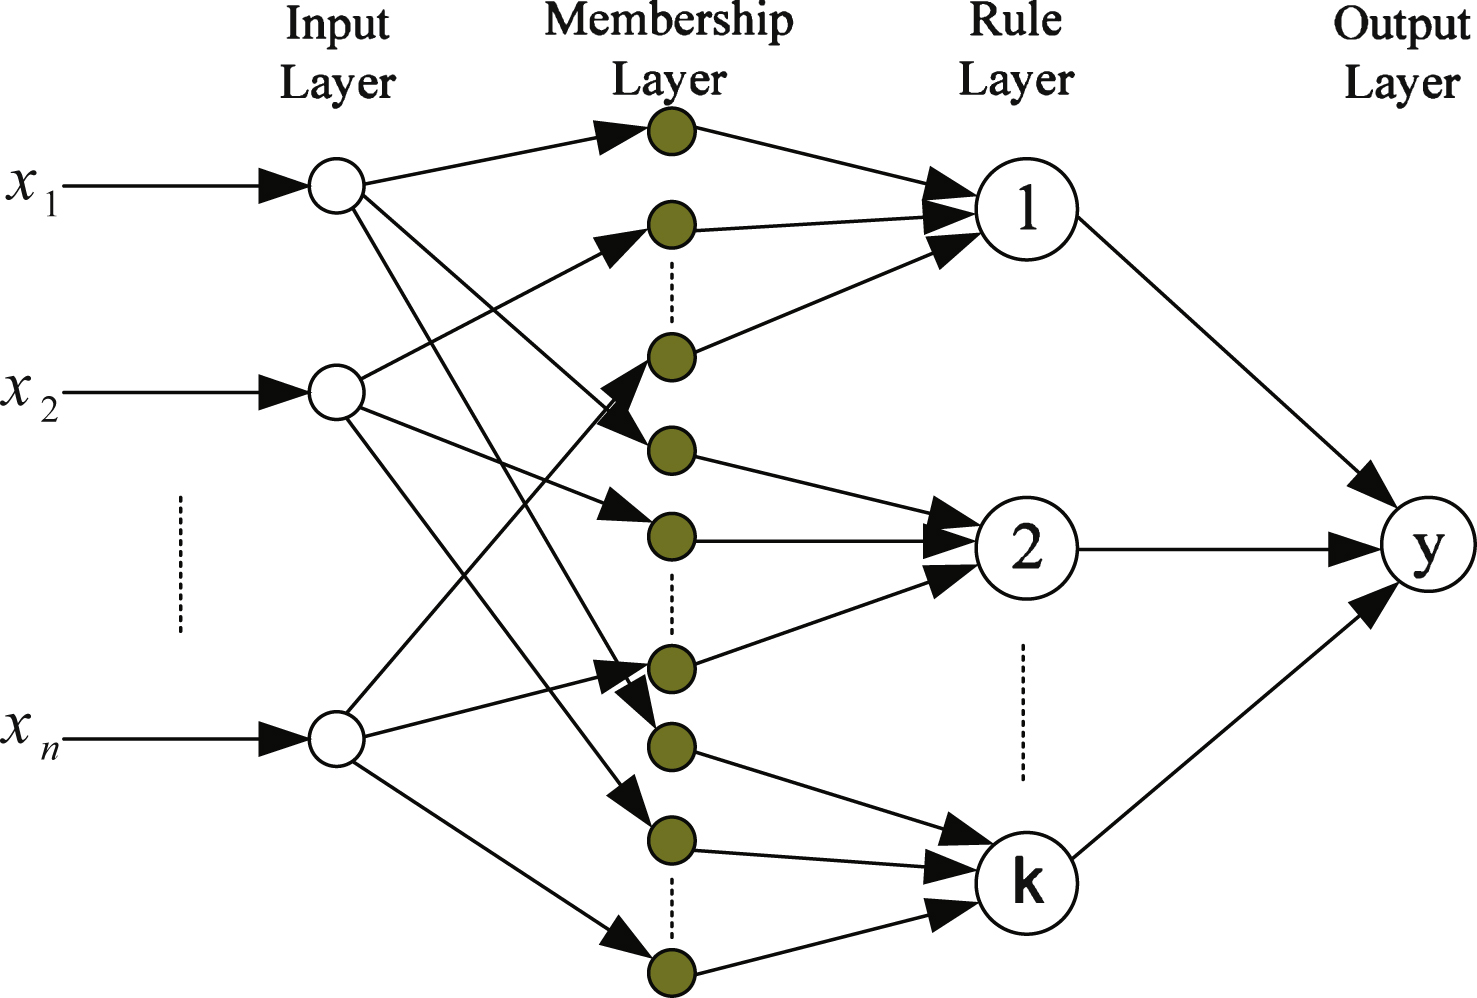
Fig.4
The schematic diagram of moving block bootstrap.
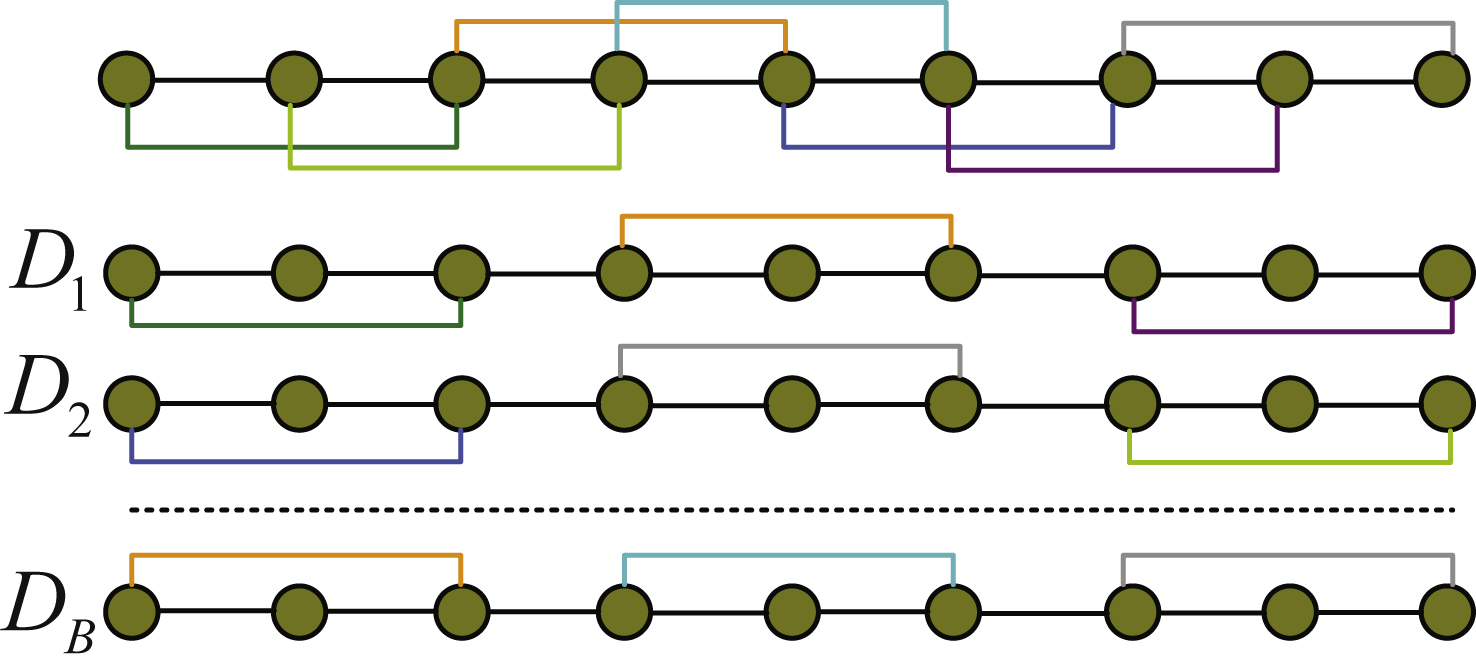
Fig.5
The framework of B neural networks.
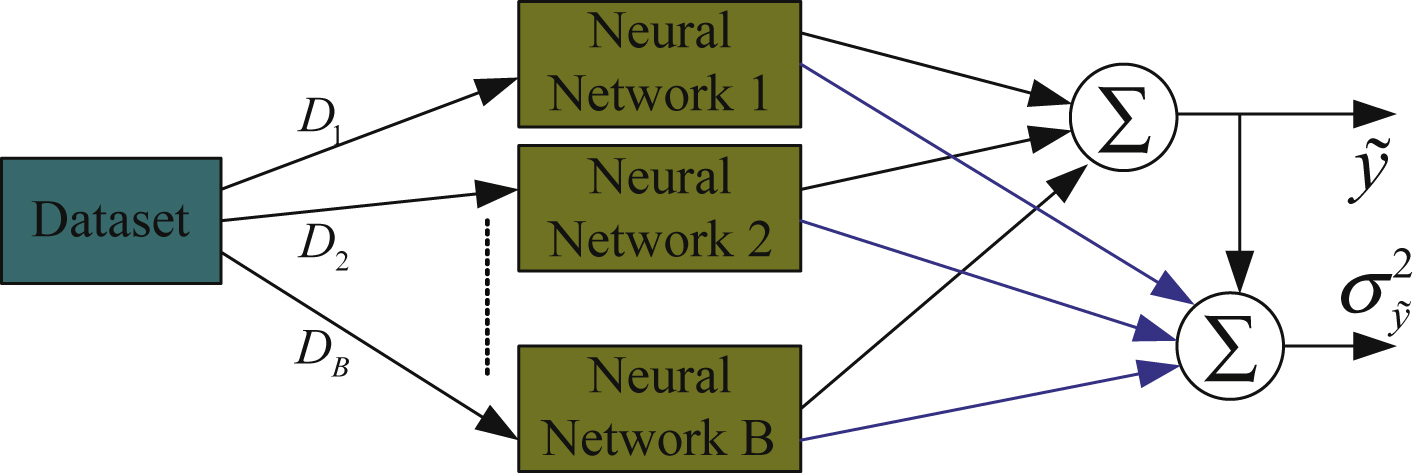
Fig.6
The autocorrelation function of wind power series.
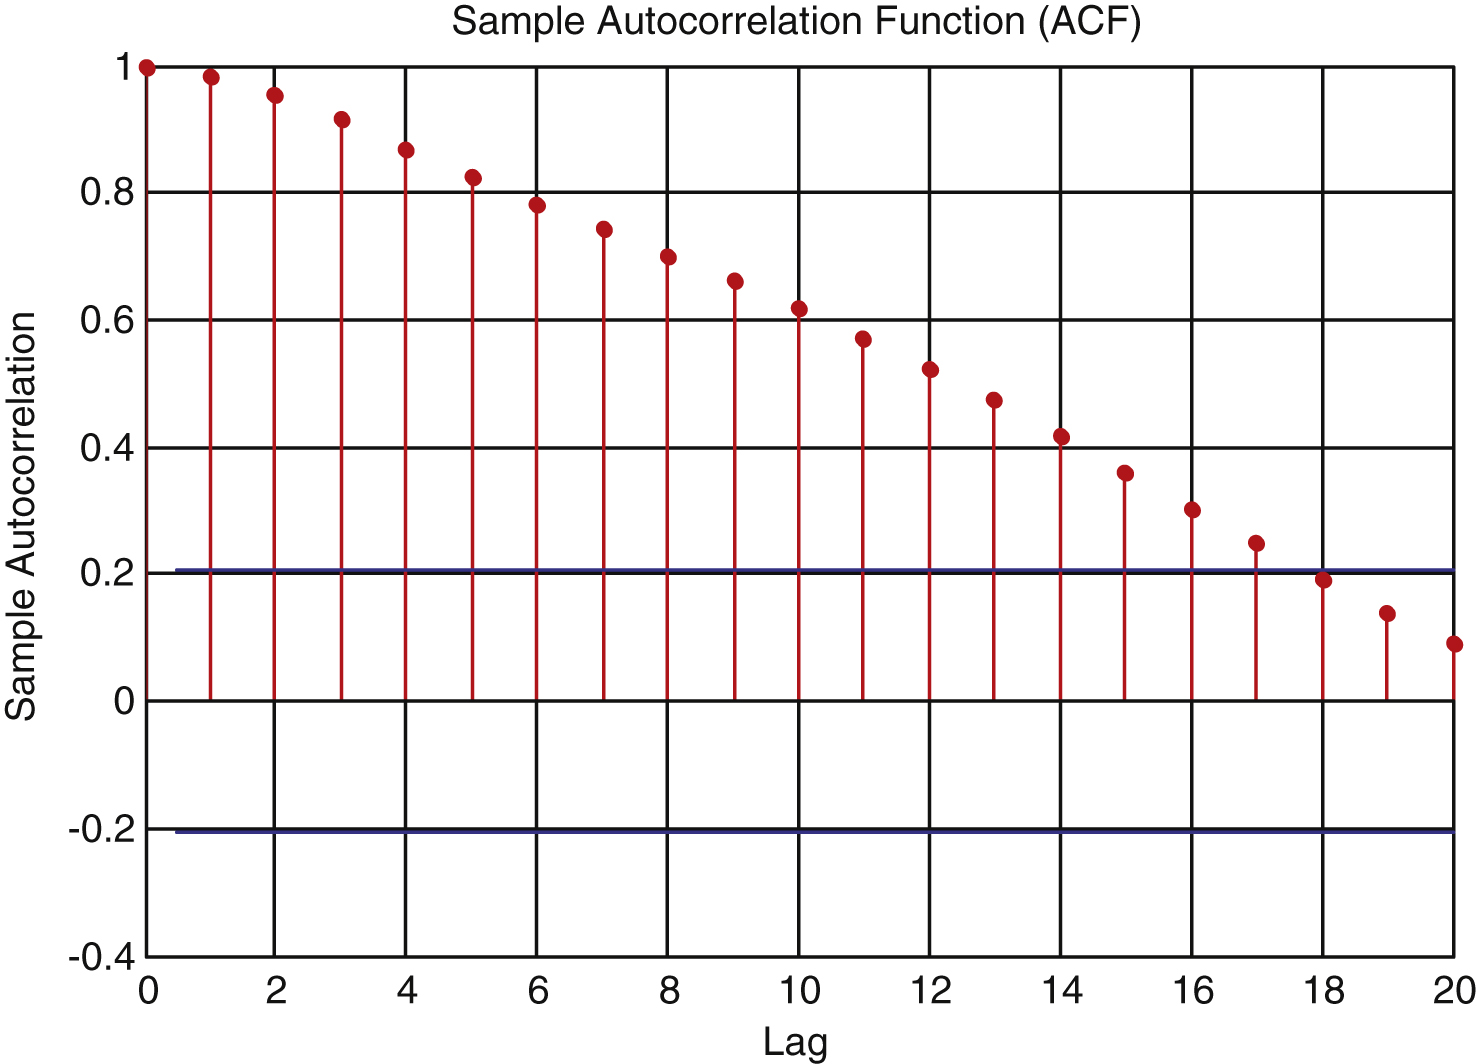
Fig.7
Coefficients of three-level Harr wavelet transform.
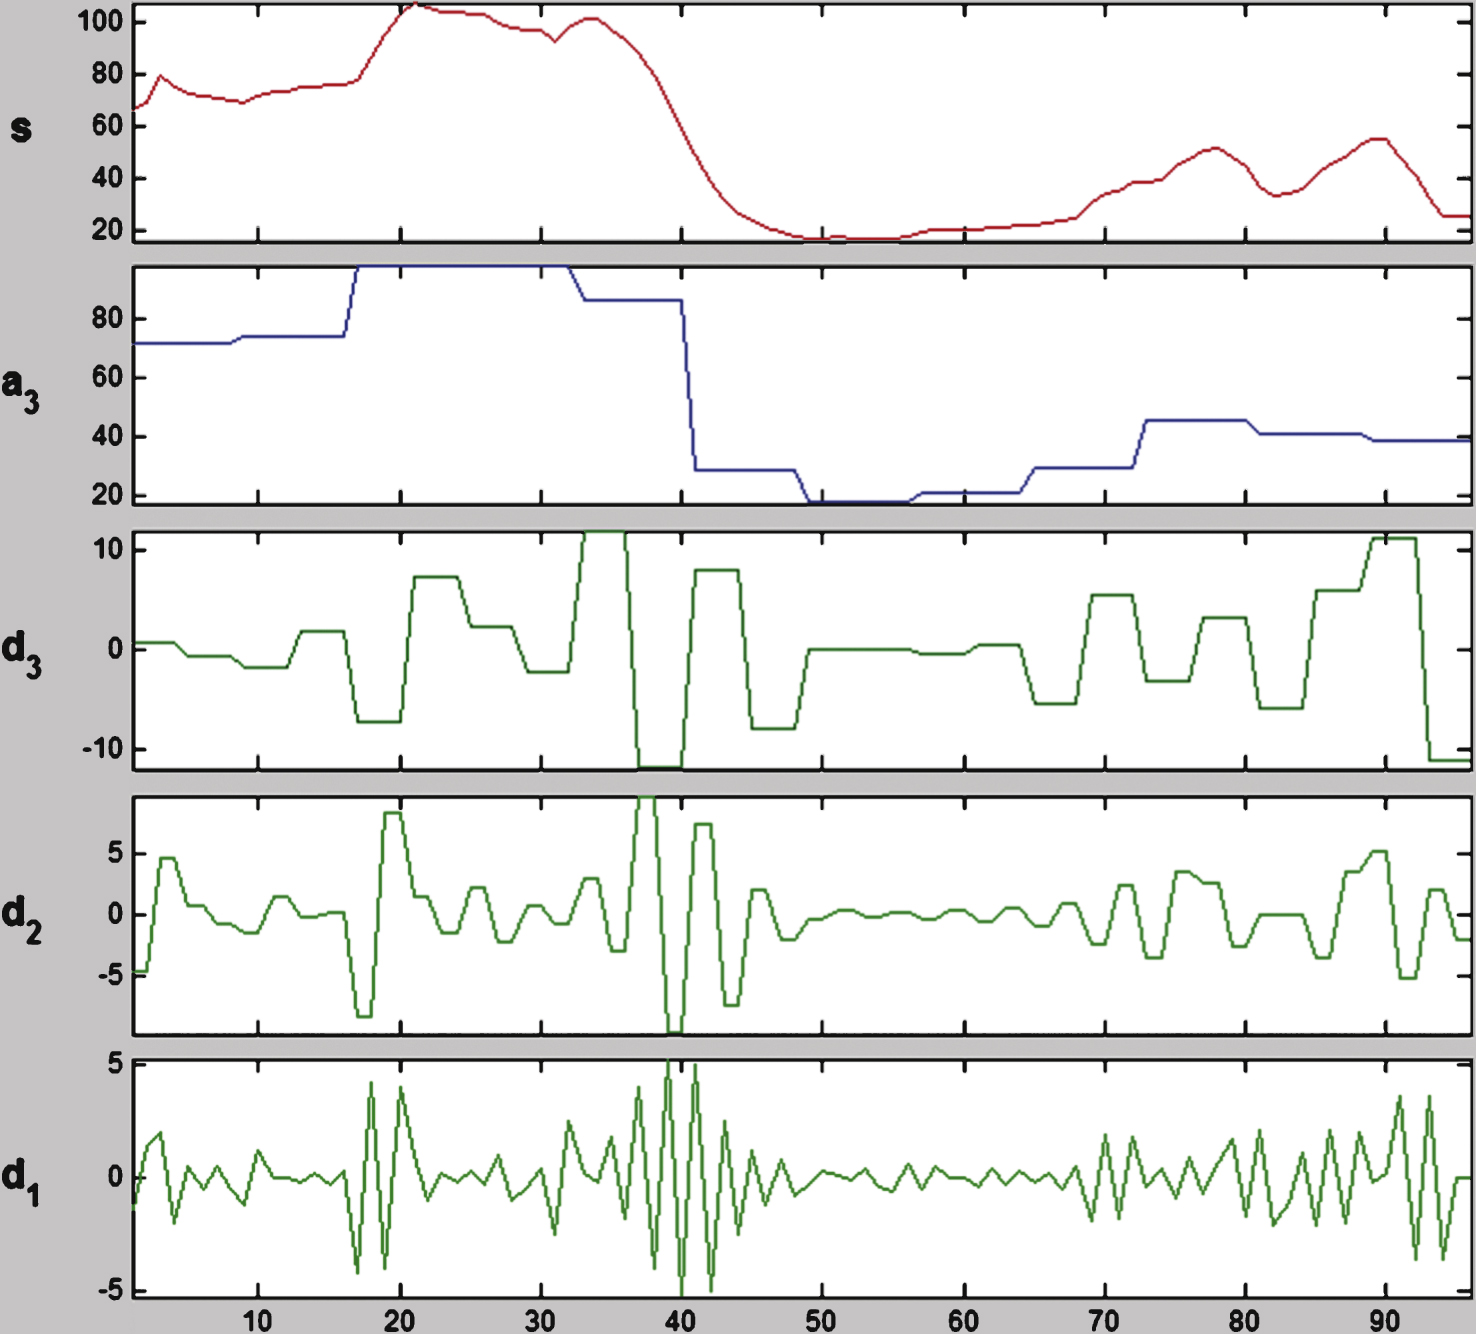
Fig.8
The prediction intervals of wind power series.