
Production performance evaluation based on rough set theory and wavelet neural network
Abstract
Aimed at overcoming subjectivity and improving the accuracy of traditional production performance evaluation methods for manufacturing enterprises, a new model of performance evaluation was proposed based on rough sets and a wavelet neural network (RS - WNN). Firstly, an evaluation index system considering innovation performance was constructed. Secondly, a theory of rough sets and fuzzy mathematics was utilized to preprocess and simplify the index system, and then, the input dimensionality of wavelet neural network was reduced. Finally, algorithms of stepwise checkout and iterative descending grads were employed to decide the parameters of WNN and to obtain the synthetic evaluation value of production performance. A case study showed that the proposed model was effective and feasible in measuring production performance.
1Introduction
The increasingly competitive market requires manufacturing enterprises to continuously improve their production efficiency and reduce costs in order to make profits. Therefore, it is necessary to evaluate production performance in all aspects of the production process to improve efficiency. Aimed at inefficient production areas, some methods are used to enhance these in order to improve enterprise performance. In such circumstances, it is important to evaluate enterprise performance because production performance evaluation for manufacturing enterprises plays a key role in improving the efficiency of business operationmanagement.
Research of production performance evaluation systems manifest in two aspects: the index system of production performance evaluation, and the methods of production performance evaluation. Research on the index system of production performance evaluation has experienced three stages: the cost performance evaluation period, the financial performance evaluation period, and the innovation of enterprise performance evaluation index period. Enterprise performance evaluation has evolved from unilateral evaluation systems of focusing on cost and financial aspects into comprehensive evaluation index systems of aiming at enterprise features [6, 4, 10]. Guo [3] established the indices of production performance evaluation of cleaner production for metal enterprises from four aspects: technology and equipment, consumption of resource and energy, environmental issues, and management levels. Lin [11] proposed a set of index systems, which is suitable for the evaluation of supply chain management from four aspects: the financial profit of supply chain management, the end user benefit, the process of supply chain management, and the improvement of supply chain management.
In the aspect of production performance evaluation methods, Kahraman, et al. proposed a fuzzy analytic hierarchy process (FAHP) to calculate the fuzzy value, while the quality of evaluation results was challenged due to its excessive personal subjectivity factors in this model [1]. Fu developed a performance evaluation model for high-tech enterprises based on error back propagation artificial neural networks (BP) that successfully decreased the personal subjectivity factors in the evaluation process, but failed to solve the problem of slow convergence rates of the core algorithm in the model [13]. The wavelet neural network (WNN) was put forward by Gao, et al. for evaluating co-worker performances of miners in mining tunnel systems. This model works better in reducing the personal subjectivity factors and convergence rate than BP models [12]. The hierarchical evolutionary wavelet neural network (HWNN, Sevkli, et al.) has merits like WNNs [5]. However, this model has redundant evaluation indices, has no desirable convergence rate, and can’t deal with the evaluation value of qualitative index represented by fuzzy language.
From the literatures, it can be noted that index systems are used to evaluate production performance from the aspects of costs, benefits, and productivity, and neglect the significant index of technological innovation capability. Meanwhile, the evaluation process is greatly influenced by subjective factors in linear average weighting methods and fuzzy analytic hierarchy methods. BPs, WNNs, and HWNNs have slow convergence rates, and can’t deal with the evaluation value of a qualitative index represented by fuzzy language.
In this paper, a new evaluation model based on the theory of a rough set and wavelet neural network was proposed, and a performance evaluation system was established that was in accordance with characteristics of different enterprises by using a reduction of a rough set theory. Then, the historical data was trained based on the wavelet neural networks. Therefore, subjective defects of traditional evaluation methods were eliminated and the results were more objective. The new model depicted the real enterprise production operation status, and provided valuable performance evaluation results for management.
2Production performance evaluation model
A wavelet neural network (WNN) is a novel feed-forward neural network that combines the advantages of wavelet transform and traditional neural networks and possesses the characters of time-frequency localization and high adaptability, good self-learning ability, and low false alarm rate [7]. A WNN is applied to deal with the nonlinear problem of production performance evaluations and the complex relationship between evaluation indices and production performance. The comprehensive evaluation index should be preprocessed and simplified because a redundancy phenomenon will appear when too many indices focus on certain aspects of the performance evaluation. Meanwhile, when historical data is processed using a WNN, input data should also be preprocessed because historical data includes various forms such as text, numerical descriptions, signifying descriptions, and so on. In addition, a large amount of computing time and resources are consumed for the input data of an evaluation system when the data is directly analyzed using a WNN. Therefore, a model for production performance evaluation was proposed based on the WNN theory, which combines data preprocessed by rough sets (RS) [2] in order to improve the speed of solving problems using the WNN, simplify the structure of the neural network, reduce the input variables, training steps, and time, and speed up network learning, as well as enhance the accuracy of the judgments. Figure 1 shows the production performance evaluation model.
The working principle of the model, which is based on rough sets and wavelet neural networks, was developed from the following suggestions. Firstly, the qualitative index of a production performance evaluation index system should be fuzzy quantified. Secondly, the index set should be reduced and the redundant information of a homogeneity index removed using rough sets. In order to deal with random and uncertain variables by the WNN effectively and to improve the accuracy and objectivity of the evaluation, a hidden layer, which combines the rough neurons and the wavelet neurons, is used to effectively compensate some properties of the BP network such as easily falling into local optimal solutions and having slow convergence speeds. Due to its simple structure, high maneuverability, and the controllable number of input variables, the three-layer perceptron structure was adopted to build the WNN. The effective factors were used as the input layer and the number of nodes in the input layer was decided by the number of indices of the production performance evaluation after being reduced by the rough set. As the hidden layer, the wavelet transformation combined the rough neurons and wavelet neurons. The output layer depended on the comprehensive evaluation of cooperative customers.
3The construction of the index system
According to the characteristics of the manufacturing enterprise combined with innovative manufacturing enterprises’ characteristics, such as high-tech high growth and high knowledge input, the index system on production performance evaluation in this paper was constructed with innovative elements.
Based on the balanced scorecard theory, the indices of the social dimension were added to make the index system on production performance evaluation perfect. The index system is shown in Table 1.
4The pretreatment of evaluation index in the RS-WNN model
4.1The pretreatment of evaluation index
The index system for production performance evaluation includes multiple qualitative indicators, such as comprehensive after-sales services, harmony of the enterprise staff, and so on, and it is difficult for the traditional quantitative analysis method to evaluate the qualitative indices directly.
A qualitative indices quantification standard based on the relationship between the language variable and fuzzy quantitative values was established to realize the fuzzy quantitative pretreatment of thequalitative evaluation process in this paper. According to the evaluation of idioms, it defines linguistic variables set E = {worst, bad, good, better, best}, which is transformed into the corresponding numerical set S = {0.0, 0.2, 0.2 - 0.4, 0.4 - 0.6, 0.6 - 0.8, 0.8 - 1.0}. In this way, the fuzzy information can be quantitatively evaluated, as shown in Table 2.
4.2The reduction of the production performance evaluation index
The reduction of the production performance evaluation index is that the important indices are extracted from the system to ascend the efficiency of the selection without affecting the evaluating result. The rough set method can effectively deal with uncertain and fuzzy problems in the process of evaluation, and it has relatively low requirement for the prior knowledge. Thus, it is suitable for solving the screening questions of the qualitative indices on the production performance evaluation by reflecting the information of the model according to the analysis of the evaluating data. The process is shown as follows:
Step 1: Discretizing the historical data of the production performance
Firstly, the historical data of the production performance is discrete because the data that is processed by the rough set is discrete and the data of the production performance evaluation is continuous. At present, the methods of discretizing the data include the equidistance method, the equivalent frequency method, and maximum entropy method. The equidistance method was selected to discretize the historical data of the production performance in this paper.
Step 2: Establishing the interval valued decisiontable.
Let the quad IS = (U, A, V, f) be an information system, where U : U = {x 1, x 2, …, x n } is a finite nonempty set, which is called the universe. A : A = {α|α ∈ A} is the property’s finite nonempty set. For each, α i ∈ A (1 ≤ i ≤ m) is a simple attribute and V : V = ∪ V i (1 ≤ i ≤ m) is the domain of the information function.
Here V i (1 ≤ i ≤ m) is the domain of attribute α i , and f : f = {f i |f i : U → V i (1 ≤ i ≤ m)} is the IS’s information function. When A = C ∪ D, here C is the condition attribute set, and D is the decision attribute set, so the information system that includes the condition attribute set and decision attribute set is called the decision table. After discretizing the attribute values of the production performance indices and quantification processing in Step 1, the row that showed the attribute and the column that expressed the two-dimensional decision table of the object’s attributes were acquired. The row and the column represented the condition attribute and the decision attribute, respectively.
Step 3: Calculating the importance of α i
Condition attribute α i is a certain evaluating index of the index system on production performance evaluation, and the importance of α i is its influence degree towards the decision result after removing α i from the condition attribute set C. The larger the influence degree towards the decision result, the more important the α i is. The calculation equation of the importance of α i is shown as follows:
(1)
Here γ c (D) is the dependency degree between C and D.
The influence degree of each index was transformed into the weight, and then the weight of each index was normalization processed by Equation (2).
(2)
Here ω i is the weight of ith attribute in the decision attribute set.
Step 4: The reduction of indexes
Through the above analysis, the weights of all indices that were expressed as {ω 1, ω 2 … , ω i , … ω n } were acquired by calculating; then the indices of higher weights were selected. Therefore, the index system on the production performance evaluation model was established.
5The evaluating procedure of RS-WNN model
Between the weight of evaluating indices and the value of the production performance evaluation, there is a complex and internal mapping relationship. Because production performance evaluation systems include many indices and the results of the production performance evaluation is influenced by the values of each evaluation index, production performance evaluations can thereby be seen as complex nonlinear systems. WNN was applied to deal with the nonlinear mapping relationship between the value of the evaluation indices and the production performance evaluation effectively because it possesses the characters of time-frequency localization and high adaptability, good self-learning ability, and low false alarm rate. Moreover, RS-WNN was put forward to evaluate the production performance in order to reduce uncertain and random parts and improve the capability of learning.
Making use of the advantage of the RS-WNN, the evaluating indices of the production performance evaluation was used as the input factors and to be the input layer. The wavelet transformation as the interlayer combined the rough neurons and wavelet neurons. The output layer depended on the comprehensive result of the production performance evaluation. Therefore, the RS-WNN was constructed with three layers to evaluate production performance.
– Input
The input data of the production performance evaluation was the value of the evaluating indexes. And the number of nodes in the input layer was decided by the number of indexes. Meanwhile, X = (x 1, x 2, …, x n ) denoted the evaluating index set of the productionperformance.
– Interlayer
(i) Rough neuron
The input data needed to be trained by the interlayer, which combined the rough neurons and wavelet neurons. The rough neuron was constituted by the upper neuron R - and the lower neuron [8], as is shown in Fig. 2.
The value of the production performance evaluation index was disposed by the two neurons, and the result was transferred to the wavelet neuron. After treatment, the result of output was as follows:
(3)
After calculation, the result can be the input value of the wavelet neuron as follows:
(4)
Equation (4) reflects the fluctuation of the input variables with outside influences and transfers the information to the wavelet neuron to improve the anti-interference ability of the net.
(ii) The comprehensive evaluation of productionperformance
As shown in Fig. 1, the input data of the wavelet form the following two aspects: the value of each production evaluation index, and the result processed by the rough neuron. Therefore, the t i of the ith wavelet basis unit φ i (t) in the model of the production performance evaluation was determined by u ij , the jth input variable x j , and the output value of the jth rough neuron, as follows:
– Output
According to the input of the rough-wavelet neural network and the processing procedure, the value of the production performance evaluation can be obtained as follows:
(5)
– Training and correction
Aiming at the diversity of the model of production performance evaluation, the model needed to learn and be trained in order to realize optimal fitting between the predictive values and the actual values, and then determine the value of u ij , a i , b i , w i in the model of production performance evaluation.
Let H be the number of training samples in theR-WNN, as (x k1, x k2, …, x kn , y k ) (k = 1, 2, …, H). The training of the network parameters u ij , a i , b i , w i were optimized by taking advantage of the least mean square error function [9].
(6)
The wavelet base number m in the network was determined by the generalized likelihood ratio test. First, the boundary of fitting error ɛ in the model of production performance evaluation and the number of hidden units i was put forward, thus getting E i ., as in the following:.
IF E i < ɛ , THEN m = i;
OTHERWISE m = i+1;
THEN comparing Ei+1 and ɛ;
UNTIL m = m* and E m* < ɛ, The optimal structure of the RS-WNN was then acquired.
The wavelet basis function was determined by the cosine-modulated Gaussian-Morlet wavelet. Because of flexible adjustability of its time window and frequency bandwidth, the basic wavelet function can take the form as follows:
The R-WNN network parameters u ij , a i , b i , w i needed to be trained and optimized by an error back propagation (BP) algorithm. The specific procedure was as follows:
Step 1: The initialization of network parameters.
Include the number of neurons in the input layer and output layer of the RS-WNN, the network link weight u ij , w i , dilation factors a i and displacement factors b i of the basic wavelet function and the error of fit value ɛ.
Step 2: Input training samples
Include x kj (j = 1, 2, …, n, k = 1, 2 … H) and the corresponding desired output y k
Step 3: The self-learning of the RS-WNN
According to the current parameters of the network, the output value can be achieved with Equation (4).
Step 4: Calculating the instantaneous gradient of different parameters according to the least mean square error function.
Each parameter of the WNN was modified by the steepest descent method, as in the following:
(7)
(8)
(9)
(10)
Step 5: Calculating network errors
If the absolute value of network error < the permissible tolerance, stop training.
Otherwise, return to Step 2.
6Experiments
The proposed production performance evaluation model was tested on an automotive manufacturer. Table 3 presents the values of quantitative indices of its production performance from 2000 to 2013.
– Qualitative indices
There were 15 experts employed to evaluate the qualitative indices in the production performance indices pond. Table 4 shows the evaluation results of 2000.
– The fuzzy quantization of the evaluation indices
According to the linguistic description of the production performance by the experts, the linguistic variables were quantified combined with the yardstick between the fuzzy quantization and these variables. As for each index, the evaluation value of 15 experts were processed by
– Reduction of the production performance evaluation indices
According to the character of discretizing data based on rough set theory, the equidistance method was selected. The fuzzy quantization of experts was used to deal with the qualitative indices, and the data over the years of each index were discretized according to the equidistance method for the quantitative indices. After discretizing, four grades were acquired, and the segmentation process follows:
Let x
ji
be the evaluation value of the production performance of jth year for the ith index, x
min and x
max are the maximum and minimum of the ith index during 2000 to 2013. Therefore,
The data of the production performance evaluation index was discretized and then the weight of each index was achieved by the reduction of Equations (1) and (2) in Table 6.
The evaluation indices of the production performance were ordered according to the weight of each index, and the index with a weight more than 0.022 was selected as the criterion of the production performance evaluation. After the reduction by the rough set, the evaluation indices of the production performance were obtained as follow:
– The evaluation of production performance byRS-WNN
The selected data needed to be trained by the RS-WNN. The aforesaid 21 evaluation indices were taken as input nodes of the network and the output result as the output node. The error of fit value was set to ɛ = 10-4, the data of 2000–2012 was used as the training example, and the data of 2013 was the test case. Verified by the practical data of the training process, the learning rate, the momentum factor, and the number of nodes in hidden layers were set to 0.6, 0.7, and 10, respectively. The anticipant model of the RS-WNN was acquired after 300 iterations. The result of the evaluation is shown in Table 7.
The demanded accuracy after training was reached after about 300 iterations of the model of the RS-WNN. Table 8 presents the performance comparison between the models. To reach the same training precision, the demanded average iteration times of RS-WNN, BP network, WNN, and HWNN were 320, 980, 780, and 780, respectively. It was obvious that RS-WNN showed the best convergence capacity. Meanwhile, the capacity of network generalization and the evaluating accuracy of the RS-WNN were better than other models.
7Conclusion
This paper introduced a new neural network model that combined rough set theory and wavelet neural network to evaluate production performance. After the pretreatment of the evaluation indices, those with great influence were extracted. This method reduced the number of input variables, accelerated the rate of the convergence, and improved the evaluating efficiency. In comparing the new neural network model with other models, it showed higher evaluating accuracy. Meanwhile, the weights of the evaluation indices were determined by the self-learning system of wavelet neural network in the evaluating process. As a result, the proposed approach has good applicability potential under many evaluation indices or some uncertain weights of index conditions.
References
1 | Kahraman C, Cebeci U, Ulukan Z (2003) Multi-criteria supplier selection using fuzzy AHP Logistic Information Management 16: 6 382 394 |
2 | Ciucci D, Dubois D, Prade H (2014) The structure of oppositions in rough set theory and formal concept analysis-Toward a new bridge between the two settings Lecture Notes in Computer Science 8367: 154 173 |
3 | Guo HJ, Zhao YF (2009) The clean processing performance evaluation for non-ferrous metal enterprises Economic Forum 465: 17 91 93 |
4 | Li JL, Li DS (2012) On the evaluation index system of the performance of common technology alliance Forum on Science and Technology in China 12: 34 43 |
5 | Sevkli M, Koh SC, Zaim S, Demirbag M, Tatoglu E (2008) Hybrid analytical hierarchy process model for supplierselection Industrial Management & Data Systems 108: 1 122 142 |
6 | Zhou P (2008) The performance evaluation of Chinese motor enterprise supply chain Lanzhou University of Technology Doctor thesis |
7 | Hamid RFM, Mahiran B (2014) Optimization of process parameters for lipase-catalyzed synthesis of esteramines-based esterquats using wavelet neural network (WNN) in 2-liter bioreactor Journal of Industrial and Engineering Chemistry 20: 4 1973 1976 |
8 | Chandana S, Mayorga RV (2005) The new rough neuron International Conference on Neural Networks and Brain 1: 13 18 Washington DC |
9 | Song SJ, Ge LF, Ma SJ (2014) Accurate modeling of switched reluctance machine based on hybrid trained WNN AIP Advances 4: 4 1042 1059 |
10 | Wang WQ, Liu LL, Wu WL, Sun DW (2012) An empirical study on the relationship between scale and operating efficiency of China’s automobile industry Industrial Engineering and Management 17: 6 59 65 |
11 | Lin XF (2013) The building of supermarket supply chainperformance evaluation index system based on balanced scorecard Journal of Luoyang Normal University 32: 11 116 118 |
12 | Gao XX (2012) Establishment and application of intrinsic coal-workman evaluation model based on wavelet neural network Procedia Engineering 45: 225 230 |
13 | Fu YW, Yin H, Yang GB (2006) Application of BP neural network in evaluating enterprise operation performance Operations Research and Management Science 15: 4 137 140 |
Figures and Tables
Fig.1
The RS-WNN model of production performance evaluation.
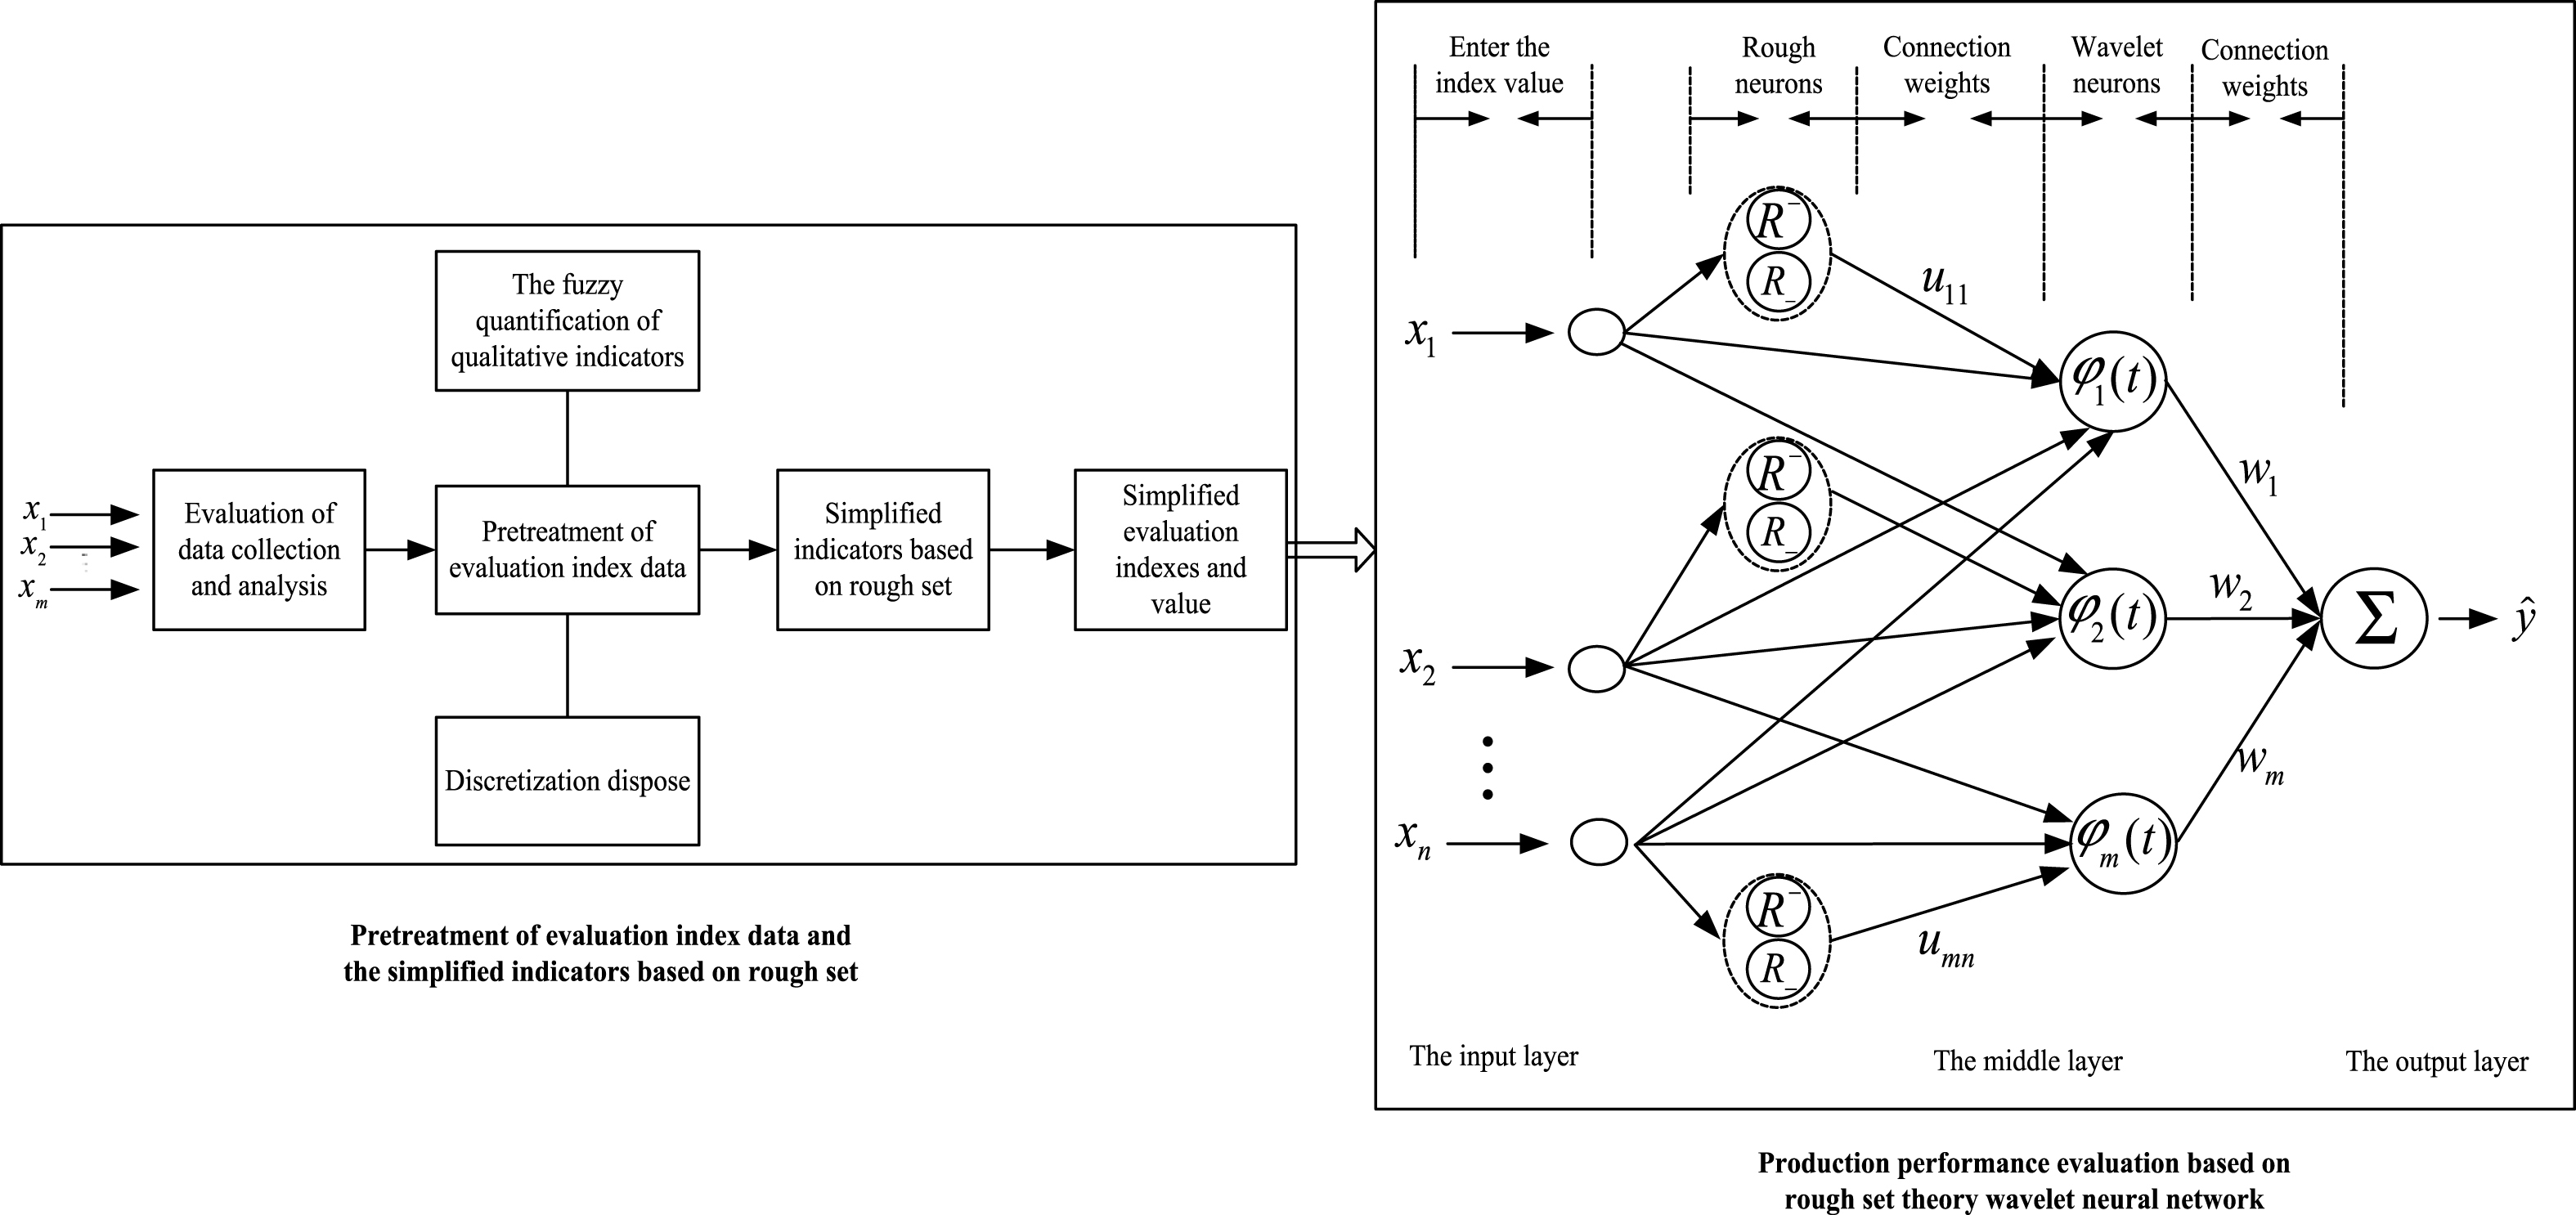
Fig.2
The rough neuron.
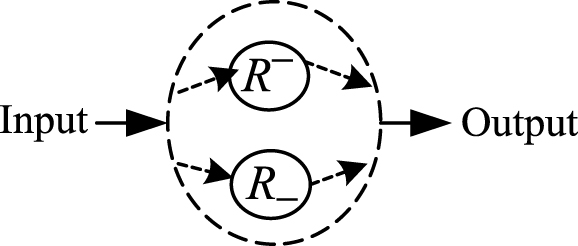
Table 1
The index system for production performance evaluation
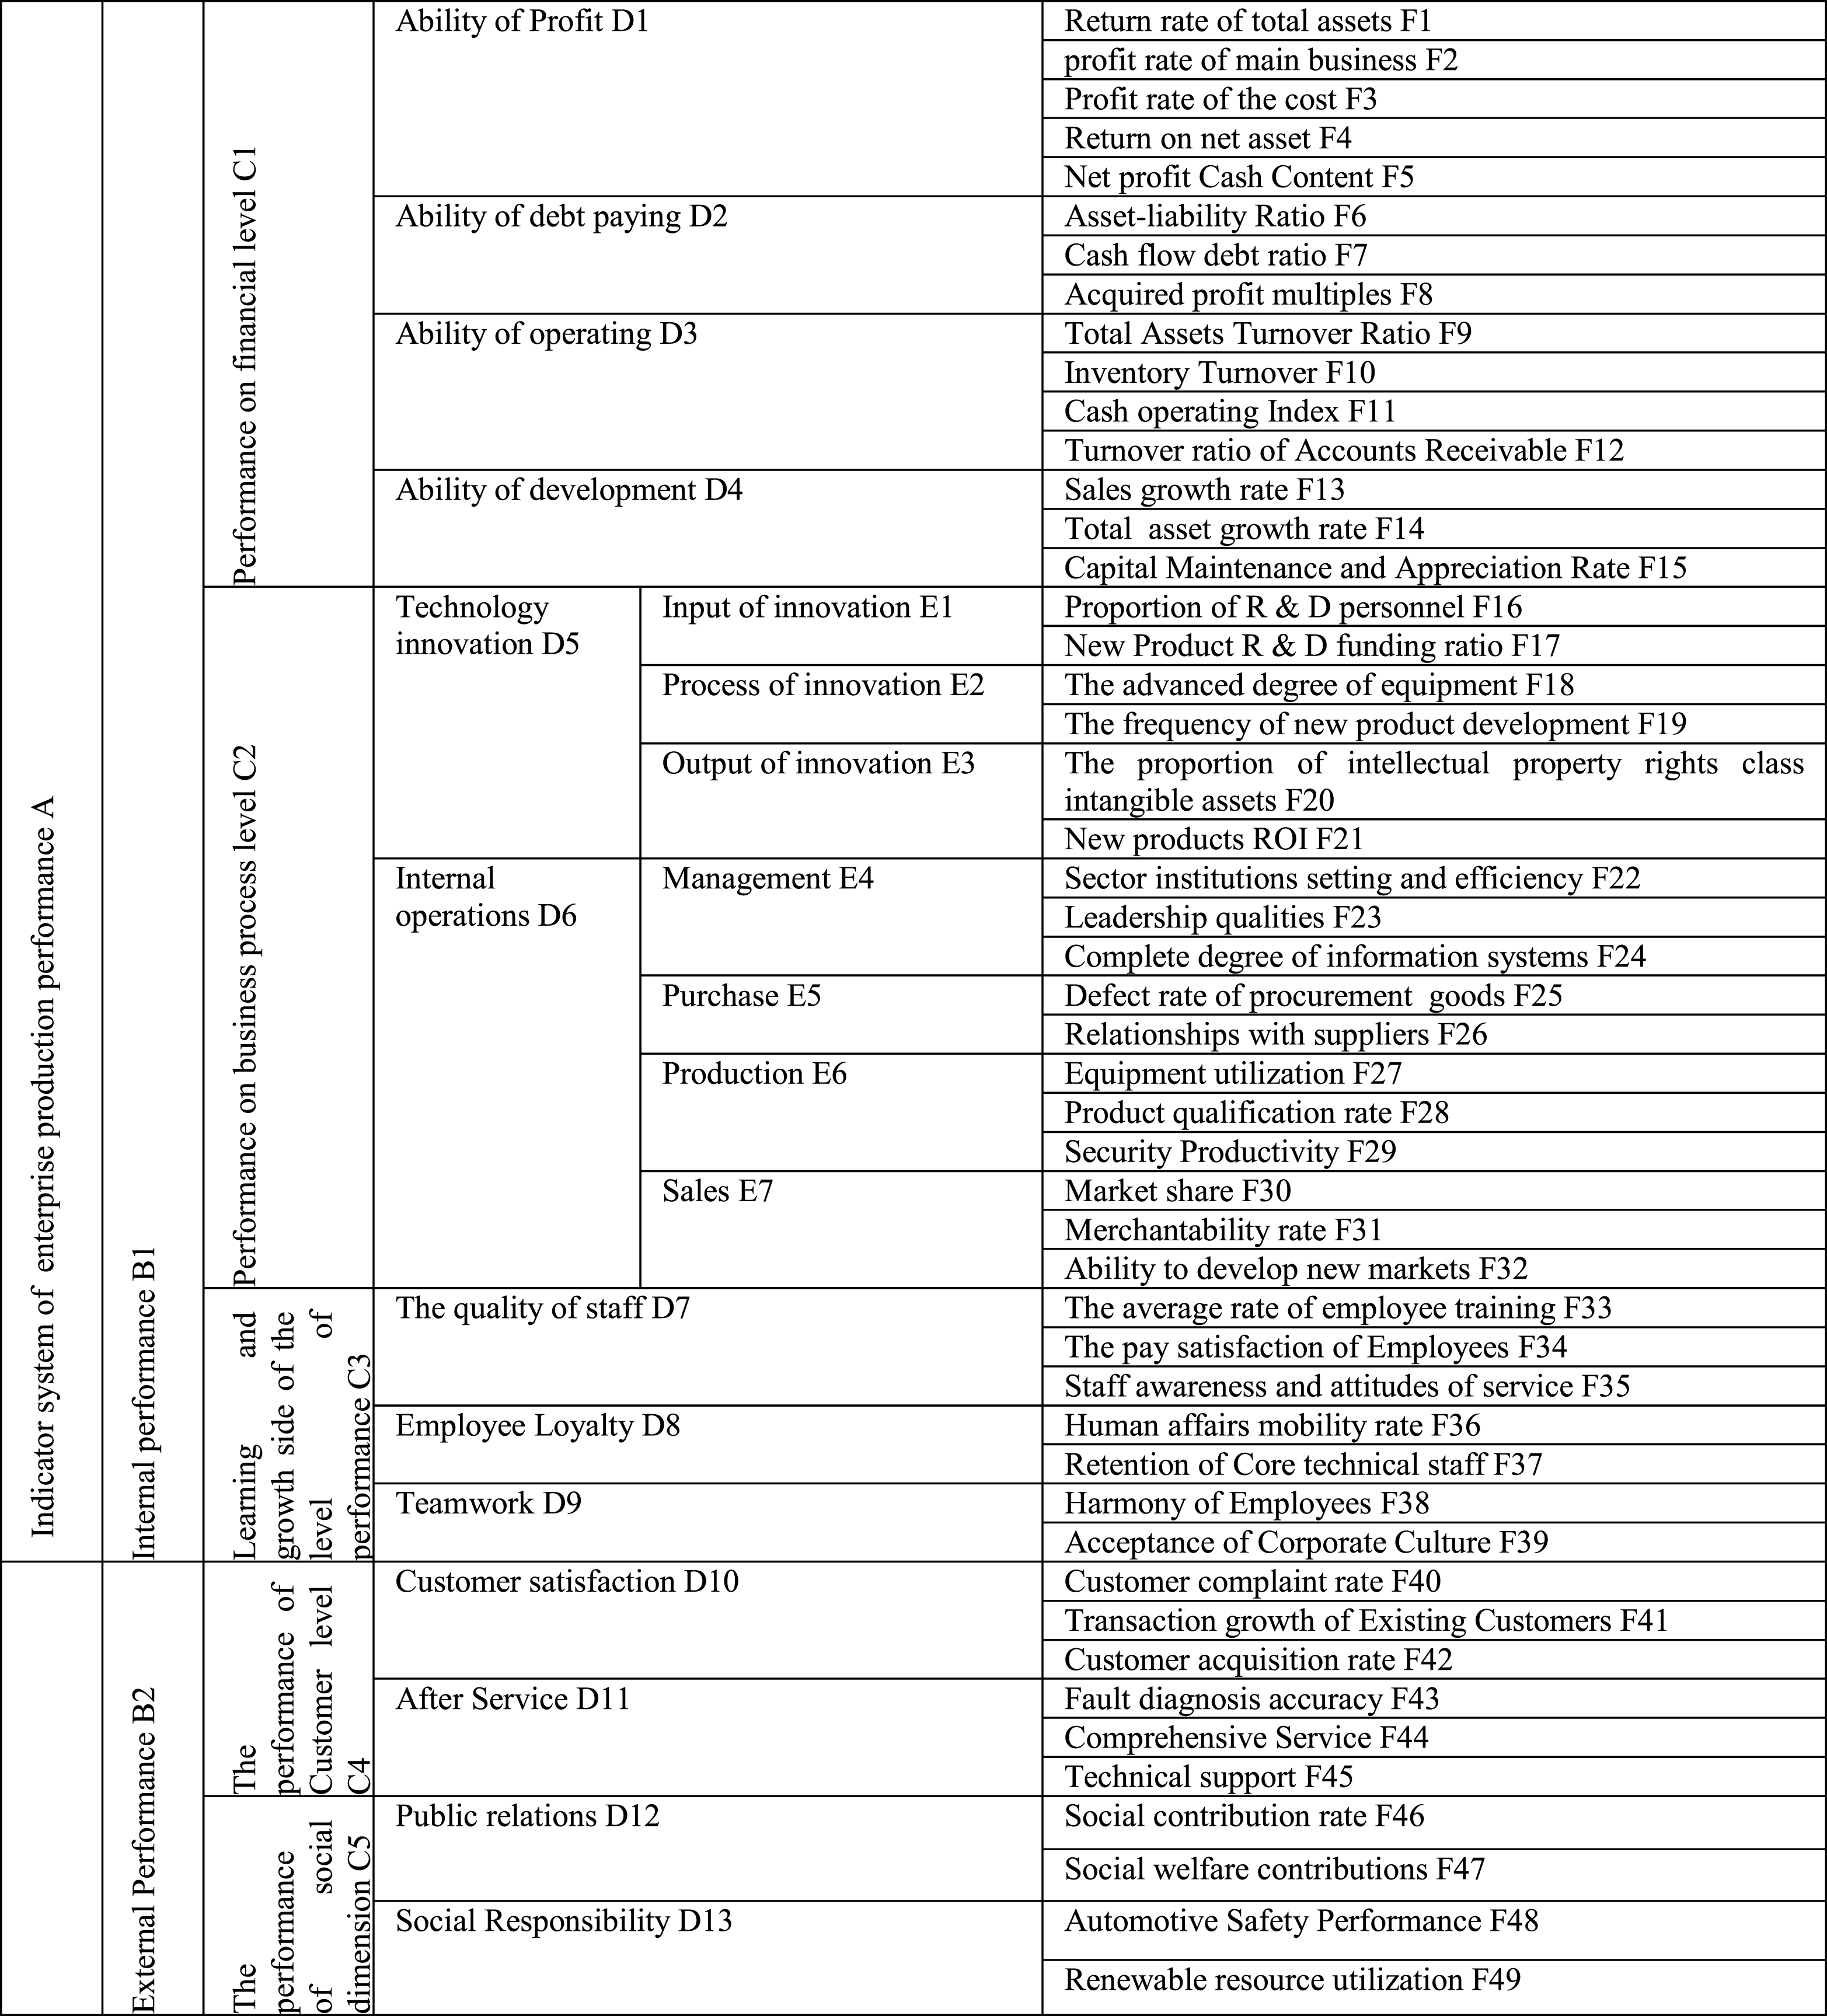 |
Table 2
The qualitative indices quantification standard
| Linguistic variables | Best | Better | Good | Bad | Worst |
| Fuzzy quantitative values | 0.8–1.0 | 0.6–0.8 | 0.4–0.6 | 0.2–0.4 | 0.0–0.2 |
Table 3
The values of quantitative indices of its production performance from 2000 to 2013
| Indices | Data base from 2000 to 2013 |
| Return on total assets F1 (%) | 4.1,8.2,15.7,9.3,7.2,13.7,11.9,8.6,9.3,13.8,17.2,19.5,20.6,16.7 |
| Profit margin F2 (%) | 8.2,14.7,21.0,11.5,12.7,19.8,18.1,12.4,19.6,20.1,17.8,16.0,18.3,15.4 |
| The cost profit margins F3 (%) | 4.5,7.2,8.0,6.8,11.2,13.4,11.8,9.2,16.1,16.7,17.5,17.3,18.6,12.3 |
| Rate of return on common stockholder equity F4 (%) | 14.2,16.3,19.7,15.2,12.4,19.0,13.8,11.3,16.2,19.8,22.4,27.1,32.3,21.5 |
| Net profit and cash F5 (%) | 98.2,101,134,121,114,345,212,156,432,534,687,964,987,523 |
| Debt to assets ratio F6 (%) | 79,71,60,52,49,76,60,51,41,32,39,64,51,78 |
| Cash flow debt ratio F7 (%) | –4.3,1.2,1.1,8.7,10.3,8.2,16.4,18.2,11.7,22.1,23.2,21.7,19.6,16.8 |
| Time interest earned ratio F8 | 0.7,1.0,0.9,2.1,3.2,5.1,6.3,4.7,3.4,4.6,7.8,7.6,8.5,6.3 |
| Total Assets Turnover F9 (times) | 2.7,2.3,1.8,1.9,2.2,0.8,0.5,0.8,0.3,1.1,1.6,0.9,1.2,1.5 |
| Inventory turnover F10 (times) | 8.2,7.8,10.9,15.3,12.9,7.5,5.9,4.8,6.2,12.9,15.7,17.5,14.3,9.0 |
| Sales growth rate F13 (%) | 2.7,3.8,5.7,14.7,24.032.8,36.1,23.1,22.4,26.9,37.7,41.2, 24.3,20.2 |
| Total assets growth rate F14 (%) | 0.06,0.09,0.19,0.18,0.23,0.26,0.31,0.21,0.18,0.38,0.25,0.11,0.17,0.13 |
| Capital maintenance and increment ratio F15 (%) | 97.5,125.6,102.7,106.7,111.2,117.3,109.4,109.6,87.3,113.1,123.6,104.8,107.9,107.3 |
| Number of R &D personnel F16 (%) | 1.5,1.7,2.1,2.3,3.2,4.1,4.4,5.2,3.1,3.5,3.2,3.8,4.1,4.0 |
| New product R &D funding ratio F17 (%) | 0.35,0.36,0.47,0.51,0.72,0.77,0.98,0.77,0.98,1.12,1.14,1.15,1.17,1.21 |
| Return on new products F21 (%) | 9.2,10.7,16.3,17.7,16.2,15.3,13.6,15.8,4.3,5.1,14.3,20.1,21.3,16.5 |
| Defect rate of purchase F25 (%) | 7.2,6.8,5.1,6.7,9.7,10.2,5.1,3.2,2.8,4.6,3.9,5.1,4.3,3.8 |
| Equipment utilization ratio F27 (%) | 89.2,92.49,88.99,80.3,92.3,82.57,83.86,90.1,47.44,78.6,82.53,80.3,89.74,92.37 |
| Market share F30 (%) | 18.2,19.3,20.3,20.7,24.1,23.5,25.7,28.2,29.2,28.3,27.6,30.3,27.8,25.4 |
| Average employee training rate F33 (times) | 3.0,2.5,2.6,4.0,6.3,5.1,4.0,3.0,1.2,1.5,2.0,4.5,4.0,3.5 |
Table 4
The evaluation table of production performance in 2000
| F 18 | F 24 | … | F 49 | comprehensive value | |
| Expert 1 | Very poor | better | … | better | better |
| Expert 2 | better | Very poor | … | better | better |
| … | … | … | … | … | … |
| Expert 15 | better | better | … | better | better |
Table 5
The fuzzy quantization table of production performance
| Index | F 18 | F 24 | … | F 48 | F 49 |
| The fuzzy | 0.37 | 0.69 | … | 0.28 | 0.19 |
| Evaluation value |
Table 6
The weight of each index
| F 1 | F 2 | … | F 25 | … | F 48 | F 49 | |
| Weight | 0.032 | 0.019 | … | 0.023 | … | 0.025 | 0.018 |
Table 7
The evaluation value of production performance
| Year | F 1 | … | F 25 | … | F 49 | Comprehensive value |
| 2000 | 0.36 | … | 0.26 | … | 0.32 | 0.31 |
| 2001 | 0.47 | … | 0.41 | … | 0.37 | 0.41 |
| 2002 | 0.35 | … | 0.71 | … | 0.47 | 0.49 |
| … | … | … | … | … | … | |
| 2013 | 0.23 | … | 0.51 | … | 0.27 | 0.43 |
Table 8
The performance comparison between models
| Evaluation | Nodes in | Training | Average |
| method | hidden layer | error | training step |
| RS-WNN | 10 | 0.0001 | 320 |
| BP | 23 | 0.0106 | 980 |
| WNN | 23 | 0.0084 | 780 |
| HWNN | 19 | 0.0050 | 780 |


