
White Matter Microstructure Changes Revealed by Diffusion Kurtosis and Diffusion Tensor Imaging in Mutant Huntingtin Gene Carriers
Abstract
Background:
Diffusion magnetic resonance imaging (dMRI) has revealed microstructural changes in white matter (WM) in Huntington’s disease (HD).
Objective:
To compare the validities of different dMRI, i.e., diffusion kurtosis imaging (DKI) and diffusion tensor imaging (DTI) in HD.
Methods:
22 mutant huntingtin (mHTT) carriers and 14 controls were enrolled. Clinical assessments and dMRI were conducted. Based on CAG-Age Product (CAP) score, mHTT carriers were categorized into high CAP (hCAP) and medium and low CAP (m& lCAP) groups. Spearman analyses were used to explore correlations between imaging parameters in brain regions and clinical assessments. Receiver operating characteristic (ROC) was used to distinguish mHTT carriers from control, and define the HD patients at advanced stage.
Results:
Compared to controls, mHTT carriers exhibited WM changes in DKI and DTI. There were 22 more regions showing significant differences in HD detected by MK than FA. Only MK in five brain regions showed significantly difference between any two group, and negatively correlated with the disease burden (r = –0.80 to –0.71). ROC analysis revealed that MK was more sensitive and FA was more specific, while Youden index showed that the integration of FA and MK gave rise to higher authenticities, in distinguishing m& lCAP from controls (Youden Index = 0.786), and discerning different phase of HD (Youden Index = 0.804).
Conclusions:
Microstructural changes in WM occur at early stage of HD and deteriorate over the disease progression. Integrating DKI and DTI would provide the best accuracies for differentiating early HD from control and identifying advanced HD.
INTRODUCTION
Huntington’s disease (HD) is an autosomal dominant inherited neurodegenerative disorder caused by mutation in huntingtin gene (HTT). This mutation arises from an abnormal expansion of cytosine adenine guanine (CAG) trinucleotide repeats in exon 1 of HTT gene, situated in chromosome 4p16.3 region [1]. Age at HD motor onset inversely correlates with the length of CAG expansion, with full penetrance observed at 40 or more repeats and incomplete penetrance between 36 and 39 repeats. Clinical diagnosis typically relies on identifying characteristic motor signs, supported by a positive family history and/or confirmed through DNA analysis [2].
To estimate the progression of HD pathology as a function of CAG repeats and time of exposure to the effects of the repeats, Penney et al. in 1997 proposed CAG-Age Product (CAP) scores [3]. CAP has been examined in various studies, including TRACK-HD and PREDICT-HD [4], as it serves as a representative marker for the disease burden. The CAP formula, used in this paper, was proposed by Zhang et al. and categorizes individuals into three groups: Low, Medium, and High, with the group thresholds set at CAP < 290 (Low), 290≤CAP≤368 (Medium), and CAP > 368 (High) [4]. HD can be divided into Pre-manifest HD (PreHD) and manifest HD (mHD) depending on whether the patient has characteristic motor symptoms. Symptoms can manifest in diverse ways at early stage of the disease, with signs potentially escaping detection during a standard neurological examination, thus requiring an experienced clinician’s expertise. These challenges in pinpointing the exact onset of HD’s motor symptoms, coupled with the fact that pathological changes and other symptoms (e.g., cognitive impairment and behavioral changes) may commence years before clinical diagnosis [5, 6], underscore the need for developing biomarkers with capability to accurately portray the pathological changes, predict the disease stages, as well as measure the disease progression in individuals carrying the abnormal gene. Neuropathological changes in HD are notably selective, characterized by significant cell loss and brain atrophy, particularly in the caudate and putamen [7, 8]. Multimodal magnetic resonance imaging (MRI) offers a non-invasive means to observe the pathological alterations in HD [9, 10]. While neuroimaging research has predominantly focused on grey matter volume loss, particularly in grey matter and subcortical structures, it is now evident that both white matter volume loss [11–13] and modified white matter diffusion metrics [14–19] are affected in both PreHD and mHD. Diffusion magnetic resonance imaging (dMRI) is a technique used to characterize the diffusion of water molecules within tissue, including diffusion tensor imaging (DTI), diffusion kurtosis imaging (DKI), bi-tensor DTI, and neurite orientation dispersion and density imaging (NODDI) [20]. Fractional anisotropy (FA) is a parameter of DTI, which reflects the degree of anisotropy of the dispersion of water molecules. A recent meta-analysis study showed that both PreHD and mHD patients demonstrated significant decreased FA values in the corpus callosum enriched with white matter when compared with that in controls [21].
DKI stands out as a highly promising diffusion imaging technique [22, 23], extending its reach to quantify non-Gaussian water diffusion. Recent research has showcased the superior sensitivity of DKI measures in detecting developmental and pathological microstructural changes in neuronal tissues compared to conventional DTI [24, 25]. The mean kurtosis (MK) value is the major parameter in DKI, reflecting the average dispersion kurtosis of water molecules in all directions, with lower MK values indicating reduced microstructural complexity within the region of interest. Studies applying DKI technique in other neurodegenerative diseases, such as mild cognitive impairment (MCI), Alzheimer’s disease (AD) [26–29], and Parkinson’s disease (PD) [30, 31] have showed that microstructural changes in cerebral white matter and suggested neuronal loss in correspondent cortical regions. However, there is no study using DKI technique in patients with HD and only two animal-based studies showing significant microstructural changes in HD models [32, 33]. Both studies indicate that DKI is a sensitive method for detecting HD-associated white matter abnormalities [32, 33]. Compared to NODDI, DKI can capture information about non-Gaussian diffusion of tissues, which give rise to better sensitivity to detect more complex tissue microstructural changes in neurodegenerative diseases [20].
In this study, we aim to use DKI technology to study the microstructural changes of white matter fiber bundles in HD patients, compare DKI and DTI in detecting the microstructural changes of white matter in HD, and further explore the correlations between DKI imaging parameters and various clinical manifestations.
MATERIALS AND METHODS
Subjects
Twenty-six subjects with more than 35 CAG repeats were enrolled from the Huntington Disease Center at Beijing Tiantan Hospital, Capital Medical University, Between May 8, 2019 and February 8, 2023. They underwent multimodal MRI scans. In addition, we recruited 16 age- and sex-matched healthy controls during the same period. Ethical approval for this study was obtained from the ethics committee of the hospital. The inclusion and exclusion criteria are outlined below:
Inclusion criteria for mutation HTT (mHTT) gene carrier group: 1) Age≥18 years; 2) Confirmed presence of more than 35 CAG repeats in exon 1 of HTT through PCR, southern blot hybridization, or triple repeat primer PCR [34]; 3) Physically capable of completing the MRI examination; 4) Signed informed consent to participate in this research.
Inclusion criteria for control group: 1) Age≥18 years; 2) without genetic or clinical evidence for the presence of a neurological disorder; 3) signed the informed consent; 4) sex- and age-matched with mHTT carriers.
Exclusion criteria: 1) History of severe stroke, brain trauma, epilepsy, or mental illness; 2) History of brain tumor and space occupation; 3) History of other central nervous system degenerative diseases; 4) Patients with other diseases who can’t complete the magnetic resonance examination; 5) Refusal to sign informed consent.
All study procedures were conducted according to the declaration of Helsinki. All participants provided written informed consent approved by the Ethics Board of the Beijing Tiantan Hospital, Capital Medical University of China.
Clinical assessments
Detail medical history data from all participants were recorded, including basic information, height, weight, body mass index (BMI), educational background, onset time, family history, duration of motor, cognitive, and psychiatric symptoms, and the number of CAG repeats in the HTT gene. We calculated the CAG-Age Product (CAP) score for each mHTT carrier. The CAP score was derived using the standardized formula CAP = Age * (CAG repeat length –33.66), as proposed in 2011 [4]. Here, CAG represents the length of CAG repeats in mHTT, Age is the patient’s age at enrollment. The CAP score reflects the disease burden of mHTT carriers. It could be divided into three groups: low (CAP < 290), medium (290≤CAP≤368), and high (>368) [35]. To decrease the group variability, we categorized mHTT carriers into two groups: high CAP group (hCAP), composing of 14 participants (2PreHD and 12 mHD), and medium & low CAP group (m& lCAP) with 8 participants (1mHD and 7 PreHD).
We also conducted the Unified Huntington’s Disease Rating Scale (UHDRS) [36] assessments for all enrolled subjects, including Total Motor Score (TMS), Total Functional Capacity (TFC) [36], Functional Checklist Score (FCS), and independence scale. Depression was assessed using Beck Depression Inventory II (BDI-II) [37]. Cognitive changes were assessed by the Stroop Interference Test (STIT), Symbol Digit Modality Test (SDMT), Category Fluency Test of animals (CFT), and Mini-Mental State Examination (MMSE) [38]. Our clinician team had the above clinical rating scales training and certificated by Enroll HD program (https://enroll-hd.org/). Clinical assessments of participants in this study were undertaken independently by two clinicians, and consolidated by a third party (YH) in case of disparities. Demographic information and clinical assessments were also collected for all control participants in this study.
Imaging data acquisition
We conducted MRI scans on a Siemens Prisma 3T MRI scanner equipped with a 64-channel head coil. During the scanning process, participants remained awake with their eyes closed and heads immobilized, ensuring minimal motion. According to previous study [20], three b values of 0, 1000 and 2000 s/mm2 were usually selected for collection in DKI. In this study, b values of 0, 1000 and 2000 s/mm2 were adopted. Scanning parameters for each sequence were as follows:
High resolution T1 scanning parameters: Voxel size: 0.9×0.9×1.0 mm; Field of View (FoV) read: 240 mm; FoV phase: 100%; Repetition time (TR): 1560 ms; Echo time (TE): 1.69 ms; Slice resolution: 100%; Flip angle: 8 deg; Sagittal slices: 176; Acquisition Time (TA): 3 min 37 s.
DKI was acquired with 129 gradient directions and b values of 0 s/mm2, 1000, s/mm2, and 2000 s/mm2. Voxel size: 2.5 * 2.5 mm; FoV read: 220 mm; FoV phase: 100%; TR: 2900 ms; TE: 64 ms, TA: 6 min 40 s. Then, 65 gradient directions of b values of 0 and 1000 s/mm2 are extracted for DTI analysis.
Image data processing and quality control
Every MRI scan underwent visual review to exclude subjects with intracranial masses or other abnormalities. Scans with missing sequences or motion artifacts during DKI and DTI were excluded from analysis. We employed FMRIB’s Software Library (FSL) [39] for DKI and DTI measurements, involving brain extraction (BET) and correction for motion and eddy current-induced distortions through affine registration to a reference b = 0 volume. FMRIB’s Diffusion Toolbox (FDT) was used to calculate MK value and FA value for each subject. The process of obtaining an individualized tensor map, ie. the spatial information of the diffusion image of each subject, consisted of structural images registration and alignment to the Montreal Neurological Institute (MNI) standard space. Firstly, the image of the individual diffusion space is registered to the image of the individual structure space to obtain the transformation matrix “FAtoT1.mat”. Secondly, the methods linear and nonlinear were used to register the image of the individual structure space to the MNI standard space to obtain the deformation field “T1toMNI_cwarp.nii.gz”. Thirdly, the deformation field “T1toMNI_cwarp.nii.gz” was transformed into the deformation field “MNItoT1_cwarp.nii.gz” from the MNI standard space to the individual Structure space used “invwarp” command. Fourthly, the deformation field “MNItoT1_cwarp” and the transformation matrix “T1toFA.mat” are combined by command “convertwarp” to obtain the deformation field “MNItoFA_cwarp.nii.gz” from the MNI standard space to the individual Diffusion space. Finally, the Johns Hopkins University (JHU) ICBM-DTI-81 white matter map of MNI space, which contains 48 regions, registered to the individual diffusion space according to the deformation field of “MNItoFA_cwarp.nii.gz”, and “JHU_diff.nii.gz” was obtained. We used the JHU white matter map in the MNI space to identify individual diffusion space regions of interest (ROI). This allowed us to calculate FA and MK values for these 48 brain regions.
Statistics and analysis
Data following a normal distribution were presented as mean±standard deviation, while data not adhering to a normal distribution were expressed as median±interquartile range. The Shapiro-Wilk test was used to test the normality of the data. For normally distributed data, we employed T-tests and one-way ANOVA to compare differences between groups. ANCOVA was used to eliminate the differences in age and gender among different groups. Non-parametric tests were used for data that did not exhibit a normal distribution. Bonferroni post hoc tests were conducted following ANOVA, as it could be applied to almost any situation with multiple comparisons. Corrected p < 0.05 was considered significant. A chi-square (χ2) test was used to compare gender composition differences between the mHTT and control groups. Correlation analysis between changes in white matter microstructure, and disease burden or clinical manifestations was performed using Spearman analysis. To assess differences in FA and MK values in different brain regions for distinguishing the m& lCAP group from the control group and the m& lCAP group from the hCAP group, we utilized receiver operating characteristic (ROC) analysis and further verified with Youden index, which is Sensitivity + Specificity-1. All analyses, including normality tests, were carried out using SPSS 26.0 and MATLAB, and False Discovery Rate (FDR) correction was used for multiple tests of p values obtained from the same variables. Statistical images were created using GraphPad Prism 9 and SPSS 26.0.
RESULTS
Participant characteristics and clinical assessments
Following image processing and quality control, finally this research included 22 participants in the mHTT group, with 9 classified as PreHD and 13 as mHD, along with 14 healthy control (HC) subjects (Supplementary Figure 1). The CAP score of the mHD group was significantly higher than that of the PreHD group (589.45±154.89 vs. 333.25±116.68, p < 0.001), despite the absence of significant differences in the number of abnormal HTT CAG repeats between the PreHD and mHD groups (44.33±3.32 vs. 46.31±4.11, p > 0.05). In order to decrease variability in the whole group, we categorized mHTT carriers into two groups: a high CAP group (hCAP, CAP score > 368) consisting of 14 participants, 2 PreHD and 12 mHD, and a medium and low CAP group (m& lCAP, CAP score≤368) with 8 participants, including 1 mHD and 7 PreHD, in following analysis.
Demographic and clinical assessment details for the mHTT group (m& lCAP & hCAP) and controls are presented in Table 1. There were no statistically significant differences in terms of sex, and educational background between the mHTT group and the control group (Table 1). The mean enrolment age of m&lCAP group significantly differed from those in HC or hCAP.
Table 1
Comparison of clinical assessments and demographic information between three groups
| Controls | m&lCAP | hCAP | p | p1 | p2 | p3 | |
| Gender (Male/Female) | 14 (5/9) | 8 (2/6) | 14 (6/8) | 0.703 | NA | NA | NA |
| Age at enrollment (mean±SD) | 46.57±10.99 | 32.75±10.36 | 47.07±10.66 | 0.009 | 0.019 | 1.000 | 0.015 |
| Educational background | 14.00±3.80 | 15.22±3.153 | 12.08±3.3 | 0.874 | NA | NA | NA |
| BMI | 23.10 (6.45) | 22.30 (4.65) | 21.55 (2.97) | 0.121 | NA | NA | NA |
| STIT | 37.86±6.56 | 36.57±15.37* | 21.14±11.17 | 0.0004 | 1.000 | 0.0006 | 0.011 |
| SDMT | 47.07±12.86 | 47.14±18.51* | 24.77±11.66* | 0.0003 | 1.000 | 0.0005 | 0.005 |
| CFT | 20.50±2.30 | 17.43±8.02* | 10.54±5.52* | 0.0001 | 0.677 | 0.0001 | 0.030 |
| BDI-II | 7.50 (5.00) | 2.00 (16.00)* | 8.00 (9.00) | 0.362 | NA | NA | NA |
| MMSE | 30.00 (1.00) | 28.00 (7.00)* | 27.00 (7.00) | 0.010 | 0.292 | 0.001 | 0.446 |
| CAP | NA | 286.26±52.22 | 598.00±133.60 | NA | NA | NA | 0.00004 |
| TFC | NA | 12.38±1.56 | 9.14±3.28 | NA | NA | NA | 0.005 |
SD, standard deviation; BMI, body mass index; STIT, Stroop Interference Test; SDMT, Symbol Dicit Modality Test; CFT, Category Fluency Test of animals; BDI-II, Beck Depression Inventory II; MMSE, Mini-Mental State Examination; CAP, CAG age product; TFC, total functional capacity; N/A, not applicable; *Cases with missing values were excluded. p, p values for ANCOVA analysis, p1, p values for post hoc between HC and m& lCAP groups, p2, p values for post hoc between HC and hCAP groups, p3, p values for post hoc between m& lCAP and hCAP groups.
Cognitive function evaluations, encompassing STIT, SDMT, and CFT, revealed that the cognitive function of the hCAP group was notably inferior to those of HC and m&lCAP groups (Table 1). MMSE was significantly different only between hCAP and HC groups. However, BDI-II scores did not show a significant difference between any two groups, only showed an upward trend among the three groups.
DKI and DTI analyses
According to the JCH ICBM-DTI-81 white matter atlas, which provides a comprehensive division of human white matter into 48 distinct fiber tracts, we extracted MK values from all 48 regions for all 36 subjects and examined differences in each region among the three groups. To eliminate potential confounding factors such as age and sex on white matter structure, we conducted covariance analysis.
Following ANCOVA analysis, we identified 42 regions with significant differences in MK values among the three groups (Fig. 1, Table 2, and Supplementary Table 1). Specifically, after post-hoc MK values in five regions exhibited significant differences between any two groups, encompassing the genu of the corpus callosum, the body of the corpus callosum, the right superior corona radiate, the right posterior corona radiate, and the left superior longitudinal fasciculus, where MK values were the biggest in HC, followed by m& lCAP, and then hCAP group. On the other hand, we identified 20 out of 48 regions outlined in the ICBM-DTI-81 atlas with significant FA values differences among the three groups (Fig. 1, Table 2, and Supplementary Table 2). However, we did not identify any region within the ICBM-DTI-81 atlas that displayed significant differences between any two of the three groups in DTI analysis.
Fig. 1
Brain regions with different MK or FA values among groups. Dispersion space imaging shows brain regions with different diffusion values among three groups (areas highlighted in green). Regions with differences in MK values among groups (A), and regions with differences in FA values among groups (B). The MNI coordination of the picture is X46; Y41; Z36.
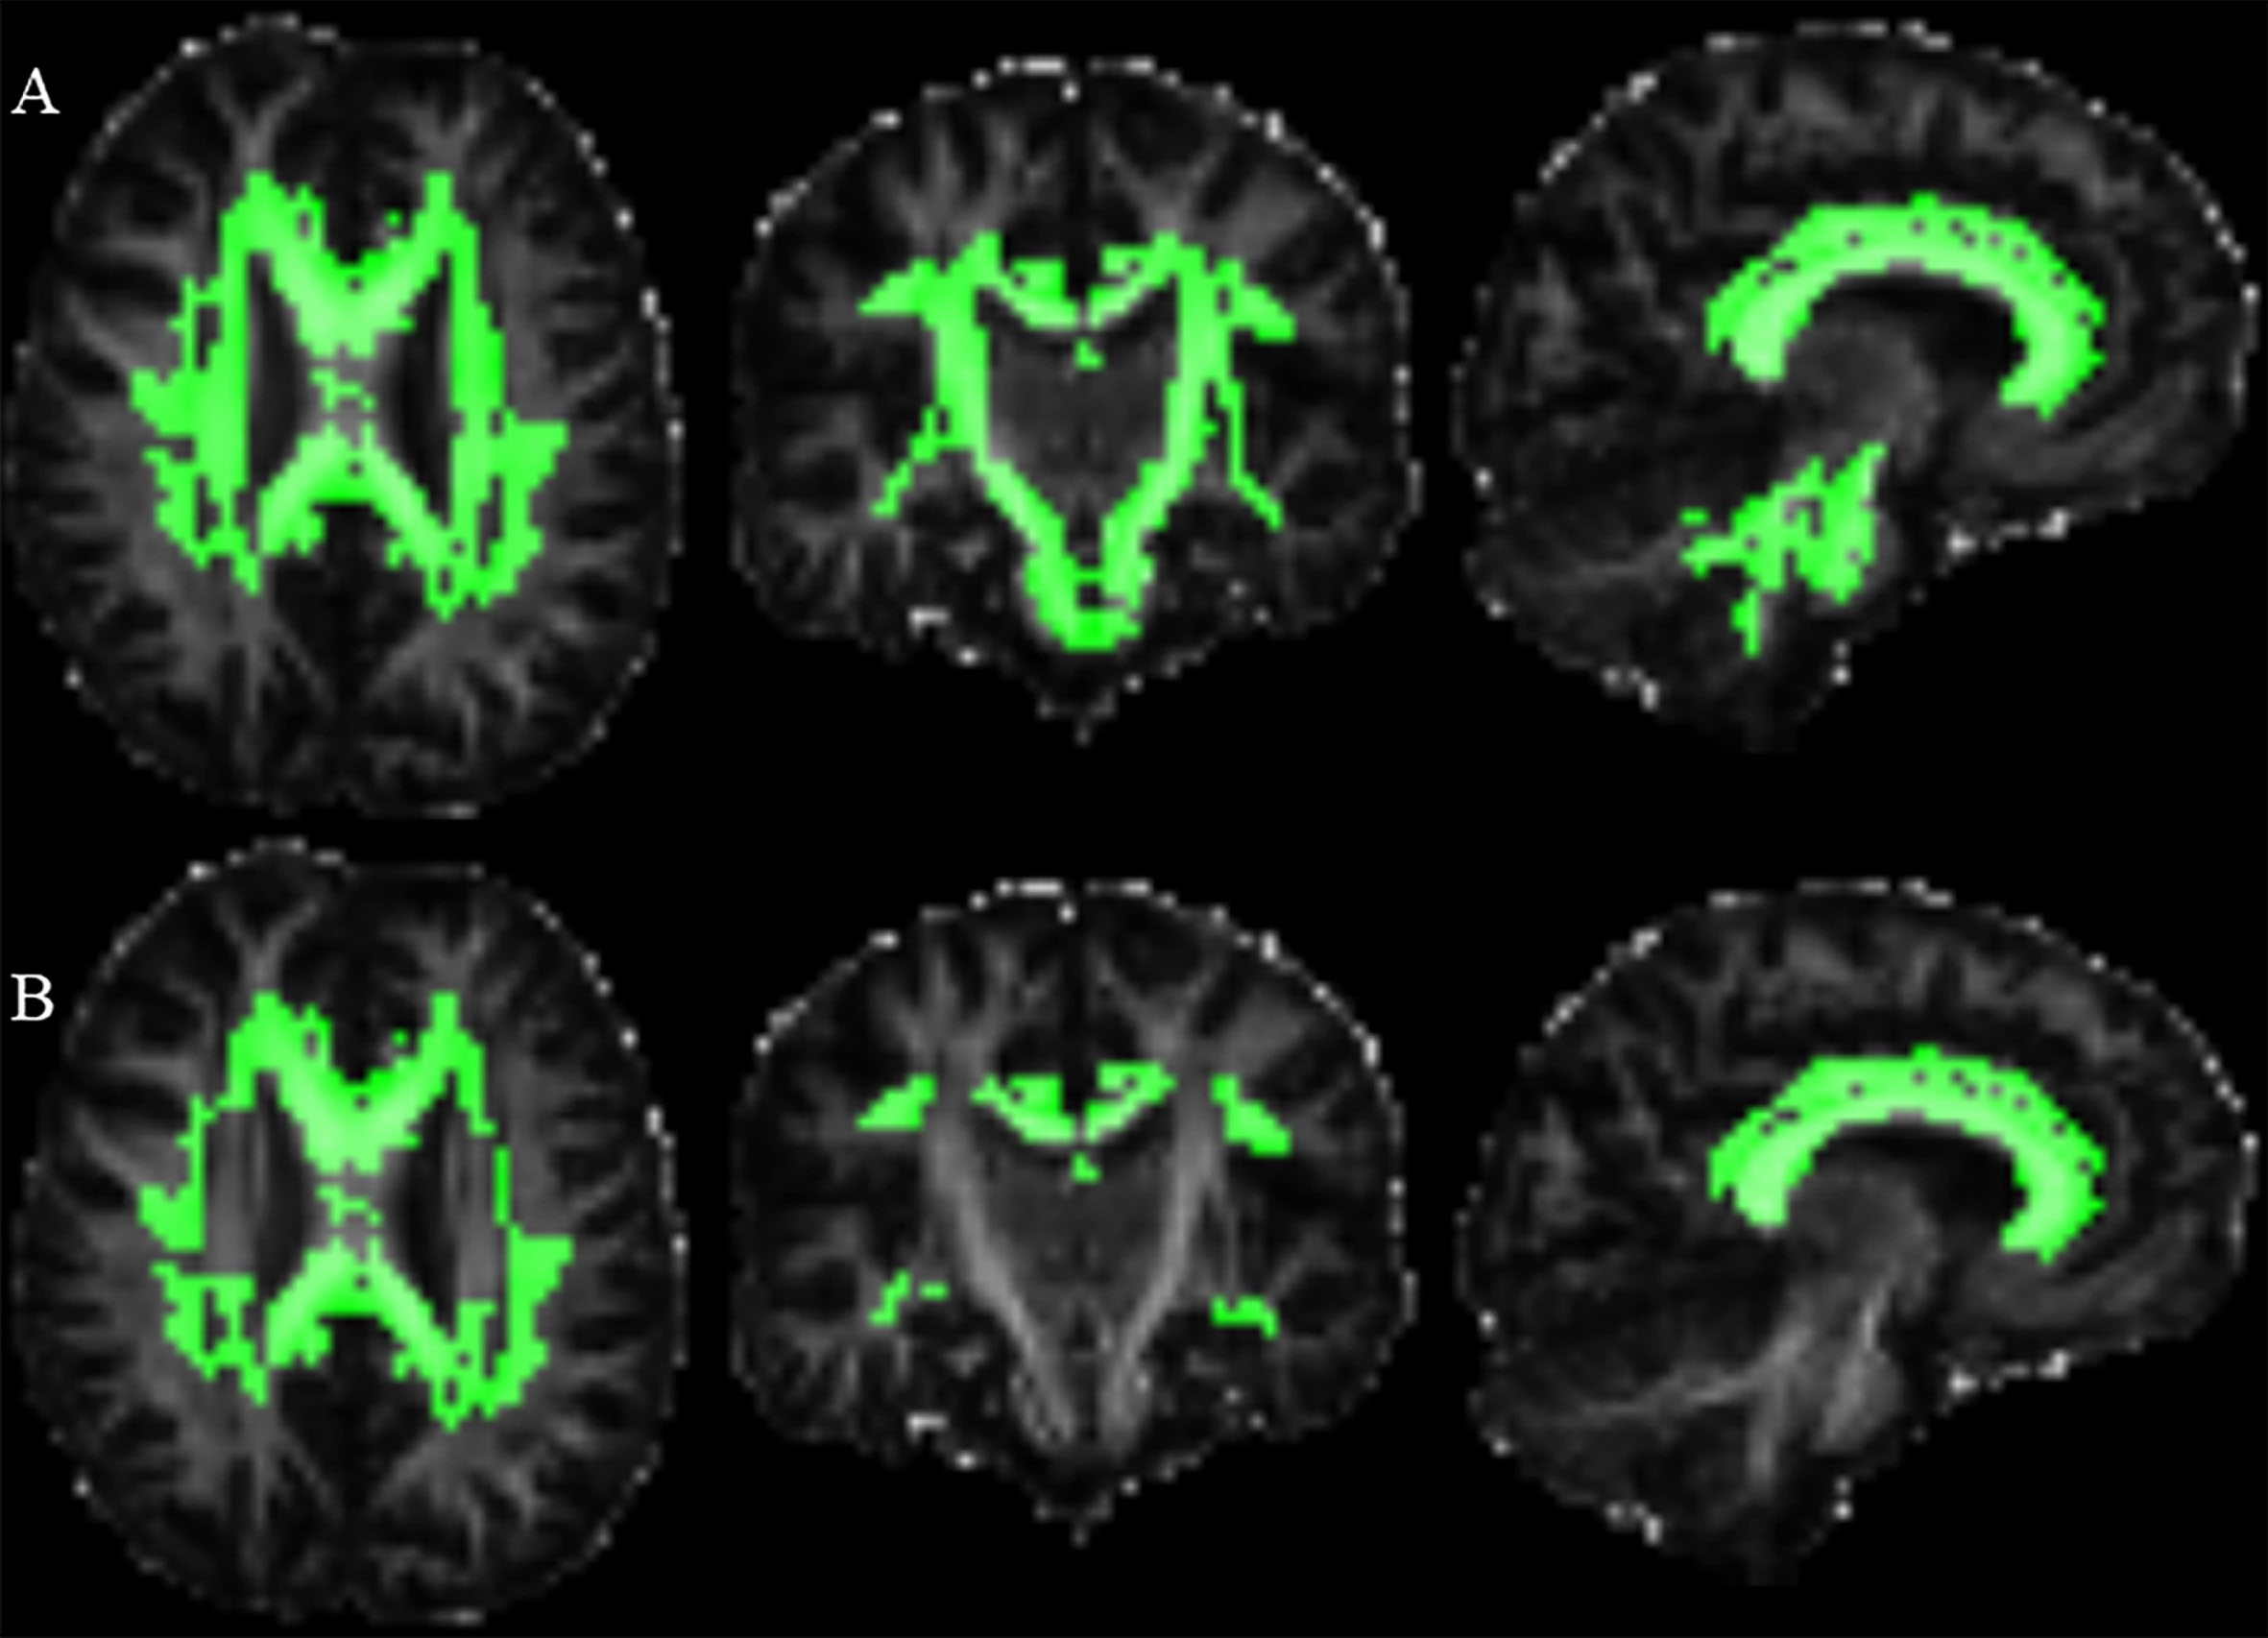
Table 2
The number of brain regions with different MK or FA values in multiple comparisons of three groups
| No. of brain regions with different MK values (Total 48) | No. of brain regions with different FA values (Total 48) | |
| Among three groups | 42 | 20 |
| Between any two groups | 5 | 0 |
| HC vs. (m&lCAP + hCAP) | 17 | 11 |
| (HC + m&lCAP) vs. hCAP | 3 | 1 |
| HC vs. hCAP | 17 | 8 |
No., number; HC, healthy control; m& lCAP, medium and low CAP group; hCAP, high CAP group.
Correlation analysis of key white matter regions with clinical presentations
We identified key brain regions for correlation analysis based on significant differences in diffusion parameters observed among the three groups in the dMRI analysis. These parameters specifically encompassed MK values from the genu of the corpus callosum, the body of the corpus callosum, the right superior corona radiate, the right posterior corona radiate, and the left superior longitudinal fasciculus. We conducted correlation analyses with CAP, TMS, TFC, STIT, SDMT, and BDI-II (Fig. 2). Higher CAP and TMS scores indicate more severe disease burden and motor symptoms. Lower TFC, STIT, SDMT, and CFT indicate more severe functional impairment and cognitive impairment. Higher BDI-II scores reflect more pronounced depression.
Fig. 2
The heat map of correlation analysis between diffusion parameters with clinical assessments. X-axis is CAP scores and clinical assessment scores. Y-axis is MK values in five key brain regions. The starts refer to correlation analysis with P values less than 0.05 after FDR correction. Red represents a positive correlation, and blue represents a negative correlation. MK, mean kurtosis; GCC, genu of corpus callosum; BCC, body of corpus callosum; SCRR, superior corona radiata R; PCRR, posterior corona radiata R; SLFR, superior longitudinal fasciculus L; TMS, Total Motor Assessment; TFC, Total Functional Capacity; STIT, Stroop Interference Test; SDMT, Symbol Dicit Modality Test; BDI-II, Beck Depression Inventory II.
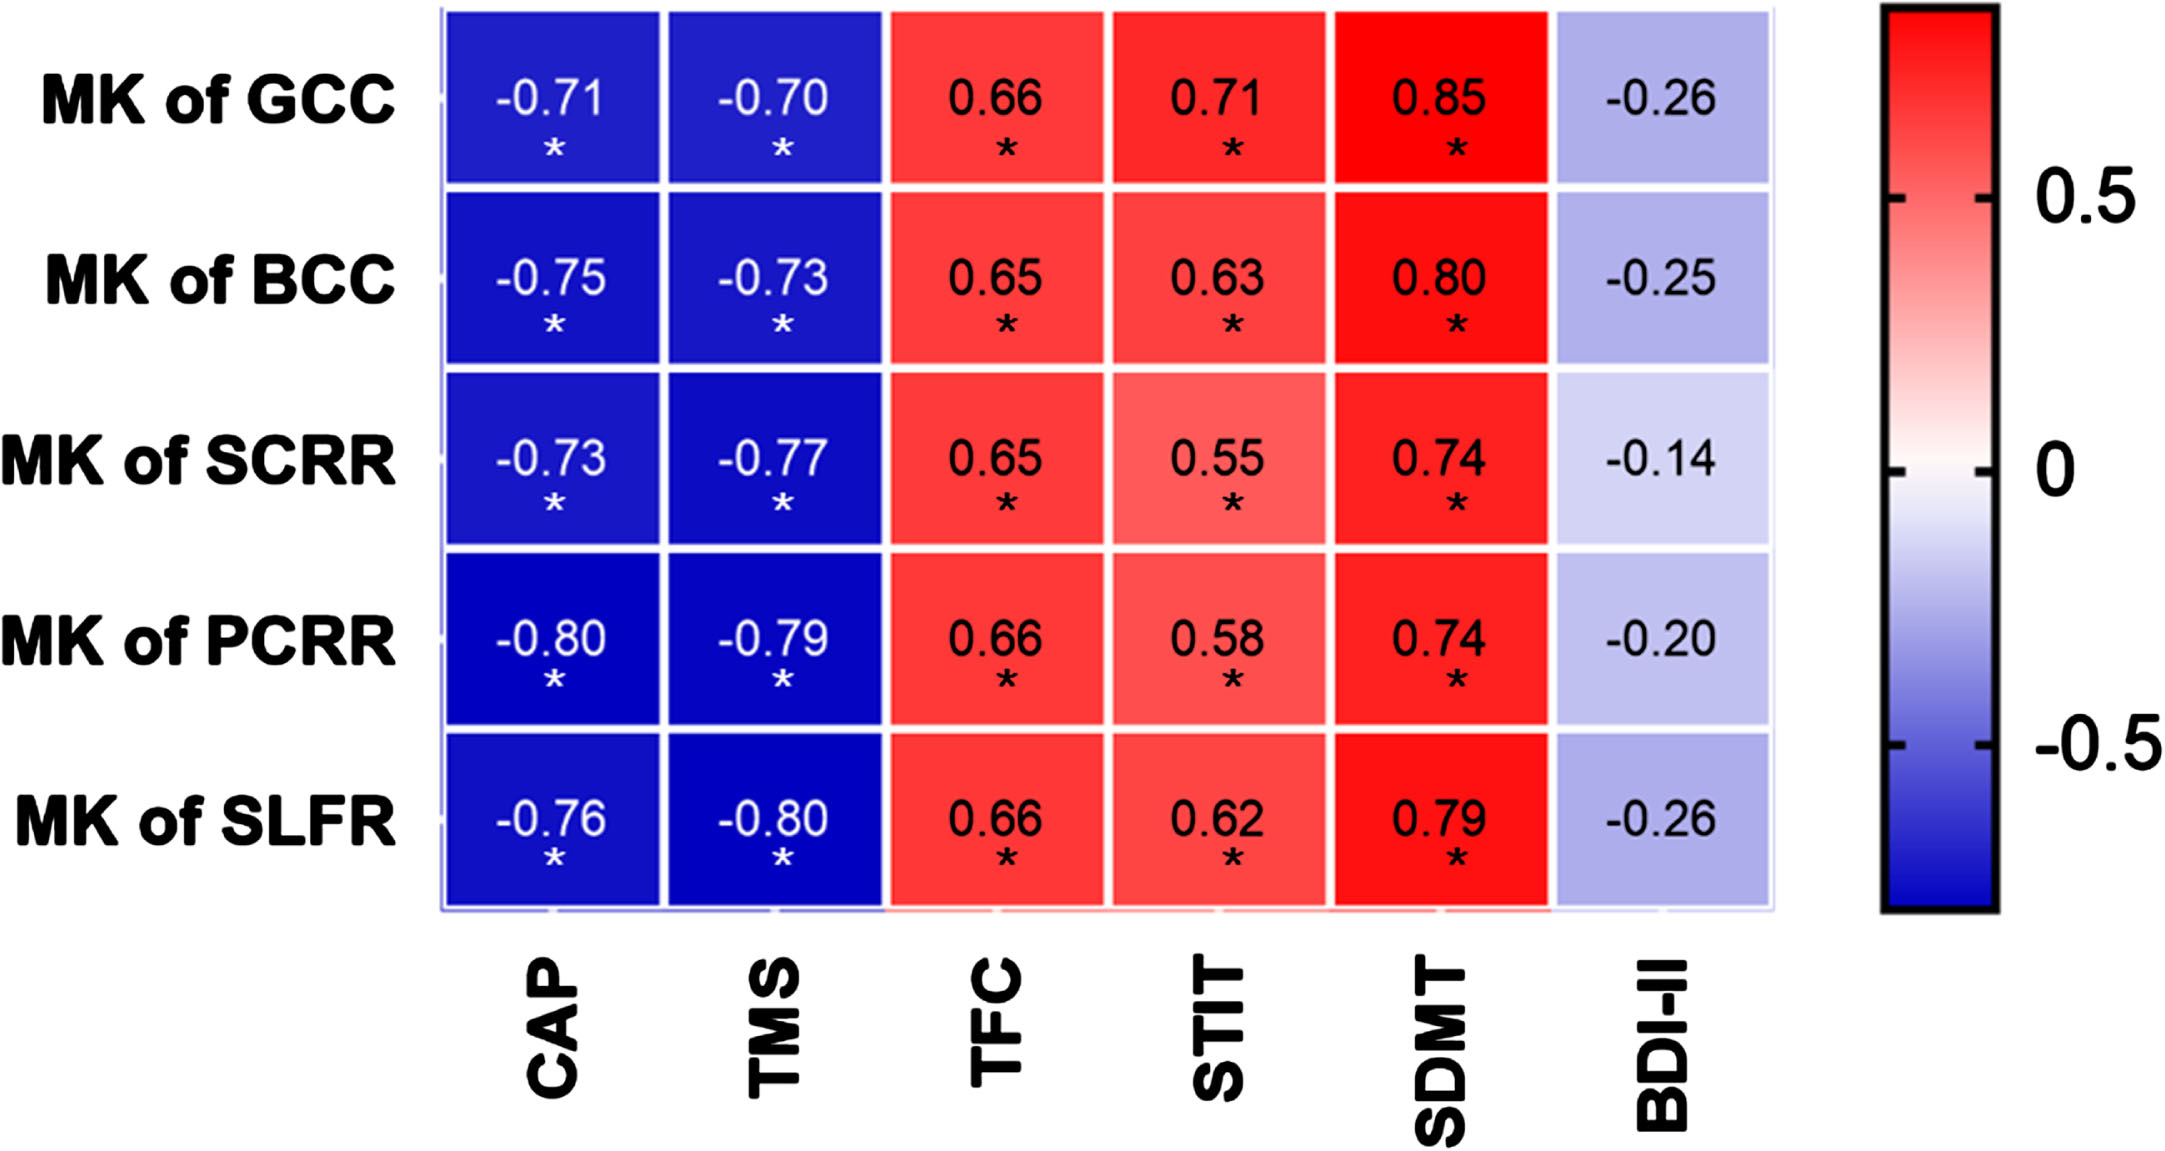
Notably, the MK values of the genu of the corpus callosum exhibited negative correlations with CAP and TMS, while displaying positive correlations with TFC, STIT, and SDMT, all of which held true even after applying the FDR correction (Fig. 2). Similarly, MK values for the body of the corpus callosum demonstrated negative correlations with CAP and TMS, and positive correlations with TFC, STIT, and SDMT after FDR correction (Fig. 2). Moving on to the right superior corona radiate, MK values displayed negative correlations with CAP and TMS, as well as positive correlations with TFC, STIT, and SDMT, again even after FDR correction (Fig. 2). Similarly, MK values of the right posterior corona radiate exhibited negative correlations with CAP and TMS, and positive correlations with TFC, STIT, and SDMT after FDR correction (Fig. 2). Finally, the MK values for the left superior longitudinal fasciculus revealed negative correlations with CAP and TMS, along with positive correlations with TFC, STIT, and SDMT, all of which remained significant even after FDR correction (Fig. 2). No significant correlation was found between MK values in the above five regions and BDI-II scores
ROC and Youden Index analyses
To test whether microstructural changes in white matter can be used as an indicator to distinguish m& lCAP from HC patients and distinguish different stages of mHTT carriers, we conduct the ROC analysis.
Brain regions with significant different FA or MK values between HC and m& lCAP were selected for ROC analysis to differentiate m& lCAP groups from controls. When using the MK values of splenium of corpus callosum, the maximum AUC of 0.848 was reached to distinguish participants with hCAP from m& lCAP, and the Youden index was 0.661 (Table 3, Supplementary Figure 2). When using the FA values of right posterior thalamic radiation, the maximum AUC of 0.920 was achieved to distinguish m& lCAP from HC, and the Youden index was 0.714 (Table 2, Supplementary Figure 2).
Table 3
ROC and Youden Index analyses using MK and FA values
| Comparison | Values | Sensitivity | 1-Specificity | AUC | Youden Index | cutoff value |
| HC vs. m&lCAP | MK of splenium of corpus callosum | 0.786 | 0.125 | 0.848 | 0.661 | 1.09024 |
| HC vs. m&lCAP | FA of right posterior thalamic radiation | 0.714 | 0.000 | 0.920 | 0.714 | 0.52181 |
| HC vs. m&lCAP | MK of Splenium of corpus callosum combined with FA of Posterior thalamic radiation R | 1.000 | 0.214 | 0.911 | 0.786 | 0.25174 |
| hCAP vs. m&lCAP | MK of left superior longitudinal fasciculus | 0.875 | 0.143 | 0.911 | 0.732 | 1.05361 |
| hCAP vs. m&lCAP | FA of left tapetum | 0.625 | 0.000 | 0.830 | 0.625 | 0.43369 |
| hCAP vs. m&lCAP | MK of left superior longitudinal fasciculus combined with FA of left tapetum | 0.929 | 0.125 | 0.902 | 0.804 | 0.47341 |
HC, healthy controls; m& lCAP, medium and low CAP; hCAP, high CAP; AUC, area under curve.
Brain regions with significant different FA or MK values between m& lCAP and hCAP were selected for ROC analysis to differentiate different stages of HD. When using the MK values of left superior longitudinal fasciculus, the maximum AUC of 0.911 was reached to distinguish participants with hCAP from m& lCAP, and the Youden index was 0.732 (Table 3, Supplementary Figure 2). When using the FA values of the left tapetum, the maximum AUC of 0.830 was reached to distinguish participants with hCAP from m& lCAP, and the Youden index was 0.625 (Table 3, Supplementary Figure 2).
Furthermore, we combined the FA and MK values with the best identification power to obtain an optimal differentiation effect. The MK of Splenium of corpus callosum combining with the FA of Posterior thalamic radiation R was able to distinguish m& lCAP group from HC group with AUC 0.911 and Youden index 0.786 (Table 2, Supplementary Figure 2). While combining the MK values of the left superior longitudinal fasciculus and the FA values of left tapetum would be able to distinguish hCAP group from m& lCAP group with AUC 0.902 and Youden index 0.804 (Table 2, Supplementary Figure 2).
DISCUSSION
This is the first study using DKI technique to detect microstructural changes of white matter in patients with HD. Furthermore, we explored differences in diffusion parameters among individuals with varying HD disease burdens in combination of DKI and DTI techniques. Utilizing ROI-based analysis, we identified notable white matter fibers alterations in five brain regions with the most significant changes using DKI. MK values in these regions demonstrated negative and gradient correlations with the disease severity and disease burden of HD. Importantly, apart from underscoring the superior sensitivity of DKI in detecting white matter microstructural changes compared to DTI, our findings also suggested combining FA with MK values would generate the best accuracy of identifying mHTT carriers or patients with advanced HD by ROC and Youden index analyses.
MK values in 42 regions were found to have significant differences among the three groups, and FA values in 20 regions were found to have significant differences among the three groups. Furthermore, MK values in five regions exhibited significant differences between any two groups. We did not identify any brain region that showed significant differences in FA values between any two of these three groups. Although FA values could reflect white matter microstructural changes in patients with advanced HD, it shows limited capacity to detect microstructural changes in white matter at low to moderate disease stages. These findings strongly suggest that MK values exhibit superior sensitivity in detecting white matter microstructural changes among individuals with varying degrees of HD disease burden.
The imaging characteristics of DKI can quantify non-Gaussian diffusion of water molecules in the tissue [40]. Due to the presence of various membrane structures in tissues, the distribution of water molecules in the brain tissues does not always follow a Gaussian distribution, so it has higher sensitivity for the microstructure changes of fiber bundles with more complex directions [41]. DKI is more sensitive to detect early changes in white matter microstructure in HD, similar to other neurodegenerative diseases [28, 31, 42]. MK represents the mean value of diffusion kurtosis in all gradient directions under multiple b values, and is an index to evaluate the microstructure complexity of tissue in the region of interest. A decrease in MK values implies disruption of white matter microstructural integrity [25].
White matter damage in HD was thought secondary to the loss of grey matter in the form of Wallerian degeneration [43]. However, other study suggested white matte aberrations are a feature of HD independent of neuronal loss [44]. In an animal study, BACHD mice exhibited thinner myelin and decreased myelin compaction as early as 1 month old, suggesting that myelin abnormalities in HD are an early pathological event [45]. The above studies indicated that white matter changes in HD may attribute to impaired myelination due to mHTT deposition in oligodendrocytes and axonal damage secondary to neuronal loss.
Previous DTI analysis has unveiled abnormalities in neuronal fiber orientation and integrity within white matter and subcortical gray matter structures in both PreHD [17, 46] and mHD [12, 15]. DTI studies have consistently revealed alterations in FA values in patients with PreHD and early mHD, with the most prominent finding being decreased FA in the corpus callosum [12, 21, 47, 48]. In our study, we also found the MK and FA of corpus callosum decreased in PreHD and mHD compared with HC. In particular, the MK values of Genu of corpus callosum and Body of corpus callosum were significantly different when comparing any two groups among the three groups. Our results align with previous studies showing a widespread reduction in axonal density observed in the white matter tracts, including the corpus callosum and the basal ganglia surroundings in HD using NOODI [49], and also in agreement with Roland et al. study showing the importance of the corpus callosum for the pathophysiological processes of HD [50]. Previous studies have selected several key regions of white matter for diffusion imaging studies in HD patients or mHTT carriers [21], and DKI diffusion parameters changes were only found in the external capsule in HD models compared to WT mice [32, 33]. While in our study, DKI was performed on the whole region of the JHU map, which provided a deeper understanding of the white matter microstructural changes in HD.
To explore the correlations between dMRI parameters and clinical characteristics, we analyzed the clinical features of our HD cohort (Table 1). Cognitive and psychological assessments showed significant differences between individuals in the hCAP group and other two groups. There was a noticeable trend toward cognitive decline between m& lCAP group and HC, as evidenced by the STIT, CFT and MMSE results (Table 1), consistent with previous studies showing cognitive decline and psychological abnormalities often appear during the early stage [51, 52]. In contrast to previous reports [53–55], we did not find significant differences in BMI among the three groups. These disparities could be attributed to the smaller number of subjects in the final analysis, with most subjects who completed MRI acquisitions being at an early stage of HD. Furthermore, we confirmed that the relationship of white matter microstructure changes associated with the overall disease burden, motor and cognitive functions, but not with the severity of depression, which was likely caused by biochemical or hormonal imbalance, rather than deficits in brain microstructural connectivity. The MK values of the above five regions were more significantly correlated with the disease burden (r=–0.80 to –0.71) compared to FA (r = –0.334 to –0.319) and NDI values (r = –0.405 to –0.373) reported in previous studies [49, 56]. These mean that the changes of MK values can better reflect the microstructural changes of white matter in HD.
CAP can serve as an indicator of disease burden and mHTT exposure in HD patients. TMS scores gauge motor symptoms and TFC can reflect the disease stage [57]. SDMT, a recognized vital marker for determining the disease stage of mHTT gene carriers, plays a pivotal role in cognitive evaluation [58]. Worth noting is that in a previous study form China, STIT demonstrated superior diagnostic efficacy for AD, MCI and normal elderly subjects when compared to Stroop word reading (SWR) and Stroop color naming (SCN), so we selected STIT as a tool for cognitive assessment [59]. Our findings underscored that significant white matter microstructural damage appeared in these regions in HD. The white matter damage, in turn, may have enhanced the disease burden, diminished overall function, exacerbated motor symptoms, and compromised cognitive capabilities.
The ROC analysis using both MK and FA values could distinguish the m& lCAP group from HC group, as well as the hCAP group from the m& lCAP group. The results revealed that the MK value of the left superior longitudinal fasciculus showing the maximum AUC for differentiating the hCAP group from m& lCAP group, while the FA value of the right posterior thalamic radiation showing the maximum AUC for distinguishing m& lCAP group from HC. The ROC analysis demonstrated higher sensitivity when MK values were employed compared to FA values. These findings confirmed the high sensitivity of the DKI technique in terms of white matter microstructural changes in HD patients, although the specificities are secondary to FA evaluation by DTI. Our results demonstrated that integrative application of DKI and DTI technology is of great value for accurate staging differentiation of HD. Previous studies only compared the AUC area obtained by DKI parameter and DTI parameter in ROC analysis of disease diagnose [31, 42, 60, 61], and most of them concluded that DKI parameter has a larger AUC area, but did not further clarify the Youden index with its optimal cutoff value.
Our study first integrates the sensitive MK values with the specific FA values to achieve the largest Youden index for actual clinical practice, which means greater accuracy than either FA or MK when distinguishing advanced or prodromal HD using cutoff values. Early diagnosis of neurodegenerative diseases is of great significance for early disease intervention. At present, there is still no consensus on the staging and classification of HD [62]. HD-ISS classification recently proposed that HD should be regarded as a continuous state of the disease, rather than simply divided into manifest stage and pre-manifest stage [58]. The use of various non-invasive methods to accurately determine the severity and stages of HD patients would be the key for early diagnosis of HD. Our study provided an ideal diagnostic method in the clinical practice, which is a convenient, non-invasive and efficient approach through combination of various advanced dMRI imaging.
Our cross-sectional exploratory study may have its limitations. Apart from small sample size, our utilization of the ROI-based analysis method, while valuable, may not surpass the precision of other techniques such as tract-based spatial statistics (TBSS) [63] or fixel-based analysis (FBA) [64] in calculating diffusion parameters to detect subtle variations within the white matter skeleton. More diffusion parameters such as mean diffusion rate, radial diffusion rate, axial diffusion rate, radial kurtosis, axial kurtosis, and kurtosis anisotropy could be applied in a large longitudinal HD cohort.
In summary, we identified more extensive white matter structural alterations in HD compared to HC using DKI than DTI analysis. In addition, the white matter alterations detected by DKI technique exacerbated along the disease course of HD. Our data indicated that MK values could be used as biomarkers for monitoring the disease progression and therapeutic outcomes, and ameliorating white matter microstructural damaging might slow down the progression of HD. Furthermore, we proposed multimodal integration of diffusion MRI for better staging determination of subjects carrying mHTT. Although DKI has a longer acquisition time than DTI, its ability to detect complex fibers and provide the diffusion parameters of DTI at the same time [41] supports the notion that DKI carries a higher value for the diagnosis and monitoring the progression of HD.
ACKNOWLEDGMENTS
We would like to thank Dr. Ling-Xiao Cao, Dr. Wen-Zheng Hu, Ms. Qing Yang, Dr. Gang Du for their efforts during patient recruitment. Particularly, we thank the HD patients and healthy controls for participating in this study.
FUNDING
This project is funded by Beijing E-town Cooperation & Development Foundation (YCXJ-JZ-2022-007, YH) and National Natural Science Foundation of China (NSFC, 82071417, YH).
CONFLICT OF INTEREST
The authors have no conflict of interest to report.
DATA AVAILABILITY
The data that support the findings of this study are available from the corresponding author upon reasonable request.
SUPPLEMENTARY MATERIAL
[1] The supplementary material is available in the electronic version of this article: https://dx.doi.org/10.3233/JHD-240018.
REFERENCES
[1] | Bates GP , Dorsey R , Gusella JF , Hayden MR , Kay C , Leavitt BR , et al. Huntington disease. Nat Rev Dis Primers. (2015) ;1: :15005. doi: 10.1038/nrd2015.5 |
[2] | Reilmann R , Leavitt BR , Ross CA . Diagnostic criteria for Huntington’s disease based on natural history. Mov Disord. (2014) ;29: (11):1335–41. doi: 10.1002/mds.26011 |
[3] | Penney JB Jr , Vonsattel JP , MacDonald ME , Gusella JF , Myers RH . CAG repeat number governs the development rate of pathology in Huntington’s disease. Ann Neurol. (1997) ;41: (5):689–92. doi: 10.1002/ana.410410521 |
[4] | Zhang Y , Long JD , Mills JA , Warner JH , Lu W , Paulsen JS . Indexing disease progression at study entry with individuals at-risk for Huntington disease. Am J Med Genet B Neuropsychiatr Genet. (2011) ;156b: (7):751–63. doi: 10.1002/ajmg.b.31232 |
[5] | Oosterloo M , de Greef BTA , Bijlsma EK , Durr A , Tabrizi SJ , Estevez-Fraga C , et al. Disease onset in Huntington’s disease: When is the conversion? Mov Disord Clin Pract. (2021) ;8: (3):352–60. doi: 10.1002/mdc3.13148 |
[6] | Biglan KM , Ross CA , Langbehn DR , Aylward EH , Stout JC , Queller S , et al. Motor abnormalities in premanifest persons with Huntington’s disease: The PREDICT-HD study. Mov Disord. (2009) ;24: (12):1763–72. doi: 10.1002/mds.22601 |
[7] | Vonsattel JP , Myers RH , Stevens TJ , Ferrante RJ , Bird ED , Richardson EP Jr. Neuropathological classification of Huntington’s disease. J Neuropathol Exp Neurol. (1985) ;44: (6):559–77. doi: 10.1097/00005072-198511000-00003 |
[8] | Vonsattel JP . Huntington disease models and human neuropathology: Similarities and differences. Acta Neuropathol. (2008) ;115: (1):55–69. doi: 10.1007/s00401-007-0306-6 |
[9] | Bohanna I , Georgiou-Karistianis N , Hannan AJ , Egan GF . Magnetic resonance imaging as an approach towards identifying neuropathological biomarkers for Huntington’s disease. Brain Res Rev. (2008) ;58: (1):209–25. doi: 10.1016/j.brainresrev.2008.04.001 |
[10] | Klöppel S , Henley SM , Hobbs NZ , Wolf RC , Kassubek J , Tabrizi SJ , et al. Magnetic resonance imaging of Huntington’s disease: Preparing for clinical trials. Neuroscience. (2009) ;164: (1):205–19. doi: 10.1016/j.neuroscience.2009.01.045 |
[11] | Paulsen JS , Magnotta VA , Mikos AE , Paulson HL , Penziner E , Andreasen NC , et al. Brain structure in preclinical Huntington’s disease. Biol Psychiatry. (2006) ;59: (1):57–63. doi: 10.1016/j.biopsych.2005.06.003 |
[12] | Rosas HD , Tuch DS , Hevelone ND , Zaleta AK , Vangel M , Hersch SM , et al. Diffusion tensor imaging in presymptomatic and early Huntington’s disease: Selective white matter pathology and its relationship to clinical measures. Mov Disord. (2006) ;21: (9):1317–25. doi: 10.1002/mds.20979 |
[13] | Tabrizi SJ , Langbehn DR , Leavitt BR , Roos RA , Durr A , Craufurd D , et al. Biological and clinical manifestations of Huntington’s disease in the longitudinal TRACK-HD study: Cross-sectional analysis of baseline data. Lancet Neurol. (2009) ;8: (9):791–801. doi: 10.1016/s1474-4422(09)70170-x |
[14] | Della Nave R , Ginestroni A , Tessa C , Giannelli M , Piacentini S , Filippi M , et al. Regional distribution and clinical correlates of white matter structural damage in Huntington disease: A tract-based spatial statistics study. AJNR Am J Neuroradiol. (2010) ;31: (9):1675–81. doi: 10.3174/ajnr.A2128 |
[15] | Douaud G , Behrens TE , Poupon C , Cointepas Y , Jbabdi S , Gaura V , et al. In vivo evidence for the selective subcortical degeneration in Huntington’s disease. Neuroimage. (2009) ;46: (4):958–66. doi: 10.1016/j.neuroimage.2009.03.044 |
[16] | Dumas EM , van den Bogaard SJ , Ruber ME , Reilman RR , Stout JC , Craufurd D , et al. Early changes in white matter pathways of the sensorimotor cortex in premanifest Huntington’s disease. Hum Brain Mapp. (2012) ;33: (1):203–12. doi: 10.1002/hbm.21205 |
[17] | Klöppel S , Draganski B , Golding CV , Chu C , Nagy Z , Cook PA , et al. White matter connections reflect changes in voluntary-guided saccades in pre-symptomatic Huntington’s disease. Brain. (2008) ;131: (Pt 1):196–204. doi: 10.1093/brain/awm275 |
[18] | Magnotta VA , Kim J , Koscik T , Beglinger LJ , Espinso D , Langbehn D , et al. Diffusion tensor imaging in preclinical Huntington’s disease. Brain Imaging Behav. (2009) ;3: (1):77–84. doi: 10.1007/s11682-008-9051-2 |
[19] | Müller HP , Glauche V , Novak MJ , Nguyen-Thanh T , Unrath A , Lahiri N , et al. Stability of white matter changes related to Huntington’s disease in the presence of imaging noise: A DTI study. PLoS Curr. (2011) ;3: :Rrn1232. doi: 10.1371/currents.RRN1232 |
[20] | Andica C , Kamagata K , Hatano T , Saito Y , Ogaki K , Hattori N , et al. MR biomarkers of degenerative brain disorders derived from diffusion imaging. J Magn Reson Imaging. (2020) ;52: (6):1620–36. doi: 10.1002/jmri.27019 |
[21] | Liu W , Yang J , Burgunder J , Cheng B , Shang H . Diffusion imaging studies of Huntington’s disease: A meta-analysis. Parkinsonism Relat Disord. (2016) ;32: :94–101. doi: 10.1016/j.parkreldis.2016.09.005 |
[22] | Jensen JH , Helpern JA , Ramani A , Lu H , Kaczynski K . Diffusional kurtosis imaging: The quantification of non-Gaussian water diffusion by means of magnetic resonance imaging. Magn Reson Med. (2005) ;53: (6):1432–40. doi: 10.1002/mrm.20508 |
[23] | Lu H , Jensen JH , Ramani A , Helpern JA . Three-dimensional characterization of non-gaussian water diffusion in humans using diffusion kurtosis imaging. NMR Biomed. (2006) ;19: (2):236–47. doi: 10.1002/nbm.1020 |
[24] | Cheung MM , Hui ES , Chan KC , Helpern JA , Qi L , Wu EX . Does diffusion kurtosis imaging lead to better neural tissue characterization? A rodent brain maturation study. Neuroimage. (2009) ;45: (2):386–92. doi: 10.1016/j.neuroimage.2008.12.018 |
[25] | Hui ES , Cheung MM , Qi L , Wu EX . Towards better MR characterization of neural tissues using directional diffusion kurtosis analysis. Neuroimage. (2008) ;42: (1):122–34. doi: 10.1016/j.neuroimage.2008.04.237 |
[26] | Falangola MF , Jensen JH , Tabesh A , Hu C , Deardorff RL , Babb JS , et al. Non-Gaussian diffusion MRI assessment of brain microstructure in mild cognitive impairment and Alzheimer’s disease. Magn Reson Imaging. (2013) ;31: (6):840–6. doi: 10.1016/j.mri.2013.02.008 |
[27] | Gong NJ , Wong CS , Chan CC , Leung LM , Chu YC . Correlations between microstructural alterations and severity of cognitive deficiency in Alzheimer’s disease and mild cognitive impairment: A diffusional kurtosis imaging study. Magn Reson Imaging. (2013) ;31: (5):688–94. doi: 10.1016/j.mri.2012.10.027 |
[28] | Struyfs H , Van Hecke W , Veraart J , Sijbers J , Slaets S , De Belder M , et al. Diffusion kurtosis imaging: A possible MRI biomarker for AD diagnosis? J Alzheimers Dis. (2015) ;48: (4):937–48. doi: 10.3233/jad-150253 |
[29] | Yuan L , Sun M , Chen Y , Long M , Zhao X , Yin J , et al. Non-Gaussian diffusion alterations on diffusion kurtosis imaging in patients with early Alzheimer’s disease. Neurosci Lett. (2016) ;616: :11–8. doi: 10.1016/j.neulet.2016.01.021 |
[30] | Surova Y , Lampinen B , Nilsson M , Lätt J , Hall S , Widner H , et al. Alterations of diffusion kurtosis and neurite density measures in deep grey matter and white matter in Parkinson’s disease. PLoS One. (2016) ;11: (6):e0157755. doi: 10.1371/journal.pone.0157755 |
[31] | Kamagata K , Tomiyama H , Motoi Y , Kano M , Abe O , Ito K , et al. Diffusional kurtosis imaging of cingulate fibers in Parkinson disease: Comparison with conventional diffusion tensor imaging. Magn Reson Imaging. (2013) ;31: (9):1501–6. doi: 10.1016/j.mri.2013.06.009 |
[32] | Blockx I , Verhoye M , Van Audekerke J , Bergwerf I , Kane JX , Delgado YPR , et al. Identification and characterization of Huntington related pathology: An in vivo DKI imaging study. Neuroimage. (2012) ;63: (2):653–62. doi: 10.1016/j.neuroimage.2012.06.032 |
[33] | Blockx I , De Groof G , Verhoye M , Van Audekerke J , Raber K , Poot D , et al. Microstructural changes observed with DKI in a transgenic Huntington rat model: Evidence for abnormal neurodevelopment. Neuroimage. (2012) ;59: (2):957–67. doi: 10.1016/j.neuroimage.2011.08.062 |
[34] | Bean L , Bayrak-Toydemir P . Addendum: American College of Medical Genetics and Genomics Standards and Guidelines for Clinical Genetics Laboratories, edition: Technical standards and guidelines for Huntington disease. Genet Med. (2021) ;23: (12):2461. doi: 10.1038/s41436-020-0893-3 |
[35] | Paulsen JS , Long JD , Johnson HJ , Aylward EH , Ross CA , Williams JK , et al. Clinical and biomarker changes in premanifest Huntington disease show trial feasibility: A decade of the PREDICT-HD study. Front Aging Neurosci. (2014) ;6: :78. doi: 10.3389/fnagi.2014.00078 |
[36] | Unified Huntington’s Disease Rating Scale: Reliability and consistency Huntington Study Group. Mov Disord. (1996) ;11: (2):136–42. doi: 10.1002/mds.870110204 |
[37] | Beck AT BDI-II, Beck depression inventory: Manual. In: Steer RA, Brown GK, editors. Secondedition. ed. |
[38] | Folstein MF , Folstein SE , McHugh PR . “Mini-mental state”. A practical method for grading the cognitive state of patients for the clinician. J Psychiatr Res. (1975) ;12: (3):189–98. doi: 10.1016/0022-3956(75)90026-6 |
[39] | Woolrich MW , Jbabdi S , Patenaude B , Chappell M , Makni S , Behrens T , et al. Bayesian analysis of neuroimaging data in FSL. Neuroimage. (2009) ;45: (1 Suppl):S173–86. doi: 10.1016/j.neuroimage.2008.10.055 |
[40] | Wu EX , Cheung MM . MR diffusion kurtosis imaging for neural tissue characterization. NMR Biomed. (2010) ;23: (7):836–48. doi: 10.1002/nbm.1506 |
[41] | Kamagata K , Motoi Y , Tomiyama H , Abe O , Ito K , Shimoji K , et al. Relationship between cognitive impairment and white-matter alteration in Parkinson’s disease with dementia: Tfract-based spatial statistics and tract-specific analysis. Eur Radiol. (2013) ;23: (7):1946–55. doi: 10.1007/s00330-013-2775-4 |
[42] | Wang JJ , Lin WY , Lu CS , Weng YH , Ng SH , Wang CH , et al. Parkinson disease: Diagnostic utility of diffusion kurtosis imaging. Radiology. (2011) ;261: (1):210–7. doi: 10.1148/radiol.11102277 |
[43] | de la Monte SM , Vonsattel JP , Richardson EP Jr. Morphometric demonstration of atrophic changes in the cerebral cortex, white matter, and neostriatum in Huntington’s disease. J Neuropathol Exp Neurol. (1988) ;47: (5):516–25. doi: 10.1097/00005072-198809000-00003 |
[44] | Casella C , Lipp I , Rosser A , Jones DK , Metzler-Baddeley C . A critical review of white matter changes in Huntington’s disease. Mov Disord. (2020) ;35: (8):1302–11. doi: 10.1002/mds.28109 |
[45] | Ferrari Bardile C , Garcia-Miralles M , Caron NS , Rayan NA , Langley SR , Harmston N , et al. Intrinsic mutant HTT-mediated defects in oligodendroglia cause myelination deficits and behavioral abnormalities in Huntington disease. Proc Natl Acad Sci U S A. (2019) ;116: (19):9622–7. doi: 10.1073/pnas.1818042116 |
[46] | Sritharan A , Egan GF , Johnston L , Horne M , Bradshaw JL , Bohanna I , et al. A longitudinal diffusion tensor imaging study in symptomatic Huntington’s disease. J Neurol Neurosurg Psychiatry. (2010) ;81: (3):257–62. doi: 10.1136/jnn2007.142786 |
[47] | Novak MJ , Seunarine KK , Gibbard CR , Hobbs NZ , Scahill RI , Clark CA , et al. White matter integrity in premanifest and early Huntington’s disease is related to caudate loss and disease progression. Cortex. (2014) ;52: :98–112. doi: 10.1016/j.cortex.2013.11.009 |
[48] | Reading SA , Yassa MA , Bakker A , Dziorny AC , Gourley LM , Yallapragada V , et al. Regional white matter change in pre-symptomatic Huntington’s disease: A diffusion tensor imaging study. Psychiatry Res. (2005) ;140: (1):55–62. doi: 10.1016/j.pscychresns.2005.05.011 |
[49] | Zhang J , Gregory S , Scahill RI , Durr A , Thomas DL , Lehericy S , et al. In vivo characterization of white matter pathology in premanifest huntington’s disease. Ann Neurol. (2018) ;84: (4):497–504. doi: 10.1002/ana.25309 |
[50] | Roland JL , Snyder AZ , Hacker CD , Mitra A , Shimony JS , Limbrick DD , et al. On the role of the corpus callosum in interhemispheric functional connectivity in humans. Proc Natl Acad Sci U S A. (2017) ;114: (50):13278–83. doi: 10.1073/pnas.1707050114 |
[51] | McAllister B , Gusella JF , Landwehrmeyer GB , Lee JM , MacDonald ME , Orth M , et al. Timing and impact of psychiatric, cognitive, and motor abnormalities in Huntington disease. Neurology. (2021) ;96: (19):e2395–e406. doi: 10.1212/wnl.0000000000011893 |
[52] | Rupp J , Blekher T , Jackson J , Beristain X , Marshall J , Hui S , et al. Progression in prediagnostic Huntington disease. J Neurol Neurosurg Psychiatry. (2010) ;81: (4):379–84. doi: 10.1136/jnn2009.176982 |
[53] | van der Burg JMM , Gardiner SL , Ludolph AC , Landwehrmeyer GB , Roos RAC , Aziz NA . Body weight is a robust predictor of clinical progression in Huntington disease. Ann Neurol. (2017) ;82: (3):479–83. doi: 10.1002/ana.25007 |
[54] | Duan W , Jiang M , Jin J . Metabolism in HD: Still a relevant mechanism? Mov Disord. (2014) ;29: (11):1366–74. doi: 10.1002/mds.25992 |
[55] | Du G , Dong W , Yang Q , Yu X , Ma J , Gu W , et al. Altered gut microbiota related to inflammatory responses in patients with Huntington’s disease. Front Immunol. (2020) ;11: :603594. doi: 10.3389/fimmu.2020.603594 |
[56] | Phillips O , Sanchez-Castaneda C , Elifani F , Maglione V , Di Pardo A , Caltagirone C , et al. Tractography of the corpus callosum in Huntington’s disease. PLoS One. (2013) ;8: (9):e07328. doi: 10.1371/journal.pone.0073280 |
[57] | Shoulson I . Huntington disease: Functional capacities in patients treated with neuroleptic and antidepressant drugs. Neurology. (1981) ;31: (10):1333–5. doi: 10.1212/wnl.31.10.1333 |
[58] | Tabrizi SJ , Schobel S , Gantman EC , Mansbach A , Borowsky B , Konstantinova P , et al. A biological classification of Huntington’s disease: The Integrated Staging System. Lancet Neurol. (2022) ;21: (7):632–44. doi: 10.1016/s1474-4422(22)00120-x |
[59] | Guo Q , Lv CZ , Zhou Y , Lu JC , Ding D . Application of Stroop color-word test on Chinese elderly patients with mild cognitive impairment and mild Alzheimer’s dementia. Chin J Neuromed. (2005) ;4: (7):701–704. |
[60] | Meng H , Zhang D , Sun Q . The applied value in brain gray matter nuclei of patients with early-stage Parkinson’s disease: A study based on multiple magnetic resonance imaging techniques. Head Face Med. (2023) ;19: (1):25. doi: 10.1186/s13005-023-00371-4 |
[61] | Li Y , Wen H , Li H , Peng Y , Tai J , Bai J , et al. Characterisation of brain microstructural alterations in children with obstructive sleep apnea syndrome using diffusion kurtosis imaging. J Sleep Res. (2023) ;32: (2):e01371. doi: 10.1111/jsr.13710 |
[62] | Cao LX , Yin JH , Du G , Yang Q , Huang Y . Identifying and verifying Huntington’s disease subtypes: Clinical features, neuroimaging, and cytokine changes. Brain Behav. (2024) ;14: (3):e3469. doi: 10.1002/brb3.3469 |
[63] | Smith SM , Jenkinson M , Johansen-Berg H , Rueckert D , Nichols TE , Mackay CE , et al. Tract-based spatial statistics: Voxelwise analysis of multi-subject diffusion data. Neuroimage. (2006) ;31: (4):1487–505. doi: 10.1016/j.neuroimage.2006.02.024 |
[64] | Dhollander T , Clemente A , Singh M , Boonstra F , Civier O , Duque JD , et al. Fixel-based analysis of diffusion MRI: Methods, applications, challenges and opportunities. Neuroimage. (2021) ;241: :118417. doi: 10.1016/j.neuroimage.2021.118417 |


