
The Neurodevelopmental Hypothesis of Huntington’s Disease
Abstract
The current dogma of HD pathoetiology posits it is a degenerative disease affecting primarily the striatum, caused by a gain of function (toxicity) of the mutant mHTT that kills neurons. However, a growing body of evidence supports an alternative theory in which loss of function may also influence the pathology.This theory is predicated on the notion that HTT is known to be a vital gene for brain development. mHTT is expressed throughout life and could conceivably have deleterious effects on brain development. The end event in the disease is, of course, neurodegeneration; however the process by which that occurs may be rooted in the pathophysiology of aberrant development.
To date, there have been multiple studies evaluating molecular and cellular mechanisms of abnormal development in HD, as well as studies investigating abnormal brain development in HD animal models. However, direct study of how mHTT could affect neurodevelopment in humans has not been approached until recent years. The current review will focus on the most recent findings of a unique study of children at-risk for HD, the Kids-HD study. This study evaluates brain structure and function in children ages 6–18 years old who are at risk for HD (have a parent or grand-parent with HD).
We are entering an exciting time for Huntington’s disease (HD) research, as there is a phase III clinical trial for a gene knock-down therapy using an Anti-Sense Oligonucleotide (ASO) [1, 2]. The stakes are high for patients suffering from this devastating, deadly disease. Yet in the face of hope is the stark reality that although the field has made tremendous advances in drug development for gene knock-down therapy, very basic principles of HD disease pathology still remain unknown. In general, the mechanism of neuronal dysfunction and premature death is not known.
HD is caused by a trinucleotide repeat expansion in the gene encoding huntingtin protein (HTT), resulting in the production of mutant HTT, or mHTT. The current dogma of HD pathoetiology posits it is a degenerative disease affecting primarily the striatum, caused by a gain of function (toxicity) of the mutant mHTT that kills neurons. In the brain, this affects very specifically the striatum, and the medium spiny neurons in particular. However, a growing body of evidence supports an alternative theory in which mHTT has a direct affect on brain development which plays a vital role in the later degenerative process. In 2000, Mehler and Gokhan hypothesized that neurodegenerative diseases could be conceptualized as neurodevelopmental disorders with the origins of disease beginning with abnormal brain development [3]. This theory is predicated on the notion that HTT is known to be a vital gene for brain development. mHTT is expressed throughout life and could conceivably have deleterious effects on brain development. The end event in the disease is, of course, neurodegeneration; however the process by which that occurs begins with aberrant development.
To date, there have been multiple studies evaluating molecular and cellular mechanisms of abnormal development in HD. For example see recent studies on transcriptomics [4], and studies of induced pluripotent stem cell lines [5–12], as well as studies investigating abnormal brain development in HD animal models [13–17]. As a whole, this literature is rich and supports the notion that abnormal development may play a role in the pathogenesis of disease. However, direct study of how mHTT could affect neurodevelopment in humans has not been approached until recent years. The current review will focus on the literature relating to neurodevelopmental deficits in HD and the most recent findings of a unique study of children at-risk for HD, the Kids-HD study.
EVALUATING THE EFFECTS OF HTT ON HUMAN BRAIN DEVELOPMENT: THE KIDS-HD STUDY
The Kids-HD study is a unique research program conducted at the University of Iowa for over 10 years. Funded by the NINDS (and initially also CHDI), the purpose of this study is to recruit subjects ages 6–18 years of age who are at risk for HD (have a parent, or a grandparent with HD). In addition, we recruit children from the surrounding area as community controls. Families with HD are flown in from around the country to undergo a brain MRI scan, cognitive testing, and motor examination at the University of Iowa. They provide blood or saliva for genetic testing which are explicitly collected for research purposes only, meaning that genetic results are de-identified and not released to anyone, and are not a part of the medical record. The at-risk children are all confirmed to be free from any manifestation of disease, i.e., they do not have juvenile-onset HD. In fact, on average, children are typically decades away from estimated disease onset. The design of this unique study enables the evaluation of brain structure and function from a developmental perspective, across the entire spectrum of repeats from 15 through 59 repeats. Children with CAG repeats of 40 and greater are labeled Gene-Expanded (GE) and those with repeats 39 and below are labeled Gene Non-Expanded (GNE).
To fully understand how mHTT might affect brain development, it is important to consider what the function of the normal gene (HTT) is, especially regarding brain development. At the molecular level, HTT is a multiple conformation protein that interacts with many other proteins [8] and has been reported to have different functions including spindle orientation during cell division [18], endocytosis [19], transcriptional regulation [20], establishing excitatory circuits [21], and maintenance of cell morphology [16, 22]. Yet, possibly the most intriguing consideration is that of the evolutionary biologists, who have argued that triplet repeat genes enable a unique mechanism of evolution, and in particular human brain evolution [23–25].
EVOLUTIONARY ASPECTS OF HTT
HTT is a highly conserved gene. Moreover, the number of CAG repeats increases with phylogenetic proximity to humans [26]. HTT is just one of a class of triplet repeat genes that all share common features, including high levels of expansion repeats in the normal population, and the phenomenon of degenerative brain disease once the repeats expand beyond a certain threshold.
In the study of genes with triplet repeats, it is noted that repeat number variation can affect diverse aspects of gene function including transcription rates and transcript stability, rates of protein folding and interactions, and protein aggregation [20, 27–29]. It is speculated that repeat number variations exert incremental quantitative effects, similar to a ‘tuning knob’ which is distinctly different from the binary aspects of single nucleotide substitutions [23, 30, 31]. Thus, increasing numbers of repeated elements in a gene would create a whole range or spectrum of phenotypes, whereas a single mutation creates only two, i.e., mutated or not mutated. This foundation of large variation in phenotype has prompted speculation that triplet repeats play an important, and potentially beneficial, role in evolution. In addition, it also suggests that the triplet repeat-expansion diseases are only the pathological extreme of a more general mutational process that also contributes to normal brain function and development. Although expanding repeats in the non-pathologic range have been shown to contribute to variation in traits in animals (examples include yeast cell adhesion and dog skeletal morphology) [23], few studies have examined the effect of repeat expansion below disease threshold in humans. Regarding brain function, this hypothesis would predict that increasing triplet repeats below disease threshold would be advantageous such that higher repeats would lead to improved brain function.
ABNORMAL NEURODEVELOPMENT IN HUNTINGTON’S DISEASE PATHOETIOLOGY
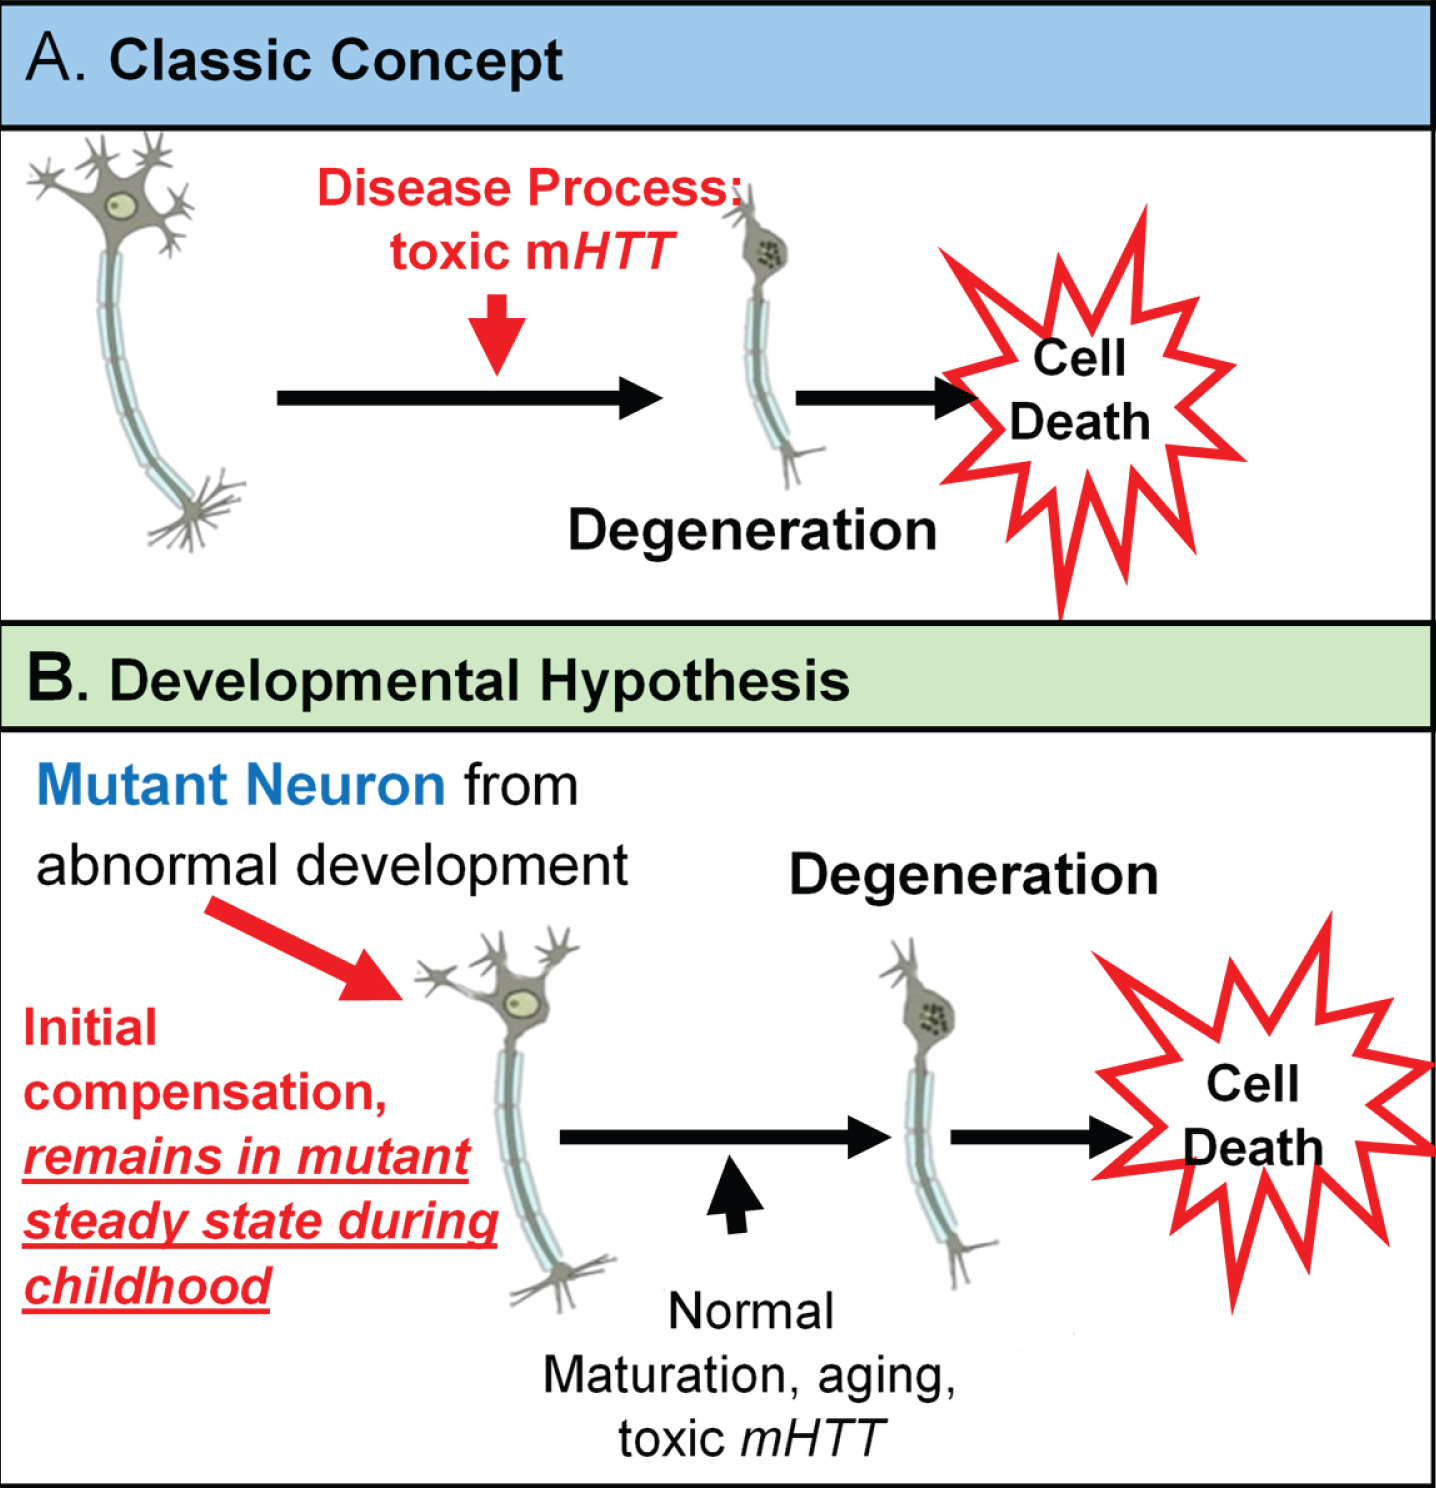
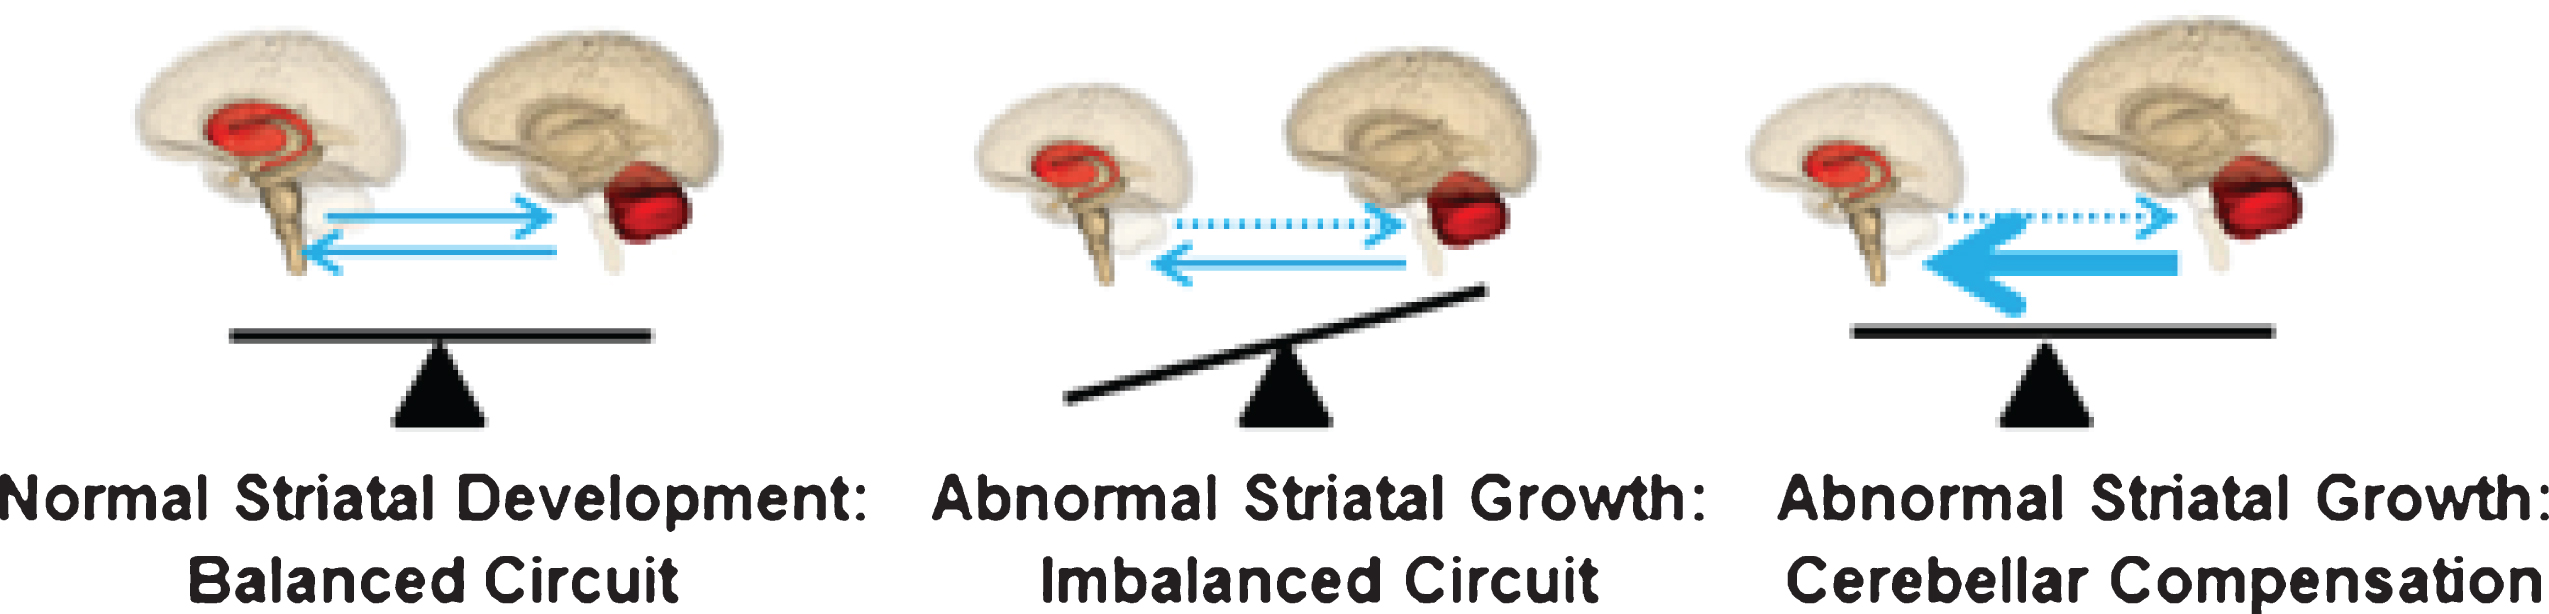
The neurodevelopmental hypothesis of HD (and other degenerative disorders) [3] posits that disease-causing gene affects development of a specific region or specific brain circuit. These cells are abnormal in their growth; however they are compensated for early in life (Fig. 1). Therefore, despite abnormal development, there are no overt symptoms. The abnormally developed cells remain in a ‘mutant steady state.’ These cells are then vulnerable to dysfunction and degeneration later in life when they are subjected to stresses and strains, either normal (programmed synaptic elimination during puberty, the aging process) or pathological (toxic effects of mHTT). In the end, disease pathology results in neural degeneration; however, the primary defect—the origins of disease—is abnormal development.
Fig. 1
Theories of HD Etiology.
The threshold at which HD is fully penetrant is 40 repeats. In the same way increasing repeats cause incremental advantageous changes below disease threshold [32–34], it is possible that the reversed situation is evident above disease threshold: increasing repeats cause incremental deleterious effects. It is well known that there is a dose-effect of CAG repeats in HD above disease threshold as there is a direct relationship between increasing repeats and earlier age of onset [35]. The developmental hypothesis would postulate that before disease manifestation, increasing repeats would result in greater developmental aberration.
MODELING THE EFFECTS OF CAG REPEAT IN HTT THROUGH THE ENTIRE SPECTRUM
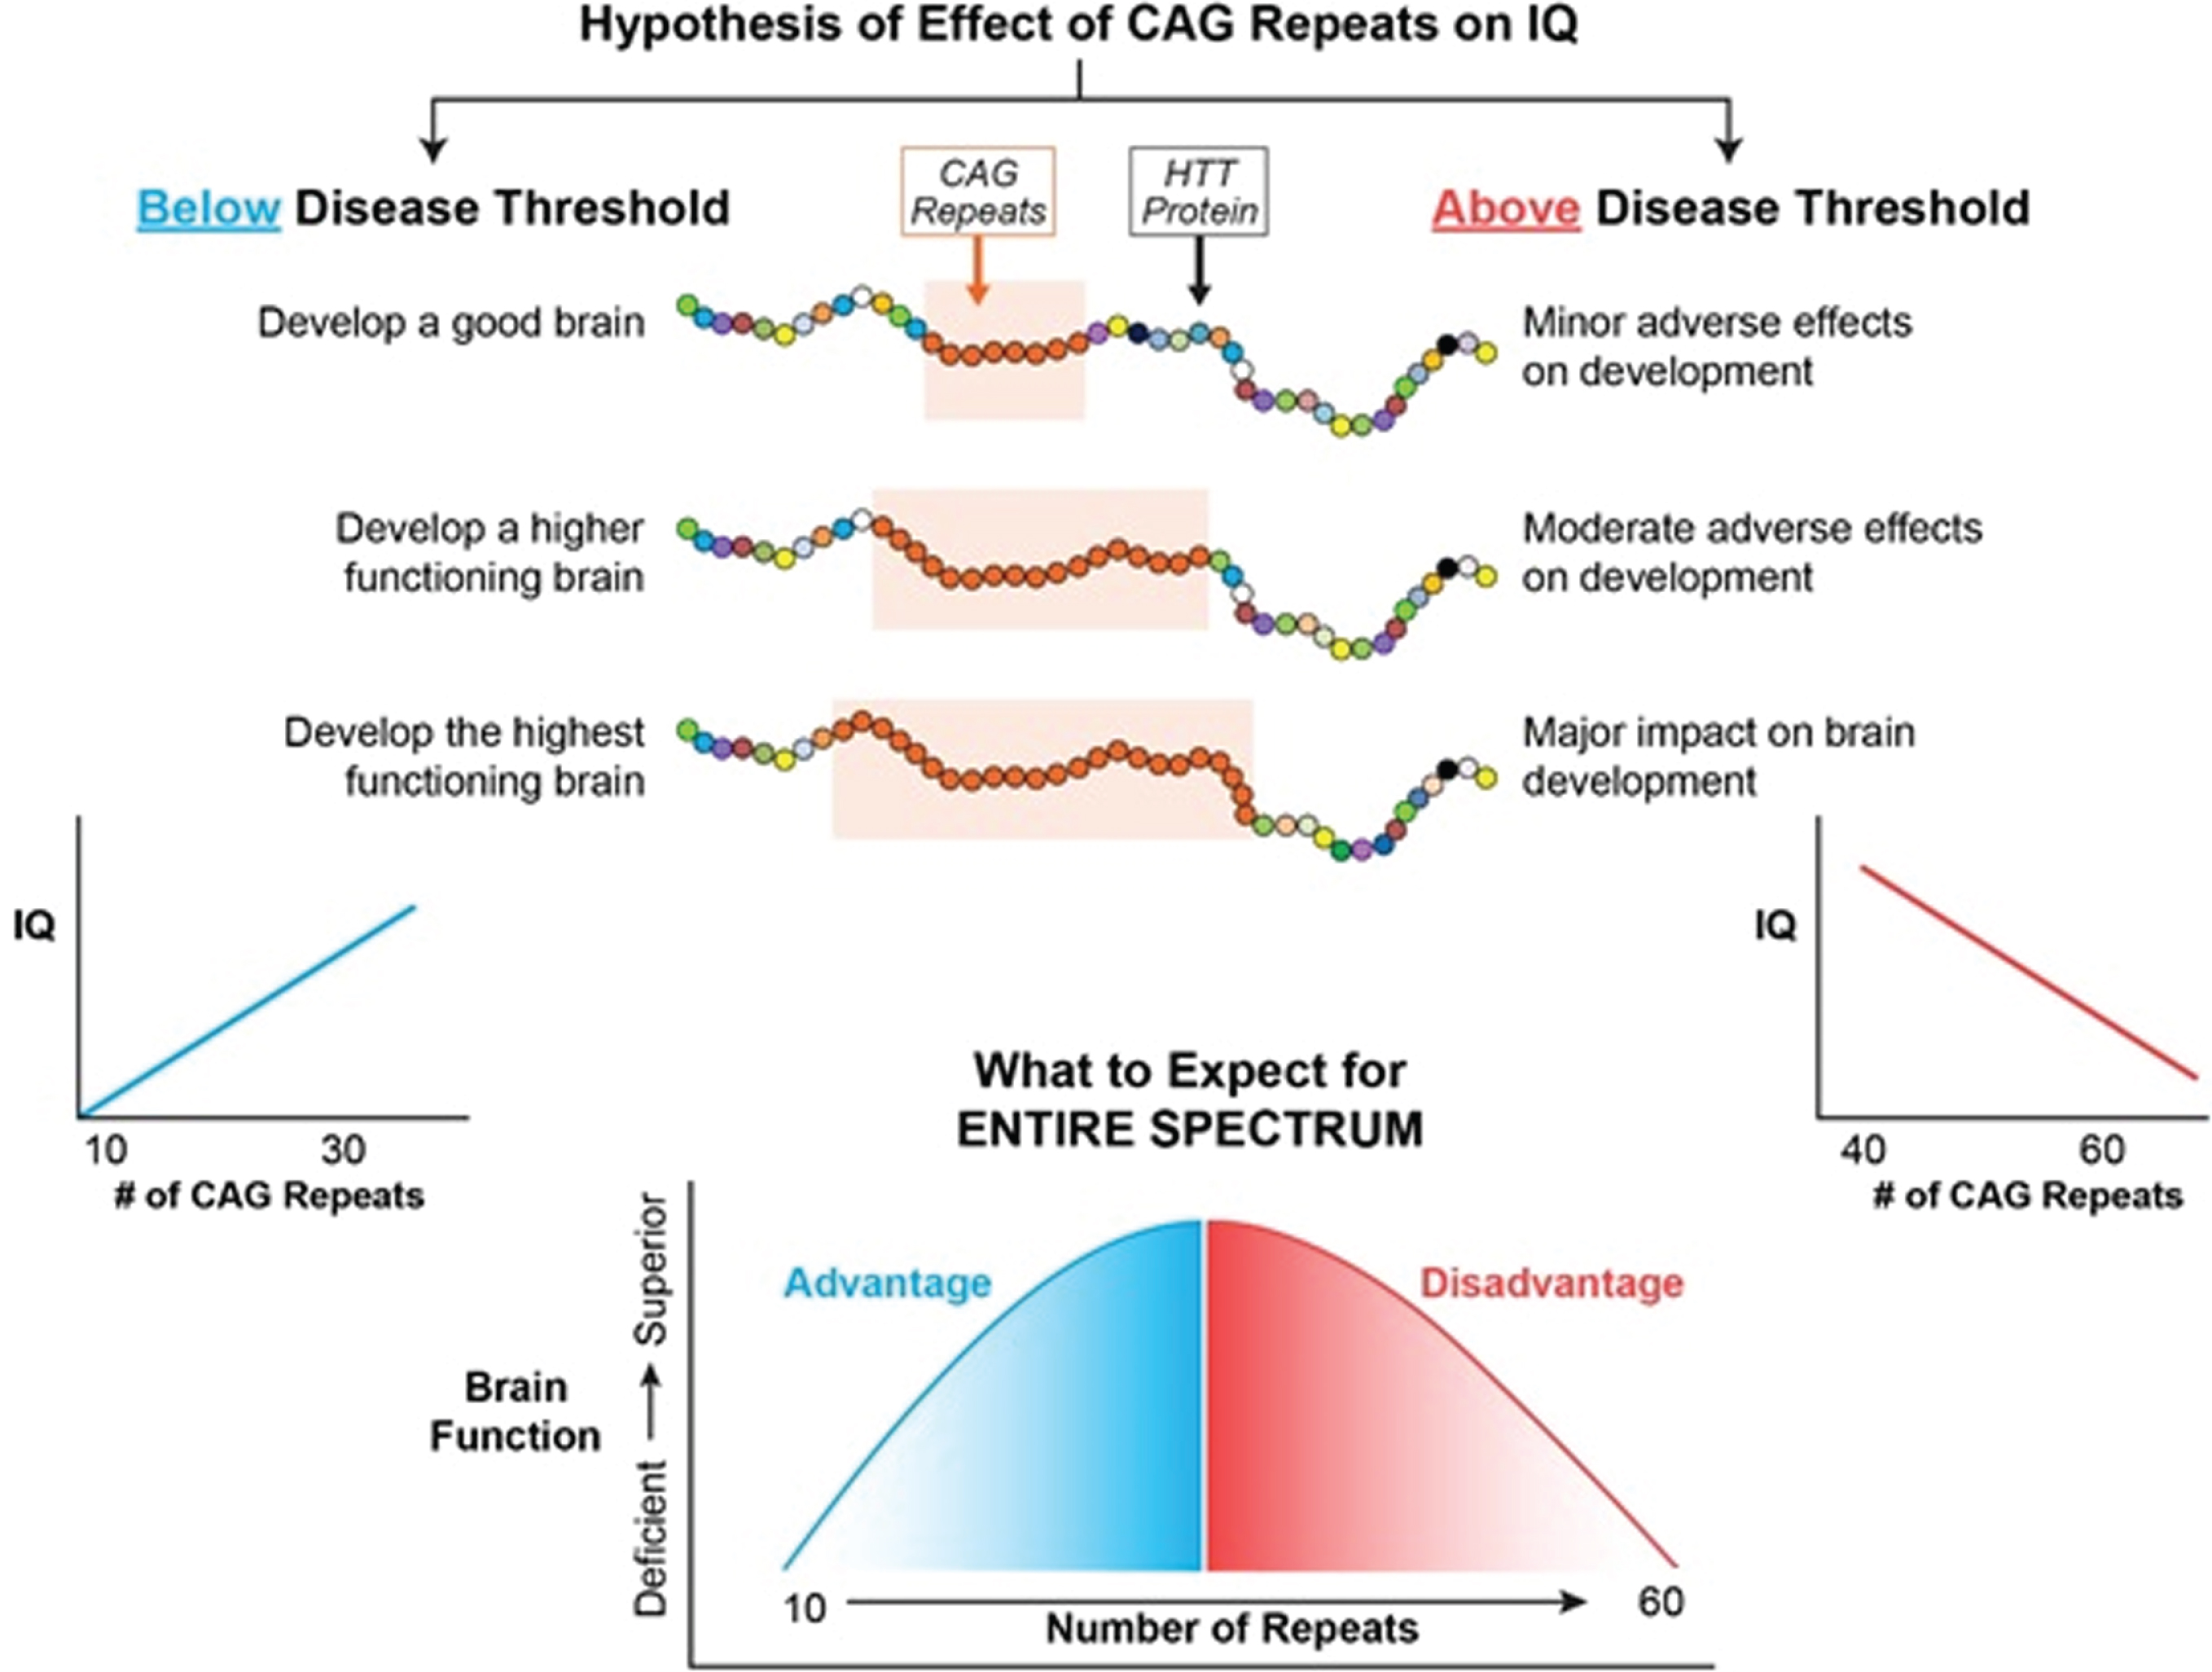
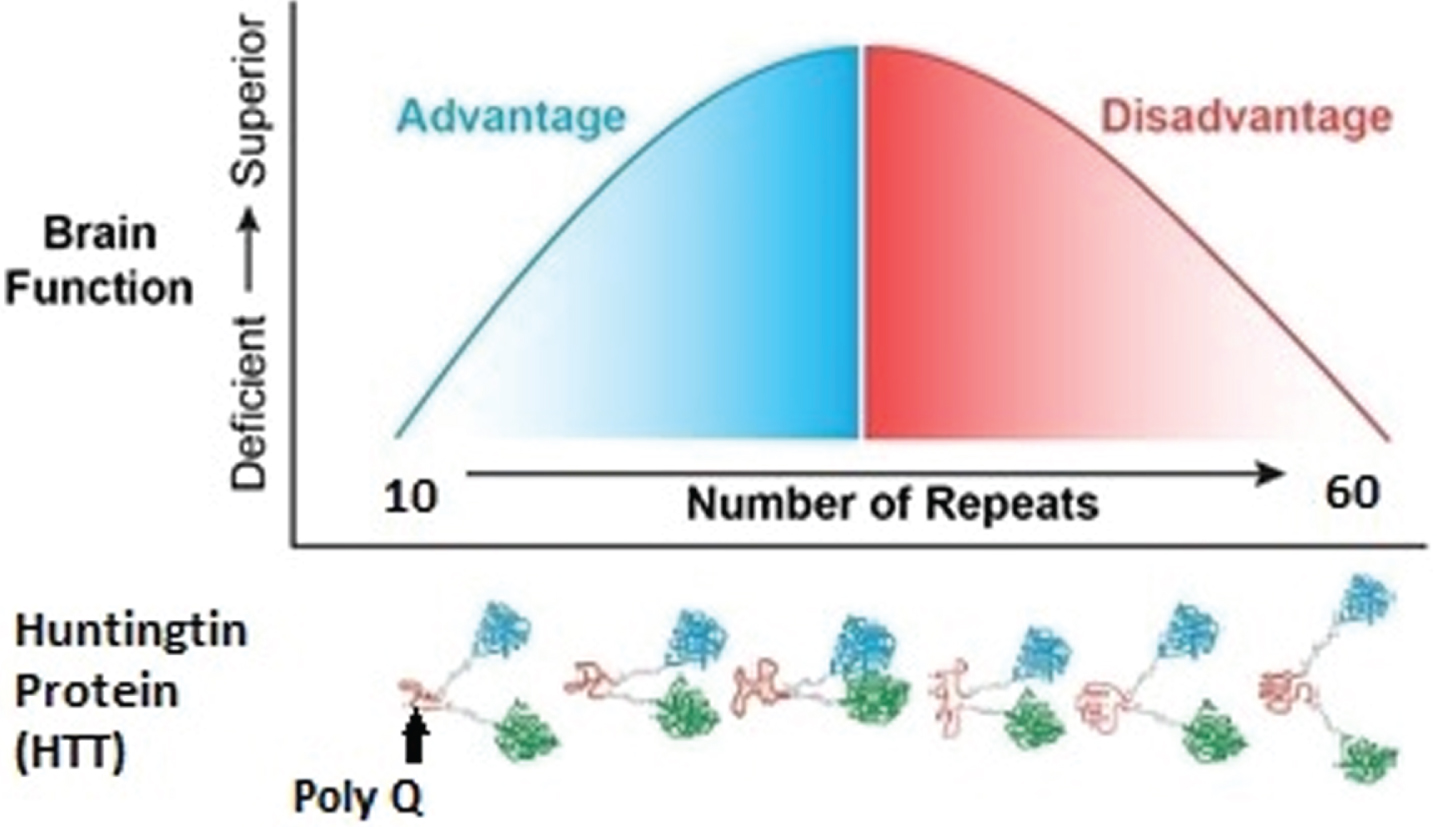
Figure 2 represents the hypothesis of the effects of CAG repeat on brain function when considering the entire spectrum of repeats from below disease threshold through roughly 60 repeats, where 40–59 repeats are typically associated with adult-onset HD and ≥60 repeats typically result in Juvenile Onset HD or JOHD (defined as disease manifestation prior to age 21) [36]. In our example, brain function is represented by IQ. Below disease threshold, the effect of increasing repeats are expected to be advantageous, resulting in higher IQ. In contrast, above disease threshold increasing repeats result in lower IQ. Importantly, this model is considering the effect on the developmental effect of HTT, meaning that for repeats above disease threshold the adverse effects of HTT would be seen well before onset of degeneration of neurons.
Fig. 2
The left side of the figure models how CAG repeats might effect IQ below disease threshold where the right side of the figure models how CAG repeats might effect IQ above disease threshold.
MODELING THE EFFECT OF HTT ON IQ THROUGH THE ENTIRE REPEAT SPECTRUM
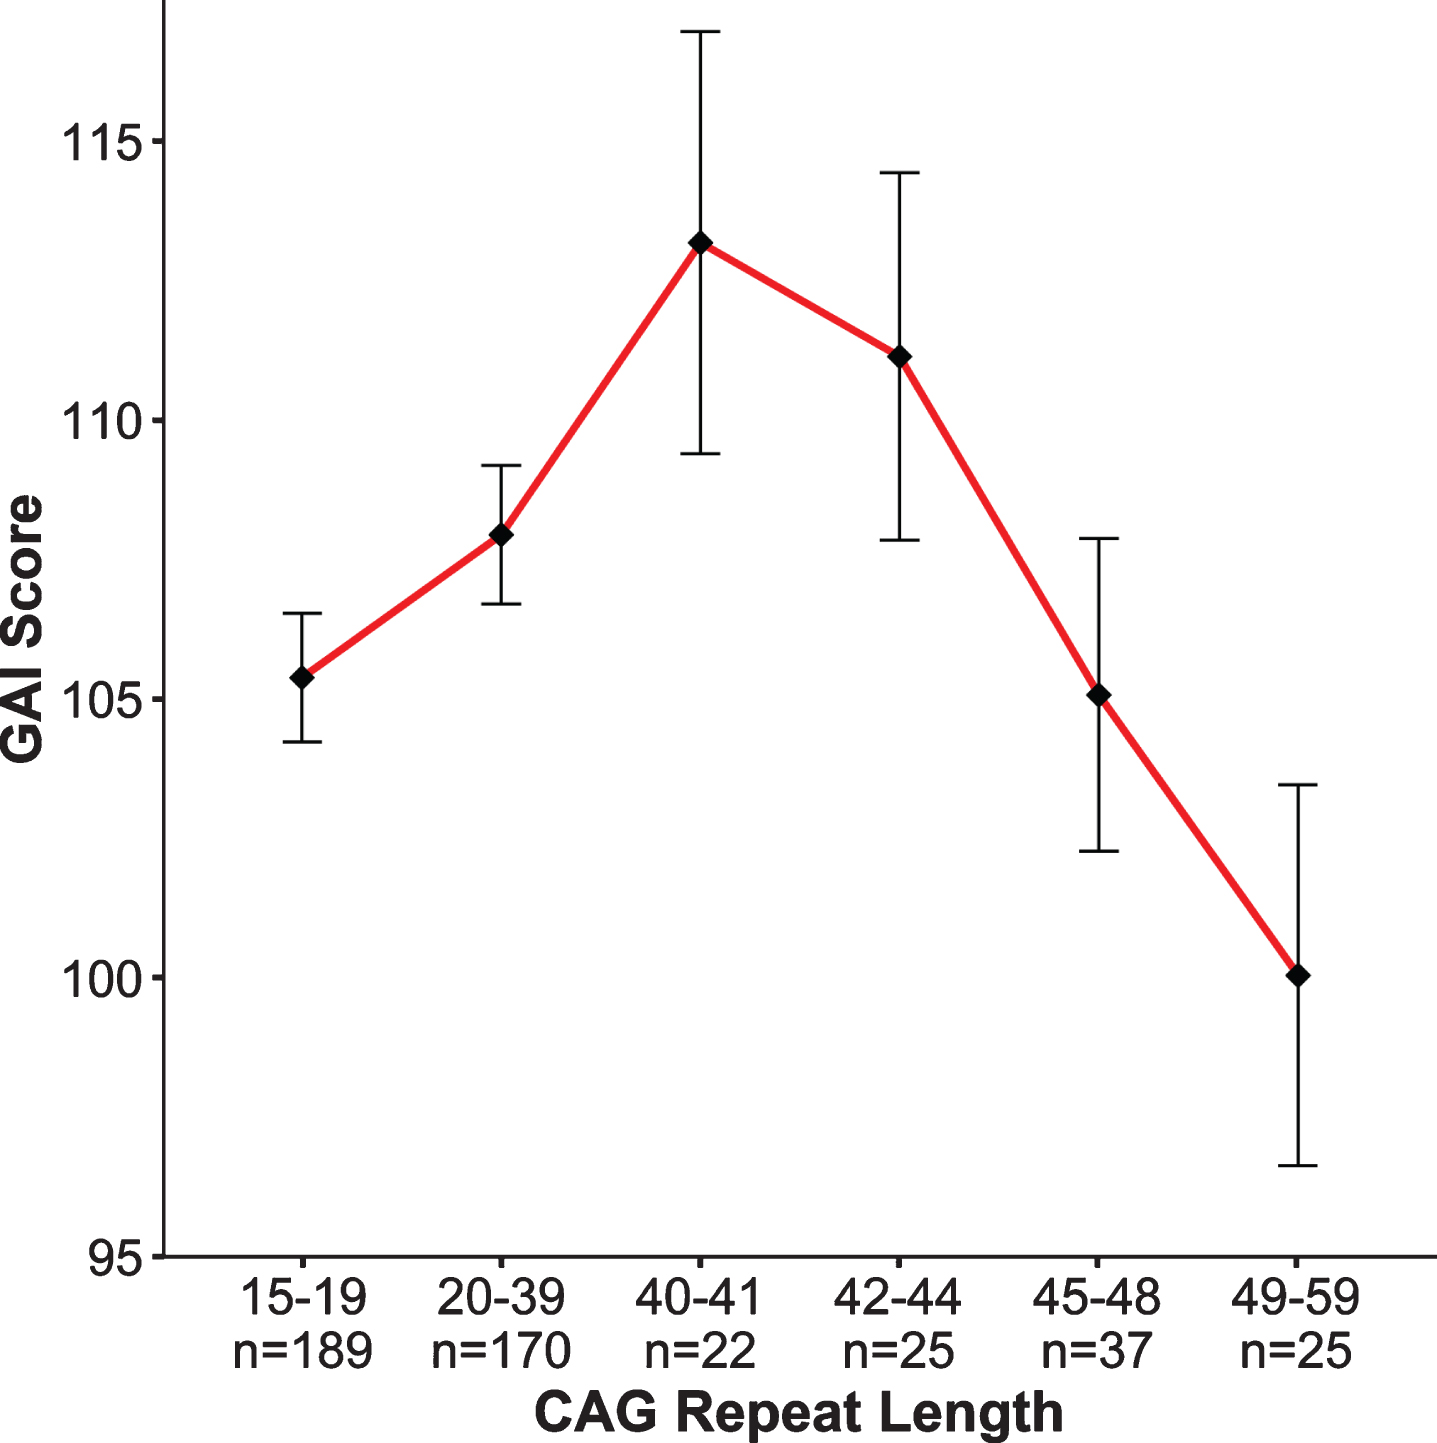
The notion that intelligence has a strong genetic influence has been known for over 100 years [37], and general intelligence (IQ) is considered to be one of the most heritable behavioral traits in humans [38]. In contrast to the genetic studies that have identified genes having substantial effects on anthropometric measures such as height and weight, no studies have identified and replicated any gene, or gene variant, that significantly relates to intellect [39]. A genome-wide association study (GWAS) meta-analysis analyzing 35,298 individuals, found two novel loci that were associated with general cognitive function. Yet, the effect sizes are small with findings accounting for roughly 0.1% of the variance [40]. Importantly, GWAS studies identify genetic variation, but they do not quantify simple repeat sequences such as CAG repeats in HTT. Our study did just that—evaluated the effect of increasing CAG repeats on IQ across the spectrum. Figure 3 from Lee et al. [33] shows the relationship between CAG repeat length (binned in groups on the x-axis, GNE subjects in the first 2 bins, GE subjects in the latter 4 bins) and General Abilities Index (GAI) from the Weschler Intelligence Scale for Children (ages 6–16) and the Weschler Adult Intelligence Scale (ages 17–18 years), shown on the y-axis. Note that for this analysis, the GNE group was composed of ‘at risk’ individuals who were determined to be gene negative, as well as community controls. While it is clear that cognitive function is impacted by expanded CAG repeat (dementia being a primary feature of the disease), much less is known about the impact of incremental CAG repeats in the non-expanded range. The pattern of findings in Fig. 3 recapitulates the hypothesized pattern of Fig. 2: We observed an increasing advantage to CAG repeats below disease threshold with a peak near 40, followed by an increasing deleterious effect of CAG repeat expansion on IQ [33]. To be clear, these results do not support the notion that HTT was positively selected for human brain evolution; however, the pattern of findings does suggest that triplet repeat-expansion diseases are the pathologic extreme of a more general process of normal brain growth and development. These results were obtained from children who were decades from manifesting HD, yet differences in cognitive function were already noted as a function of CAG repeat length. This observation further supports the notion of abnormal brain development above disease threshold being present decades prior to disease onset.
Fig. 3
General Abilities Index (GAI). Graph above shows results of the non-linear model (β= –20.2, p = 0.006) where the x-axis is represented by groups of subjects binned by CAG repeat length of the longest allele, and the y-axis is the mean GAI (bars are standard error) for each group. To obtain mean GAI, ANCOVA was performed between groups, controlling for age, sex, and parental SES.
MODELING THE TRAJECTORY OF BRAIN DEVELOPMENT
Several studies have evaluated cortical folding patterns in adults with HD to make inferences about abnormal brain development [41]. Mangin and colleagues (2020) examined cortical sulcas length in adults with HD [42]. While most morphological differences between controls and HD patients were primarily atrophy-related, they also reported absence of asymmetry in the length of the Sylvian fissure in HD. Predicated on the notion that asymmetry of the Sylvian fissure is evident in newborns, the authors conclude that the presence of mHTT is likely to interfere with normal neurodevelopment.
Our own study addressed the question of abnormal brain development associated with HD in child and adolescent carriers of mHTT, who will develop HD in adulthood. Given the central importance of the striatum to disease pathology, we sought to identify how this brain region grows and develops over time (a developmental trajectory) using structural neuroimaging. To evaluate developmental trajectories, the Kids-HD study uses an Accelerated Longitudinal Design (ALD), which is the gold standard for pediatric neuroimaging studies [43]. ALD includes a cross-sectional and longitudinal component, enabling coverage of a wide age-range within a short study duration. Consistent with ALD, some participants are examined once, while others are assessed on multiple occasions. Figure 4 from van der Plas, et al. [44] shows a sample of 169 individuals, with 276 observations from the Kids-HD study showing the trajectory of cerebral white matter volume (including individuals from HD families only, i.e., no community controls were included in the analysis). The thin lines connecting individual points represent the same subject with follow-up visits. The heavy black line shows the developmental trajectory of the brain tissue across age. The figure is meant to model the ALD design, so there is no group comparison of trajectories. Figure 5A from van der Plas et al. [44] shows the developmental trajectory of the volume of the striatum in the GE group compared to the GNE group. The GE group has substantially larger striatal volumes early in life (age 6) with a steady linear decline afterward. This is in sharp contrast to the shape of the trajectory for the GNE controls that show a gentle increase over time, peaking around adolescence, then declining. Importantly, although the absolute difference in volume between groups at any one time may be small, what is more impressive is the wholly different pattern of growth and development that the striatum has in the GE compared to the GNE group. It should be noted that the GNE pattern is normal, with volumetric increase likely reflecting dendritic growth, and volumetric decrease reflected programmed synaptic elimination or ‘pruning.’ Fig. 5B highlights that the estimated differences in the groups are largest in the early years.
Fig. 4
Age is shown on the x-axis and cerebrum volume (gray and white matter combined) is shown on the y-axis. Single diamonds represent a single observation in an individual, while connected diamonds show repeated observations within the same individual. The thick, black line illustrates the growth curve across age based on a combination of cross-sectional and longitudinal components. To preserve gene status confidentiality, the figure illustrates the combined gene-expanded and gene-nonexpanded groups.
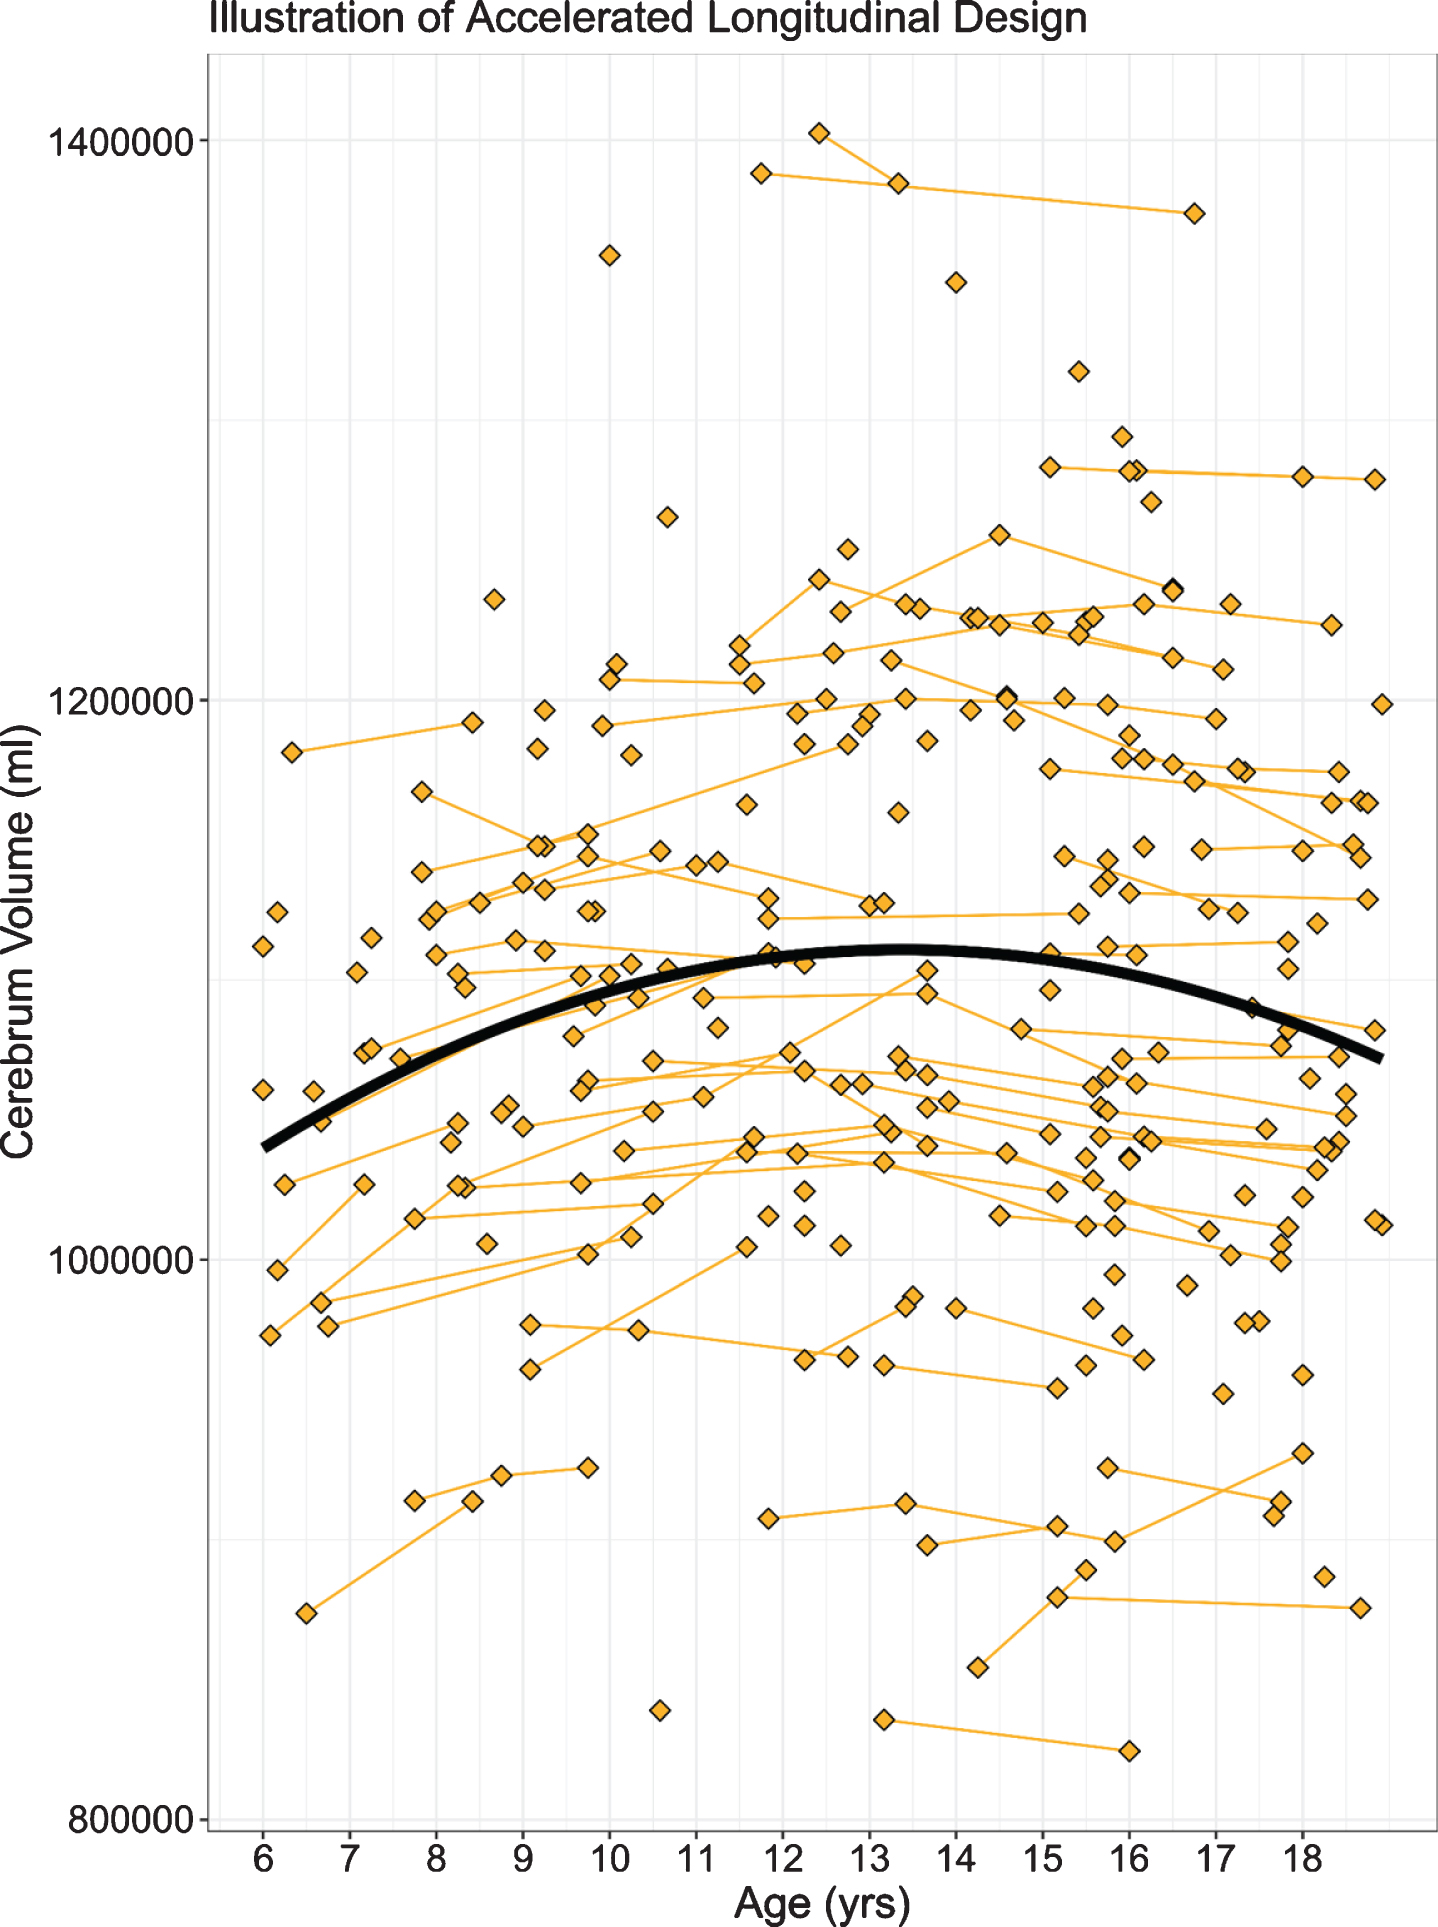
Fig. 5
A) Mean estimated age-dependent change of striatal volume in the GE (red) and GNE (green) groups. Note that the GE curve is based on individuals with CAG < 50, and that results were averaged across sex. B) Striatal volume diference (y-axis) between GE group (red) and GNE group (horizontal black line) across age (x-axis), along with 95% confidence limits of the difference scores. C) The impact of CAG repeat length on striatal volume (y-axis) across age (x-axis). CAG repeats <50 did not affect striatal growth curves (horizontal line labeled <50). For repeats >50, additional repeats were associated with accelerated striatal decline in adolescence, and possibly with greater hypertrophy before age 10. D) Mean estimated age-dependent change of the globus pallidus.
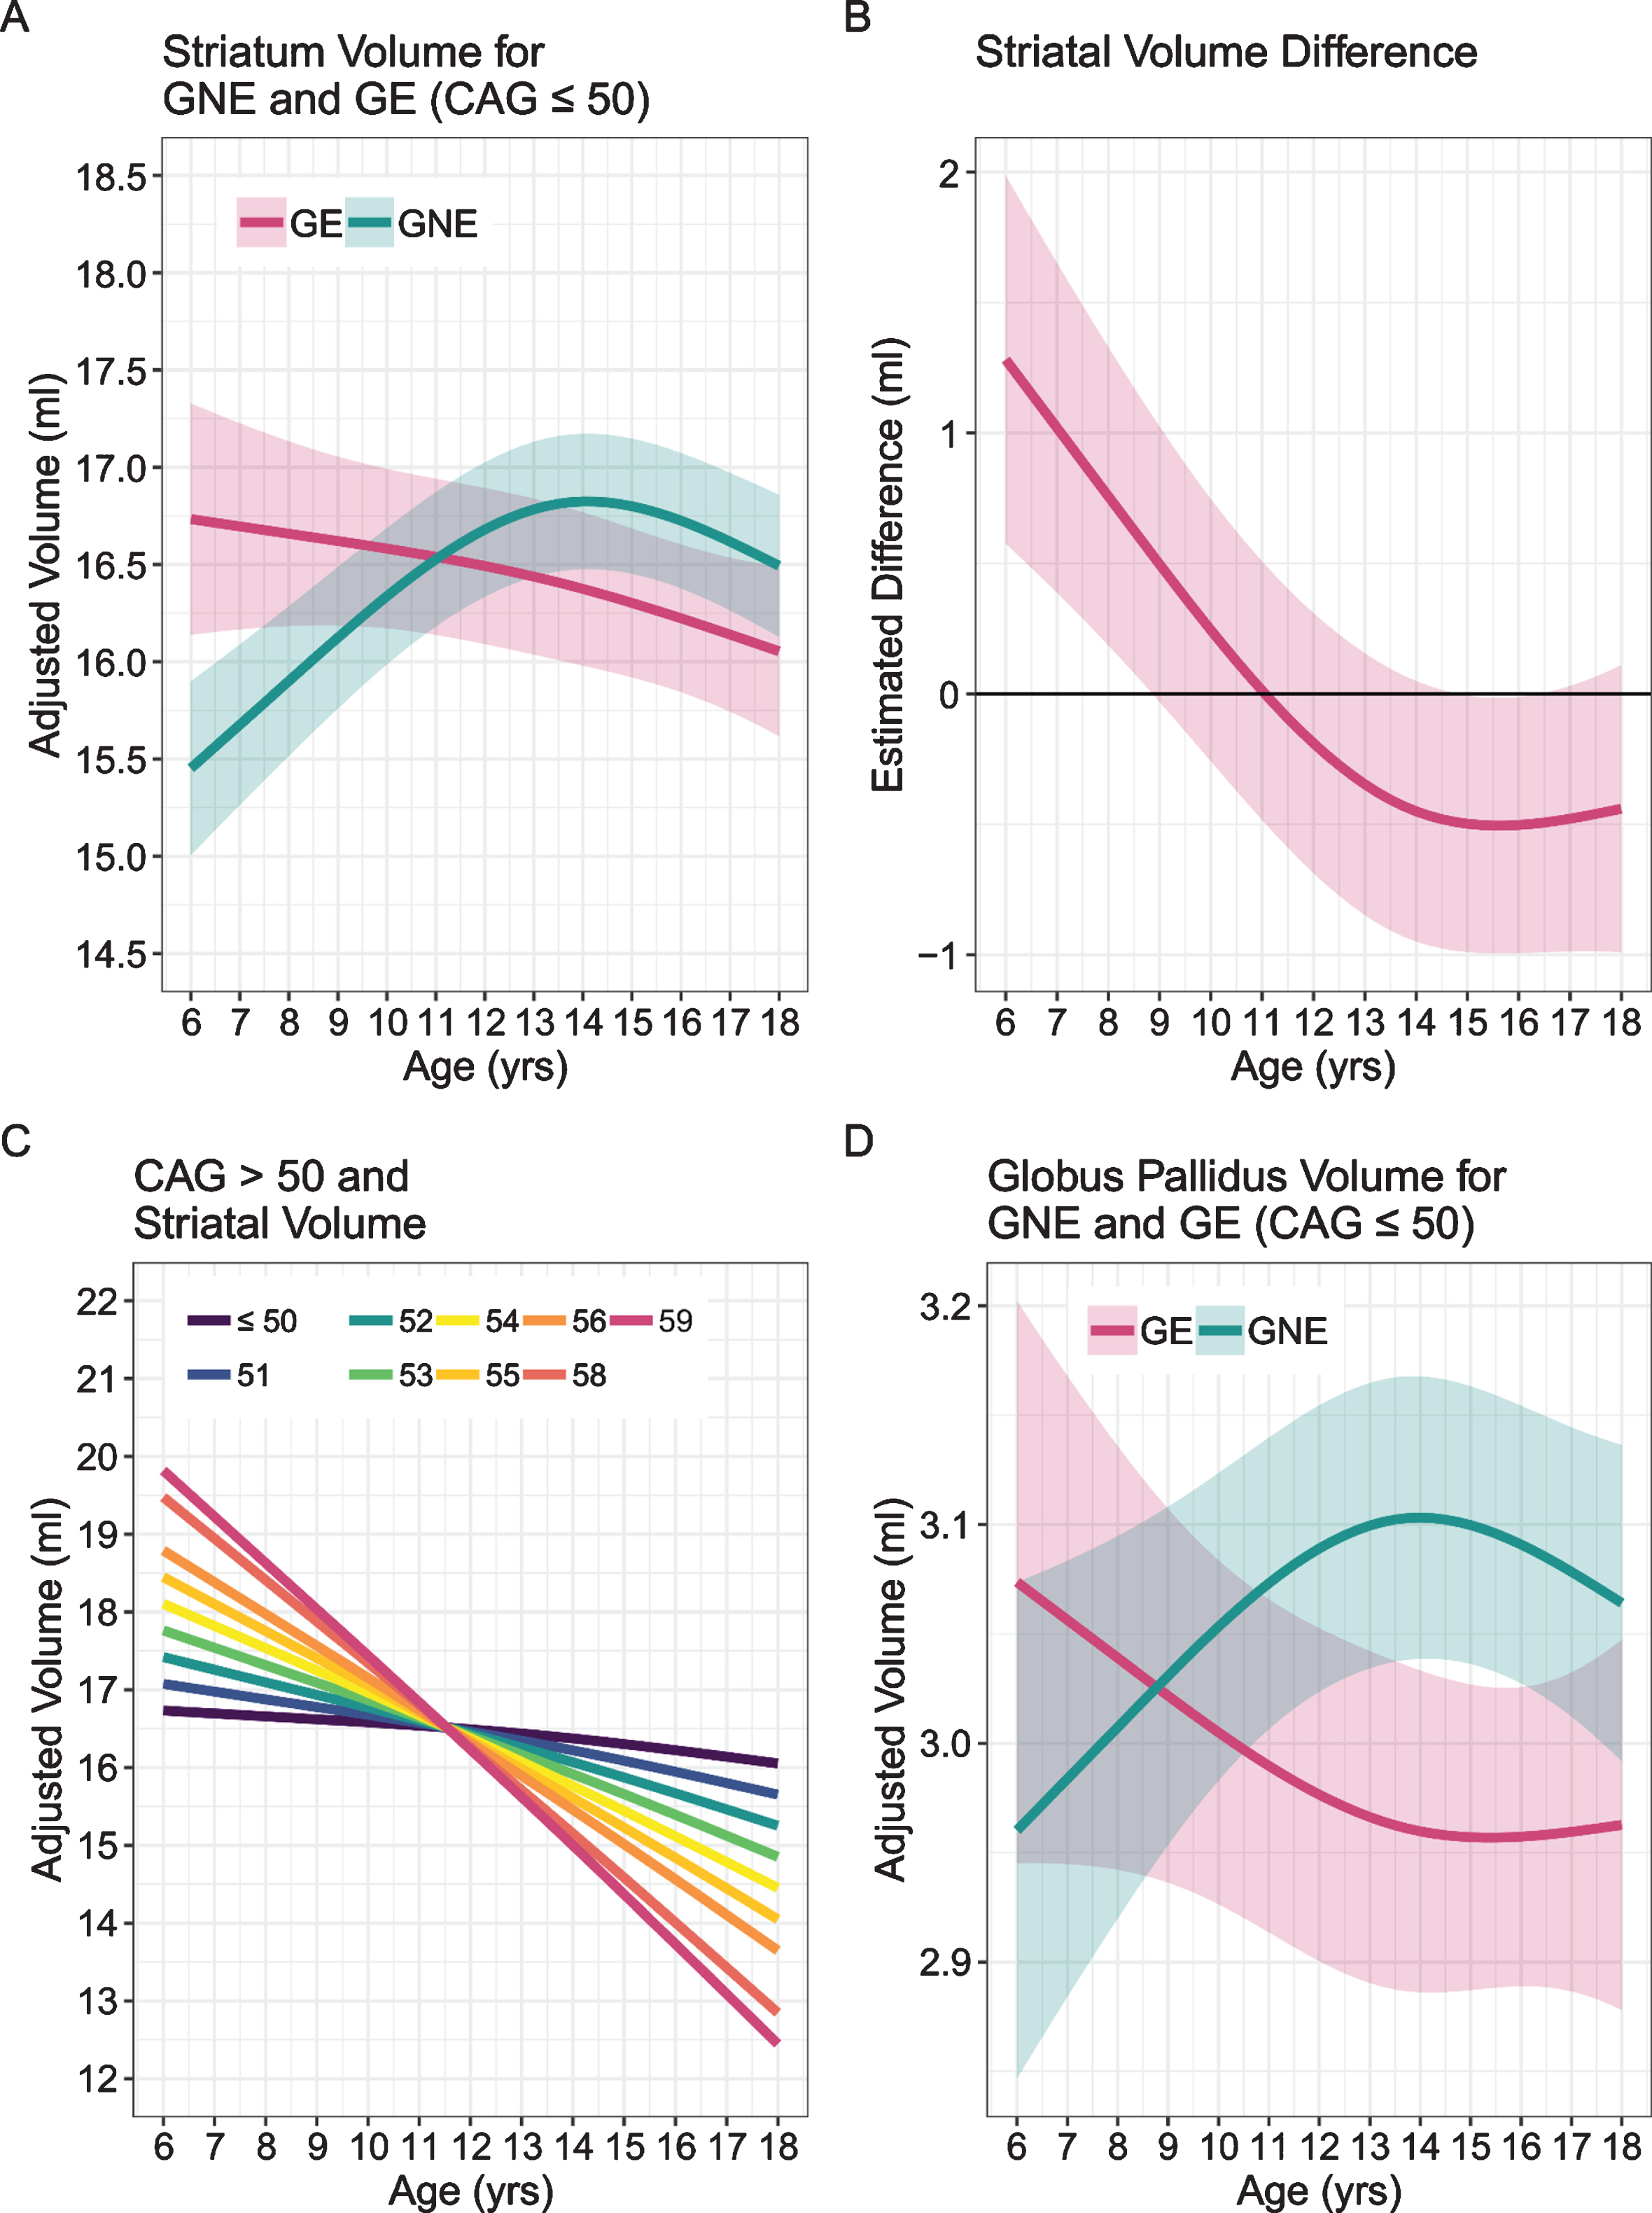
Above 50 repeats, there was a significant CAG repeat effect with increasing numbers of repeats. Figure 5C describes the finding that above 50 repeats there was a significant CAG ‘dose effect’ with increasing number of repeats manifesting in steeper slopes of developmental change, more hypertrophy early on and faster rate of decline. As it is a well-known phenomenon that higher repeats manifest in earlier ages of onset, one can speculate that a given threshold of minimum striatal volume is crossed at an earlier age with increasing length of repeats. Finally, Fig. 5D shows the effects on the globus pallidus showing the same type of pattern seen in the striatum.
These results support the neurodevelopmental hypothesis of HD and show that the striatum is abnormal in its growth and development. Yet, if the striatum is abnormal in development, why is it that the GE children are not manifesting motor symptoms of disease? Recall that in the developmental hypothesis of HD, the abnormally developed brain regions are compensated for by other brain regions. This compensation enables somewhat normal functioning of the striatum as it is being held in a ‘mutant steady state’ until later in life. The cerebellum is a likely candidate for enabling striatal function in the context of mutant HTT.
THE CEREBELLUM IS COMPENSATORY TO THE ABNORMALLY DEVELOPED STRIATUM
A simplistic overview of the motor system is shown in Fig. 6 from our most recent publication [45], with the portion of the figure in the green box representing the direct pathway (promotes movement) and the section in the blue box on the right representing the indirect pathway (inhibits movement). In HD, it is the indirect pathway that degenerates first, leading to lack of inhibition and involuntary movements (chorea). The cerebellum is integrated into striatal circuity through the indirect pathway [46–48]. Thus, the cerebellum could possibly compensate for a faulty indirect pathway, maintaining a balanced system to prevent the development of involuntary movements. This model of cerebellar compensation is illustrated in Fig. 7.
Fig. 6
The portion of the figure in the green box represents the direct pathway (promotes movement) and the section in the blue box represents the indirect pathway (inhibits movement). In Huntington’s disease, it is the indirect pathway that degenerates first, leading to lack of inhibition and involuntary movements (chorea). The cerebellum is integrated into striatal circuity through the indirect pathway. Thus the cerebellum could compensate for a faulty indirect pathway, restoring balance and preventing the development of involuntary movements. Red arrows indicate where the cerebellum is integrated into the indirect pathway. GPe, globus pallidus externa; GPi, globus pallidus interna; STN, subthalamic nucleus. Figure adapted from Bostan et al. [48].
![The portion of the figure in the green box represents the direct pathway (promotes movement) and the section in the blue box represents the indirect pathway (inhibits movement). In Huntington’s disease, it is the indirect pathway that degenerates first, leading to lack of inhibition and involuntary movements (chorea). The cerebellum is integrated into striatal circuity through the indirect pathway. Thus the cerebellum could compensate for a faulty indirect pathway, restoring balance and preventing the development of involuntary movements. Red arrows indicate where the cerebellum is integrated into the indirect pathway. GPe, globus pallidus externa; GPi, globus pallidus interna; STN, subthalamic nucleus. Figure adapted from Bostan et al. [48].](https://content.iospress.com:443/media/jhd/2020/9-3/jhd-9-3-jhd200394/jhd-9-jhd200394-g006.jpg)
Fig. 7
Model of cerebellar compensation of the abnormally developed striatum in HD. The compensation allows for normal motor function and maintains the striatum in mutant steady state.
While somewhat overlooked in the past, the cerebellum has recently been described as both potentially pathologic, as well as compensatory in HD [49–51]. The cerebellum is often regarded as being ‘spared’ from neurodegeneration caused by HD. The large PREDICT imaging study showed that every single region of the brain was affected years before disease manifestation –except the cerebellum [52].
As mHTT carriers in the kids-HD study are not manifesting motor abnormalities, it is difficult to determine true compensatory function of the cerebellum. However, it is possible to evaluate the functional connectivity between the striatum and the cerebellum in the study sample. We hypothesized that a compensatory mechanism for aberrant growth of the striatum would be evident in hyper connectivity between the cerebellum and the striatum.
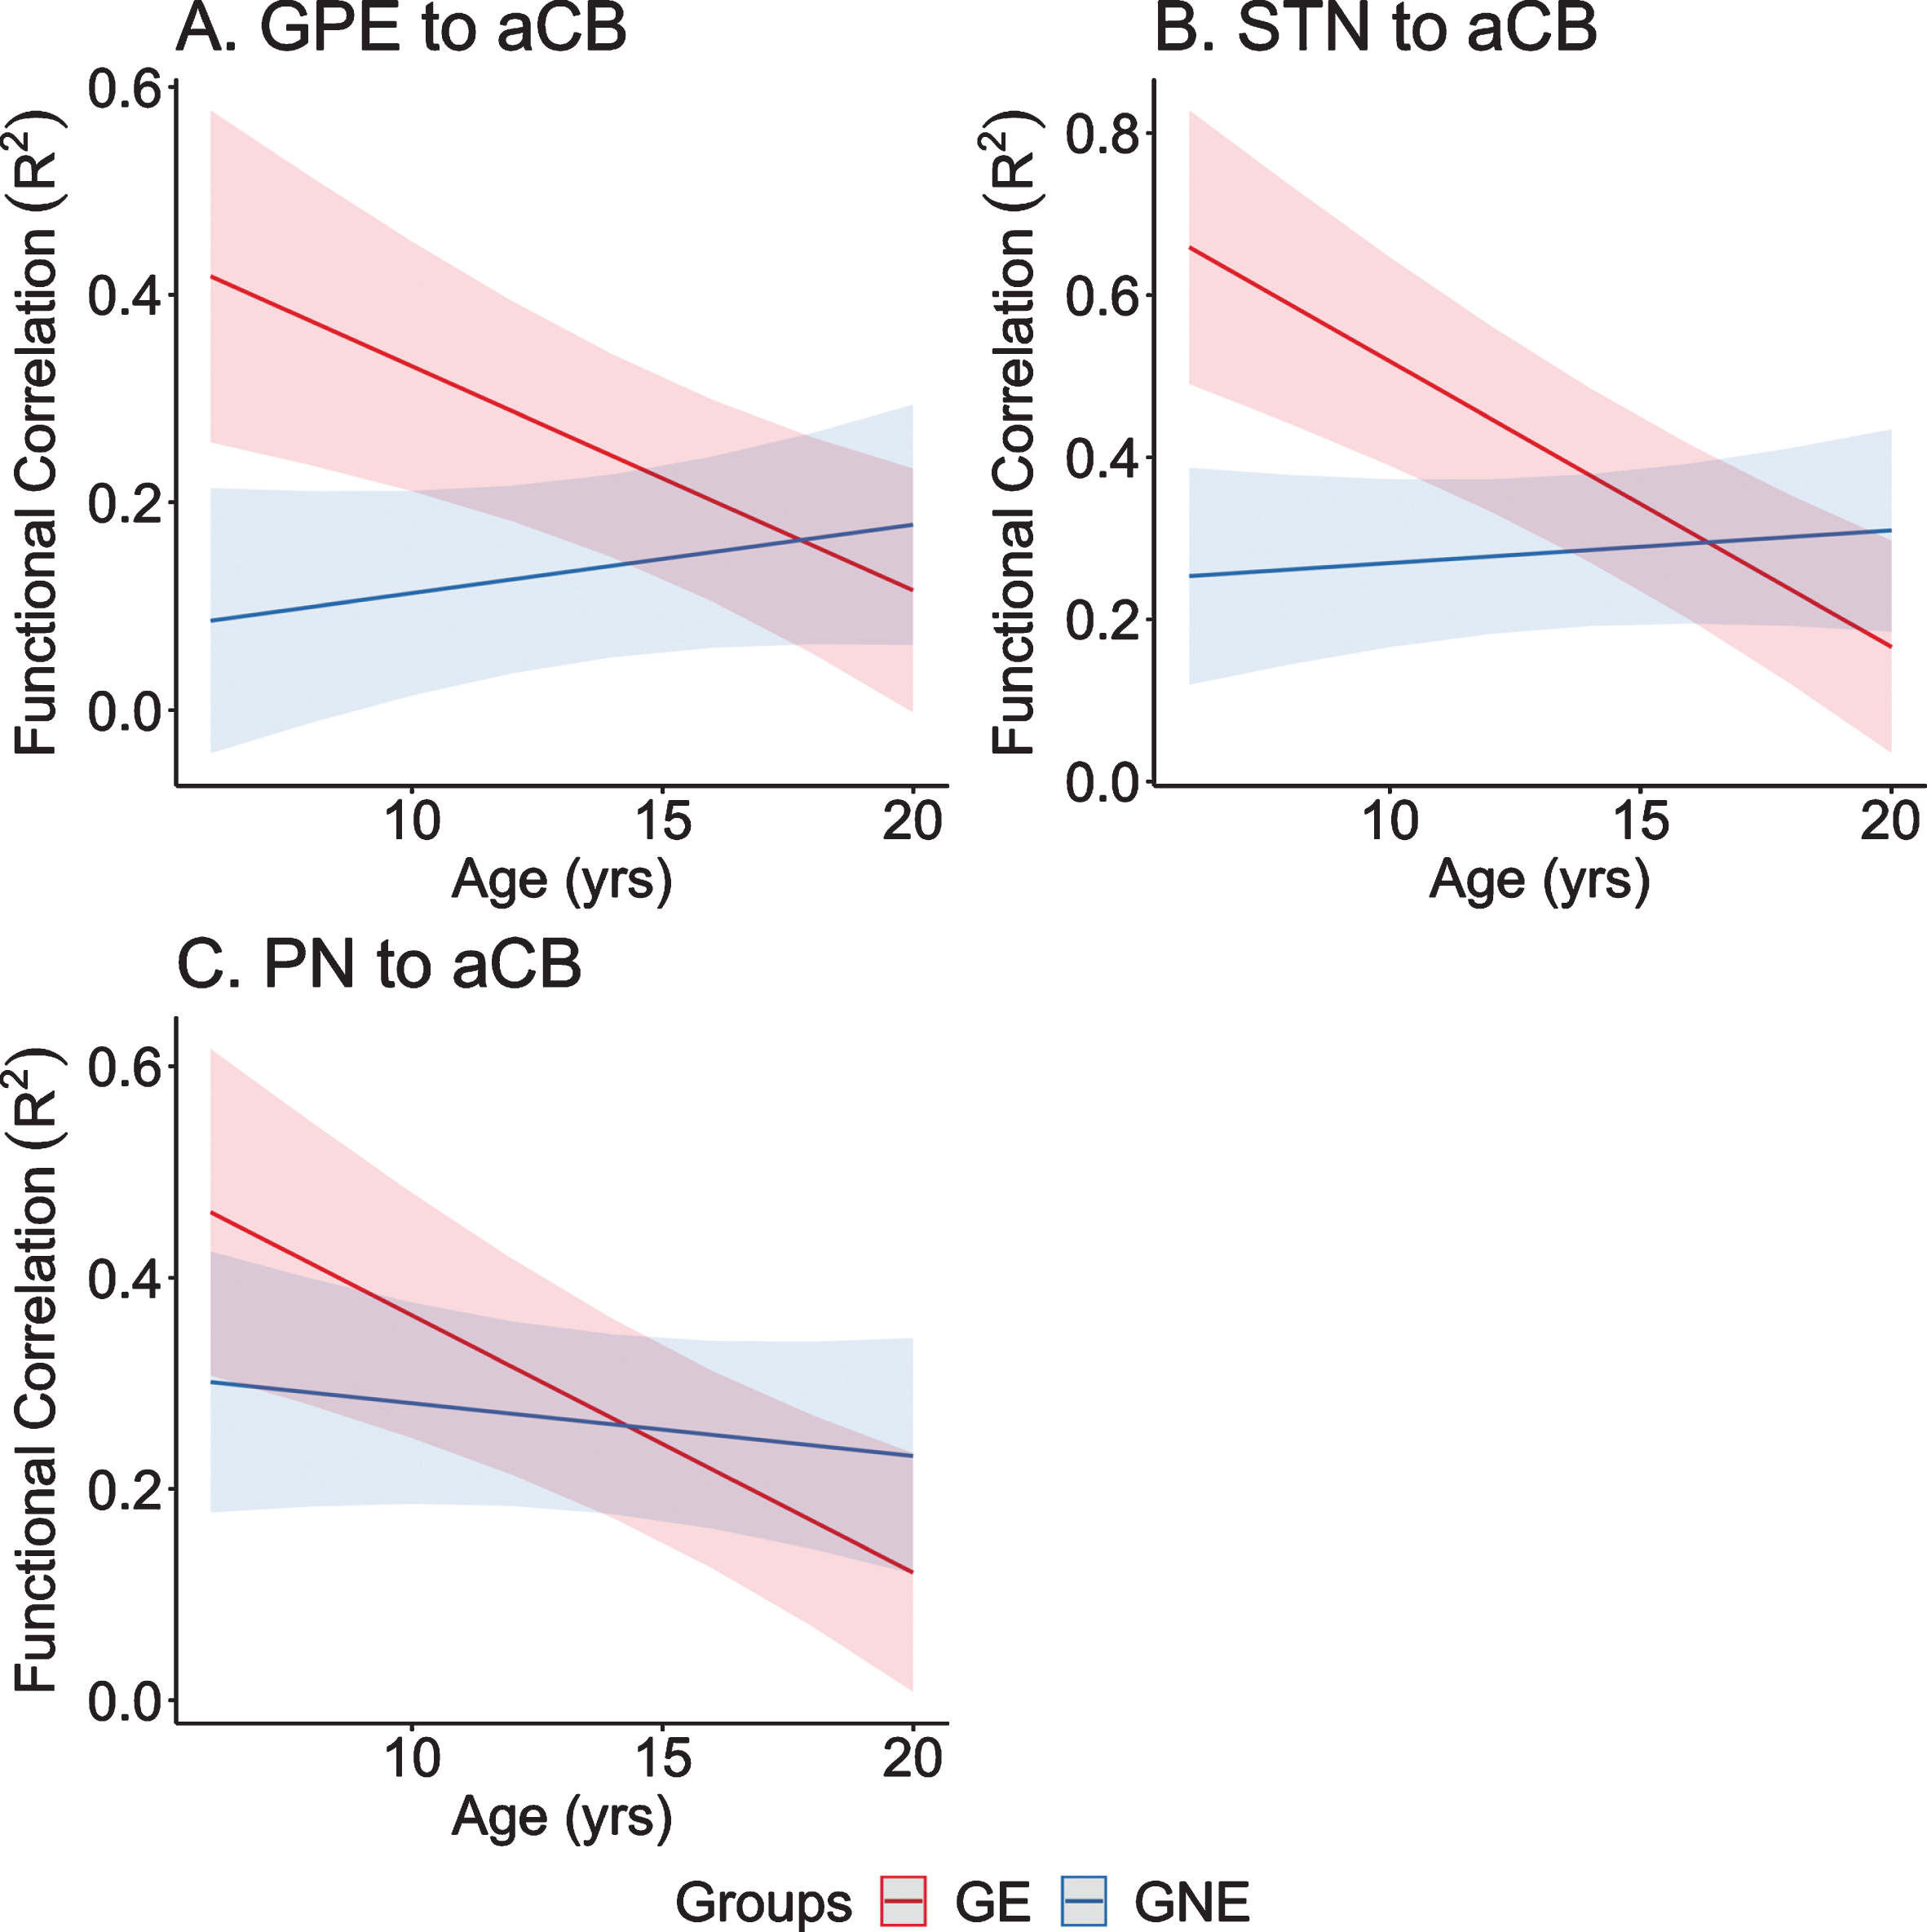
To test this hypothesis, we utilized resting-state, functional MRI (rs-fcMRI) data from participants enrolled in the Kids-HD study. Subjects were divided into Gene Expanded (GE) and Gene Non-Expanded (GNE) groups. Seed-to-seed correlations were calculated among four regions that provide input signals to the anterior cerebellum: 1) dorsocaudal putamen, 2) globus pallidus externa, 3) subthalamic nucleus, and 4) pontine nuclei; and two regions that represented output from the cerebellum: the dentate nucleus to the 1) ventrolateral thalamus and 2) dorsocaudal putamen. Higher correlations indicate stronger connectivity between selected nodes. Linear mixed effects regression models evaluated differences in developmental trajectories of these connections over time—a parallel analysis to van der Plas, et al. which looked at brain volume trajectories [44]. Consistent with the idea that the cerebellum plays a compensatory role in HD, four of the six striatal-cerebellum correlations showed significantly different trajectories between groups. As shown in Fig. 8, inputs to the anterior cerebellum (aCB) from the Globus Pallidus Externa (GPE), Sub-Thalamic Nucleus (STN), and Pontine Nuclei (PN) all showed a pattern where in the early age ranges (6–12 years) there was hyperconnectivity in the GE group compared to the GNE group, with those trajectories showing linear decline in the latter half of the age range. Consistent with the idea of a temporary ‘mutant steady state,’ the compensation afforded by increased connectivity with the cerebellum may not last.
Fig. 8
A–C) Predicted values from a linear mixed effects regression model of the functional connectivity (R2) between the striatal–cerebellar regions of interest (dependent variables) over time between groups (age×group interaction term). The model controlled for age, sex, and scanner, and included a sex×group interaction term and a random effect term per the participant’s slope of age, and a random effect term per family to account for participants who were siblings. aCB, anterior lobe of the cerebellum; dPU, dorsocaudal putamen; GE, gene-expanded; GNE, gene nonexpanded; GPE, globus pallidus externus; PN, pontine nucleus; STN, subthalamic nucleus.
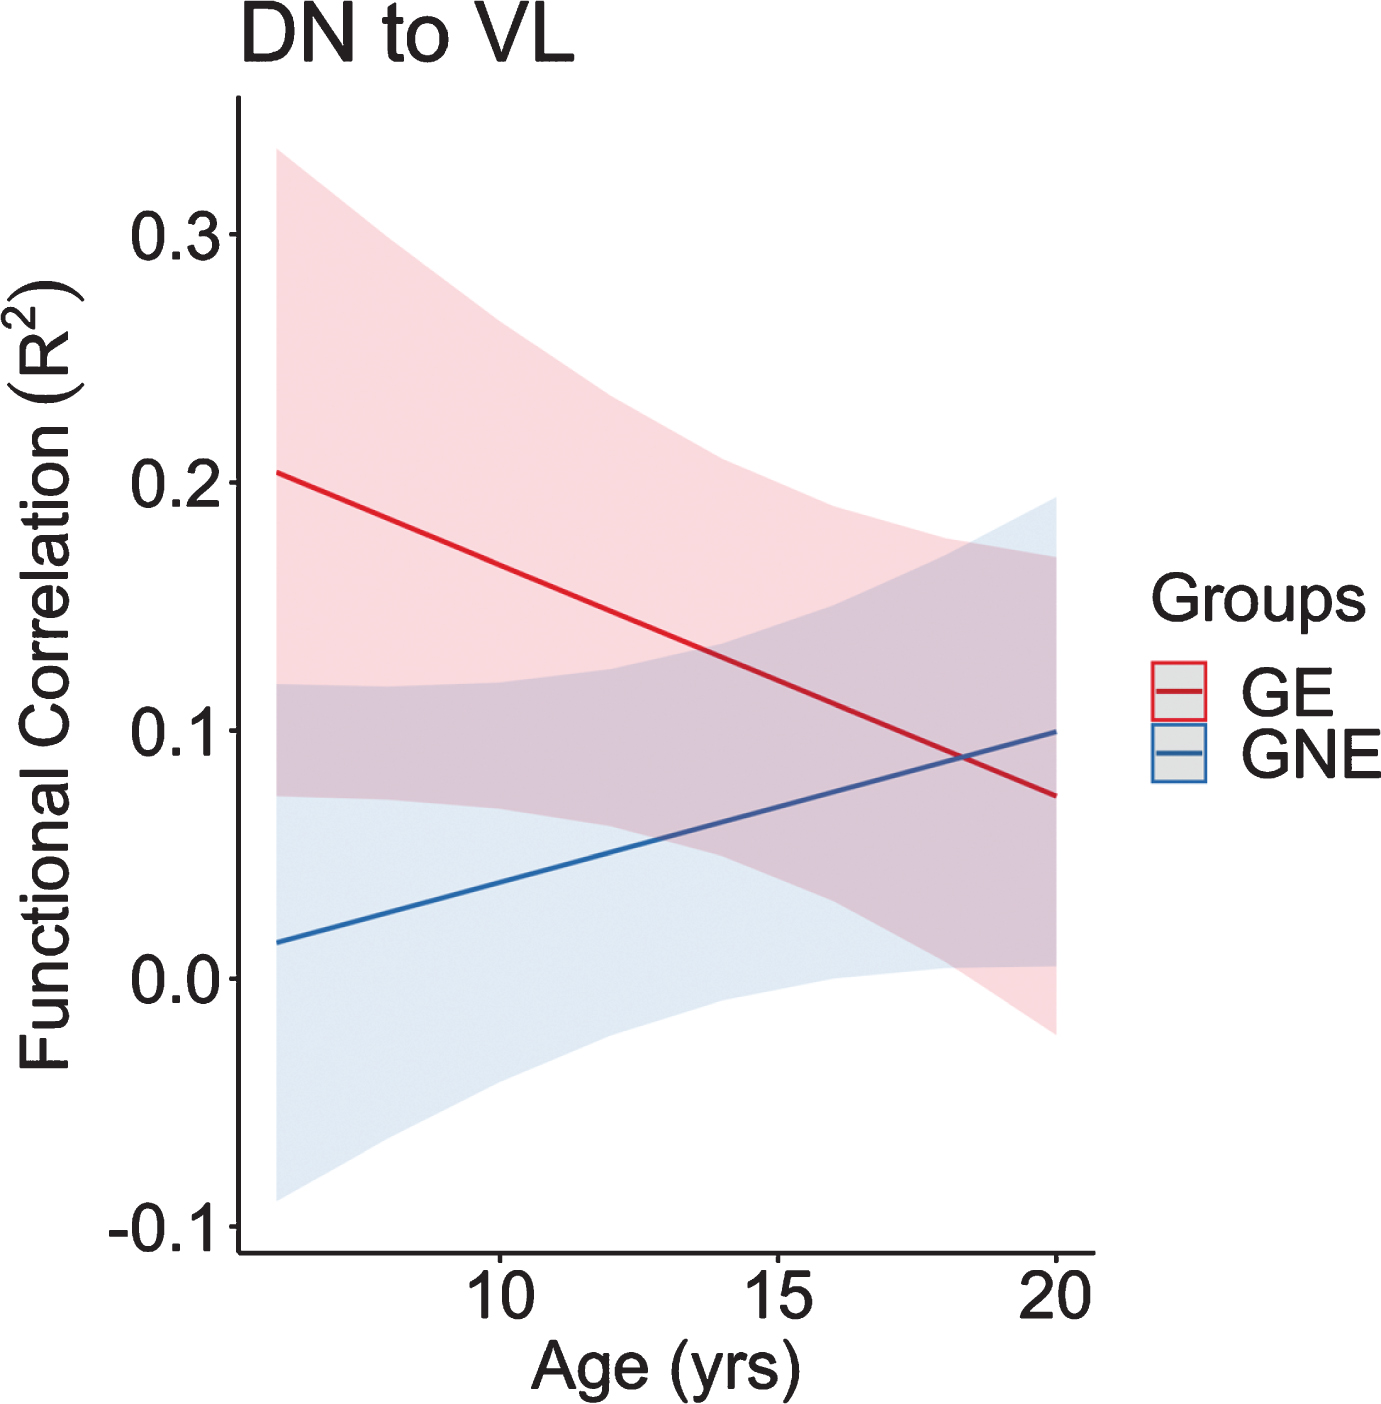
Regarding the cerebellar output regions of interest, the functional connectivity between the DN to VL changed at significantly different rates between groups as well (Fig. 9). Similar to the input seed to seed correlations, the connectivity in the GE group began at the youngest age remarkably higher than the GNE, followed by a significant decline in connectivity as GE children age. In contrast, the GNE group showed a positive slope with a modest increase in connectivity in this age range.
Fig. 9
This figure represents the predicted values from a linear mixed effects regression model of the functional connectivity (R2) between the dentate nucleus and ventrolateral nucleus of the thalamus (dependent variable) over time between groups (age×group interaction term). The model controlled for age, sex, and scanner, and included a sex×group interaction term and a random effect term per participant’s slope of age, and a random effect term per family to account for participants who were siblings. GE, gene expanded; GNE, gene nonexpanded.
The functional connectivity findings are remarkably similar to age-related structural development of the striatum in GE vs GNE groups. Recall that our structural neuroimaging results showed initial enlarged striatum in the GE group relative to the GNE group around age 6, followed by a linear decline in volume over time in the GE group. In contrast, the GNE group exhibited the normal pattern of volume increase followed by a decrease in volume in adolescence. The observed hypertrophy of the striatum could be associated with stronger cerebellum connectivity [44].
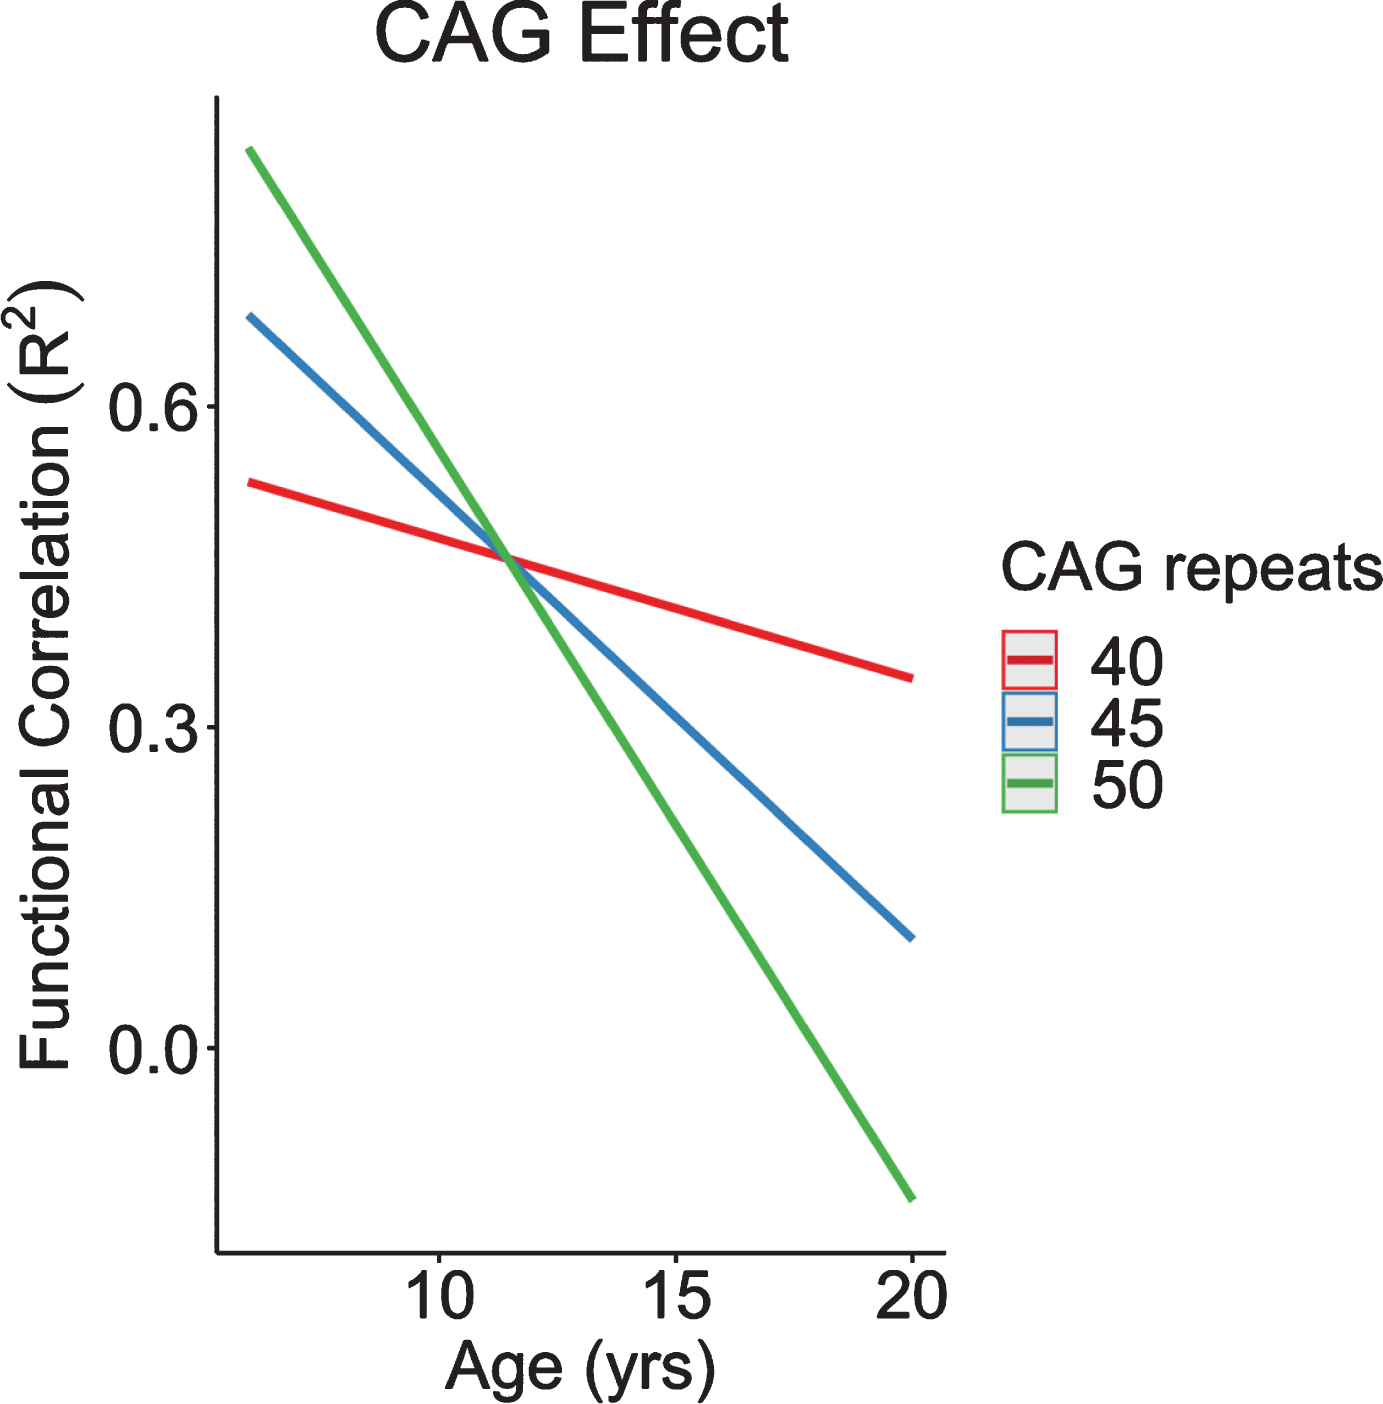
CAG was found to modulate connectivity between the STN and input into the cerebellum. Recapitulating our neuroanatomical results, increasingly higher CAG repeats were associated with increased connectivity at a young age, followed by an accelerated decline in connectivity across age (Fig. 10). In other words, the GE phenotype of cerebellum-striatum connectivity was exaggerated among individuals with increased CAG repeats.
Fig. 10
CAG effect over time in functional correlations between anterior lobe of the cerebellum and subthalamic nucleus. CAG, cytosine-adenine-guanine.
These results provide compelling evidence for the neurodevelopmental theory of neurodegeneration that postulates that HD starts with abnormal development of specific regions or circuits. Despite abnormal neuro-development, brain circuits are able to maintain relatively normal functioning due to developmental compensatory mechanisms. Early striatal enlargement, in combination with hyper-connectivity to the cerebellum could enable relatively normal striatal functioning. Tracing studies have shown the bidirectional communication that occurs between the cerebellum and basal ganglia, as output from the cerebellum to the striatum occurs via the DN, and the cerebellum receives input from the striatum via output from the STN [46]. The increased connectivity of the striatal input to the cerebellum may be expected given striatal enlargement; however, increase in the output from the cerebellum back to the striatum (via the thalamus) is the finding that most closely supports the concept of potential cerebellar compensation.
Cerebellar-striatum connectivity decreases over time in individuals who inherited mHTT, which may eventually give way to striatal dysfunction and symptom onset. This supposition is supported by a PET study that showed evidence of cerebellar and thalamic hypermetabolism in preHD individuals. Crucially, a drop in metabolism in these regions was associated with conversion to manifest HD [53]. If the cerebellum is indeed acting as compensation for a faulty striatum, it may be the loss of compensation (rather than primary striatal dysfunction) that is responsible for motor onset of HD. In our study, the connectivity dips below normal in the late teens yet these subjects are still far from motor onset. This is in parallel to the striatal developmental trajectories that show volumes of the striatum dipping below normal around age 12, yet subjects are still decades from symptom onset. This is consistent with the notion that the threshold for motor onset is far below normal, not simply at the point at which volumes (or connectivity) dip below the control group. This is substantiated by the large presymptomatic studies of PREDICT and TRACK that show the striatum volume being abnormally low nearly 20 years from onset of disease [54, 55].
PROPOSED MOLECULAR MECHANISMS FOR CREATING THE ENTIRE SPECTRUM OF PHENOTYPES
The molecular mechanism by which increasing HTT repeats could translate into variability in function may be related to subtle changes in the way HTT creates multi protein complex formations [56]. The CAG repeat in HTT codes for glutamine, which is referred to as Q. Therefore, genes with CAG repeats are referred to as having PolyQ tracts in them. PolyQ tracts in proteins stabilize protein interactions, most likely through conformational changes facilitated by the tract [57]. In HTT specifically, the polyQ tract can form a flexible domain of the protein, allowing the flanking domains to come into close spatial proximity. Expanded repeats (>40) could produce a ‘rusty hinge’ rendering it non-functional [58]. Extending this phenomenon, it is possible that below disease threshold, the number of repeats manifest in increasingly greater flexibility with a point of optimal intramolecular proximity, conformation, and function of the protein. Figure 11 is a representation of this concept.
Fig. 11
Model of proposed mechanism by which changes in Poly Q (glutamine) leads to changes in protein conformation and subsequent functional changes.
REDEFINING THE PHASES OF HUNTINGTON’S DISEASE
Given the findings of our study of children at risk for HD, it is appropriate to consider a conceptualization of the disease process in three stages: 1) the developmental stage; 2) the premanifest stage; and 3) the manifest stage. The developmental stage is the time during which mHTT affects the structural growth and connectivity of the striatal cerebellar circuitry. The striatum is held in mutant steady state by compensatory cerebellum mechanisms preventing overt symptom manifestation and cell death. The premanifest stage of the disease has been well-studied by the large multi-site programs such as PREDICT [54] and TRACK [59] and show changes in brain structure and function occurring up to 15 years before motor onset. Neurofilament Light (NfL) has been identified as a potential biomarker of the earliest phases of neural degeneration during the pre-manifest stage of HD [60]. The manifest stage of the disease is defined by significant motor symptoms that are the harbinger of premature death approximately 15 years after the first motor symptoms.
CONCLUSION
Current gene therapy trials evaluate the effectiveness of drugs to slow disease progression. However, the ultimate goal is to prevent disease. Understanding the entire disease process is vital when making decisions on when to deliver gene therapy. There are three important factors to consider in the context of delivering preventive gene therapy: 1) mHTT impacts brain development; 2) mHTT impacts brain development in a CAG repeat-dependent fashion with higher repeats creating greater developmental changes; and 3) human brain development is prolonged, with maturational changes such as programmed synaptic elimination and myelin deposition occurring through at least age 30 [61]. Determining when to intervene may well depend on both length of CAG repeat and age of the GE subject. Important next steps in our analysis of the Kids-HD study is modeling brain function (cognitive tasks) trajectories. Figure 3 showing higher repeats with lower IQs is a cross sectional analysis and does not show how cognition is developed over time. Although the children with the higher repeats are still far from onset, many of them could be approaching the premanifest stage of disease and could already be experiencing a drop in cognitive function. The optimum time of delivery for gene therapy will be the point at which cognitive function has peaked developmentally and prior to its decline in the premanifest stage. For those with repeats in the 40–44 range, the premanifest stage may not begin until much later in life, however for those with repeats 45 and greater—and in particular for those with repeats greater than 50—the point between the developmental phase and premanifest stage may well be quite early in life, during the childhood years.
The Kids-HD study was recently renewed by the NINDS with the following updates. First, we are expanding to a five-site study with participating institutes across the US. Second, we are enrolling subjects between the ages of 6 to 30 years old, expanding our sample to include young adults who are often overlooked in HD research. Our new study is called CHild to Adult Neurodevelopment in Gene-Expanded Huntington’s Disease, or CHANGE-HD. The major goal of CHANGE-HD is to replicate findings from Kids-HD and collect robust findings to help guide preventive gene therapy for HD.
CONFLICT OF INTEREST
There are no conflicts of interest for any of the authors.
ACKNOWLEDGMENTS
This study was supported by CHDI and NINDS Grant #NS055903. We thank all of the children and families that participated in our study
REFERENCES
[1] | Leavitt BR , Tabrizi SJ . Antisense oligonucleotides for neurodegeneration. Science. (2020) ;367: (6485):1428–9. |
[2] | Tabrizi SJ , Leavitt BR , Landwehrmeyer GB , Wild EJ , Saft C , Barker RA , et al. Targeting huntingtin expression in patients with Huntington’s disease. N Engl J Med. (2019) ;380: (24):2307–16. |
[3] | Mehler MF , Gokhan S . Mechanisms underlying neural cell death in neurodegenerative diseases: Alterations of a developmentally-mediated cellular rheostat. Trends Neurosci. (2000) ;23: (12):599–605. |
[4] | Gallardo-Orihuela A , Hervas-Corpion I , Hierro-Bujalance C , Sanchez-Sotano D , Jimenez-Gomez G , Mora-Lopez F , et al. Transcriptional correlates of the pathological phenotype in a Huntington’s disease mouse model. Sci Rep. (2019) ;9: (1):18696. |
[5] | Conforti P , Besusso D , Bocchi VD , Faedo A , Cesana E , Rossetti G , et al. Faulty neuronal determination and cell polarization are reverted by modulating HD early phenotypes. Proc Natl Acad Sci U S A. (2018) ;115: (4):E762–E771. |
[6] | Wiatr K , Szlachcic WJ , Trzeciak M , Figlerowicz M , Figiel M . Huntington disease as a neurodevelopmental disorder and early signs of the disease in stem cells. Mol Neurobiol. (2018) ;55: (4):3351–71. |
[7] | Besusso D , Schellino R , Boido M , Belloli S , Parolisi R , Conforti P , et al. Stem cell-derived human striatal progenitors innervate striatal targets and alleviate sensorimotor deficit in a rat model of Huntington disease. Stem Cell Rep. (2020) ;14: (5):876–91. |
[8] | Delli Carri A , Onorati M , Lelos MJ , Castiglioni V , Faedo A , Menon R , et al. Developmentally coordinated extrinsic signals drive human pluripotent stem cell differentiation toward authentic DARPP-32+ medium-sized spiny neurons. Development. (2013) ;140: (2):301–12. |
[9] | Conforti P , Camnasio S , Mutti C , Valenza M , Thompson M , Fossale E , et al. Lack of huntingtin promotes neural stem cells differentiation into glial cells while neurons expressing huntingtin with expanded polyglutamine tracts undergo cell death. Neurobiol Dis. 2013;50160-170. |
[10] | Trettel F , Rigamonti D , Hilditch-Maguire P , Wheeler VC , Sharp AH , Persichetti F , et al. Dominant phenotypes produced by the HD mutation in STHdh(Q111) striatal cells. Hum Mol Genet. (2000) ;9: (19):2799–809. |
[11] | Valenza M , Marullo M , Di Paolo E , Cesana E , Zuccato C , Biella G , et al. Disruption of astrocyte-neuron cholesterol cross talk affects neuronal function in Huntington’s disease. Cell Death Differ. (2015) ;22: (4):690–702. |
[12] | Zuccato C , Conti L , Reitano E , Tartari M , Cattaneo E . The function of the neuronal proteins Shc and huntingtin in stem cells and neurons: Pharmacologic exploitation for human brain diseases. Ann N Y Acad Sci. 2005;104939-50. |
[13] | Arteaga-Bracho EE , Gulinello M , Winchester ML , Pichamoorthy N , Petronglo JR , Zambrano AD , et al. Postnatal and adult consequences of loss of huntingtin during development: Implications for Huntington’s disease. Neurobiol Dis. 2016;96144-155. |
[14] | Molero AE , Arteaga-Bracho EE , Chen CH , Gulinello M , Winchester ML , Pichamoorthy N , et al. Selective expression of mutant huntingtin during development recapitulates characteristic features of Huntington’s disease. Proc Natl Acad Sci U S A. (2016) ;113: (20):5736–41. |
[15] | Mehler MF , Petronglo JR , Arteaga-Bracho EE , Gulinello ME , Winchester ML , Pichamoorthy N , et al. Loss-of-huntingtin in medial and lateral ganglionic lineages differentially disrupts regional interneuron and projection neuron subtypes and promotes Huntington’s disease-associated behavioral, cellular, and pathological hallmarks. J Neurosci. (2019) ;39: (10):1892–909. |
[16] | Nguyen GD , Gokhan S , Molero AE , Mehler MF . Selective roles of normal and mutant huntingtin in neural induction and early neurogenesis. PLoS One. (2013) ;8: (5):e64368. |
[17] | Barnat M , Le Friec J , Benstaali C , Humbert S . Huntingtin-mediated multipolar-bipolar transition of newborn cortical neurons is critical for their postnatal neuronal morphology. Neuron. (2017) ;93: (1):99–114. |
[18] | Godin JD , Colombo K , Molina-Calavita M , Keryer G , Zala D , Charrin BC , et al. Huntingtin is required for mitotic spindle orientation and mammalian neurogenesis. Neuron. (2010) ;67: (3):392–406. |
[19] | Mackenzie KD , Lim Y , Duffield MD , Chataway T , Zhou XF , Keating DJ . Huntingtin-associated protein-1 (HAP1) regulates endocytosis and interacts with multiple trafficking-related proteins. Cell Signal. 2017;35176-187. |
[20] | Thomas EA , Coppola G , Tang B , Kuhn A , Kim S , Geschwind DH , et al. In vivo cell-autonomous transcriptional abnormalities revealed in mice expressing mutant huntingtin in striatal but not cortical neurons. Hum Mol Genet. (2011) ;20: (6):1049–60. |
[21] | McKinstry SU , Karadeniz YB , Worthington AK , Hayrapetyan VY , Ozlu MI , Serafin-Molina K , et al. Huntingtin is required for normal excitatory synapse development in cortical and striatal circuits. J Neurosci. . (2014) ;34: (28):9455–72. |
[22] | Cepeda C , Oikonomou KD , Cummings D , Barry J , Yazon VW , Chen DT , et al. Developmental origins of cortical hyperexcitability in Huntington’s disease: Review and new observations. J Neurosci Res. (2019) ;97: (12):1624–35. |
[23] | Fondon JW 3rd , Hammock EA , Hannan AJ , King DG . Simple sequence repeats: Genetic modulators of brain function and behavior. Trends Neurosci. (2008) ;31: (7):328–34. |
[24] | Kashi Y , King DG . Simple sequence repeats as advantageous mutators in evolution. Trends Genet.. (2006) ;22: (5):253–9. |
[25] | King DG . Evolution of simple sequence repeats as mutable sites. Adv Exp Med Biol. 2012;76910-25. |
[26] | Tartari M , Gissi C , Lo Sardo V , Zuccato C , Picardi E , Pesole G , et al. Phylogenetic comparison of huntingtin homologues reveals the appearance of a primitive polyQ in sea urchin. Mol Biol Evol. (2008) ;25: (2):330–8. |
[27] | Gusella JF , MacDonald ME . Huntington’s disease: Seeing the pathogenic process through a genetic lens. Trends Biochem Sci. (2006) ;31: (9):533–40. |
[28] | Spires TL , Hannan AJ . Molecular mechanisms mediating pathological plasticity in Huntington’s disease and Alzheimer’s disease. J Neurochem. (2007) ;100: (4):874–82. |
[29] | Mehta SR , Tom CM , Wang Y , Bresee C , Rushton D , Mathkar PP , et al. Human Huntington’s disease iPSC-derived cortical neurons display altered transcriptomics, morphology, and maturation. Cell Rep. (2018) ;25: (4):1081–96 e1086. |
[30] | Hannan AJ . Tandem repeat polymorphisms: Modulators of disease susceptibility and candidates for ‘missing heritability’. Trends Genet. (2010) ;26: (2):59–65. |
[31] | Nithianantharajah J , Hannan AJ . Dynamic mutations as digital genetic modulators of brain development, function and dysfunction. Bioessays. (2007) ;29: (6):525–35. |
[32] | Seong IS , Ivanova E , Lee JM , Choo YS , Fossale E , Anderson M , et al. HD CAG repeat implicates a dominant property of huntingtin in mitochondrial energy metabolism. Hum Mol Genet. (2005) ;14: (19):2871–80. |
[33] | Lee JK , Conrad A , Epping E , Mathews K , Magnotta V , Dawson JD , et al. Effect of trinucleotide repeats in the Huntington’s gene on intelligence. EBioMedicine. 2018;3147-53. |
[34] | Lee JK , Ding Y , Conrad AL , Cattaneo E , Epping E , Mathews K , et al. Sex-specific effects of the Huntington gene on normal neurodevelopment. J Neurosci Res. (2017) ;95: (1-2):398–408. |
[35] | Lee JM , Ramos EM , Lee JH , Gillis T , Mysore JS , Hayden MR , et al. CAG repeat expansion in Huntington disease determines age at onset in a fully dominant fashion. Neurology. (2012) ;78: (10):690–5. |
[36] | Quarrell O , O’Donovan KL , Bandmann O , Strong M . The prevalence of juvenile Huntington’s disease: A review of the literature and meta-analysis. PLoS Curr. 2012;4e4f8606b8742ef8603. |
[37] | Plomin R , Deary IJ . Genetics and intelligence differences: Five special findings. Mol Psychiatry. (2015) ;20: (1):98–108. |
[38] | Plomin R , McClearn GE , McGiffin P , DeFried J . Behavioral Genetics, Fifth ed. New York, New York: Worth; 2008. |
[39] | Chabris CF , Hebert BM , Benjamin DJ , Beauchamp J , Cesarini D , van der Loos M , et al. Most reported genetic associations with general intelligence are probably false positives. Psychol Sci. (2012) ;23: (11):1314–23. |
[40] | Trampush JW , Yang ML , Yu J , Knowles E , Davies G , Liewald DC , et al. GWAS meta-analysis reveals novel loci and genetic correlates for general cognitive function: A report from the COGENT consortium. Mol Psychiatry. (2017) ;22: (3):336–45. |
[41] | Kubera KM , Schmitgen MM , Hirjak D , Wolf RC , Orth M . Cortical neurodevelopment in pre-manifest Huntington’s disease. Neuroimage Clin. 2019;23101913. |
[42] | Mangin JF , Riviere D , Duchesnay E , Cointepas Y , Gaura V , Verny C , et al. Neocortical morphometry in Huntington’s disease: Indication of the coexistence of abnormal neurodevelopmental and neurodegenerative processes. Neuroimage Clin. 2020;26102211. |
[43] | Vijayakumar N , Mills KL , Alexander-Bloch A , Tamnes CK , Whittle S . Structural brain development: A review of methodological approaches and best practices. Dev Cogn Neurosci. 2018;33129-148. |
[44] | van der Plas E , Langbehn DR , Conrad AL , Koscik TR , Tereshchenko A , Epping EA , et al. Abnormal brain development in child and adolescent carriers of mutant huntingtin. Neurology. (2019) ;93: (10):e1021–e1030. |
[45] | Tereshchenko AV , Schultz JL , Bruss JE , Magnotta VA , Epping EA , Nopoulos PC . Abnormal development of cerebellar-striatal circuitry in Huntington disease. Neurology. (2020) ;94: (18):e1908–e1915. |
[46] | Bostan AC , Dum RP , Strick PL . Cerebellar networks with the cerebral cortex and basal ganglia. Trends Cogn Sci. (2013) ;17: (5):241–54. |
[47] | Bostan AC , Strick PL . The cerebellum and basal ganglia are interconnected. Neuropsychol Rev. (2010) ;20: (3):261–70. |
[48] | Bostan AC , Dum RP , Strick PL . The basal ganglia communicate with the cerebellum. Proc Natl Acad Sci U S A. (2010) ;107: (18):8452–6. |
[49] | Wolf RC , Thomann PA , Sambataro F , Wolf ND , Vasic N , Landwehrmeyer GB , et al. Abnormal cerebellar volume and corticocerebellar dysfunction in early manifest Huntington’s disease. J Neurol. (2015) ;262: (4):859–69. |
[50] | Rees EM , Farmer R , Cole JH , Haider S , Durr A , Landwehrmeyer B , et al. Cerebellar abnormalities in Huntington’s disease: A role in motor and psychiatric impairment? Mov Disord. (2014) ;29: (13):1648–54. |
[51] | Gaura V , Lavisse S , Payoux P , Goldman S , Verny C , Krystkowiak P , et al. Association between motor symptoms and brain metabolism in early Huntington disease. JAMA Neurol. (2017) ;74: (9):1088–96. |
[52] | Aylward EH . Change in MRI striatal volumes as a biomarker in preclinical Huntington’s disease. Brain Res Bull. (2007) ;72: (2-3):152–8. |
[53] | Feigin A , Tang C , Ma Y , Mattis P , Zgaljardic D , Guttman M , et al. Thalamic metabolism and symptom onset in preclinical Huntington’s disease. Brain. (2007) ;130: (Pt 11):2858–67. |
[54] | Paulsen JS , Long JD , Ross CA , Harrington DL , Erwin CJ , Williams JK , et al. Prediction of manifest Huntington’s disease with clinical and imaging measures: A prospective observational study. Lancet Neurol. (2014) ;13: (12):1193–201. |
[55] | Tabrizi SJ , Scahill RI , Owen G , Durr A , Leavitt BR , Roos RA , et al. Predictors of phenotypic progression and disease onset in premanifest and early-stage Huntington’s disease in the TRACK-HD study: Analysis of 36-month observational data. Lancet Neurol. (2013) ;12: (7):637–49. |
[56] | Cattaneo E , Zuccato C , Tartari M . Normal huntingtin function: An alternative approach to Huntington’s disease. Nat Rev Neurosci. (2005) ;6: (12):919–30. |
[57] | Schaefer MH , Wanker EE , Andrade-Navarro MA . Evolution and function of CAG/polyglutamine repeats in protein-protein interaction networks. Nucleic Acids Res. (2012) ;40: (10):4273–87. |
[58] | Caron NS , Desmond CR , Xia J , Truant R . Polyglutamine domain flexibility mediates the proximity between flanking sequences in huntingtin. Proc Natl Acad Sci U S A. (2013) ;110: (36):14610–5. |
[59] | Tabrizi SJ , Reilmann R , Roos RA , Durr A , Leavitt B , Owen G , et al. Potential endpoints for clinical trials in premanifest and early Huntington’s disease in the TRACK-HD study: Analysis of 24 month observational data. Lancet Neurol. (2012) ;11: (1):42–53. |
[60] | Byrne LM , Rodrigues FB , Johnson EB , Wijeratne PA , De Vita E , Alexander DC , et al. Evaluation of mutant huntingtin and neurofilament proteins as potential markers in Huntington’s disease. Sci Transl Med. (2018) ;10: (458). |
[61] | Lebel C , Beaulieu C . Longitudinal development of human brain wiring continues from childhood into adulthood. J Neurosci. (2011) ;31: (30):10937–47. |


