
Characterization of Neurodevelopmental Abnormalities in iPSC-Derived Striatal Cultures from Patients with Huntington’s Disease
Abstract
Background:
Huntington’s disease (HD) is an inherited neurodegenerative disease and is characterized by atrophy of certain regions of the brain in a progressive manner. HD patients experience behavioral changes and uncontrolled movements which can be primarily attributed to the atrophy of striatal neurons. Previous publications describe the models of the HD striatum using induced pluripotent stem cells (iPSCs) derived from HD patients with a juvenile onset (JHD). In this model, the JHD iPSC-derived striatal cultures had altered neurodevelopment and contained a high number of nestin expressing progenitor cells at 42 days of differentiation.
Objective:
To further characterize the altered neurodevelopmental phenotype and evaluate potential phenotypic reversal.
Methods:
Differentiation of human iPSCs towards striatal fate and characterization by means of immunocytochemistry and stereological quantification.
Results:
Here this study demonstrates a distinct delay in the differentiation of the JHD neural progenitor population. However, reduction of the JHD aberrant progenitor populations can be accomplished either by targeting the canonical Notch signaling pathway or by treatment with HTT antisense oligonucleotides (ASOs).
Conclusions:
In summary, this data is postulated to reflect a potential overall developmental delay in JHD.
INTRODUCTION
Huntington’s disease (HD) is a progressive and fatal neurodegenerative disorder that manifests in motor symptoms, cognitive decline, and emotional disturbances [1–3]. Symptoms include depression [2, 3], chorea, and behavioral/emotional disturbances [4], leading to an eventual loss of cognitive function [5–8]. HD is most prevalent in the Caucasian population, affecting around 5 to 7 in 100,000 people, and is less in Asian population [9, 10]. The average age of onset for HD is between 30–50 years of age, although it may vary dramatically from patient to patient. Effect of gender differences is shown to have minor and clinically insignificant impact on the progression rate of the disease [11].
HD is a monogenic, autosomal dominant disorder that is caused by a ‘CAG’ trinucleotide repeat expansion, with greater than 35 repeats, in the exon 1 of huntingtin (HTT) gene [12, 13]. The number of repeats is inversely correlated with the age of onset and the severity of the disease, although the relationship is non-linear [14]. Individuals with CAG repeats between 36–40, exhibit a much less severe form of HD with later onset and slower progression. A small population of patients carry more than 60 CAG repeats, which causes a severe phenotype with juvenile onset (JHD) [15]. Despite being ubiquitously expressed and having an array of cellular functions [16, 17], the expanded HTT repeat primarily affects the main neuron of striatum (medium spiny neuron (MSN) [18]) followed by the projection neurons of the cerebral cortex [14].
Animal models of HD have proven valuable in the understanding of the disease, however species variations between humans and animals attribute to poor mimicry of disease [20, 21], which can contribute to failure of a number of translational therapies in humans which had shown promise in animal models [22]. Animal models of HD must be generated via introduction of a transgenic expanded repeat, since HD does not naturally occur in animals. The hippocampus – a neurogenic region of the brain – of HD mouse brain revealed higher number of nestin-expressing neural progenitor cells (neNPC) [15]. Selective expression of mHTT in HD mouse model during development showed similar phenotype with the group of mice in which mHTT was expressed all throughout development and adult life [26]. JHD also resembles a neurodevelopmental disorder [27].
Prior to the discovery of ESCs, human brain tissues were only available post-mortem, making developmental investigation of the disease pathophysiology limited. But with the use of induced pluripotent stem cells, somatic cells reprogrammed to embryonic state [23–25], gave new ability to focus on the origins of HD in human brain tissues generated in vitro. Human iPSC can not only recapitulate the disease phenotype after onset, it can also provide critical information about the pathogenesis of disease and progression [28]. Human iPSC derived disease model may be used as powerful tools to discover novel sites for therapeutic intervention and subsequent high throughput drug screening and bioinformatical analysis [29]. Protocols to develop in vitro striatal neurons from human pluripotent stem cells have attempted to mimic similar approach to embryonic striatal development [14]. HD iPSCs are an excellent model as they recapitulate human neural development in vitro and also replicate phenotypes found in HD model organisms and human patients [14]. The iPSC lines were therefore, generated from JHD patients with 180, 109, 77, 71, and 60 CAG repeats and control subjects with 33, 28, 21, and 18 CAG repeats.
These findings support the hypothesis that mHTT causes an altered developmental phenotype in the striatum, leaving these cells susceptible to disease development as adults by hampering neuronal homeostasis during development. Staining for proliferation marker Ki67 to examine overall proliferation levels in JHD and control cultures did not show any significant difference. These findings reveal a population of neNPC in JHD cultures which are not newly born and are reluctant to differentiate therefore termed “persistent” [15]. This study demonstrates a true delay in JHD striatal development using iPSC-based model. Striatal cultures from JHD cell lines displayed increased number of neNPCs on days 14, 28, and 42; which after further differentiation decreased. This increased expression of nestin was found to be reversible by the knockdown of mHTT over the course of differentiation as well as by inhibition of canonical Notch pathway.
MATERIALS AND METHODS
Generation of neural progenitor (“EZ”) spheres from iPSCs
JHD (180, 109, 77, 71, and 60 CAG repeats) and control (33, 28, 21, and 18 CAG repeats) iPSC colonies (Supplementary Table 1) were generated by the iPSC Core Facility within the Board of Governors Regenerative Medicine Institute at Cedars-Sinai, grown on Matrigel with mTeSR media (STEM CELL, 05851) in a feeder free condition [15]. They were lifted and transferred to hiEFH media (100 ng/ml EGF and FGF-2, Peprotech, Rocky Hill, NJ, USA) to grow as floating neural progenitor spheres (NPCs: here after referred as EZ spheres). These lines were all approved for use under IRB/SCRO protocols Pro00021505 and Pro00024899.
Striatal differentiation of EZ spheres
8–10 EZ spheres were plated per well on Poly-L-ornithine (PLO) coated glass coverslips treated with mixture of Matrigel (0.5 mg/plate) and laminin (1:6 in DMEM). The spheres were then differentiated in neural induction media (DMEM:F12, 1% PSA, and 1% N2) for 7 days. After 7 days, cells were differentiated using Phase 3 striatal media (Neural Induction Media, 20 ng/ml BDNF; PeproTech Inc Cat#450-02-1MG, 200 ng/ml rhSHH; PeproTech Inc #100-45-100UG, and 100 ng/ml rhDKK-1; PeproTech Inc Cat#120-30-500UG) for next 21 days. On the 28th day, Phase 4 media (Neural Induction Media, 20 ng/ml BDNF; 0.5 mM dbcAMP; Sigma Aldrich, 0.5 mM Valproic Acid) was used to differentiate the cells until 42 days and 56 days. The cells were refed in with 50% new media and 50% conditioned media three times a week. For the differentiations, up to five JHD cell lines (CS97iHD180, CS09iHD109, CS77iHD77, CS81iHD71, and/or CS21iHD60) and up to four control cell lines (CS83iCTR33, CS14iCTR28, CS00iCTR21, and/or CS25iCTR18) were used.
Partial Knockdown of HTT using ASO
The aforementioned striatal protocol was employed to differentiate EZ spheres in four different conditions, untreated, treated with scrambled ASO (IONIS #141923) [15], treated with mtHTT-specific ASO (IONIS #572772) [15] and treated with non-allele specific HTT ASO (IONIS #4375327) [30]. The cells were treated for either one week (days 35–42 of differentiation) or throughout the entire differentiation protocol (days 0–42 of differentiation), where ASOs were directly added to the media. Half of the media was replaced three times a week. For these experiments, four JHD cell lines (CS97iHD180n2, CS09iHD109n1, CS77iHD77n5, CS81iHD71n1) and four control cell lines (CS83iCTR33n2, CS14iCTR28n5, CS00iCTR21n2, CS25iCTR18n5) were used.
Knock-down was determined by quantitative real-time PCR. Cells were treated throughout the entire differentiation protocol, as described above. Cells were harvested by scraping, cells were spun at ∼300 g for 5 minutes. RNA was extracted using the Qiagen RNeasy kit (74104), per manufacturer’s instructions. RNA was DNAse treated using Promega RQ1 DNAse (M6101), then cDNA was generated using Promega AMV reverse transcriptase system (A1260) per manufacturer’s instructions. SYBR green (Thermofisher A25780) was then used to amplify the cDNA for HTT (Huntingtin: forward 5’ AAACTTCTGGGATCGCTAATG 3’, reverse 5’ GTTGAGGCATTCGTCAGCCA 3’) and GAPDH (GAPDH: forward 5’ GAGTCAACGGATTTGGTCGT 3’, reverse 5’ TTGATTTTGGAGGGATCTCG 3’), which was used as an internal control, per manufacturer’s instructions. 2∧-ΔΔCt method was then used to calculate the ratio of HTT (GAPDH normalized) in the untreated versus the scramble ASO treated or the non-allele specific HTT ASO-treated samples. Statistical analyses were performed using a student’s t test. All experiments were performed in three separate samples.
Inhibition of canonical Notch pathway
The cells were differentiated towards striatal fate for 42 days. The cells were treated with 10 μM DAPT from day 35 to day 42 of striatal differentiation. Half the cells were left untreated, to act as controls. The cells were refed three times per week with a combination of 50% conditioned media and 50% fresh media. Five JHD (CS97iHD180n2, CS09iHD109n1, CS77iHD77n5, CS81iHD71n1, CS21iHD60n8) and four control (CS83iCTR33n2, CS14iCTR28n5, CS00iCTR21n2, CS25iCTR18n5) cell lines were used for this project.
Immunocytochemistry
After fixation, the coverslips were taken from the 24 well plates and placed in the humid chamber. Then, 30 μl of 0.2% Triton-x-100 in PBS was added and waited for at least 15 minutes. The Triton-x-100 in PBS was aspirated, and cells were incubated with 30 μl of primary antibodies at 4°C for overnight. The primary antibodies working stocks were made using 0.2% Triton-x-100 in PBS. The primary antibodies used are as follows: mouse anti-nestin antibody (Millipore, Mab5326, 1:200), rabbit Ki67 polyclonal antibody (Vector LAB, VP-K451, 1:1000), mouse anti-Map2ab antibody (Sigma, M1406, 1:200), rabbit anti neuroD1 antibody (Abcam, ab16508, 1:200), mouse monoclonal anti -S100β antibody (Sigma, S-2532, 1:1000), rabbit anti-GFAP antibody (Dako, Z0334, 1:500), mouse anti- TuJ1 antibody (sigma, T8660, 1:400), rabbit anti- NG2 chondroitin sulfate proteoglycan antibody (Millipore, ab5320, 1:200). After overnight incubation, the primary antibodies were aspirated and washed thrice with 250 μl of PBS. Then the cells were incubated with 30 μl of secondary antibodies (Alexa fluor donkey anti-mouse 594 (Life technologies, A21205, 1:500), Alexa fluor donkey- anti rabbit-488 (Life Technologies, A21206, 1:500) for an hour at room temperature. The secondary antibody was removed, and the cells were washed thrice with 250 μl of PBS. Next, the cells were incubated with 30 μl of 1x 4’, 6-diamidino-2-phenylindole (DAPI) for 5 minutes. DAPI was removed and again the cells were washed thrice with 250 μl of PBS. Finally, the coverslips were mounted onto the glass slides using Fluoromount – G (Southern biotech, 0100-01). Fluorescent images were taken in 20X magnification using Leica microscope (Leica, DM6000B/M basic stand).
Nonbiased stereology (stereo investigator)
Cell line names were blinded, and unbiased counting was performed using stereo investigator software in the Zeiss microscope (Axiom manager. M2 stand Mot, 3525000470). Cells on the coverslips were contoured; using fractionator more than 100 sites in the contoured area were counted. Total number of cells (DAPI) and the desired population (nestin, ki67, TuJ1, Map2ab, GFAP, S100β, NG2, NeuroD1) were counted. Total percentage of desired population was estimated by the stereo investigator software.
TUNEL Assay
The cells were fixed using 3.2% PFA and the coverslips were then placed in the humid chamber. The coverslips were washed with PBS for 5 minutes at room temperature for 3 times, followed by 5 minutes incubation using 0.2% Triton X-100. The cells were washed twice with PBS for 5 minutes. The cells were then equilibrated at room temperature for 10 minutes using 30 μl of equilibration buffer provided with Promega TUNEL Kit (Promega, DeadEnd Fluorometric TUNEL Assay, Cat# G3250). Following the equilibration, the cells were incubated in 30 μl of rTdT incubation buffer (rTdT Enzyme, 1:50; Nucleotide Buffer, 1:10; and Equilibration buffer) for 60 minutes at 37°C. The cells were then washed with 2X SSC by incubating at room temperature for 15 minutes. The coverslips were then stained for DAPI for 5 minutes, washed, and mounted.
Statistical analyses
All the experiments were repeated at least 3 times and quantified using non-biased stereo investigator. The resulting data was then graphed and analyzed. The statistical analysis was done using two-way ANOVA with Bonferroni correction on all data sets (Supplementary Table 2). One-way ANOVA with Bonferroni correction was then performed on all the significant data sets. All the HD vs control samples were analyzed using paired t-test, with 95% confidence interval.
RESULTS
Significantly increased nestin expression on days 14, 28, and 42 in the HD iPSC-derived neuronal cultures
Previous studies have shown that after iPSC are differentiated towards a striatal fate for 42 days, there is an increased percentage of nestin-expressing neural progenitor cells (neNPCs) in the HD cultures compared to controls [15]. In order to examine the timeline of the increased neNPC phenotype, the HD and control iPSC-derived neural progenitor spheres were plated and differentiated towards striatal fate and characterized at different time points of differentiation (Day 0, 7, 14, 28, 42, 56, and 80). These cultures were examined for the expression of neural progenitor markers (nestin, NeuroD1, NG2), neuronal markers (TuJ1, Map2ab, DCX), and glial markers (GFAP, S100β).
During the EZ stage (Day 0), it was found that both HD and control lines had a similar percentage of cells expressing nestin (Fig. 1A), ranging from ∼35% (CTR 28 and 33) to 65% (CTR 18 and 21) in control samples and ∼30% (JHD 109 and 60) to 75% (JHD 180 and 77) in JHD (Fig. 1B). This is in agreement with previous studies which established similar levels of nestin expression in iPSC-derived striatal cultures at this time point [15]. In general, it was observed that nestin expression went down significantly over time from the EZ stage in both JHD and control lines (p < 0.0001), as expected as the cells are differentiating to a more mature neural state.
Fig.1
Increased expression of nestin expressing neural progenitor cells was observed on day 42 of striatal differentiation. A) Representative images of nestin and DAPI on time points (day 0, 7, 14, 28, 42, 56, and 80). Scale bar represents 50 μm. B) Stereological quantification of nestin C) NeuroD1 D) NG2 E) Map2ab F) TuJ1 G) GFAP. Statistical analysis was performed using paired T-test (*p < 0.05, **p < 0.01, ***p < 0.001, ****p < 0.0001). Error bars represent SEM.
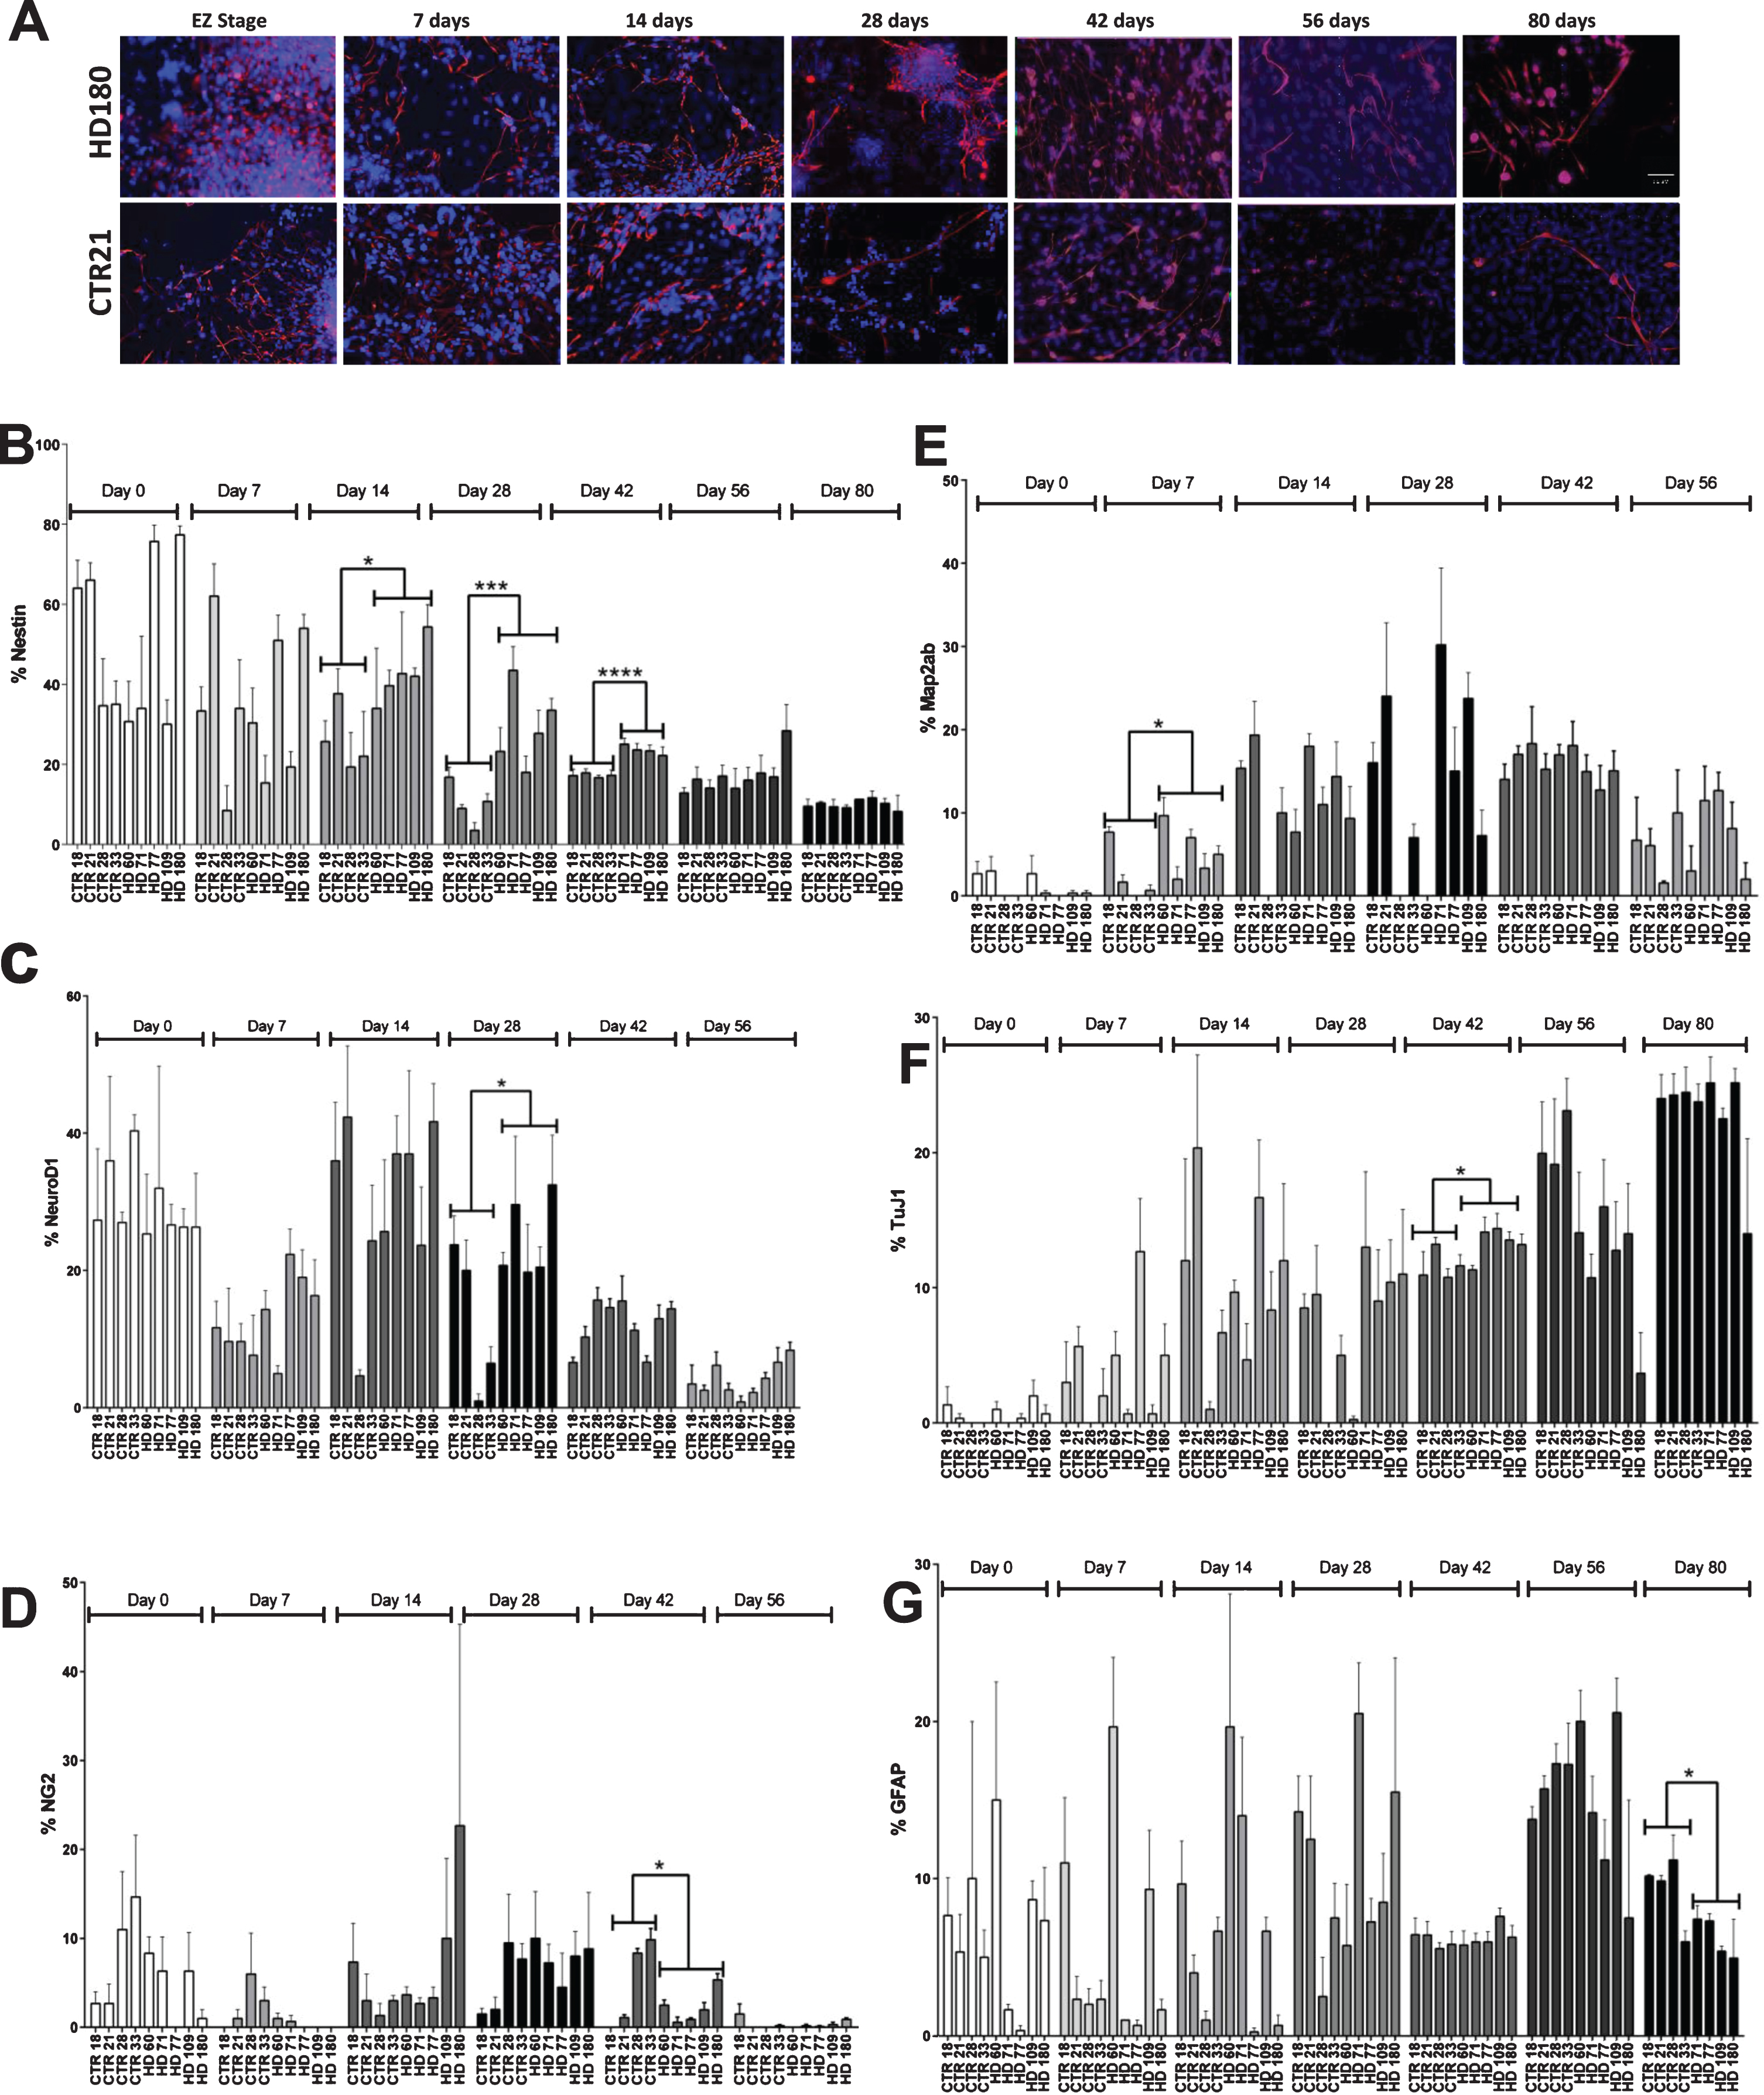
By day 7, nestin expression generally decreased in all lines and ranged from ∼15 (JHD 71) to 54% (JHD 180) in JHD lines and ∼8% (CTR 28) to 60% (CTR 21) in control lines. Similar to Day 0, there was no significant difference observed between JHD and control lines on day 7.
On day 14 of striatal differentiation, the nestin expressing cellular population continued to decrease in the control lines, ranging from ∼19 (CTR 28) to 37% (CTR 21). However, when analyzed, the percentage of cells expressing nestin in the JHD lines was significantly higher than controls (p < 0.05), ranging between approximately 34 (JHD 60) to 54 % (JHD 180). Similarly, by day 28, the JHD lines continued to show significantly higher expression of nestin expressing cells than the controls. The JHD lines with 180 (33.5%, p < 0.001), 109 (27.75%, p < 0.05), 71 (43.5%, p < 0.0001) CAG repeats were significantly higher than all the control lines (3–16%).
As has been previously demonstrated, the percentage of cells expressing nestin after 42 days of differentiation remained significantly higher in JHD 180, 109, 77, 71 (∼38–50%) than the control lines (∼10–18%) [15]. Statistical analysis between JHD and control lines showed the highest significance of all time points (p < 0.0001). However, as we have previously reported, the JHD 60 cultures were not significantly different than the control or other remaining JHD lines [15].
To observe the effect of extended differentiation on the NPC population, the cultures were allowed to continue differentiating until day 56 or 80. Expectedly, there was a continued decrease in percentage of neNPCs in both JHD and control cultures. However, at these later time points there was no statistical significance observed between the JHD and control lines. This potentially indicates a delayed developmental phenotype in JHD cultures.
Along with nestin, the iPSC-derived striatal cultures were also characterized for other neural progenitor (NeuroD1, NG2, DCX), neuronal (TuJ1 (βIII-tubulin), Map2ab) and glial markers (GFAP, S100β). No overall significant differences were observed between the JHD and control lines for the progenitor makers NeuroD1 (a basic helix-loop-helix family of transcription factor) (Supplementary Figure 1A) or NG2 (an oligodendrocyte progenitor marker) (Supplementary Figure 1B), except on day 28 (p < 0.05, increase in control) or except on day 42 (p < 0.05, increase in control), respectively. It was observed that NeuroD1 expression was similar in both JHD and control samples on days 0, 7, 14, and also on later time points days 42 and 56 (Fig. 1C). Although a cell line specific variability could be observed, the overall control versus JHD comparison was not significantly different. Similar results were observed with NG2, with the expression level remaining variable throughout different time points and cell line specific variability (Fig. 1D). Map2ab (microtubule associated protein – a and b isoforms) is a more mature neuronal marker and stains for the differentiating/ post-mitotic neurons (Supplementary Figure 1C). TuJ1 is an immature neuronal marker, staining for post mitotic neuron that arises throughout neurogenesis (Supplementary Figure 1D). Both TuJ1 and Map2ab expression gradually increased from day 0 onwards (p < 0.001). There was significant difference observed between JHD and control lines on day 7 (p < 0.05) for Map2ab (Fig. 1E) and on day 42 (p < 0.05) for TuJ1 (Fig. 1F), where JHD lines showed significant increase. GFAP (Glial fibrillary acidic protein) (Supplementary Figure 1E) is a marker of immature glia, whereas S100β (Supplementary Figure 1F) is characterized as the late marker in the astrocyte development. There was no significant difference observed in GFAP expression except on day 80 (p < 0.05), where more control cells expressed GFAP than JHD lines (Fig. 1G). However, there was no significant difference observed between JHD or control cell lines for the other glial marker S100β (Supplementary Figure 1G). No significant difference was observed in JHD and control lines. DCX (Supplementary Figure 1H) is expressed by neural progenitor cells in adult or embryonic cortex. No significant difference was observed between JHD and control lines at days 42 and 56 (Supplementary Figure 1I).
No overrepresentation of populations expressing nestin alone, or in conjunction with either TuJ1 and/or GFAP was observed in striatal cultures after 42 days of differentiation
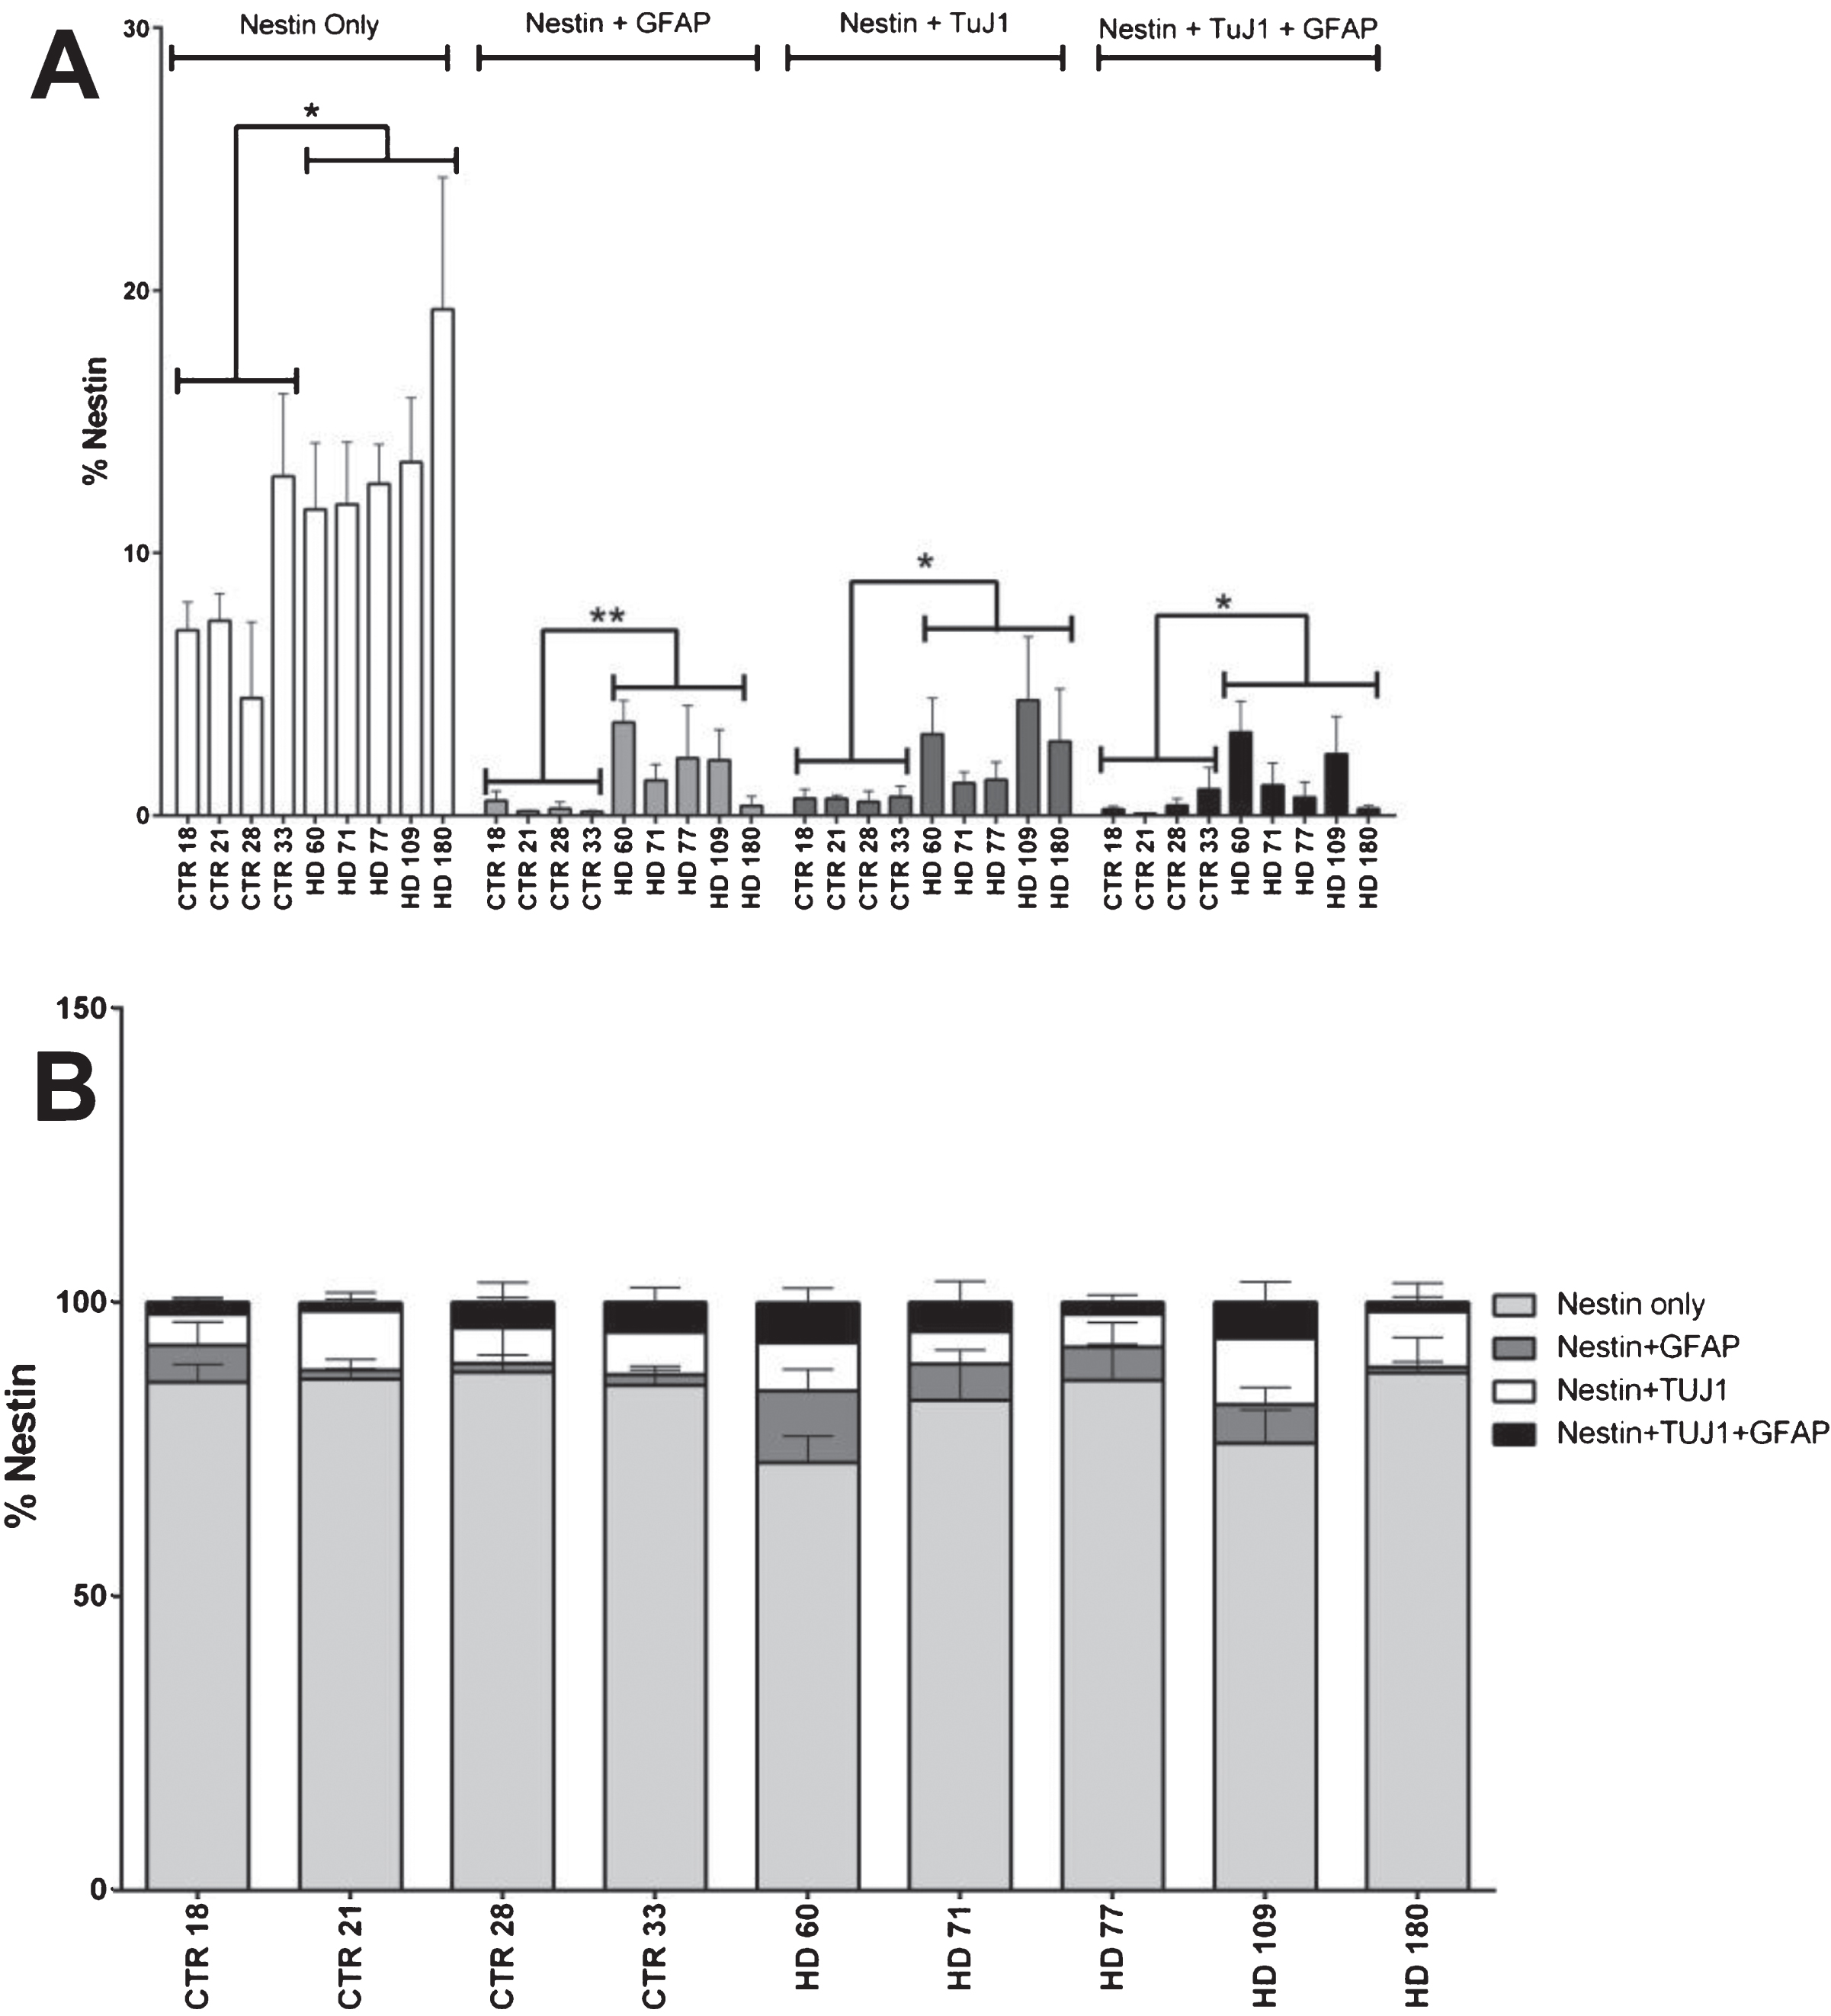
In an effort to further classify the aberrant cell population observed in the JHD striatal cultures, levels of co-expression of nestin with the neuronal marker TuJ1 and glial marker GFAP were quantified at 42 days of differentiation. Statistical analysis revealed that the cell lines with higher CAG repeats have significantly more cells expressing only nestin (not co-expressing either TuJ1 and/or GFAP) (p < 0.0001, JHD 180 and JHD 109; p < 0.001, JHD 77 and JHD 71). As the JHD striatal cultures have more nestin positive cells overall, nestin co-expressing populations were evaluated as a percentage of total nestin positive cells in order to further analyze the significance of the TuJ1 and/or GFAP co-expressing Nestin-positive cells (Fig. 2A). Statistical analysis conducted on each of these populations individually revealed no over-represented co-localization populations (Fig. 2B). In agreement, within the GFAP and TuJ1 populations there was no over-represented co-localization populations in the JHD cells (Supplementary Figure 2A-D). Therefore, even though there is a delayed development phenotype in the JHD iPSC striatal differentiations, they do not appear to be aberrantly co-expressing markers of progenitors and more mature neural types.
Fig.2
Nestin co-expression with neuronal and/or glial markers is not significantly different in HD cultures. A) Nestin co-expression levels with the neuronal (TuJ1) and glial (GFAP) marker at 42 days of differentiation. B) No nestin population is over represented in HD lines at 42 days of differentiation. Statistical analysis was performed using paired T-test (*p < 0.05, **p < 0.01, ***p < 0.001, ****p < 0.0001). Error bars represent SEM.
HTT knockdown for one week prior to day 42 does not reduce the nestin phenotype, but knockdown over the course of the differentiation does
In order to determine whether the observed phenotype of increased neNPC population in the JHD cultures was reversible, HTT was knocked down using antisense oligonucleotides (ASOs). The cells were treated with an ASO targeted to either total HTT or a single-nucleotide polymorphism found only in the JHD180 long-allele or were treated with a non-HTT targeted (scramble) negative control from day 35 until day 42 (Fig. 3A), based upon previous experiments [15]. At day 42, after one week of either total HTT or allele-specific HTT knockdown, no significant reduction of nestin (Fig. 3B), TuJ1 (Fig. 3C) or GFAP (Fig. 3D) was observed in any of the lines.
Fig.3
Reduction of HTT levels during differentiation reduces the HD Nestin phenotype. A) Images of and B) quantification that one week of HTT knock-down (day 35–42) using antisense oligonucleotides (ASOs) does not reduce Nestin expression in the HD cultures. C) ASO targeted knock-down of mtHtt does not significantly affect the amount of TuJ1-positive, D) or GFAP-positive cells. E) Partial knockdown of HTT during the 42 days of differentiation using ASOs showed significant reduction in nestin expressing progenitor population in the striatal cultures. F) There was no significant difference in TuJ1+ cell population in both the control and HD lines with or without the HTT knockdown. G) There was no significant difference in GFAP + cell population in both the control and HD lines with or without HTT knockdown. Statistical analysis was performed using one-way ANOVA. (*p < 0.05, **p < 0.01, ***p < 0.001, ****p < 0.0001) Error bars represent SEM.
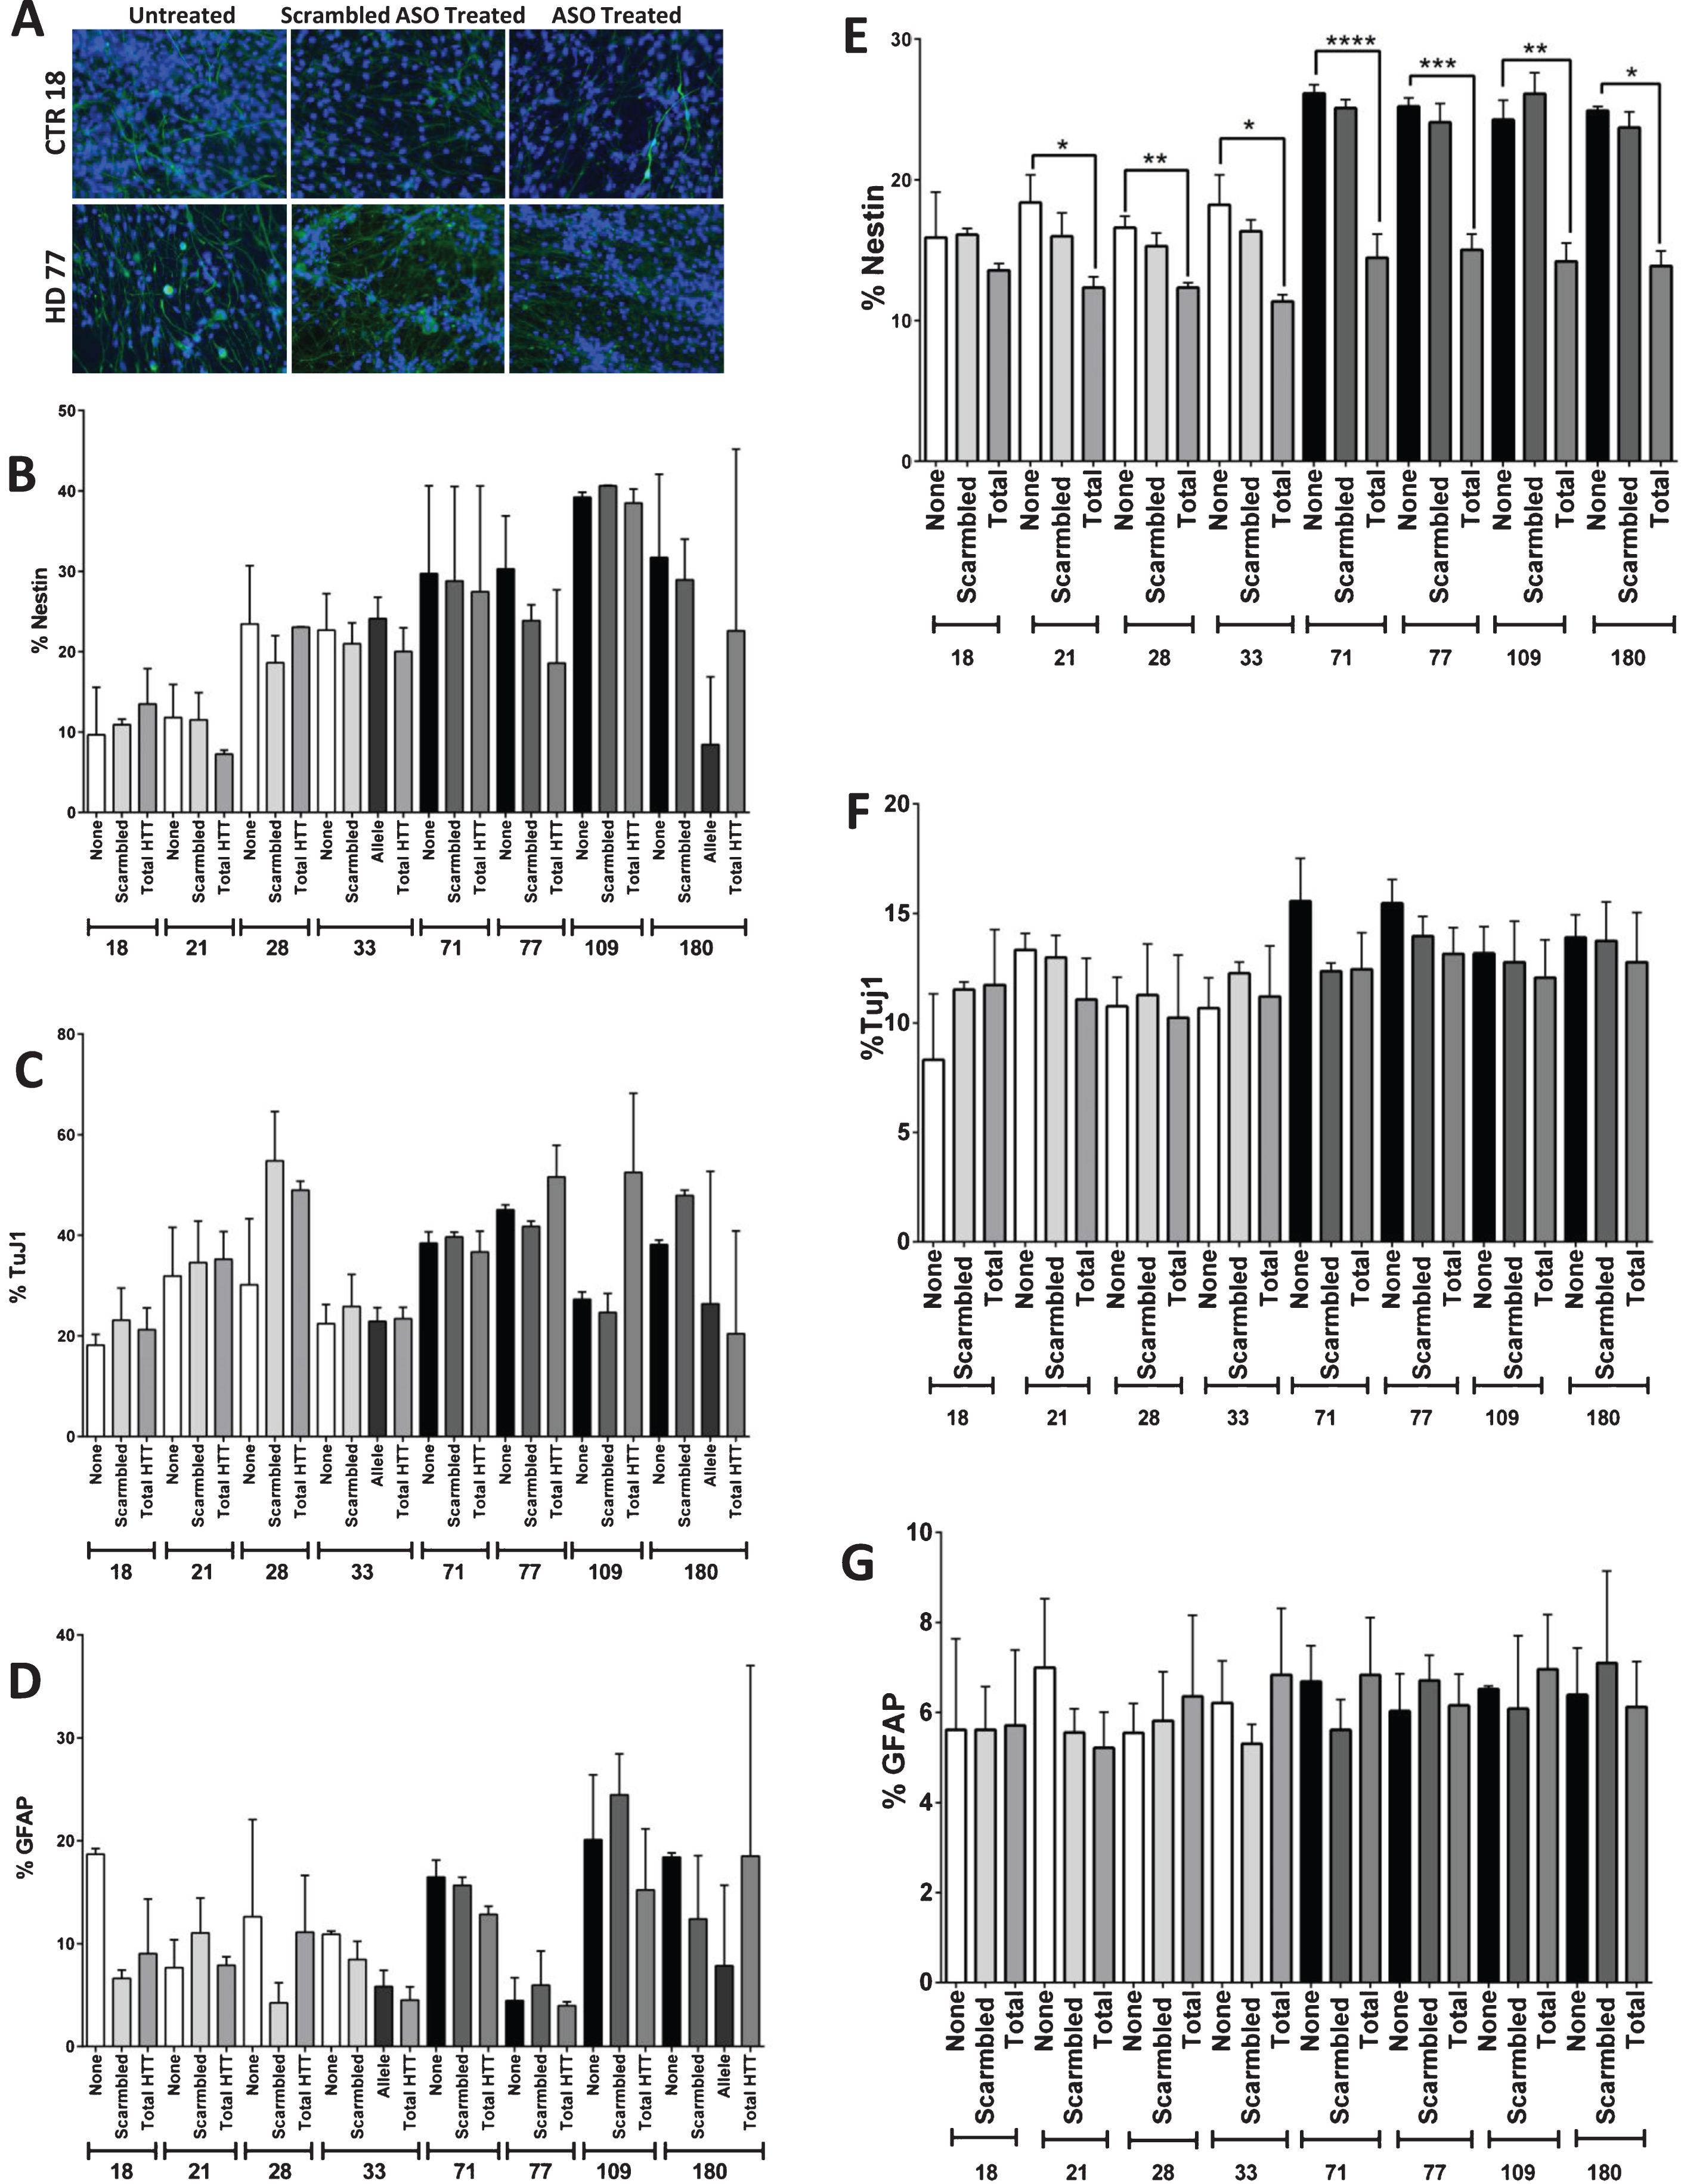
As HTT is expressed throughout development, it was therefore postulated that HTT knockdown through the entire course of differentiation might be necessary in order to fully reverse the neNPC phenotype. Therefore, the JHD and control cells were treated with ASOs throughout the 42 days of the differentiation protocol. Using a scramble ASO, the average HTT expression was calculated to be between 51–139% of untreated in controls (with an average HTT knockdown of 0.05±41.8% standard deviation), and between 56–117% in HD samples (with an average HTT knockdown of 4.83±26.5% standard deviation). When a total HTT-targeted ASO was used, HTT expression was seen between 25–80% of untreated in controls (with an average HTT knockdown of 46.2±27.3% standard deviation), and between 48–88% of untreated in controls in HD samples (with an average HTT knockdown of 28.4±17.1% standard deviation) (Supplementary Figure 3). While all lines had a trend towards knock-down using the total HTT ASOs, only the HD77 and CTR33 lines had a significantly decreased HTT expression over the scramble ASO (Supplementary Figure 3). It was found that the increased percentage of neNPCs was significantly reduced after HTT knockdown, not just in the JHD lines, but also in the controls (p < 0.0001, JHD 71; p < 0.001, JHD 77; p < 0.01, JHD 109 and CTR 28; p < 0.05, JHD 180, CTR 21, and CTR 33) (Fig. 3E). No significant difference was observed in neuronal (TuJ1) (Fig. 3F) or glial (GFAP) (Fig. 3G) populations. This reduction in nestin expression in all lines upon HTT knockdown implicates its role in neuro-/glio-genesis.
No significant increase in the proliferation of JHD cultures and phenotypic reversal by inhibition of canonical Notch pathway
The next thing to determine was if the JHD neNPCs were true neural progenitors, or whether they were simply aberrantly expressing nestin as a stress response [33]. Since neural progenitor cells possess the ability to proliferate [38], the self-replication ability of these cultures was analyzed using Ki67 staining (Fig. 4A). When Ki67 expression was examined over the time course of 0 to 56 days of differentiation, expectedly the percentage of cells expressing of Ki67 decreased over time (p < 0.0001) (Fig. 4B). However, no significant difference was observed in the JHD and control cultures, demonstrating that even though there are more neNPCs, there is no higher proliferation rate in JHD cultures than controls.
Fig.4
HD nesting phenotype reversed by inhibition of canonical Notch pathway. A) Immunocytochemistry of the proliferation marker Ki67. The proliferation decreases in both HD (180 repeats) and control (21 repeats) lines over increasing time points of striatal differentiation. Pictures were taken at the magnification of 20X. B) Graph shows the expression of proliferation marker Ki67 at 0, 7, 14, 28, 42, and 56 days of iPSC-derived striatal cultures. The Ki67 expression decreases over increasing time points of differentiation in both HD and control lines. C) Inhibition of canonical Notch pathway showed significant reduction in nestin expressing NPC population in both control and HD cultures. Representative images of the 1 week inhibition of canonical Notch pathway using 10 μM DAPT during striatal differentiation. D) Notch inhibition decreases percentage of nestin+ cells in all lines, but a greater percentage in HD to the level of control. E) Two of the HD lines (HD 71 and HD 180) showed significant difference in TuJ1 population F) No significant difference was observed in GFAP+. G) Images of H) and quantification of apoptotic cell death by means of TUNEL assay reveal no significant increase in cell death due to Notch inhibition. Statistical analysis was performed using paired T-test for Fig. 4 B), D) – F) and one-way ANOVA for Fig. 4 H). (*p < 0.05, **p < 0.01, ***p < 0.001, ****p < 0.0001) Error bars represent SEM.
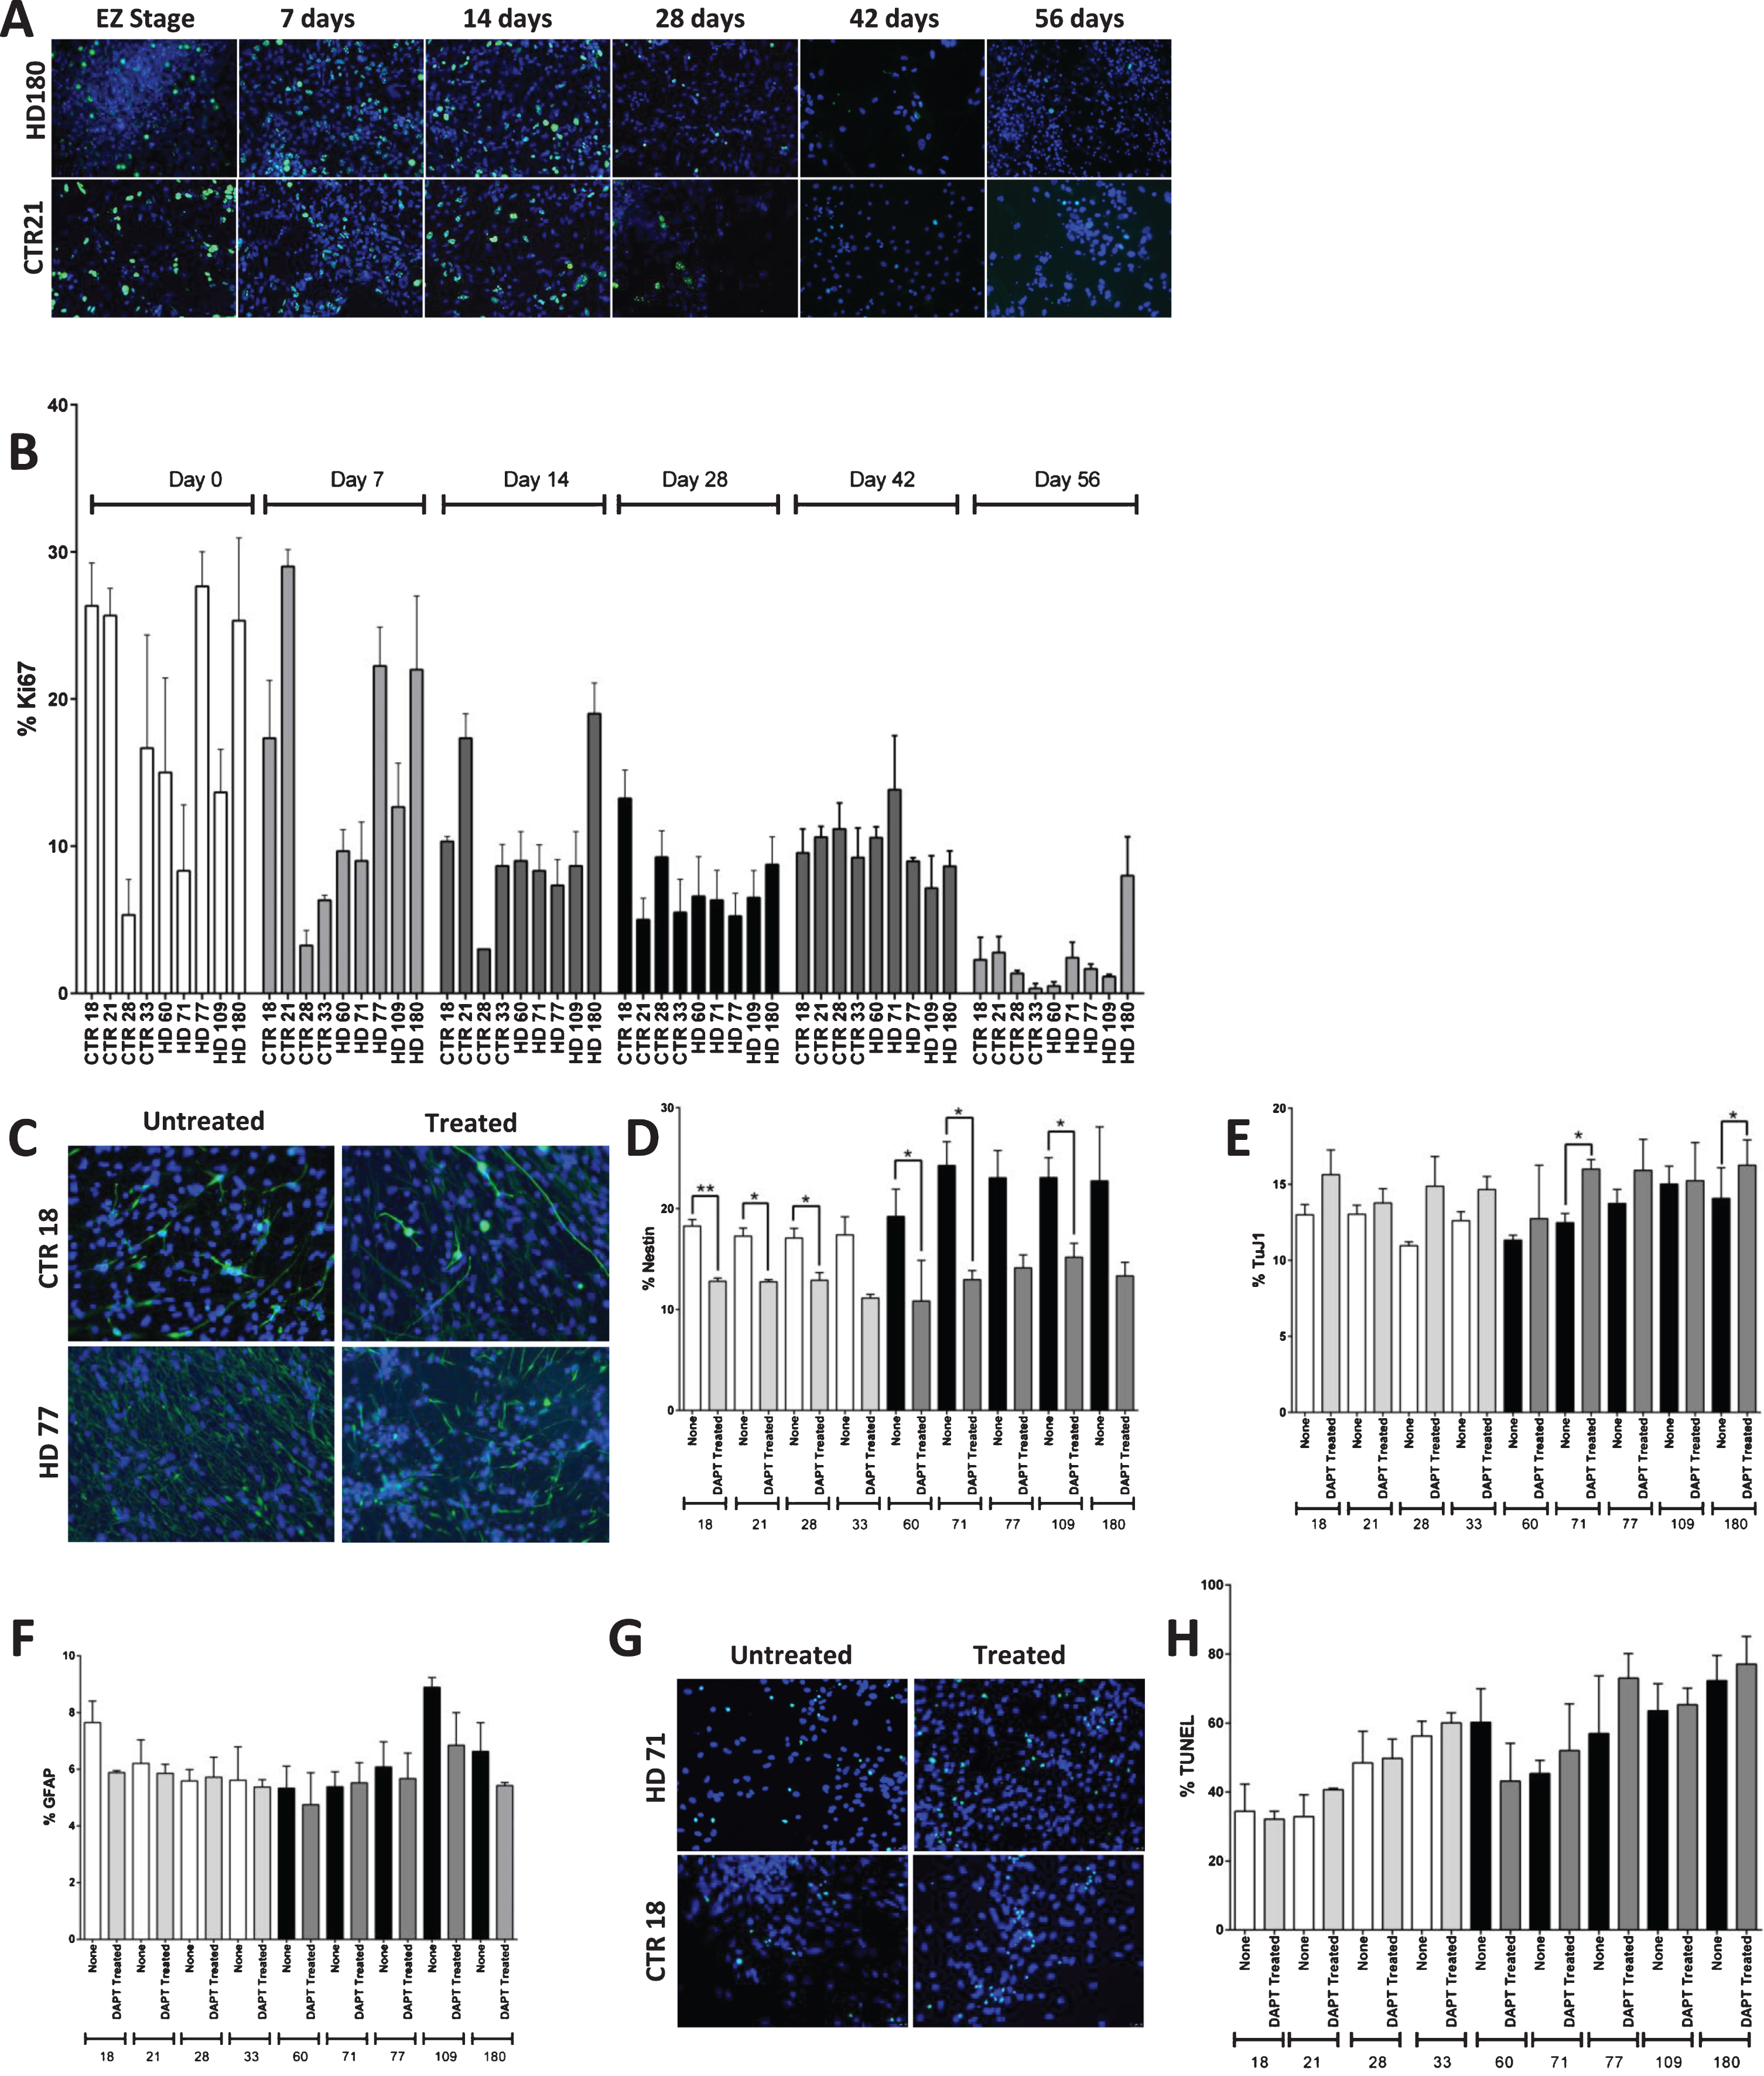
To further investigate whether the persistent JHD neNPCs are true neural progenitor cells, canonical Notch pathway was inhibited using 10 μM of N-[2S-(3,5-difluorophenyl) acetyl]-L-alanyl-2-phenyl-1,1-dimethylethyl ester-glycine (DAPT) from day 35 to day 42 (Fig. 4C). Notch pathway is highly conserved in various multicellular organisms and is known to be critical for self-maintenance and renewal of NPCs [39–42]. This one-week Notch pathway inhibition caused the neNPC population to significantly decrease in both control samples (p < 0.001) and in JHD samples (p < 0.0001) (individually, CTR18, CTR21, CTR28, HD60, HD71 and HD109 had a significant decrease upon Notch addition; Fig. 4D). This data is corelates with recent findings of the role of Notch in self-renewal of NPCs and subsequent differentiation to glial and neuronal fate [43]. There was significant increase observed in JHD 71 and JHD 180 (p < 0.05) in TuJ1-expressing neuronal population (Fig. 4E). There was however, no significant difference in GFAP-expressing glia (Fig. 4F).
As the inhibition of canonical Notch pathway reduced the nestin expressing cell population but did not result in a significant increase in TuJ1 staining in every line, it was decided to analyze whether these cells were simply dying upon Notch inhibition, as opposed to being forced to differentiate to a more mature neural fate. A terminal deoxynucleotidyl transferase dUTP Nick-End Labelling (TUNEL) assay was therefore used to investigate cellular apoptosis (Fig. 4G). Although there appeared to be an increased percentage of apoptotic cells in the treated cultures, no significant difference was observed upon DAPT treatment of the cultures in either control or JHD cultures (Fig. 4H).
DISCUSSION
HD is traditionally considered as an adult onset neurodegenerative disorder. The present study was designed to explore the potential neurodevelopmental aspects of the disease. iPSC based disease modelling provides a unique perspective about the pathogenesis and progression of HD. Since iPSC are reprogrammed somatic cells with patient specific genetic information, the differentiation towards striatal fate of the same allows an exclusive insight towards development of the disease. This approach of disease modelling presents an ideal opportunity to study the early disease onset and its progression. Previous studies have shown that there are increased percentage of neNPCs in JHD cultures than control after 42 days of striatal differentiation. The same study proved that this NPC population is not newly generated but instead “persistent” [15]. In this study, the higher neNPC phenotype in JHD cultures compared to controls was successfully recapitulated. Previous transcriptomic analysis of these cultures showed alteration in neurodevelopmental pathways, validating the phenotypes observed in HD iPSC derived striatal cultures [30]. In this study, the gene changes identified were largely associated with neural development, and the genetic profile of the HD striatal cultures mapped to an earlier developmental stage than control cultures [30]. Treatment with a small molecule shown to increase Ca2+ influx in neural stem/progenitor cells at least partially reversed some phenotypes in the cultures, including cell death, and restoring the cortico-striatal synapses in HD model mice [30], further providing evidence for dysregulation at early stages of development. A completely different transcriptomic study of HD neural progenitors derived from iPSCs also revealed dysregulation of genes involved with neuronal development [31]. The data presented in this paper demonstrates a delay in development of HD iPSC characterized by the increased percentage of nestin expressing neural progenitor cells on days 14, 28, and 42, which was reversed upon HTT knock-down or treatment with canonical Notch inhibition.
Nestin is a neural progenitor marker that is expressed throughout the development of central nervous system [32], however it can also be upregulated after a traumatic injury or other cellular stress [33]. The observed phenotype of higher number of “persistent” nestin expressing NPCs in JHD cultures could either be reflective of a delayed developmental phenotype or be brought about as a stress response due to the continuous insult of mHTT. Nestin functions as a class VI intermediate filament protein that becomes down regulated upon progenitor maturation into neural or glial cells [34]. Therefore, nestin is an excellent marker for determining the presence of neural progenitor cells in culture. However, there are instances where nestin can become expressed in different cell types other than neural progenitors. Astrocytes have demonstrated to upregulate nestin expression during times of cytoskeletal reconstruction as well as in neurons and astrocytes following an acute stress such as traumatic brain injury [33]. This could give rise to upregulation of nestin along with coexpression with TuJ1 and/or GFAP. There is evidence that shows that increasing the expression of nestin in neurons and astrocytes may be in an effort to extend the survival of diseased tissues, such as Purkinje cells in advanced Creutzfeld-Jakob Disease [35]. Notch signaling pathway, a highly conserved pathway in multicellular organisms, is critical for self-renewal and maintenance of progenitors. The receptors are triggered by cell-cell contact and a subsequent cascade of signals dictates the cellular fate, including but not limited to neurogenesis [39–41]. Recent findings suggest that Notch signaling plays vital role in subsequent differentiation of NPCs to neuronal or glial fate and inhibition of this pathway also impedes the differentiation [43].
Aberrant populations of nestin expressing cells have also been observed in HD striatal cultures. In BACHD mice (mice that contain the bacterial artificial chromosome containing the full length human mHTT gene), hippocampal derived neural progenitor cells exhibited significantly elevated levels of nestin after a week of differentiation in the presence of BDNF. This phenotype has also been observed in human cell lines as well. ESC derived neurospheres containing the mHTT gene (111 CAG repeats) presented a similar significant increase in nestin expression to the BACHD mice, compared to control line (18 CAG repeats). The same study showed alterations in differentiation potential of NPCs with mHTT genes. [36].
There is increasing evidence on the possible functions that HTT plays within the cell. While the presence of HTT is required for prenatal development and the absence of HTT is lethal, there are also reports of impaired adult neurogenesis in the presence of mHTT [18]. Mutant HTT has also shown to have cellular alterations in vesicle recycling, decreased BDNF signalling, excitotoxicity, disrupted calcium signalling, decreased intracellular ATP, inhibition of protein clearance pathways, altered gene transcription, and mitochondrial and metabolic disturbance [37]. This evidence demonstrates some mechanisms why mHTT, present in HD, impairs normal development within the striatum by altering neuronal homeostasis and subsequently placing a specific neuronal cell type (medium spiny neurons) in an environment that leaves them susceptible to disease [18]. Based on this, the presence of a persistent nestin positive neural progenitor population after 42 days of striatal differentiation may represent a possible early HD phenotype. The characterization of this aberrant population may provide insight into the delayed neural and glial maturation observed in HD-iPSC striatal cultures.
Non-selective HTT knockdown using ASOs showed phenotypic reversal without any significant neuro-/glio-genesis. This study only characterized TuJ1 and GFAP as neuronal and glial marker, respectively. This further confirmed that TuJ1 and GFAP are not sufficient markers to characterize the aberrant neural progenitor population. It is imperative that this study be corroborated with more studies using other progenitor, neuronal, and glial markers, along with other scientific methods.
Despite the ubiquitous expression of HTT, the vulnerability of striatal MSNs to mHTT remains unclear. To confirm the association of the observed delayed developmental phenotype with the mHTT protein expression in the culture, the study was designed with the use of ASOs to partially knockdown HTT (with HTT knock-down levels in this study between 12% and 75%). After treating the both JHD and control cultures with non-allele specific ASOs throughout the 42 days long striatal differentiation, a phenotypic reversal in JHD cultures was observed. The levels of nestin expressing NPCs in the ASO treated cultures reduced dramatically. A significant decrease in NPC population in control cultures as well was also observed, however it may be due to the non-allele specific nature of the ASOs to also target non-expanded wild-type HTT. There was no significant difference in glial or neuronal populations in either JHD or control cultures, indicating the lack of enhanced gliogenesis and neurogenesis. No significant difference was observed in NPC population of JHD or control cultures treated with scrambled ASO and the cells behaved similarly to the untreated cultures. This may demonstrate that knockdown of the mutant HTT protein alone may be enough to reverse the nestin phenotype observed in JHD. There is a known necessity for wild-type HTT in the developing brain, as it is essential for mitotic spindle orientation [44]. Interestingly, the partial knock-down did not negatively affect the differentiation of neurons (TuJ1) or glia (GFAP).
Although it needs to be validated by in-vivo data, this study provides evidence to support the hypothesis of delayed development phenotype in HD patient striatum. After differentiating towards striatal fate, JHD cultures showed significantly higher percentage of nestin positive cells. HTT knockdown throughout the course of differentiation can reverse the phenotype. Inhibition of canonical Notch pathway (DAPT) reversed the elevated nestin phenotype. Interestingly, gamma-secretase inhibitors, such as DAPT, have been previously shown to reduce mtHTT cleavage and thereby decrease mtHTT-induced neurotoxicity in immortalized cell lines [45]. This in addition to the fact that no increased proliferation in the HD striatal cultures was observed does warrant future studies into whether the increased nestin expressing cells are truly a neural progenitor population, or whether they are an aberrant population that is either stalled in development or are expressing Nestin as a stress response. It will also be interesting to determine if the HD cultures are still susceptible to glutamate excitotoxicity upon BDNF withdrawal [15] after notch inhibition.
CONFLICT OF INTEREST
The authors have no conflict of interest to report.
ACKNOWLEDGMENTS
The authors would like to thank Dr. Clive Svendsen for helpful insight. We also would like to thank the Cedars-Sinai iPSC Core Facility for generating the HD and non-diseased iPSCs, and Dr. Frank Bennett and Dr. Michael Østergaard at IONIS Pharmaceuticals for the kind gift of ASOs. This work was supported by The Board of Governors Regenerative Medicine Institute. PM was supported by CIRM Bridges (EDUC2-08381), JD and DS were supported by CIRM Bridges (TB1-01177).
SUPPLEMENTARY MATERIAL
[1] The supplementary material is available in the electronic version of this article: http://dx.doi.org/10.3233/JHD-180333.
REFERENCES
[1] | Ross CA , Aylward EH , Wild EJ , Langbehn DR , Long JD , Warner JH , et al. Huntington disease: Natural history, biomarkers and prospects for therapeutics. Nat Rev Neurol. (2014) ;10: (4):204–16. |
[2] | Walker FO . Huntington’s disease. Lancet. (2007) ;369(9557):218–28. |
[3] | van Duijn E , Kingma EM , van der Mast RC . Psychopathology in verified Huntington’s disease gene carriers. J Neuropsychiatry Clin Neurosci. (2007) ;19: (4):441–8. |
[4] | Roos RAC . Huntington’s disease: A clinical review. Orphanet J Rare Dis. (2010) ;5: (1):40. |
[5] | Wild EJ , Tabrizi SJ . Huntington’s disease phenocopy syndromes. Curr Opin Neurol. (2007) ;20: (6):681–7. |
[6] | Genetic Modifiers of Huntington’s Disease (GeM-HD) Consortium. Identification of genetic factors that modify clinical onset of Huntington’s disease. Cell. (2015) ;162: (3):516–26. |
[7] | Scheuing L , Chiu CT , Liao HM , Linares GR , Chuang DM . Preclinical and clinical investigations of mood stabilizers for Huntington’s disease: What have we learned? Int J Biol Sci. (2014) ;10: (9):1024–38. |
[8] | Sampaio C , Borowsky B , Reilmann R . Clinical trials in Huntington’s disease: Interventions in early clinical development and newer methodological approaches. Mov Disord. (2014) ;29: (11):1419–28. |
[9] | Pringsheim T , Wiltshire K , Day L , Dykeman J , Steeves T , Jette N . The incidence and prevalence of Huntington’s disease: A systematic review and meta-analysis. Mov Disord. (2012) ;27: (9):1083–91. |
[10] | Fan H-C , Ho L-I , Chi C-S , Chen S-J , Peng G-S , Chan T-M , et al. Polyglutamine (PolyQ) diseases: Genetics to treatments. Cell Transplant. (2014) ;23: (4-5):441–58. |
[11] | Zielonka D , Marinus J , Roos RA , De Michele G , Di Donato S , Putter H , et al. The influence of gender on phenotype and disease progression in patients with Huntington’s disease. Parkinsonism Relat Disord. (2013) ;19: (2):192–7. |
[12] | MacDonald ME , Ambrose CM , Duyao MP , Myers RH , Lin C , Srinidhi L , et al. A novel gene containing a trinucleotide repeat that is expanded and unstable on Huntington’s disease chromosomes. Cell. (1993) ;72: (6):971–83. |
[13] | Duyao M , Ambrose C , Myers R , Novelletto A , Persichetti F , Frontali M , et al. Trinucleotide repeat length instability and age of onset in Huntington’s disease. Nat Genet. (1993) ;4: (4):387–92. |
[14] | Mattis VB , Svendsen CN . Modeling Huntington’s disease with patient-derived neurons. Brain Res. (2017) ;1656: :76–87. |
[15] | Mattis VB , Tom C , Akimov S , Saeedian J , Østergaard ME , Southwell AL , et al. HD iPSC-derived neural progenitors accumulate in culture and are susceptible to BDNF withdrawal due to glutamate toxicity. Hum Mol Genet. (2015) ;24: (11):3257–71. |
[16] | Hickey MA , Chesselet MF . Apoptosis in Huntington’s disease. Prog Neuropsychopharmacol Biol Psychiatry. (2003) ;27: (2):255–65. |
[17] | Harjes P , Wanker EE . The hunt for huntingtin function: Interaction partners tell many different stories. Trends Biochem Sci. (2003) ;28: (8):425–33. |
[18] | Molero AE , Gokhan S , Gonzalez S , Feig JL , Alexandre LC , Mehler MF . Impairment of developmental stem cell-mediated striatal neurogenesis and pluripotency genes in a knock-in model of Huntington’s disease. Proc Natl Acad Sci U S A. (2009) ;106: (51):21900–5. |
[19] | Evans AE , Kelly CM , Precious SV , Rosser AE . Molecular regulation of striatal development: A review. Anat Res Int. (2012) ;2012: :1–14. |
[20] | Pouladi MA , Morton AJ , Hayden MR . Choosing an animal model for the study of Huntington’s disease. Nat Rev Neurosci. (2013) ;14: (10):708–21. |
[21] | Merkle FT , Eggan K . Modeling human disease with pluripotent stem cells: From genome association to function. Cell Stem Cell. (2013) ;12: (6):656–68. |
[22] | Menalled L , Brunner D . Animal models of Huntington’s disease for translation to the clinic: Best practices. Mov Disord. (2014) ;29: (11):1375–90. |
[23] | Takahashi K , Yamanaka S . Induction of pluripotent stem cells from mouse embryonic and adult fibroblast cultures by defined factors. Cell. (2006) ;126: (4):663–76. |
[24] | Yu J , Vodyanik MA , Smuga-Otto K , Antosiewicz-Bourget J , Frane JL , Tian S , et al. Induced pluripotent stem cell lines derived from human somatic cells. Science. (2007) ;318: (5858):1917–20. |
[25] | Okita K , Ichisaka T , Yamanaka S . Generation of germline-competent induced pluripotent stem cells. Nature. (2007) ;448: (7151):313–7. |
[26] | Molero AE , Arteaga-Bracho EE , Chen CH , Gulinello M , Winchester ML , Pichamoorthy N , et al. Selective expression of mutant huntingtin during development recapitulates characteristic features of Huntington’s disease. Proc Natl Acad Sci U S A. (2016) ;113: (20):5736–41. |
[27] | Wiatr K , Szlachcic WJ , Trzeciak M , Figlerowicz M , Figiel M . Huntington disease as a neurodevelopmental disorder and early signs of the disease in stem cells. Mol Neurobiol. (2018) ;55: (4):3351–71. |
[28] | Ardhanareeswaran K , Mariani J , Coppola G , Abyzov A , Vaccarino FM . Human induced pluripotent stem cells for modelling neurodevelopmental disorders. Nat Rev Neurol. (2017) ;13: (5):265–78. |
[29] | Liu L , Huang JS , Han C , Zhang GX , Xu XY , Shen Y , et al. Induced pluripotent stem cells in Huntington’s disease: Disease modeling and the potential for cell-based therapy. Mol Neurobiol. (2016) ;53: (10):6698–708. |
[30] | HD iPSC Consortium . Developmental alterations in Huntington’s disease neural cells and pharmacological rescue in cells and mice. Nat Neurosci. (2017) ;20: (5):648–60. |
[31] | Ring KL , An MC , Zhang N , O’Brien RN , Ramos EM , Gao F , et al. Genomic analysis reveals disruption of striatal neuronal development and therapeutic targets in human Huntington’s disease neural stem cells. Stem Cell Rep. (2015) ;5: (6):1023–38. |
[32] | Rakic P . Pre- and post-developmental neurogenesis in primates. Clin Neurosci Res. (2002) ;2: (1-2):29–39. |
[33] | Sahin Kaya S , Mahmood A , Li Y , Yavuz E , Chopp M . Expression of nestin after traumatic brain injury in rat brain. Brain Res. (1999) ;840: (1-2):153–7. |
[34] | Suzuki S , Namiki J , Shibata S , Mastuzaki Y , Okano H . The neural stem/progenitor cell marker nestin is expressed in proliferative endothelial cells, but not in mature vasculature. J Histochem Cytochem. (2010) ;58: (8):721–30. |
[35] | Mizuno Y , Takeuchi T , Takatama M , Okamoto K . Expression of nestin in Purkinje cells in patients with Creutzfeldt-Jakob disease. Neurosci Lett. (2003) ;352: (2):109–12. |
[36] | Nguyen GD , Gokhan S , Molero AE , Mehler MF . Selective roles of normal and mutant huntingtin in neural induction and early neurogenesis. PloS One. (2013) ;8: (5):e64368. |
[37] | Velier J , Kim M , Schwarz C , Kim TW , Sapp E , Chase K , et al. Wild-type and mutant huntingtins function in vesicle trafficking in the secretory and endocytic pathways. Exp Neurol. (1998) ;152: (1):34–40. |
[38] | Homem CC , Repic M , Knoblich JA . Proliferation control in neural stem and progenitor cells. Nat Rev Neurosci. (2015) ;16: (11):647–59. |
[39] | Bolós V , Grego-Bessa J , de la Pompa JL . Notch signaling in development and cancer. Endocrine Rev. (2007) ;28: (3):339–63. |
[40] | Zhou W , He Q , Zhang C , He X , Cui Z , Liu F , et al. BLOS2 negatively regulates notch signaling during hematopoietic stem and progenitor cell development in vertebrates. Exp Hematol. (2016) ;44: (9):S89. |
[41] | Aguirre A , Rubio ME , Gallo V . Notch and EGFR pathway interaction regulates neural stem cell number and self-renewal. Nature. (2010) ;467: (7313):323–7. |
[42] | Gaiano N , Fishell G . The role of notch in promoting glial and neural stem cell fates. Annu Rev Neurosci. (2002) ;25: (1):471–90. |
[43] | Venkatesh K , Reddy LVK , Abbas S , Mullick M , Moghal ETB , Balakrishna JP , et al. NOTCH signaling is essential for maturation, self-renewal, and tri-differentiation of in vitro derived human neural stem cells. cellular reprogramming.. Cell Reprogram. (2017) ;19: (6):372–83. |
[44] | Godin JD , Colombo K , Molina-Calavita M , Keryer G , Zala D , Charrin BC , et al. Huntingtin is required for mitotic spindle orientation and mammalian neurogenesis. Neuron. (2010) ;67: (3):392–406. |
[45] | Kegel KB , Sapp E , Alexander J , Reeves P , Bleckmann D , Sobin L , et al. Huntingtin cleavage product A forms in neurons and is reduced by gamma-secretase inhibitors. Mol Neurodegener. (2010) ;5: (1):58. |


