
Longitudinal Biochemical Assay Analysis of Mutant Huntingtin Exon 1 Protein in R6/2 Mice
Abstract
Background:
Biochemical analysis of mutant huntingtin (mHTT) aggregation species in HD mice is a common measure to track disease. A longitudinal and systematic study of how tissue processing affects detection of conformers has not yet been reported. Understanding the homeostatic flux of mHTT over time and under different processing conditions would aid in interpretation of pre-clinical assessments of disease interventions.
Objective:
Provide a systematic evaluation of tissue lysis methods and molecular and biochemical assays in parallel with behavioral readouts in R6/2 mice to establish a baseline for HTT exon1 protein accumulation.
Methods:
Established biochemical methods were used to process tissue from R6/2 mice of specific ages following behavior tasks. Aggregation states and accumulation of mHTT exon 1 protein were evaluated using multiple break and assay methods to determine potential conformational flux assay specificity in detection of mHTT species, and tissue specificity of conformers.
Results:
Detection of mHTT exon 1 protein species varied based on biochemical processing and analysis providing a baseline for subsequent studies in R6/2 mice. Insoluble, high molecular weight species of mHTT exon 1 protein increased and tracked with onset of behavioral impairments in R6/2 mice using multiple assay methods.
Conclusions:
Conformational flux from soluble monomer to high molecular weight, insoluble species of mHTT exon 1 protein was generally consistent for multiple assay methods throughout R6/2 disease progression; however, the results support the use of multiple biochemical techniques to detect mHTT exon 1 protein species for preclinical assessments in HD mouse models expressing mHTT exon 1 protein.
INTRODUCTION
Huntington’s disease (HD), an autosomal-dominant neurodegenerative disorder, is caused by a trinucleotide CAG repeat expansion within exon 1 of the Huntingtin (HTT) gene [1]. Neuropathological hallmarks are degeneration of medium spiny neurons of the striatum and atrophy of the cortex [2]. The CAG-coding polyglutamine repeat (polyQ) expansion results in aberrant misfolding, incomplete splicing, proteolysis, and accumulation of the mutant huntingtin protein (mHTT), which may contribute to disease pathogenesis [3, 4].
Investigations into the biological mechanisms underlying HD and identification of pathways that impact disease have implicated progressive mHTT accumulation as an indicator of pathogenesis. Accrued evidence from multiple studies supports the following. Mutant HTT undergoes conformational flux, modification, and processing resulting in increased protein fragmentation and accumulation of insoluble aggregate species as the disease progresses [5–7]. Intranuclear inclusions of aggregated, amino-terminal fragments and ubiquitin are one of the hallmarks of HD pathogenesis [8, 9] with the degree of aggregation corresponding with the stage of disease, likely as a surrogate marker of disease progression and aberrant protein homeostasis. Juvenile onset cases of HD, which are caused by longer repeat lengths above ∼60 polyQs, have an even higher aggregate load [9]. Aggregates accumulate in medium spiny neurons (MSNs) of the striatum and cortex, which are significantly impacted by disease, but are notably absent from the cerebellum [9]. However, mHTT undergoes changes in conformation prior to entering the visible inclusion phase [6].
Many HD-associated studies have focused on mHTT exon 1 protein (mHTTex1p) due to its robust effects on mHTT accumulation and aggregation, and on behavioral and biochemical deficits associated with HD in mice and flies [10, 11]. For in vivo studies, the first HD mouse model generated was an amino-terminal human exon 1 transgenic mouse [10]. Recently, the Bates and Housman groups showed that incomplete splicing can produce an endogenous, pathogenic mHTTex1p in full-length knock-in mouse models and human patient fibroblasts, equivalent to the transgene expressed in R6/2 mice [10], that may contribute to disease progression in HD [4, 12]. The process of aggregation is representative of the progressive nature of the disease, beginning from soluble monomers, assembly into soluble species such as oligomers and β-sheet fibrils and ultimately forming insoluble aggregates and inclusions [6, 13]. Soluble oligomers can go on to form spherical prefibrillar or protofibrilar soluble oligomers [14] before maturing into amyloid-like aggregates [15] and fibrils [16]. However, aggregation of mHTT and other amyloidgenic disease-associated proteins appears to progress in a non-linear path [13, 17].
While the precise contribution of aberrant accumulation and aggregation of protein to disease pathogenesis is complex, altered proteostasis may serve as a useful surrogate in evaluating preclinical efficacy of genetic and pharmacologic interventions on pathologies. Therefore, systematic detection of mHTT protein and the overlap with disease phenotypes is important for evaluating in vivo perturbations and their impact on disease onset and progression. Conformational species of mHTT have been tracked over time previously in HdhQ150 mice using uniform processing [18]. However, due to biochemical heterogeneity of mHTT conformers, we suggest that sample processing may impact detection of different mHTT species. As a first step in systematically evaluating conformational transitions throughout disease progression, we performed a longitudinal analysis of tissues from transgenic R6/2 mice expressing human mHTTex1p using a battery of biochemical cell lysis methods (Table 1) and several specific assays developed over the years to detect and resolve mHTT protein species to investigate how they impact detection of mHTTex1p. Conformational transitions we measured include soluble oligomeric species [19–21], insoluble accumulated species [22–25], and insoluble fibrillary species [16]. We tracked these species in parallel with behavioral phenotypes to provide a baseline to guide studies, and also show that the ability to detect specific species and their abundance is influenced by the tissue processing techniques employed.
Table 1
Break methods optimized for detection of specific mHTT species
| Break Method | Optimized detection/rationale | Optimized Assay | Reference |
| Soluble/Insoluble fractionation | Soluble monomeric mHTT Insoluble HMW, accumulated mHTT | SDS-PAGE Filter retardation | [22, 23, 25, 40] |
| RIPA whole cell break | Soluble, Oligomeric mHTT | AGE | [19–21] |
| T-PER whole cell break | Aggregated protein species, commercially available and common reagent | SDS-PAGE | [41] |
| TRIZOL | Allows for analysis of RNA, DNA, and protein | SDS-PAGE | n/a |
MATERIALS AND METHODS
Animals
R6/2 mice were obtained from Jackson Laboratories at 5 weeks of age and allowed to age to 7, 9, or 11 weeks. CAG repeat sizing of genomic DNA harvested from tails was performed by Laragen. Experiments were carried out in strict accordance with the Guide for the Care and Use of Laboratory Animals of the NIH and an approved animal research protocol by the Institutional Animal Care and Use Committee (IACUC) at the University of California, Irvine. Animals were humanely euthanized by an injection of Euthasol at age 5, 7, 9 or 11 weeks followed by cardiac perfusion with PBS then decapitation. Brain and peripheral tissues used for biochemical assessment were flash-frozen on dry ice and stored at –80°C until further use. Brain tissue used for immunofluorescence was drop fixed in 4% paraformaldehyde for 48 hours then protected in 30% sucrose with 0.02% sodium azide.
Behavioral paradigms
Motor deficits were assessed in pole test, rotarod, and grip strength assays as previously described [23]. For pole test, mice were tested at 6, 8, and 10 weeks of age for their ability to descend a vertical pole (1 cm in diameter, 60 cm high) by recording and averaging time to descend over four trials for analysis. Rotarod was carried out using an accelerating apparatus (Dual Species Economex Rota-Rod; 0207-003M; Columbus Instruments) at 7, 9, and 11 weeks of age. Animals were trained on Rotarod for 5 minutes on day 1 and tested the following day by an accelerating assay recording and averaging time to fall for three, 5-minute trials test day.
Grip strength was assessed 6, 8, and 10 weeks of age to measure forelimb strength using a meshed force gauge which retained the peak force applied (IITC Life Science instrument, Woodland Hills, CA) and averaging the top 4 strongest pulls of 5 trials in grams of force applied to the meter. Dyskinesia was assessed by recording percent of animals clasping from weeks 5–11 as described previously [10] and body weights were recorded at the same time daily from weeks 5–11.
Immunohistochemistry and quantitation
Post-fixed brains were processed as 40μm sections, used for immunohistochemistry and imaged by confocal microscopy. The following primary antibodies were used: anti-HTT mEM48 (Millipore MAB5374) and anti-DARPP-32 (Santa Cruz SC-11365). Following antibody incubation, nuclei of slices were stained with TO-PROTM-3 iodide nuclear stain (Thermo Fisher T3605) and mounted onto microscope slides using Fluoromount-G (SouthernBiotech 0100-01). A LeicaDM2500 confocal microscope was used to acquire images. Six representative sections were used per animal. Two comparable z-stack images per section were acquired at 40x and used for quantification. EM48-positive puncta were automatically counted using Imaris Bitplane 5.0 spots setting with a diameter threshold of 0.5μm and consistent threshold between samples.
Tissue lysis
Flash frozen brain and peripheral mouse tissue were lysed by douncing 30 times in a glass 2 mL vial. Soluble and Insoluble Fractionation was performed on tissue samples in lysis buffer containing 10 mM Tris (pH 7.4), 1% Triton X-100, 150 mM NaCl, 10% glycerol, and 0.2 mM PMSF, and supplemented with protease inhibitors and NEM as previously described [23–25]. Samples were lysed for 60 minutes on ice followed by a 20-minute centrifugation at 15,000 xg at 4°C. Supernatant served as Soluble Fraction and pellet was washed twice with lysis buffer before being re-suspended in lysis buffer supplemented to 4% SDS and served as the Insoluble Fraction. Insoluble samples were sonicated for 30 seconds at 40% amplitude and boiled for 30 minutes. Protein fractions were quantified using Lowry protein assay (Bio-Rad). Whole cell tissue lysis was performed in T-PER or RIPA buffers supplemented with protease inhibitors protease inhibitors (Complete Mini, Roche Applied Science), 0.1 mM PMSF, 25 mM NEM, 1.5 mM aprotinin, and 23.4 mM leupeptin by douncing as above then sonicated for 10 seconds, 3 times at 40% amplitude on ice. T-PER samples were quantified using Bradford protein assay and RIPA samples were analyzed using Lowry protein assay. Protein fraction from tissue samples processed using TRIzolTM(Thermo Fisher A33251) reagent was prepared according to manufacturer’s protocol to solubilize organic protein phase and analyzed by Bradford protein assay.
Western blot analysis
Soluble Fractions, T-PER, and RIPA lysates were resolved by reducing and running 30μg of protein on 4–12% Bis-Tris Poly-Acrylamide gels (PAGE) at 150 V and transferred onto 0.45μM nitrocellulose membrane. 30μg of reduced, insoluble protein from Insoluble Fractions were resolved on 3–8% Tris-Acetate Poly-Acrylamide gels run at 150 V and transferred onto 0.45μM nitrocellulose membrane. Membranes were blocked in Starting block (Invitrogen) for 20 minutes at room temperature and probed in primary antibody overnight at 4°C. The following primary antibodies were used: anti-HTT (Millipore MAB5492) to detect HTTex1p, anti-actin (Sigma A5060), and anti-GAPDH (Novus Biologicals NB100-56875). Western blot data was quantified by determining the mean pixel intensity using Scion Image processing software. Soluble Fractions, T-PER, and RIPA lysates were normalized to house-keeping protein loading control (GAPDH or Actin) prior to statistical analysis. Insoluble protein was quantified as relative protein abundance as previous [23, 24].
Agarose gel electrophoresis analysis
Oligomeric species of mHTTex1p were detected using Agarose Gel Electrophoresis (AGE) as previously described [21] using a 1%, 375 mM Tris-HCl, pH 8.8, 1% SDS agarose gel. 30μg of protein was suspended in a non-reducing loading buffer (4x, 300 mM Tris-HCl pH 6.8, 66% glycerol, 2.4% SDS with BPB) and loaded onto an agarose gel without boiling. Samples were run in a 192 mM glycine, 24.8 mM Tris base, 0.1% SDS running buffer and transferred using an Invitrogen Novex Semi-Dry blotter onto 0.45μm PVDF membrane at 10 V for 1 hour. Membranes were blocked in starting block (Invitrogen) for 1 hour at room temp and probed with primary antibody overnight at 4°C. mHTTex1p was detected using anti-HTT (Millipore MAB5492) antibody. AGE data was quantified by determining the mean pixel intensity using Scion Image processing software as a relative protein abundance.
Filter retardation assay
Insoluble fibrils of mHTTex1p were detected using a filter retardation assay [16] with modifications. 30μg of insoluble samples obtained from Soluble/Insoluble Fractionation were suspended in 200μl of 0.1% SDS, boiled for 5 minutes, loaded on to a dot blot apparatus (BioRad), and blotted onto 0.2μm Cellulose Acetate membrane. Membrane was blocked for 1 hour at room temperature in 5% milk in TBST. Fibrils were detected with anti-HTT antibody (Enzo PW0595).
RNA isolation and real-time qPCR
Flash frozen brain regions harvested from R6/2 longitudinal animals were homogenized in TRIzolTM (Thermo Fisher A33251) and RNA was collected using manufacturer’s procedures then purified using RNEasy Mini kit (QIAGEN). Residual DNA was removed by DNase treatment incorporated into RNEasy protocol as per manufacturer’s suggestion. Following RNA isolation, reverse transcription was performed using SuperScript 3 First-strand synthesis system according to manufacturer’s protocol (Invitrogen). Both oligo (dT) and random hexamer primers were used in a 1:1 ratio with a total of 1μg RNA per sample. Final synthesized cDNA was diluted 1:10 in DEPC treated water and stored at –20°C until use. The following primers were used to amplify and detect cDNA from transcripts: full-length Htt (F: GCAGGG-AAAGAGCTTGAGACAC, R: CCTCATTCTCCTTGTGGCACTG), R6/2 transgene (F: CCGCTCAGGTTCTGCTTTTA, R: TGGAGGGACTTGAGGGACTC), Darpp-32/Ppp1r1b (F: TCTCAGAGCACTCCTCACCAGA, R: CACTCAAGTTGCTAATGGTCTGC), Rplp0 (F: GCTTCGTGTTCACCAAGGAGGA, R: GTCCTAGACCAGTGTTCTGAGC).
Statistical analysis
All data represented as mean±SEM with a p value of p < 0.05 considered statistically significant. Analyses were completed in GraphPad Prism software. Student’s two-tailed t-tests, assuming equal variance were performed for behavioral comparisons at designated time points between non-transgenic (NT) and R6/2 mice. Behavioral comparisons between R6/2 animals over time were completed by performing a 1-way ANOVA. Densitrometry and aggregate count from EM48 positive immunolabeling studies were analyzed by performing a 1-way ANOVA to assess changes overtime or 2-way ANOVA to compare between brain regions. Pixel intensity values were obtained from western blots and subjected to 1-way ANOVA to assess changes in protein quantity overtime in R6/2 mice. Statistical analysis was completed on the delta CT (dCT) values obtained from qPCR reactions normalized to Rplp0. When comparing relative to NT week 5, a 2-way ANOVA was used to assess changes in genotype and time. When comparing between R6/2 mice only, a 1-way ANOVA was used to assess changes over time in transcript levels. All 1-way ANOVAs were followed by Tukey’s multiple comparisons test. All 2-way ANOVAs were followed by Sidak’s multiple comparisons test.
RESULTS
R6/2 mice exhibit classic behavioral deficits
A longitudinal assessment of mHTTex1p species and tissue processing methods was performed in R6/2 transgenic mice based on their rapid progression of HD modeled phenotypes, the formation of detergent-insoluble aggregated species of mHTT and the extensive use of this model for preclinical studies [26]. These mice express the first exon of human HTT (CAG repeat of ∼125) encoding mHTTex1p and show reproducible and rapidly progressing motor and metabolic symptoms at 6 weeks of age and eventually develop tremors, lack of coordination, excessive weight loss, and early death (∼12 weeks). Animals were assessed in behavior tasks and tissue collected for biochemical assays at time points of 5, 7, 9 and 11 weeks of age. Behavioral deficits were consistent with reported data [10, 27], allowing direct comparison to molecular readouts. R6/2 mice had a significantly decreased latency to fall in the Rotarod task compared to non-transgenic controls (NT) at 7, 9, and 11 weeks of age (Fig. 1A; p < 0.0001). This latency to fall was progressive over time in R6/2 mice (F2,49 = 5.62, p < 0.01). Motor deficits were further characterized by a significantly increased time to descend on the pole test task between NT and R6/2 mice at 8 (p < 0.001) and 10 (p < 0.01) weeks of age, which represented maximal dysfunction that did not progress further in the later time points (Fig. 1B; F2,51 = 2.86, p > 0.05). At 6, 8, and 10 weeks of age, R6/2 mice show significantly impaired forelimb strength as measured by the grip strength test compared to NT mice (Fig. 1C; p < 0.0001), progressively worsening over time in R6/2 mice (F2,51 = 10.99, p < 0.0001). Additionally, clasping phenotype increased over the course of the disease indicating progressive dyskinesia and beginning at week 7, R6/2 mice show plateaued weight gain as compared to their NT littermates (Fig. 1D, E; Genotype: F1,272 = 70.69, p < 0.0001).
Fig.1
Progressive motor and transcriptional changes as quality control for R6/2 mice. A) R6/2 mice have significantly decreased latency to fall compared to non-transgenic controls (NT) that progressed over time. B) R6/2 mice display progressive and significantly increased time to descend on the pole test task through disease progression. C) R6/2 mice show significantly impaired forelimb strength as measured by the grip strength test compared to NT and progressively worsened over time. D) R6/2 mice show plateaued weight gain beginning at week 7 (Genotype: F1,272 = 70.69, p < 0.0001). E) Clasping deficits increase over the course of the disease. F) Striatal RNA shows significant fold change in Darpp-32 (Genotype: F1,16 = 58.54, p < 0.0001) and full length murine Htt (Genotype: F1,16 = 5.22, p < 0.05) relative to NT week 5. An increase in the R6/2 Transgene (F3,8 = 4.41, p < 0.05) fold change relative to R6/2 week 5 is observed. G) Cortical RNA shows significant changes in Darpp-32 (Genotype: F1,16 = 160.1, p < 0.0001) but not Htt (Age: F1,16 = 2.69, p > 0.05, Genotype: F1,16 = 0.02, p > 0.05) relative to NT week 5 or R6/2 transgene relative to week 5 R6/2 animals (F3,8 = 0.62, p > 0.05). Behavior: n = 36 (week 5); 27 (week 7); 18 (week 9); 9 (week 11). *p < 0.05, **p < 0.01, ***p < 0.001, values represent means±SEM. Statistical significance of genotypic differences was determined by unpaired, 2-tailed t-test for all behavioral analysis. 2-way ANOVA followed by Bonferroni post-hoc test for weight comparison. qPCR: n = 3 for each gene and timepoint. Statistical analysis was completed using 2-way ANOVAs for comparing to NT animals followed by Sidak’s multiple comparison’s test and 1-way ANOVAs comparing R6/2 mice at different ages followed by Tukey’s multiple comparison test.
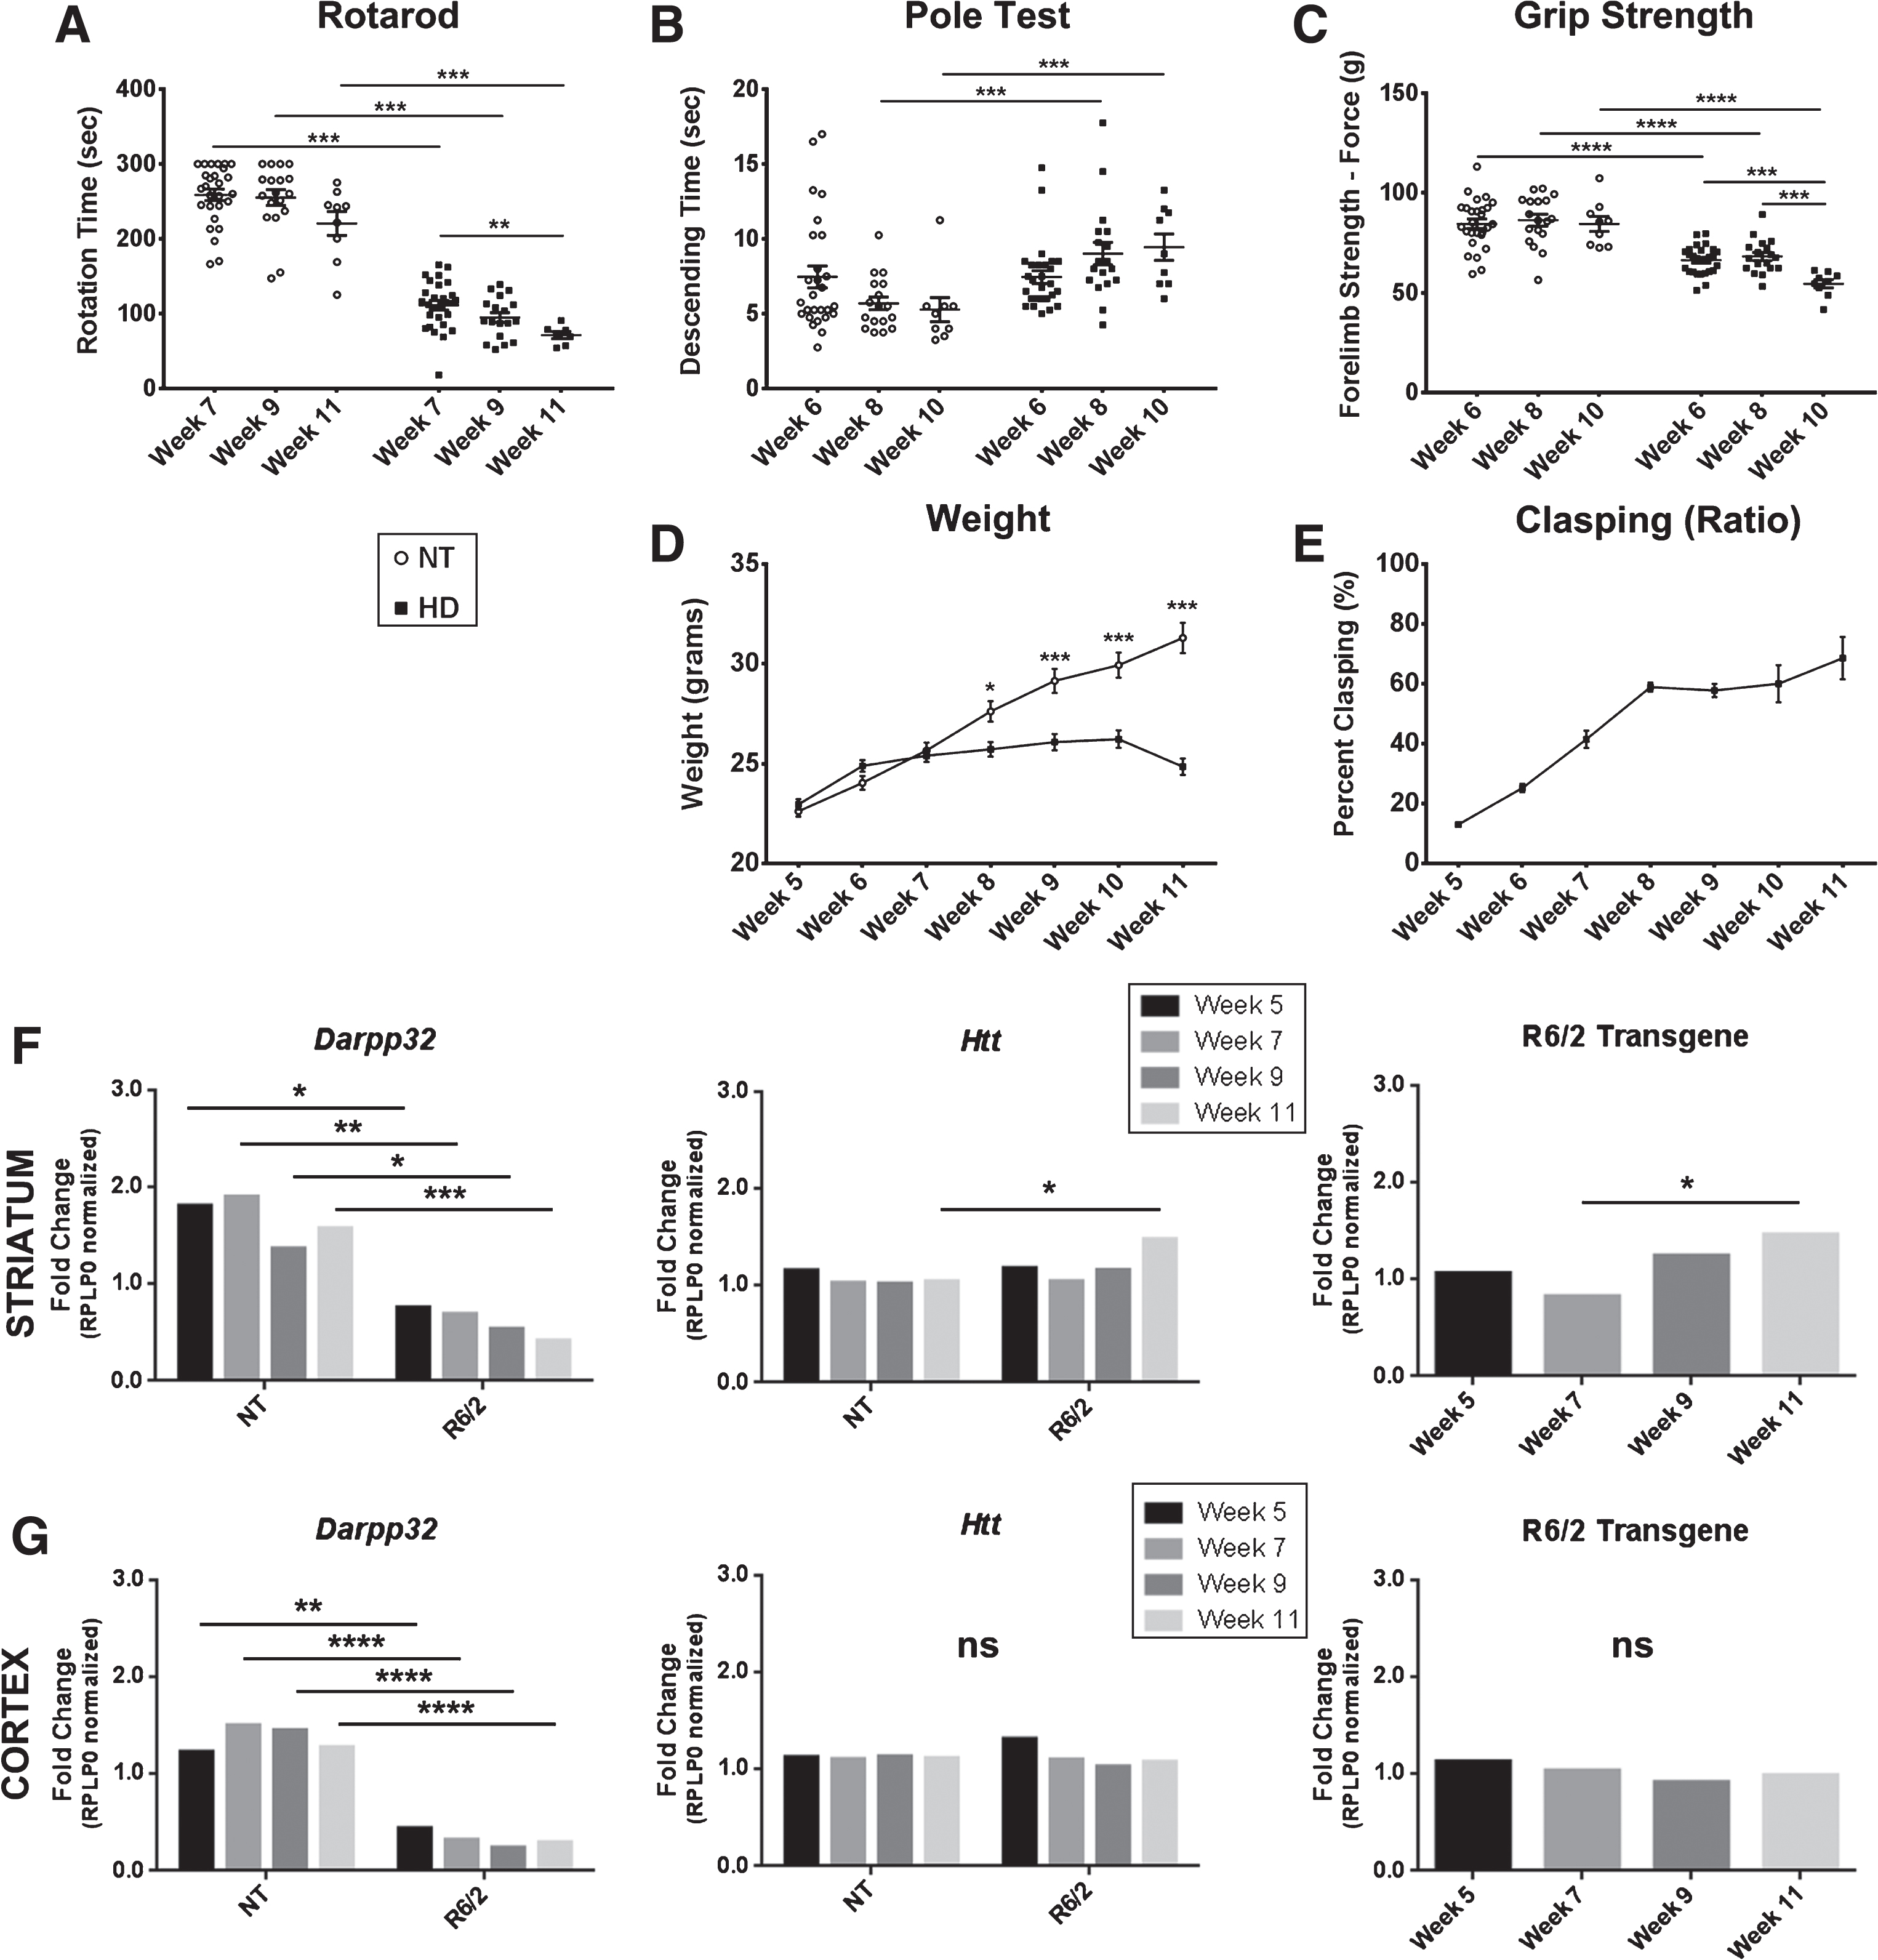
For quality control and to assess a molecular readout of disease progression supporting the validity of protein fluctuations in our longitudinal cohort of R6/2 animals, qPCR analysis was conducted on Ppp1r1b (Darpp-32), known to be dysregulated in R6/2 mice [28, 29], endogenous murine huntingtin (Htt), and the R6/2 transgene. Darpp-32 was significantly decreased at all ages in R6/2 mice compared to NT littermates in both the striatum (Genotype: F1,16 = 58.54, p < 0.0001) and the cortex (Genotype: F1,16 = 160.1, p < 0.0001, Fig. 1F, G, Supplementary Figure 6A,B) as reported [28, 29]. In the striatum, endogenous Htt increased in R6/2 mice at week 11 compared to week 11 NT littermates showing a significant genotype effect (F1,16 = 5.22, p < 0.05). A significant increase in R6/2 transgene by week 11 compared to week 7 was detected in R6/2 mice (F3,8 = 4.41, p < 0.05, Fig. 1F, Supplementary Figure 6A). In the cortex, there was no detectable difference in Htt in R6/2 compared to NT littermates at each age tested (Age: F3,16 = 2.69, p > 0.05, Genotype: F1,16 = 0.02, p > 0.05, Fig. 1G, Supplementary Figure 6B). While there was a significant increase in R6/2 transgene between weeks 7 and 11 of age in the striatum, there was no significant change in R6/2 transgene in the cortex (F3,8 = 0.62, p > 0.05). No genotype-related transcriptional changes were detected for Rplp0, which was used as a normalization factor. Further, reverse-transcriptase-negative controls showed no significant signal in any sample (data not shown).
Mutant HTT undergoes conformational flux over time in R6/2 mice
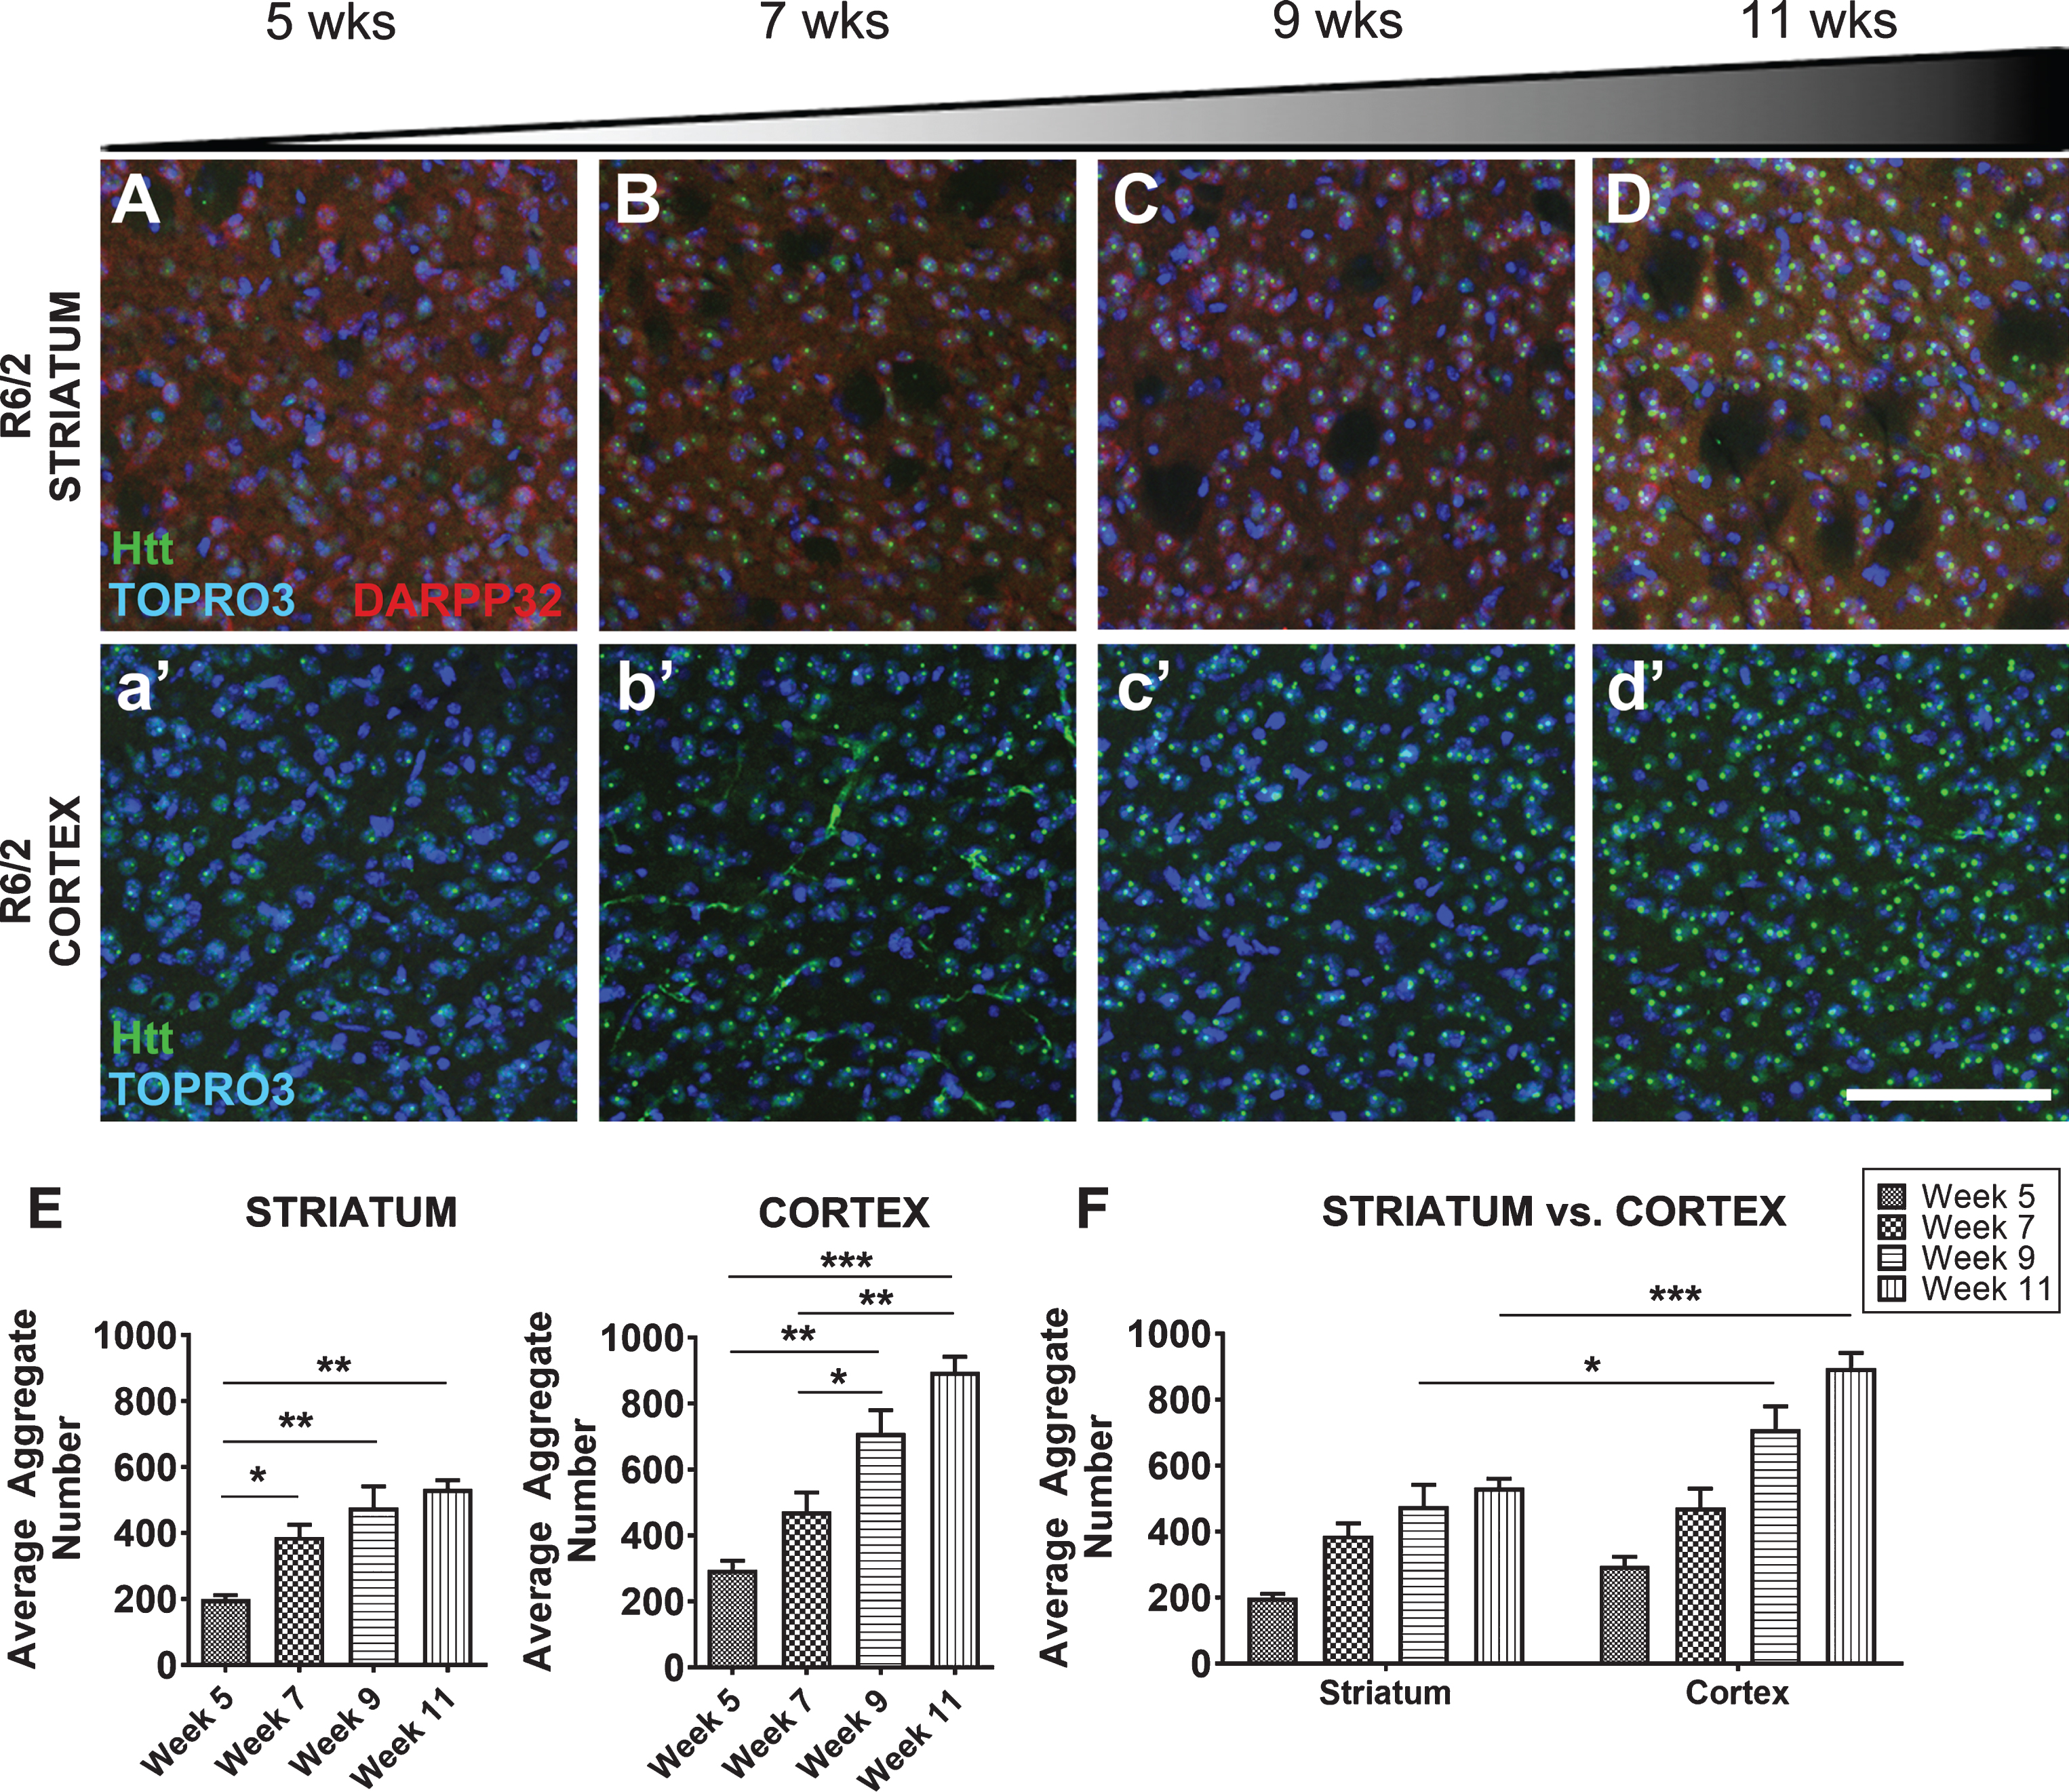
A standard outcome measure used to measure mHTT flux is the detection of intranuclear inclusion bodies by immunohistochemistry using aggregation specific antibodies (e.g., EM48, [30]), therefore, we evaluated inclusions in the R6/2 mouse striatum and cortex over time. R6/2 mice showed a progressive increase in mHTT inclusion body formation in both the striatum (F3,8 = 13.28, p < 0.01) and the cortex (F3,8 = 25.42, p < 0.001) compared from 5 weeks of age to later time points (Fig. 2). This is consistent with a conformational flux towards insoluble, aggregate species of mHTT beginning at the time of overt disease onset. Although striatum shows the most overt degeneration at late stages, cortical regions have significantly more inclusion bodies by 9 and 11 weeks of age compared to the striatum (Region: F1,16 = 34.69, p < 0.0001, Age: F3,16 = 37.89, p < 0.0001), consistent with what has previously been reported (Fig. 2) [8].
Fig.2
Progressive mHTT inclusion body formation in cortex and striatum of R6/2 mice. A-D, E) 5–11-week-old R6/2 mice show progressive inclusion body formation in striatum. a’-d’, E) Corresponding cortical area at 5–11 weeks indicates this site shows early and progressive inclusion formation (Striatum: F3,8 = 13.28, p < 0.01, Cortex: F3,8 = 25.42, p < 0.001) with F) more inclusions in the cortex than striatum (Region: F1,16 = 34.69, p < 0.0001, Age: F3,16 = 37.89, p < 0.0001). mHTT inclusion bodies stained with EM48 (green). Striatal tissue marked with DARPP-32 (red) and nuclei of all cells stained with TOPRO3 (blue). All images taken from coronal slices at 10x magnification, striatal and cortical images were taken from the same slice, quantified by IMARIS software, and analyzed by 1-way ANOVA followed by Tukey’s multiple comparison test or 2-way ANOVA followed by Sidak’s multiple comparison test. Representative images shown. Scale bar 100μm. *p < 0.05, **p < 0.01, ***p < 0.001, values represent means±SEM. n = 3 for all time points.
We have previously described a Soluble/Insoluble Fractionation protocol and Western blot analysis to distinguish soluble monomeric and accumulated insoluble mHTT species in late stage R6/2 mice [23, 24]. This technique was used for this longitudinal analysis of R6/2 mouse tissue and compared to other tissue lysis methods of striatum, cortex, hippocampus, cerebellum, and peripheral tissues (liver and skeletal muscle) using a HTT antibody that selectively detects human mHTTex1p.
Table 2
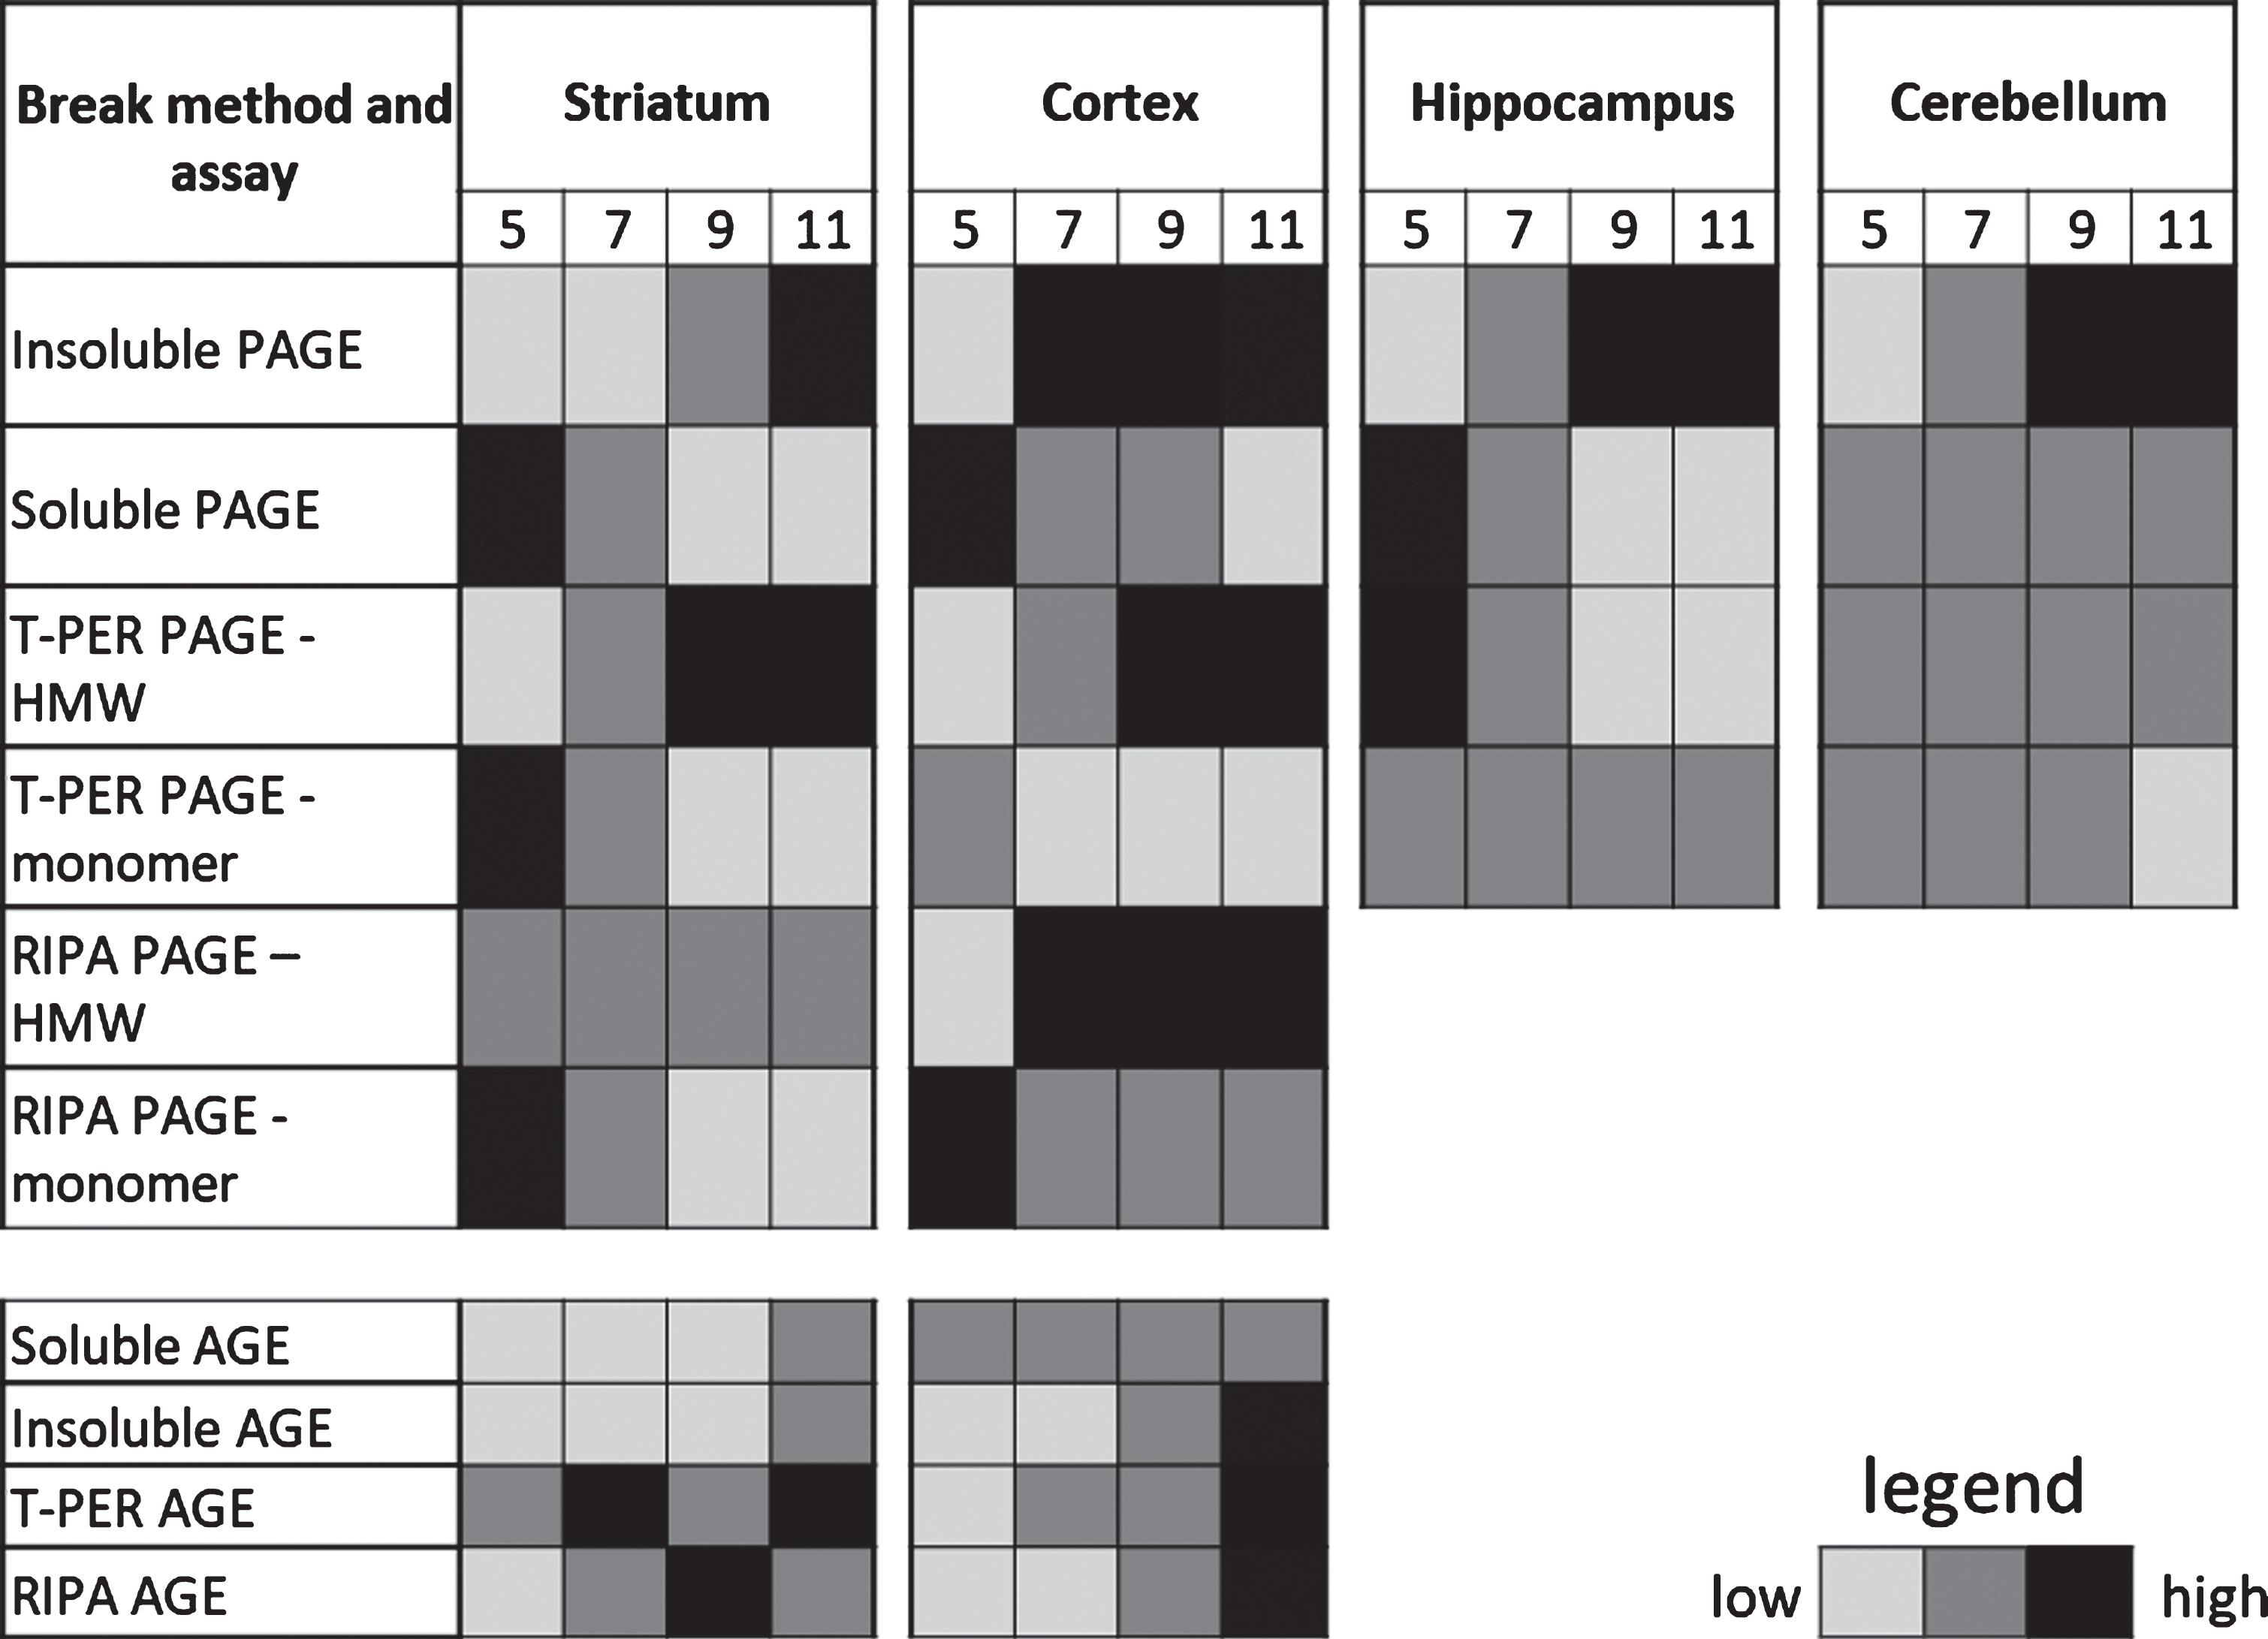
Summary heat map of mHTTex1p detected using various break methods and assays at 5, 7, 9, and 11 weeks of age. Representative gradient for each assay based on ease of detection for general comparison. Cannot quantify between assay methods for relative protein abundance
 |
Striatum
Following fractionation, the soluble protein fragment of human HTT encoded by the transgene in R6/2 mice, mHTTex1p, was detectable as a monomeric protein species in the Soluble Fraction, with highest levels at the first time point tested at 5 weeks of age in the striatum (Fig. 3A). Over the disease course the detectable amount of soluble mHTTex1p monomer decreased significantly (F3,8 = 15.51, p < 0.01) and appeared to be accompanied by a corresponding increase in the insoluble, HMW species of mHTTex1p, potentially reflecting the dynamic shift in mHTTex1p conformation from soluble monomer into an insoluble, accumulated species. However, significance was only supported by 1-way ANOVA and was not detected following post-hoc analysis (F3,8 = 4.274, p < 0.05, Fig. 3A). The observed fluctuation in size of the detectable monomer is not likely due to a somatic expansion in the striatum as the number of repeats present in the transgene was similar in the striatum compared to tail genomic DNA (Sup. Table 1, CAG repeat sizes in tails and striatum). Accompanying the apparent increase in insoluble HMW mHTTex1p resolved by PAGE and western blotting was an observed increase in insoluble fibrils of mHTTex1p from the Insoluble Fraction as detected by a filter retardation assay (Fig. 3A). To examine methods used to process samples then assess levels of mHTTex1p, a series of commonly used tissue lysis buffers specific for given assays were tested to compare outcomes (Table 1). An inverse fluctuation from monomeric mHTTex1p towards progressive detection of HMW mHTTex1p retained in the top of the gels were detected in striatal samples lysed in either T-PER (Monomer: F3,8 = 5.85, p < 0.05, HMW: F3,8 = 12.12, p < 0.01) or RIPA (Monomer: F3,8 = 25.44, p < 0.001, HMW: F3,8 = 4.06, p > 0.05) buffers as with the Soluble/Insoluble Fractionation (Fig. 3B, C) and summarized in Table 2. TRIzol reagent was also tested since it has the advantage of collection of both RNA and protein from processed tissue. However, TRIzol reagent showed extensive variability in detection of both soluble monomer and HMW species of mHTTex1p compared to other methods, precluding its use as an assay for shifts in solubility (Supplementary Figure 1A).
Fig.3
Detection of mHTTex1p in striatum of R6/2 mice. A) Striatal time-course samples were fractionated into Soluble and Insoluble proteins. Insoluble fraction reveals an increase in a HMW species of mHTTex1p throughout disease progression (F3,8 = 4.274, p < 0.05). Soluble fraction shows an inverse, significantly decreased monomeric form of mHTTex1p throughout disease progression (F3,8 = 15.51, p < 0.01). Insoluble aggregates detected by filter retardation (FR) assay may show a slight increase throughout disease progression‡. Striatal tissue samples broken in B) T-PER (Monomer: F3,8 = 5.85, p < 0.05, HMW: F3,8 = 12.12, p < 0.01) and C) RIPA (Monomer: F3,8 = 25.44, p < 0.001, HMW: F3,8 = 4.06, p > 0.05) reagents show a significant reduction of monomeric mHTex1pT throughout disease progression. Fluctuations in soluble, monomeric mHTTex1p correspond to varying CAG repeats in R6/2 mice. Western blots quantified by mean pixel value. Soluble fraction normalized to actin and analyzed by 1-way ANOVA followed by Tukey’s multiple comparison test. *p < 0.05, **p < 0.01, values represent means±SEM. n = 3 for all time points. HTT antibody MAB5492 used to detect mHTTex1p. Panel (A) has been modified with permission [42]. ‡Reprinted from Grima et al., 2017 [42] with permission from Elsevier.
![Detection of mHTTex1p in striatum of R6/2 mice. A) Striatal time-course samples were fractionated into Soluble and Insoluble proteins. Insoluble fraction reveals an increase in a HMW species of mHTTex1p throughout disease progression (F3,8 = 4.274, p < 0.05). Soluble fraction shows an inverse, significantly decreased monomeric form of mHTTex1p throughout disease progression (F3,8 = 15.51, p < 0.01). Insoluble aggregates detected by filter retardation (FR) assay may show a slight increase throughout disease progression‡. Striatal tissue samples broken in B) T-PER (Monomer: F3,8 = 5.85, p < 0.05, HMW: F3,8 = 12.12, p < 0.01) and C) RIPA (Monomer: F3,8 = 25.44, p < 0.001, HMW: F3,8 = 4.06, p > 0.05) reagents show a significant reduction of monomeric mHTex1pT throughout disease progression. Fluctuations in soluble, monomeric mHTTex1p correspond to varying CAG repeats in R6/2 mice. Western blots quantified by mean pixel value. Soluble fraction normalized to actin and analyzed by 1-way ANOVA followed by Tukey’s multiple comparison test. *p < 0.05, **p < 0.01, values represent means±SEM. n = 3 for all time points. HTT antibody MAB5492 used to detect mHTTex1p. Panel (A) has been modified with permission [42]. ‡Reprinted from Grima et al., 2017 [42] with permission from Elsevier.](https://content.iospress.com:443/media/jhd/2018/7-4/jhd-7-4-jhd180329/jhd-7-jhd180329-g003.jpg)
Cortex
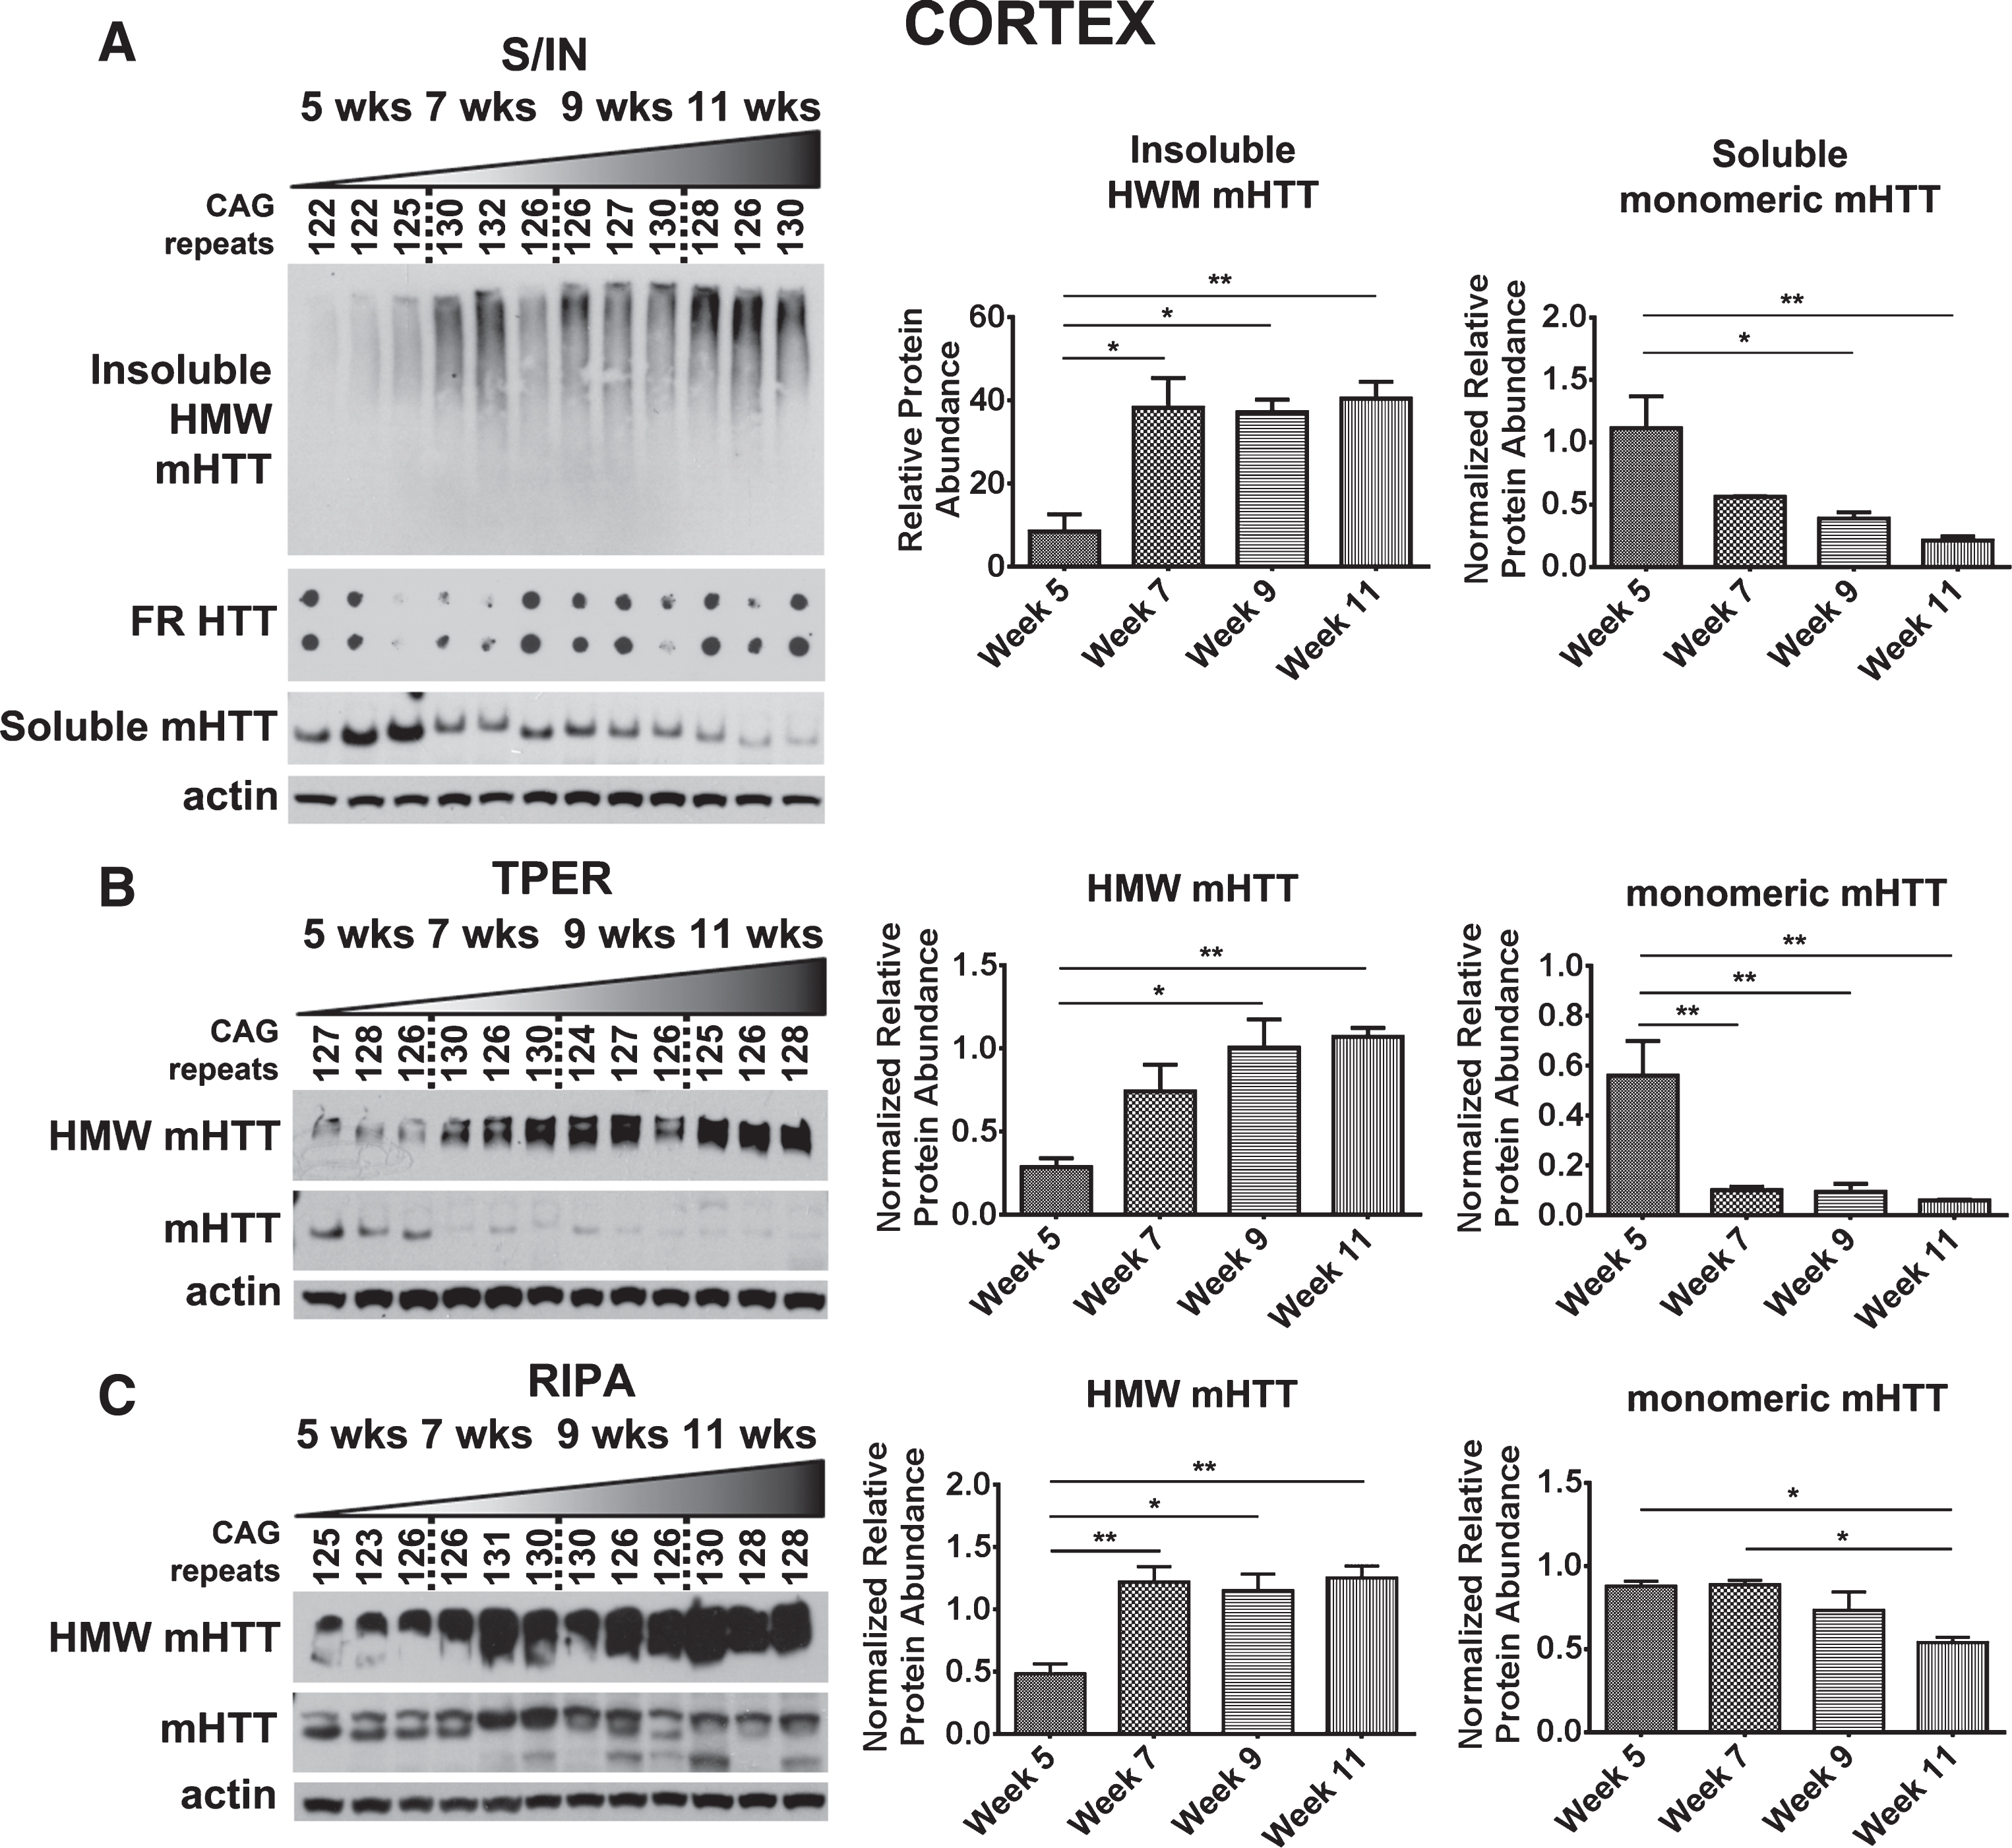
Cortical tissue samples were processed using the same methods in parallel and samples showed a similar dynamic shift from soluble, monomeric mHTTex1p to HWM mHTTex1p as observed in the striatum (Table 2, Fig. 4). Insoluble, HWM mHTTex1p significantly increased (F3,8 = 9.88, p < 0.01), while soluble, monomeric mHTTex1p significantly decreased (F3,8 = 8.78, p < 0.01, Fig. 4A). This shift was also accompanied by an observed increase in insoluble fibrils from the Insoluble Fraction similar to striatal samples (Fig. 4A). T-PER-processed samples showed significant reduction in monomeric mHTTex1p and increase in HMW mHTTex1p (Monomer: F3,8 = 10.91, p < 0.01, HMW: F3,8 = 8.42, p < 0.01, Fig. 4B), similarly seen in RIPA-processed samples (Monomer: F3,8 = 7.21, p < 0.05, HMW: F3,8 = 10.85, p < 0.01, Fig. 4C). Extensive variability in TRIzol-processed samples was again observed (Supplementary Figure 1C).
Fig.4
Detection of mHTTex1p in cortex of R6/2 mice. A) Cortical time-course samples were fractionated into Soluble and Insoluble proteins. Insoluble fraction reveals a significant increase in a HMW species of mHTT throughout disease progression (F3,8 = 9.88, p < 0.01). Soluble fraction shows an inverse, significantly decreased monomeric form of mHTTex1p throughout disease progression (F3,8 = 8.78, p < 0.01). Insoluble aggregates detected by filter retardation assay show no apparent change. Cortical tissue samples broken in B) T-PER (Monomer: F3,8 = 10.91, p < 0.01, HMW: F3,8 = 8.42, p < 0.01) and C) RIPA (Monomer: F3,8 = 7.21, p < 0.05, HMW: F3,8 = 10.85, p < 0.01) reagents show a significant reduction of monomeric mHTTex1p throughout disease progression accompanied by a significant increase in HMW mHTTex1p detected in the soluble fraction. Fluctuations in soluble, monomeric mHTTex1p correspond to varying CAG repeats in R6/2 mice. Western blots quantified by mean pixel value. Soluble fraction normalized to actin and analyzed by 1-way ANOVA followed by Tukey’s multiple comparison test. *p < 0.05, **p < 0.01, values represent means±SEM. n = 3 for all time points. HTT antibody MAB5492 used to detect mHTTex1p.
Hippocampus and cerebellum
The dynamic shift between soluble monomer and insoluble HMW mHTTex1p was observed in the hippocampus following Soluble/Insoluble Fractionation, showing significant conformational flux (Monomer: F3,8 = 142.2, p < 0.0001, HMW: F3,8 = 21.05, p < 0.001; Table 2, Supplementary Figure 2A). R6/2 mice have been previously reported to have deficits in spatial learning [31], a hippocampal-dependent process, as well as decreased hippocampal volume [32] and spine density [33], suggesting that this insoluble, HMW mHTTex1p protein could correlate with observed deficits in these animals. This shift, however, was not detected in tissue samples processed in T-PER reagent, showing no decrease in monomeric mHTTex1p (Monomer: F3,8 = 0.13, p > 0.05) but an increase in the unresolved, HMW accumulated mHTTex1p species (F3,8 = 5.41, p < 0.05, Supplementary Figure 2B). Insoluble, HMW mHTTex1p in the cerebellum significantly increased (F3,8 = 29.11, p < 0.0001), but the Soluble Fraction did not show significant soluble monomer flux throughout disease progression (F3,8 = 2.51, p > 0.05), indicating that mHTTex1p may be sequestered into a different form or aggregate species in the cerebellum and may provide insight into tissue specificity and vulnerability in HD (Table 2, Supplementary Figure 2C). Cerebellar tissue samples broken in T-PER reagent, however, showed a significant increase in accumulated mHTTex1p (F3,8 = 6.32, p < 0.05) and a corresponding decrease in soluble monomer (F3,8 = 4.25, p < 0.05, Supplementary Figure 2D). These results suggest that while accumulated HMW mHTTex1p tracks with disease pathogenesis and may serve as a robust measure of disease progression, additional methods to detect additional species of mHTT or levels of full-length endogenous HTT may be necessary to investigate tissue specific vulnerabilities or normal HTT levels [34].
Liver and skeletal muscle
We also evaluated liver and skeletal muscle samples for accumulation of HMW mHTTex1p in comparison to the brain tissue results. Liver samples show significant accumulation of insoluble, HMW mHTTex1p (F3,8 = 83.34, p < 0.0001). The soluble monomer, however, was not detectable using Soluble/Insoluble Fractionation (Supplementary Figure 3A, data not shown). Significant accumulation of HMW mHTTex1p was detected in samples broken in T-PER reagent (F3,8 = 12.79, p < 0.01) and interestingly, soluble monomeric mHTTex1p was also detectable in liver samples broken in T-PER reagent but no change in protein abundance during disease progression was detected with this break method (F3,8 = 2.95, p > 0.05, Supplementary Figure 3B). Like liver, significant accumulation of insoluble, HMW mHTTex1p was detectable in skeletal muscle only using Soluble/Insoluble Fractionation (F3,8 = 7.53, p < 0.05). No soluble monomer of mHTTex1p was detectable in skeletal muscle broken with either Soluble/Insoluble Fractionation or T-PER reagent. HMW mHTTex1p was not detected in T-PER (Supplementary Figure 3C, data not shown).
Oligomeric mHTT detection varies based on tissue processing
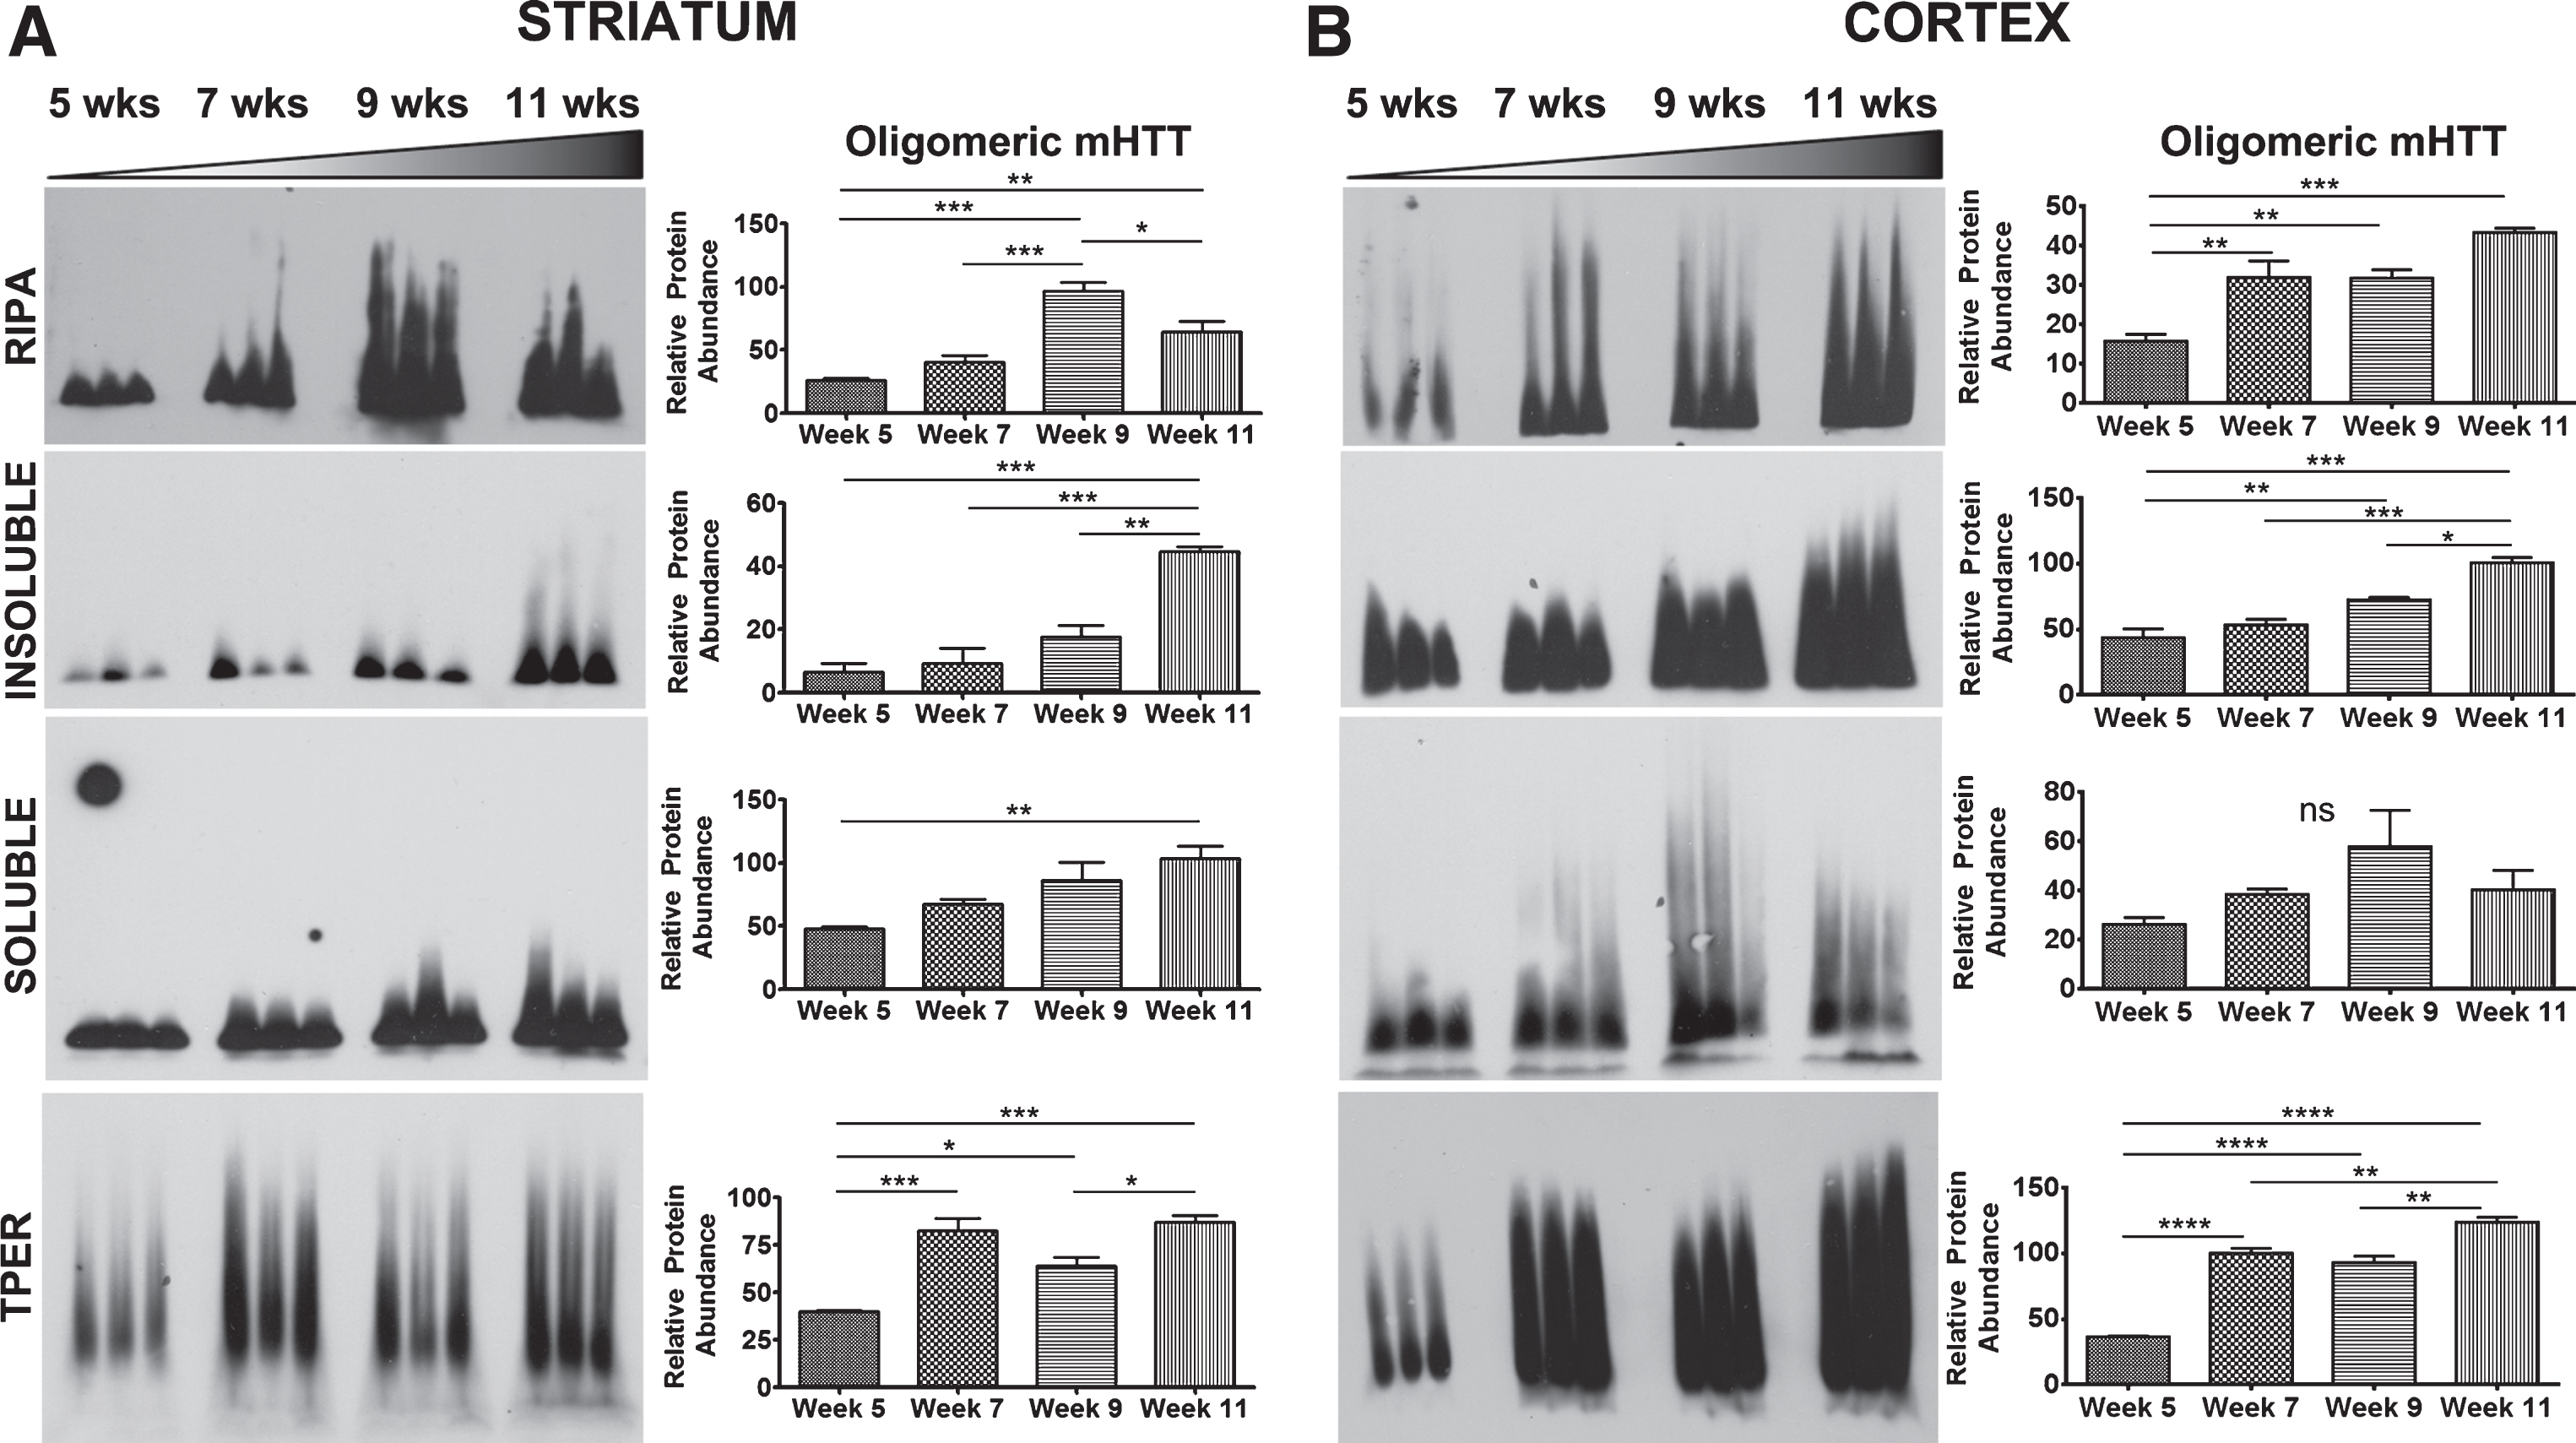
Agarose gel electrophoresis (AGE) has been used to resolve soluble, oligomeric species of mHTT in RIPA buffer as described [19, 21]. Tissue samples from striatum and cortex that were lysed using methods as above (Table 1) were also analyzed using AGE to compare how biochemical processing affected detection of mHTT species resolved by AGE. Detection of oligomeric mHTTex1p species on AGE gels throughout the course of the disease in R6/2 mice varied greatly depending on break method as summarized in Table 2 (Fig. 5). Striatal tissue samples from R6/2 mice broken in RIPA buffer showed an increase in oligomeric mHTTex1p through week 9 followed by a significant decrease by week 11 (F3,8 = 27.21, p < 0.001). However, R6/2 striatal samples showed increased oligomeric mHTTex1p through week 11 in both Insoluble (F3,8 = 27.31, p < 0.001) and Soluble (F3,8 = 7.30, p < 0.05) Fractions, and samples broken in T-PER (F3,8 = 24.70, p < 0.001, Fig. 5A), and TRIzol (F3,8 = 16.02, p < 0.001, Supplementary Figure 1B). Cortical tissue samples broken using identical methods more consistently showed a significant increase in oligomer formation (RIPA: F3,8 = 19.56, p < 0.001, Insoluble: F3,8 = 29.95, p < 0.001, T-PER: F3,8 = 109.3, p < 0.0001, Fig. 5B) with the exception of the Soluble Fraction (F3,8 = 2.291, p > 0.05) and of TRIzol samples (F3,8 = 0.95, p > 0.05, Supplementary Figure 1D) which showed no significant accumulation of mHTTex1p oligomers. Therefore, the variability in detectable oligomeric mHTTex1p among tissue processing methods is an important consideration when analyzing data in preclinical studies.
Fig.5
Detection of mHTTex1p on AGE gels varies based by break method. A) Striatal tissue samples broken in indicated buffers and analyzed by Agarose Gel Electrophoresis (AGE). R6/2 mice show an increase in oligomeric mHTTex1p through week 9 followed by a significant decrease by week 11 in RIPA broken samples (F3,8 = 27.21, p < 0.001). Increased, disease-endpoint mHTTex1p detected in Insoluble (F3,8 = 27.31, p < 0.001), Soluble (F3,8 = 7.30, p < 0.05), and T-PER (F3,8 = 24.70, p < 0.001) broken samples showed a significant increase by week 7, followed by a decrease in week 9 before increased again by week 11. B) Cortical samples broken in RIPA buffer (F3,8 = 19.56, p < 0.001), Insoluble (F3,8 = 29.95, p < 0.001) and Soluble fractionation (F3,8 = 2.291, p > 0.05), and T-PER buffer (F3,8 = 109.3, p < 0.0001) show either no change or significant increase in formation of oligomers by week 11. AGE blots were quantified by mean pixel value and analyzed by 1-way ANOVA followed by Tukey’s multiple comparison test. *p < 0.05, **p < 0.01, ***p < 0.001, ****p < 0.0001 values represent means±SEM. n = 3 for all time points. HTT antibody MAB5492 used to detect mHTTex1p.
DISCUSSION
Proteostasis in HD is perturbed by the expression of mHTT, shifting homeostatic balance and associated downstream cascades. Molecular and biochemical readouts such as aberrant mHTT accumulation and transcriptional alterations can be correlated to behavioral phenotypes in an effort to track disease modification. Our longitudinal cohort of R6/2 mice exhibited behavioral phenotypes as previously reported (Fig. 1, [10, 27–29]), allowing for a systematic comparison of changes in mHTTex1p conformations using selected cell lysis and biochemical assays in an HD model over time.
At the level of transcription, expression of Darpp-32 was decreased in R6/2 mice as expected, thus providing a reliable molecular quality control marker (Fig. 1, Supplementary Figure 4). While previously reported that transgene expression was within range of the endogenous murine gene in R6/2 mice [10], there was a moderate increase in the levels of endogenous Htt transcript in R6/2 mice in this study by 11 weeks of age in the striatum compared to age-matched NT controls, perhaps indicating an upregulation to compensate for transgene genotoxic stress or for the declining wild-type endogenous HTT protein levels observed in HD knock-in mice during aging [34]. Intriguingly, this increase also extended to expression of the R6/2 transgene in striatum, potentially reflecting compensatory upregulation of Htt given that the transgene is expressed from the human Htt promoter [10]. The upregulation of the transgene and of endogenous Htt was not observed in cortex, potentially reflecting some aspect of tissue specificity. Thus, when making assessments of protein levels, differential transcription may be considered in addition to changes in protein clearance mechanisms, such that the observed increase in R6/2 transgene expression in the striatum could also contribute to the detected increase in accumulated species of mHTTex1p.
Given that mHTT conformations have different biochemical properties, it is important to evaluate how tissue processing and analytical technique impact detection of conformers, and we assessed this in vivo assaying mHTTex1p from transgenic R6/2 HD mice. We first sought to resolve soluble and insoluble species of mHTTex1p in different brain regions and peripheral tissues. Accumulation of insoluble, HMW mHTTex1p resolved from the Insoluble Fraction was consistently detected in every tissue tested (Table 2, Supplementary Figure 2 and 3), and the appearance of the insoluble mHTTex1p accumulation tracked with onset of disease phenotypes. In striatum, cortex, and hippocampus, this increase was accompanied by a progressive decrease in the soluble mHTTex1p monomer associated with the transgene. The decrease in soluble mHTTex1p and corresponding increase in insoluble HMW species of mHTTex1p, tracking with disease progression, suggests that preventing this flux through therapeutic modulation may be therapeutically beneficial. Supporting this, our previous data showed that modulation of the insoluble, HMW species by reduction of the E3 SUMO ligase, Protein Inhibitor of Activated Stat 1 (PIAS1) in the striatum of R6/2 mice corresponded with beneficial behavioral and molecular alterations [23] and treatment with a compound that corresponds with worsened behavioral phenotypes, JQ1, increased levels of this insoluble, HMW species (unpublished results, Thompson). However, while this insoluble, HMW species tracked with disease progression and observed behavioral deficits, it did not provide insight into tissue specificity involved in disease pathogenesis. Therefore, this species may serve as a reliable readout for molecular progression of disease but not of tissue-specific vulnerabilities. An alternative methodology to further define levels of HTT species recently reported that levels of full-length mHTT protein do not decline robustly in cerebellum with aging, unlike in cortex and striatum, in two homozygous knock-in models, highlighting the importance of tracking multiple full-length and protein fragment species of both HTT and mHTT [34].
While accumulation of insoluble, HMW mHTTex1p was detectable in peripheral tissue (skeletal muscle and liver), Soluble/Insoluble Fractionation was unable to resolve the soluble, monomeric transgene protein product (Supplementary Figure 3). This could indicate an accelerated or differential aggregation pathway or preferential clearance of the monomer in peripheral tissue. Being able to accurately detect mHTT conformers would aid in establishing tissue intrinsic differences.
Whole-cell lysis techniques, such as RIPA and T-PER reported here, were able to resolve soluble monomeric mHTTex1p albeit with variability compared to other techniques used (Table 2). Interestingly, a HMW mHTTex1p species from whole-cell tissue processing methods was retained at the top of the gel when analyzed by PAGE and Western blot. It is possible that this HMW species contains both soluble and insoluble proteins and multiple mHTTex1p conformers and therefore cannot be directly compared to the insoluble, HMW mHTTex1p detected in the Insoluble Fraction that resolves in low-percentage PAGE gels. However, the whole-cell lysis HMW species reliably increased in some brain regions broken in both RIPA and T-PER buffers and therefore may also serve as a readout for molecular progression of disease.
Soluble oligomeric mHTT was previously shown to be detectable at an early age in HdhQ150 mice. Levels of this soluble species, detected by size exclusion chromatography, diminished over time and corresponded with an increase in intranuclear inclusion formation [18]. Though our findings present a similar trend, detection of an earlier oligomeric species of mHTTex1p is dependent on tissue processing (Table 2, Figure 5, Supplementary Figure 1B, D). Alternatively, due to the heterogeneity of oligomeric mHTT [6], certain biochemical processing methods may favor one soluble species over the other. Conformation-specific antibodies facilitate studies of various mHTT species and their association with pathogenesis (e.g., 3B5H10 [35], 1C2 [36], MW8 [37], EM48 [30]). Therefore, future in depth analysis using conformer specific antibodies may provide further insight [38].
Taken together, the data presented here is consistent with the dynamic shift of the soluble mHTT transgene protein product in R6/2 mice to an insoluble, HMW accumulated mHTTex1p species accompanied by a change in oligomeric mHTTex1p over the time course of the disease. Significantly, protein processing methods influence the detection and temporal effects. Protein processed in TRIzol reagent yielded the greatest amount of variation between assays for detecting different species of mHTTex1p (Supplementary Figure 1), precluding its use in these studies. However, TRIzol may be useful in detection of non-aggregating proteins to enable parallel protein and RNA processing.
The shift to insoluble, HMW and aggregated mHTTex1p from soluble monomer is associated with increasing behavioral dysfunction compared to NT mice and represents a robust protein assay to track disease progression in R6/2 mice. Understanding the outcomes of standard protein homeostasis assays to assess mHTTex1p flux in R6/2 mice provides a baseline for cross comparisons of preclinical interventions. It will be beneficial to conduct similar assessments of mHTTex1p flux in brain expressing full-length mutant HTT, given that mHTTex1p is expressed in knock-in HD mouse models and in patient brain [4, 12], and may be relevant to the onset of HD pathogenesis. A recent report showed a decrease in soluble mHTTex1p monomer in the zQ175 HD knock-in mouse model over time [12], suggesting that detecting this species as well as the insoluble, mHTTex1p species may be powerful cross-model molecular correlates. Indeed, in the assays here, decreasing monomeric mHTTex1p from fractionation of striatal tissue or breaking in RIPA appeared qualitatively to track most closely with the progression of phenotypes in the R6/2 mice. We have previously published a decrease in full-length HTT with age in striatum and cortex of two HD homozygous knock-in models and in wild-type controls, which may reflect a loss of full-length HTT protein function over time [34]. Due to the dynamic shift between mHTTex1p conformations throughout the course of the disease we propose using multiple, optimized biochemical analyses, potentially in combination with high context histological approaches as described for knock-in zQ175 mice [39] to determine the impact of potential therapeutics on the protein flux of both mHTTex1p and full-length HTT protein.
CONFLICT OF INTEREST
The authors have no conflict of interest to report.
ACKNOWLEDGMENTS
This work was supported by grants from the National Institute of Health: NS090390 and NS52789 (L.M.T.); NS072453 (J.S.S.). Support was also provided by NSF GRFP: 2016137353 (E.L.M.), NIH F31 NS087923 (J.O.), NIH T32 s AG00096 (S.H.) and NS082174 (I.S.), and Hereditary Disease Foundation (J.S.S.). We also thank the UCI Institute for Memory Impairments and Neurological Disorders and the Optical Biology Shared Resource of the Cancer Center Support Grant (CA-62203) at the University of California, Irvine for assistance in carrying out the reported studies.
SUPPLEMENTARY MATERIAL
[1] The supplementary material is available in the electronic version of this article: 10.3233/JHD-180329
REFERENCES
[1] | A novel gene containing a trinucleotide repeat that is expanded and unstable on Huntington’s disease chromosomes. The Huntington’s Disease Collaborative Research Group. Cell (1993) ;72: (6):971–83. |
[2] | Rub U , Seidel K , Heinsen H , Vonsattel JP , den Dunnen WF , Korf HW . Huntington’s disease (HD): The neuropathology of a multisystem neurodegenerative disorder of the human brain. Brain Pathol. (2016) ;26: (6):726–40. |
[3] | Koyuncu S , Fatima A , Gutierrez-Garcia R , Vilchez D . Proteostasis of Huntingtin in health and disease. Int J Mol Sci. (2017) ;18: (7):E1568. |
[4] | Sathasivam K , Neueder A , Gipson TA , Landles C , Benjamin AC , Bondulich MK , et al. Aberrant splicing of HTT generates the pathogenic exon 1 protein in Huntington disease. Proc Natl Acad Sci U S A. (2013) ;110: (6):2366–70. |
[5] | Hoffner G , Djian P . Polyglutamine aggregation in Huntington disease: Does structure determine toxicity? Mol Neurobiol (2015) ;52: (3):1297–314. |
[6] | Hoffner G , Djian P . Monomeric, oligomeric and polymeric proteins in huntington disease and other diseases of polyglutamine expansion. Brain Sci. (2014) ;4: (1):91–122. |
[7] | Ross CA , Kronenbuerger M , Duan W , Margolis RL . Mechanisms underlying neurodegeneration in Huntington disease: Applications to novel disease-modifying therapies. Handb Clin Neurol. (2017) ;144: :15–28. |
[8] | Davies SW , Turmaine M , Cozens BA , DiFiglia M , Sharp AH , Ross CA , et al. Formation of neuronal intranuclear inclusions underlies the neurological dysfunction in mice transgenic for the HD mutation. Cell. (1997) ;90: (3):537–48. |
[9] | DiFiglia M , Sapp E , Chase KO , Davies SW , Bates GP , Vonsattel JP , et al. Aggregation of huntingtin in neuronal intranuclear inclusions and dystrophic neurites in brain. Science. (1997) ;277: (5334):1990–3. |
[10] | Mangiarini L , Sathasivam K , Seller M , Cozens B , Harper A , Hetherington C , et al. Exon 1 of the HD gene with an expanded CAG repeat is sufficient to cause a progressive neurological phenotype in transgenic mice. Cell. (1996) ;87: (3):493–506. |
[11] | Steffan JS , Bodai L , Pallos J , Poelman M , McCampbell A , Apostol BL , et al. Histone deacetylase inhibitors arrest polyglutamine-dependent neurodegeneration in Drosophila. Nature. (2001) ;413: (6857):739–43. |
[12] | Neueder A , Landles C , Ghosh R , Howland D , Myers RH , Faull RLM , et al. The pathogenic exon 1 HTT protein is produced by incomplete splicing in Huntington’s disease patients. Sci Rep. (2017) ;7: (1):1307. |
[13] | Arndt JR , Chaibva M , Legleiter J . The emerging role of the first 17 amino acids of huntingtin in Huntington’s disease. Biomol Concepts. (2015) ;6: (1):33–46. |
[14] | Poirier MA , Li H , Macosko J , Cai S , Amzel M , Ross CA ((2002) ) Huntingtin spheroids and protofibrils as precursors in polyglutamine fibrilization. J Biol Chem. (2002) ;277: (43):41032–7. |
[15] | Scherzinger E , Lurz R , Turmaine M , Mangiarini L , Hollenbach B , Hasenbank R , et al. Huntingtin-encoded polyglutamine expansions form amyloid-like protein aggregates in vitro and in vivo. Cell. (1997) ;90: (3):549–58. |
[16] | Wanker EE , Scherzinger E , Heiser V , Sittler A , Eickhoff H , Lehrach H . Membrane filter assay for detection of amyloid-like polyglutamine-containing protein aggregates. Methods Enzymol. (1999) ;309: :375–86. |
[17] | Eisele YS , Monteiro C , Fearns C , Encalada SE , Wiseman RL , Powers ET , et al. Targeting protein aggregation for the treatment of degenerative diseases. Nat Rev Drug Discov. 14: (11):759–80. |
[18] | Marcellin D , Abramowski D , Young D , Richter J , Weiss A , Marcel A , et al. Fragments of HdhQ150 mutant huntingtin form a soluble oligomer pool that declines with aggregate deposition upon aging. PloS One. (2012) ;7: (9):e44457. |
[19] | Weiss A , Klein C , Woodman B , Sathasivam K , Bibel M , Regulier E , et al. ((2008) ) Sensitive biochemical aggregate detection reveals aggregation onset before symptom development in cellular and murine models of Huntington’s disease. J Neurochem. (2008) ;104: (3):846–58. |
[20] | Legleiter J , Mitchell E , Lotz GP , Sapp E , Ng C , DiFiglia M , et al. Mutant huntingtin fragments form oligomers in a polyglutamine length-dependent manner in vitro and in vivo. J Biol Chem. (2010) ;285: (19):14777–90. |
[21] | Sontag EM , Lotz GP , Yang G , Sontag CJ , Cummings BJ , Glabe CG , et al. Detection of mutant huntingtin aggregation conformers and modulation of SDS-soluble fibrillar oligomers by small molecules. J Huntingtons Dis. (2012) ;1: (1):119–32. |
[22] | Kim YM , Jang WH , Quezado MM , Oh Y , Chung KC , Junn E , et al. Proteasome inhibition induces alpha-synuclein SUMOylation and aggregate formation. J Neurol Sci. (2011) ;307: (1-2):157–61. |
[23] | Ochaba J , Monteys AM , O’Rourke JG , Reidling JC , Steffan JS , Davidson BL , et al. PIAS1 regulates mutant huntingtin accumulation and Huntington’s disease-associated phenotypes in vivo. Neuron. (2016) ;90: (3):507–20. |
[24] | Ochaba J , Morozko EL , O’Rourke JG , Thompson LM . Fractionation for resolution of soluble and insoluble huntingtin species. J Vis Exp. (2018) (132):doi.10.3791/57082. |
[25] | O’Rourke JG , Gareau JR , Ochaba J , Song W , Rasko T , Reverter D , et al. SUMO-2 and PIAS1 modulate insoluble mutant huntingtin protein accumulation. Cell Rep. (2013) ;4: (2):362–75. |
[26] | Li JY , Popovic N , Brundin P . The use of the R6 transgenic mouse models of Huntington’s disease in attempts to develop novel therapeutic strategies. NeuroRx. (2005) ;2: (3):447–64. |
[27] | Hickey MA , Gallant K , Gross GG , Levine MS , Chesselet MF . Early behavioral deficits in R6/2 mice suitable for use in preclinical drug testing. Neurobiol Dis. (2005) ;20: (1):1–11. |
[28] | Luthi-Carter R , Strand A , Peters NL , Solano SM , Hollingsworth ZR , Menon AS , et al. Decreased expression of striatal signaling genes in a mouse model of Huntington’s disease. Hum Mol Genet. (2000) ;9: (9):1259–71. |
[29] | Bibb JA , Yan Z , Svenningsson P , Snyder GL , Pieribone VA , Horiuchi A , et al. Severe deficiencies in dopamine signaling in presymptomatic Huntington’s disease mice. Proc Natl Acad Sci U S A. (2000) ;97: (12):6809–14. |
[30] | Gutekunst CA , Li SH , Yi H , Mulroy JS , Kuemmerle S , Jones R , et al. Nuclear and neuropil aggregates in Huntington’s disease: Relationship to neuropathology. J Neurosci. (1999) ;19: (7):2522–34. |
[31] | Lione LA , Carter RJ , Hunt MJ , Bates GP , Morton AJ , Dunnett SB . Selective discrimination learning impairments in mice expressing the human Huntington’s disease mutation. J Neurosci. (1999) ;19: (23):10428–37. |
[32] | Rattray I , Smith E , Gale R , Matsumoto K , Bates GP , Modo M . Correlations of behavioral deficits with brain pathology assessed through longitudinal MRI and histopathology in the R6/2 mouse model of HD. PloS One. (2013) ;8: (4):e60012. |
[33] | Bulley SJ , Drew CJ , Morton AJ . Direct visualisation of abnormal dendritic spine morphology in the hippocampus of the R6/2 transgenic mouse model of Huntington’s disease. J Huntingtons Dis. (2012) ;1: (2):267–73. |
[34] | Franich NR , Basso M , Andre EA , Ochaba J , Kumar A , Thein S , et al. Striatal mutant huntingtin protein levels decline with age in homozygous Huntington’s disease knock-in mouse models. J Huntingtons Dis. (2018) ;7: (2):137–50. |
[35] | Miller J , Arrasate M , Brooks E , Libeu CP , Legleiter J , Hatters D , et al. Identifying polyglutamine protein species in situ that best predict neurodegeneration. Nat Chem Biol. (2011) ;7: (12):925–34. |
[36] | Trottier Y , Devys D , Imbert G , Saudou F , An I , Lutz Y , et al. Cellular localization of the Huntington’s disease protein and discrimination of the normal and mutated form. Nat Genet. (1995) ;10: (1):104–10. |
[37] | Ko J , Ou S , Patterson PH . New anti-huntingtin monoclonal antibodies: Implications for huntingtin conformation and its binding proteins. Brain Res Bull. (2001) ;56: (3-4):319–29. |
[38] | Legleiter J , Lotz GP , Miller J , Ko J , Ng C , Williams GL , et al. Monoclonal antibodies recognize distinct conformational epitopes formed by polyglutamine in a mutant huntingtin fragment. J Biol Chem. (2009) ;284: (32):21647–58. |
[39] | Carty N , Berson N , Tillack K , Thiede C , Scholz D , Kottig K , et al. Characterization of HTT inclusion size, location, and timing in the zQ175 mouse model of Huntington’s disease: An in vivo high-content imaging study. PloS One. (2015) ;10: (4):e0123527. |
[40] | Ochaba J , Lukacsovich T , Csikos G , Zheng S , Margulis J , Salazar L , et al. Potential function for the Huntingtin protein as a scaffold for selective autophagy. Proc Natl Acad Sci U S A. (2014) ;111: (47):16889–94. |
[41] | Chabrier MA , Cheng D , Castello NA , Green KN , LaFerla FM . Synergistic effects of amyloid-beta and wild-type human tau on dendritic spine loss in a floxed double transgenic model of Alzheimer’s disease. Neurobiol Dis. (2014) ;64: :107–17. |
[42] | Grima JC , Daigle JG , Arbez N , Cunningham KC , Zhang K , Ochaba J , et al. Mutant huntingtin disrupts the nuclear pore complex. Neuron. (2017) ;94: (1):6–107e6. |


