
Striatal Mutant Huntingtin Protein Levels Decline with Age in Homozygous Huntington’s Disease Knock-In Mouse Models
Abstract
Background:
Huntington’s disease (HD) is a progressive neurodegenerative disorder associated with aging, caused by an expanded polyglutamine (polyQ) repeat within the Huntingtin (HTT) protein. In HD, degeneration of the striatum and atrophy of the cortex are observed while cerebellum is less affected.
Objective:
To test the hypothesis that HTT protein levels decline with age, which together with HTT mutation could influence disease progression.
Methods:
Using whole brain cell lysates, a unique method of SDS-PAGE and western analysis was used to quantitate HTT protein, which resolves as a monomer and as a high molecular weight species that is modulated by the presence of transglutaminase 2. HTT levels were measured in striatum, cortex and cerebellum in congenic homozygous Q140 and HdhQ150 knock-in mice and WT littermate controls.
Results:
Mutant HTT in both homozygous knock-in HD mouse models and WT HTT in control striatal and cortical tissues significantly declined in a progressive manner over time. Levels of mutant HTT in HD cerebellum remained high during aging.
Conclusions:
A general decline in mutant HTT levels in striatum and cortex is observed that may contribute to disease progression in homozygous knock-in HD mouse models through reduction of HTT function. In cerebellum, sustained levels of mutant HTT with aging may be protective to this tissue which is less overtly affected in HD.
INTRODUCTION
Huntington’s disease (HD) is an autosomal dominant progressive neurodegenerative disorder caused by the expansion of a CAG repeat coding for a polyglutamine (polyQ) tract within exon 1 of the HD gene. There is currently no disease-modifying treatment for HD [1]. Unaffected individuals have less than 35Qs within the polyQ stretch in the amino-terminal domain of the protein Huntingtin (HTT), whereas individuals with 40Qs or above manifest disease and the length of the polyQ repeat correlates with the severity of disease phenotypes [2, 3]. Overt symptoms typically appear in mid-life and are associated with psychiatric symptoms, cognitive deficits, chorea, sleep disturbances and muscle wasting, with characteristic neuropathology involving atrophy of the cortex and loss of medium spiny neurons in the striatum [4].
Disruption of protein homeostasis is a hallmark of HD and other neurodegenerative diseases [5]. This concept was initially set forth due to the accumulation of aggregation species, including neuronal protein inclusions in late stage mouse and human HD brain tissue [2]. The picture is much more complex given the multiple forms of mutant HTT protein (e.g., soluble monomers, soluble oligomers, insoluble oligomers, fibrils and fragments versus full-length), and the difficulty in defining the pathways instrumental in the dysregulation of protein homeostasis [6–8]. Mutation in HTT alters many cellular processes relevant to disease pathogenesis including autophagy, gene transcription, energy metabolism, DNA damage repair, endocytosis, vesicular transport, cell division, synaptic transmission and ciliogenesis, several of which may arise at least in part from decreased normal HTT functions [1, 9, 10], although the mutation alone does not ablate normal functions and mutant HTT can rescue null HTT phenotypes in mice [11]. A pivotal role for autophagy in the maintenance of protein homeostasis and its dysregulation in neurodegeneration has emerged in recent years and enhancers of autophagy can modulate HD phenotypes [12, 13]. Autophagy is a cellular pathway in which substrates for clearance (cargos) are targeted to the lysosome to be degraded by proteases, generating fuel for the cell during times of starvation and functioning to protect the cell from cellular stresses including pathogen invasion, oncogenic, oxidative and endoplasmic reticulum stress, hypoxia and DNA damage [14–16]. In vivo, a loss of autophagy can contribute to aging and causes neurodegenerative phenotypes in knockout mice [17].
Recently, our laboratory and another have independently demonstrated that at least one of the HTT protein’s normal functions is that of a scaffold for selective autophagy [9, 18, 19]. In turn, HTT may itself be degraded through its selective autophagic scaffolding function, an activity potentially reduced by expansion of the polyQ repeat in the mutant HTT protein, contributing to the observed accumulation of mutant HTT and autophagic substrates in inclusions of diseased neurons [20]. However, levels of several autophagy proteins also decline over time, which contributes to a reduction in autophagic flux during aging [21–24]. PolyQ expansion and aging could therefore cause a reduction in HTT function as an autophagic scaffold, resulting in impaired striatal proteostasis, even in the context of the mutant protein. Since HTT gene silencing to reduce HTT protein levels is currently being investigated in depth as a therapeutic for HD [25–27], it is critical to develop methods to accurately measure levels of WT and mutant HTT forms in HD and control brain tissue over time to evaluate if there is a correlation between HTT abundance, disease progression and aging.
As a first step in evaluating whether HTT abundance might impact HD pathogenesis, it was necessary to establish robust biochemical assays to visualize HTT levels and define flux as mice age. In this manuscript, we further establish and validate a unique western assay system to facilitate resolution of high molecular weight SDS-resistant species compared to soluble HTT monomer in brain whole cell lysate. We tested the hypothesis that overall cellular HTT protein levels might be modulated in the presence of the expanded repeat mutation and decline normally over time in WT mice and during disease pathogenesis in full-length homozygous mutant HTT knock-in mice. To visualize both soluble 350kD HTT full-length (FL) monomer and a high molecular weight (HMW) transglutaminase 2 (TG2)-modulated species of WT and of mutant HTT, we used unique SDS-PAGE gels and western analysis designed to measure total HTT abundance in brain tissue from HD and WT mice using a panel of HTT antibodies. We find that similar to several other autophagy proteins, normal HTT levels decline in WT control animals. In two independent HD knock-in mouse models, mutant HTT levels also decline with age, potentially contributing to the protein dyshomeostasis observed in HD. These results are consistent with the idea that a loss of HTT function, even in the mutant protein context, may contribute to HD pathogenesis.
MATERIALS AND METHODS
Q140 and HdhQ150 knock-in mice
Tissue was obtained from mice bred and housed at the University of California, Los Angeles (UCLA) and was a generous gift from Marie-Francoise Chesselet. Homozygous Q140 and HdhQ150 mutant mice and WT littermates that have been fully backcrossed onto the C57Bl/6 strain were used. In order to achieve full backcrossing of both Q140 and HdhQ150 models onto the C57Bl/6J strain, ten successive generations of backcrossed breeding results in a > 99.9% genetically pure C57Bl/6J background strain, which was confirmed by SNP analysis. Mice were bred in animal facilities operated by UCLA Division of Laboratory Animal Medicine. All mice were housed under identical conditions in temperature- and humidity-controlled housing facilities, with access to food and water ad libitum. Mice were weaned by 14 days and by 21 days of age tail tips were biopsied for genotyping at UCLA. Tail biopsies were again collected when mice were euthanized, for re-genotyping.
Tail biopsies from other mice sampled from the Q140 and HdhQ150 colonies in parallel to the studies described herein were used for CAG repeat length analysis at Laragen, Inc. (Culver City, CA). CAG repeat lengths for a set of homozygous mutant mice from both backcrossed HD knock-in lines were determined (Laragen, Inc., Los Angeles, CA). For Q140 homozygotes (n = 18), the longer allele had a mean of 127±2 CAG repeats, while the shorter allele had a mean of 119±1 CAG repeats. For HdhQ150 homozygotes (n = 17), the longer allele had a mean of 141±2 CAG repeats, while the shorter allele had a mean of 128±2 CAG repeats. Thus, in the backcrossed colonies, both HD knock-in lines had shorter CAG repeat lengths than the original mixed-lineage lines, and HdhQ150 had significantly longer CAG repeats lengths on average than Q140 mice (Student’s t-test, p < 0.001). All procedures were carried out in accordance with the NIH Guide for the Care and Use of Laboratory Animals (NIH Publications No. 80–23) revised 1996, and approved by the UCLA Institutional Animal Care and Use Committee. Mice were always euthanized and tissue collected at the same time of day, during the light phase of the diurnal cycle.
Fresh frozen brain tissue was collected at 3, 6 and 12 months of age. Groups of n = 6 per mice genotype at each age were used (3 m Q140, n = 4 females, n = 2 males, 3 m WT littermates n = 4 females, n = 2 males; 6 m Q140, n = 2 females, n = 4 males, 6 m WT littermates n = 2 females, n = 4 males; 12 m Q140, n = 2 females, n = 4 males, 12 m WT littermates, n = 3 females, n = 3 males; 3 m HdhQ150, n = 3 females, n = 3 males, 3 m WT littermates n = 4 females, n = 2 males; 6 m HdhQ150, n = 3 females, n = 3 males, 6 m WT littermates, n = 3 females, n = 3 males; 12 m HdhQ150, n = 3 females, n = 3 males, 12 m WT littermates, n = 2 females, n = 4 males). The proportion of males and females did not significantly differ between groups (Fisher’s exact test, p > 0.05, n.s.). Thus, the total number of Q140, HdhQ150 and WT littermate mice used in this study was n = 72. Mice were euthanized by cervical dislocation and fresh striatal, cortical and cerebellar tissue was dissected using a coronal brain matrix for mice with 1 mm divisions (Stoelting Co., Wood Dale, IL). Dissected tissue was transferred to 2 mL microcentrifuge tubes, snap-frozen in liquid nitrogen, and stored at – 80°C.
TG2 knock-out mice
C57BL/6 TG2 + /– mice were mated to generate TG2 + /+, TG2– /+, or TG2– /– pups. At 21 days, tail tips were biopsied for genotyping at Burke Medical Research Institute. All mice were housed under identical conditions in temperature- and humidity-controlled housing facilities. The use of animals and procedures were approved by the Institutional Animal Care and Use Committees of Weill Medical College of Cornell University. Genomic DNA for PCR was extracted from the tail with a DNeasy genomic DNA isolation kit (Qiagen) as described in [28]. Briefly, the TG2 knock-out alleles were detected using the primers 5′-CAGATAGGGATACAAGAAGCATTGAAG-3′ and 5′-GCCCCACAAAGGAGCAAGTGTTACTATGTC-3′. Fresh frozen brain tissue was collected at 4 weeks of age. Mice were euthanized by CO2 inhalation and fresh cortical tissue was dissected. Dissected tissue was transferred to 1.7 mL microcentrifuge tubes and snap-frozen in liquid nitrogen and stored at – 80°C.
Delta 17 knock-in mice
All experiments with mice were carried out in accordance with the ethical guidelines described in the “Guide for the Care and Use of Laboratory Animals”, Laboratory Animal Resources, National Research Council, 1996 edition. All procedures were reviewed and approved by the Animal Care and Use Committee of the University of Virginia. Knock-in mice expressing a version of Htt lacking amino acids 2–17 (Htt ΔN17) were generated as described [29]. Htt ΔN17/ΔN17 mice (Δ1-17 mice) were obtained from heterozygous intercrosses.
Western blot analysis of HTT protein from whole cell lysates
Brain whole cell lysate western analysis was performed similarly to that previously described by our laboratory for the analysis of HTT immunoprecipitated from nuclear and cytosolic fractions from brain tissue [30]. Brain tissue was dounced 20 times on ice in TPER buffer (Thermo) containing mini protease inhibitor and phos-stop pellets (Roche), 1 mM PMSF, 20 mM N-ethylmaleimide, phosphatase inhibitors 2 and 3 (Sigma-Aldrich), 10 ng/ml aprotenin, 10 ng/ml leupeptin, 5 mM NaF, 5 mM nicotinamide and 5 mM butyrate, pH 7.5. Lysates were not centrifuged, but were sonicated 3 x 10 sec on ice, then protein quantitated by Bradford analysis. 50μg of each sample was resuspended in 35μl of fresh loading buffer (2.083 ml of 1.5 M Tris– HCl, pH 6.8, 1 g SDS, 5 ml of 100% glycerol, 2.5 ml of beta-mercaptoethanol and 10 mg of bromophenol blue, then up to 10 ml with water). The samples were loaded on a hand-poured SDS– PAGE 8% gel upper layer (6 cm) and a 15% lower gel (4 cm) together with a DATD stacking gel of 0.75 cm thickness. The stacking gel was composed of 30% total acrylamide, which contains 4.5% DATD (N,N′-diallyl-tartardiamide, Aldrich 156868-25) as a crosslinker. The stacking gel contained 1.25 ml of 1 M Tris-HCl, pH 6.8, 1.00 ml of 30% /4.5% DATD acrylamide stock, 50μl of 20% SDS and 7.65 ml of water. An amount of 50μl of 10% ammonium persulfate and 10μl of TEMED were added to the stacking gel solution— the stacking gel was poured on the top of the separating gel. A 20-lane comb was inserted and the stack allowed to polymerize for 1 h. Western blotting was done using 16% methanol and 0.05% SDS in the standard Tris/glycine 1×buffer to PVDF (Millipore) membrane (overnight transfer, 56 volts at 4C). The membranes were blocked 30 minutes in TBS T20 Starting Block Buffer (Thermo) and then incubated overnight rotating at 4C with antibodies. Horseradish peroxidase-conjugated antibodies were detected using SuperSignal West Pico or Dura (Thermo) and western blots exposed to film were scanned then quantitated using the Scion software (Scion Software Solutions). Fluorophore-conjugated antibodies IRDye 680RD goat anti-rabbit 926-6801 (LI-COR. 1:20,000) and IRDye 800CW goat anti-mouse 926-32210 (LI-COR, 1:20,000) were detected and quantified using an Odyssey CLx Imager (LI-COR).
Immunohistochemistry quantitation of mutant HTT protein levels homozygous zQ175 knock-in brain slices
Perfusion-fixed brains from groups of 5 female zQ175 homozygous mice were Multibrain-embedded in two blocks and sectioned at 35 microns (Neuroscience Associates); sections were stored in cryprotectant at – 20C. Series containing every 24th section from each block were mixed and stained free-floating for HTT under uniform conditions as follows. Sections were washed, treated with sodium borohydride, blocked with 0.4% Triton X-100 in phosphate-buffered saline (TxPBS) and reacted overnight with 20 ng/ml rabbit monoclonal antibody to HTT (D7F7; Cell Signaling Technology). Antibody was detected with species-specific biotinylated anti-rabbit IgG (Vector Laboratories), Vector ABC Elite, and nickel-enhanced DAB (diaminobenzidine; Electron Microscopy Sciences) and glucose-glucose oxidase. After optimal development sections were mounted on gelatin-coated slides and cover-slipped. Stained sections were scanned on a flatbed scanner and digital images were uniformly adjusted and inverted in Photoshop CS. Consistent regions of interest were identified and the mean density and standard deviation determined for each group of five mice. Statistical differences were determined using one-way ANOVA with Bonferroni’s Multiple Comparison Tests. The mice were obtained from the Jackson Laboratories CHDI colony and the CAG repeat for these mice was approximately 200.
Antibodies
Anti-HTT antibody VB3130 (Viva Bioscience), an antibody made identically to Anti-HTT PW0595 (Enzo Life Sciences) [31], Anti-HTT D7H7 (Cell Signaling Technology) and Anti-HTT MAB2166 (Millipore Sigma) were used at dilutions of 1:1000. Anti-HTT HDB4E10 (Invitrogen) was used at 1:500 and Anti-HTT PW0595 (Enzo Life Sciences) was used at 1:5000. Anti-α-tubulin T6074 (Sigma-Aldrich) was used at 1:2000 dilution and anti-GAPDH (IMGENEX IMG-5019A-1, RRID: AB_316884) at 1:1000. We used a previously validated custom-made rabbit monoclonal antibody (Epitomics) specific for mouse TG2 [28]. The concentration of the antibody is 1.01 mg/ml and it has been used at a dilution of 1:1000. VB3130- and PW0595-reactivity (Supplementary Figure 1) was monitored in transiently transfected St14A cells [31] fractionated to soluble and insoluble fractions [32].
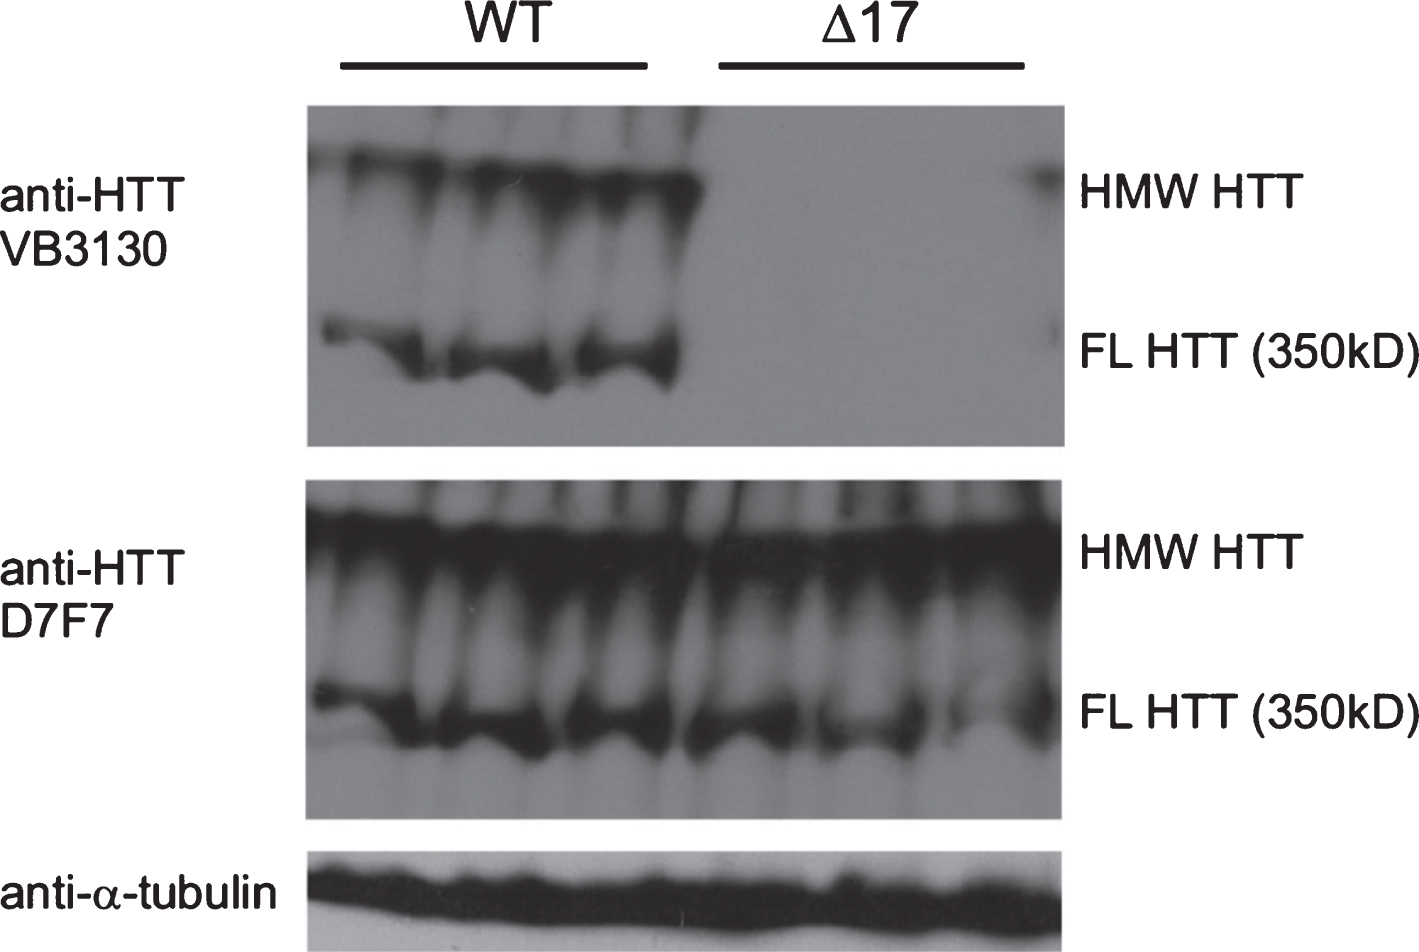
Fig.1
Characterization of HTT antibodies for western analysis and detection of 350 kDa (FL) monomer and high molecular weight (HMW) WT HTT in WT and Δ1-17 HTT mouse whole brain extracts. Whole cell lysate from brains of WT (n = 3, left) and Δ17 mice (29) (n = 3, right), 50 μg/lane run on DATD/8/15 % gel and transferred to PVDF for detection using anti-HTT (VB3130, Viva Bioscience and D7F7, Cell Signaling Technology) and anti-α-tubulin (Sigma-Aldrich). The protein species detected in the upper blot is WT HTT, as VB3130 generated against the first 17 amino acids of HTT detects proteins from whole WT brain extracts but does not detect protein in lysates from knock-in mice expressing only HTT lacking the first 17 amino acids (Δ17 mice), which can be visualized with D7F7, an anti-HTT antibody with an epitope in the central domain of HTT. The first 17 amino acids of HTT are not required for HMW HTT species formation in vivo. HMW HTT runs at the top of the separating gel, while FL HTT runs at approximately 350kD.
Statistical analysis
A critical value of p < 0.05 was used for all statistical analysis. Grubb’s test for outliers was performed and if a significant outlier was identified in a group, it was removed before comparisons between groups were performed. SigmaPlot v12 (Systat) was used for all statistical analysis using one-way ANOVA or two-way ANOVA, as appropriate, with Bonferroni post-hoc tests. Planned comparison Student’s t-tests were also used where indicated. Graphs were prepared using GraphPad Prism.
RESULTS
Validation of a western analysis assay to evaluate HTT protein levels in mouse brain whole cell lysate
To measure HTT levels in mouse brain tissue over time in WT and HD mice, we first developed a protocol that allowed the detection of both monomeric and a high molecular weight (HMW) form of WT HTT, which we found was a relatively abundant species in WT brain yet difficult to resolve in separating gels using standard western analysis approaches [30]. Here, we show that WT HTT can be reproducibly and quantitatively detected in mouse brain tissue whole cell sonicated lysates generated without centrifugation and using hand-poured SDS-PAGE gels (8% gel upper layer and 15% lower gel with a 4.5% DATD N,N′-diallyl-tartardiamide stacking gel), allowing resolution of HMW WT HTT at the top of the separating gel, and a WT full-length (FL) monomer running at approximately 350 kD. We tested the specificity of the western signal for these WT HTT species using anti-HTT VB3130 (Viva Bioscience), a rabbit polyclonal antibody generated against HTT amino acids 1–17 peptide (Supplementary Figure 1). Western analysis was performed on whole brain cell lysates from WT mice and from engineered WT mice homozygously deleted for the first 17 amino acids of HTT (Δ1-17 mice) [29], thereby lacking the VB3130 epitope. HMW and FL WT HTT were detected in lysates from WT but not in lysates from Δ1-17 brain tissue (Fig. 1), showing that these two species are specifically derived from HTT using this detection system. D7F7, another anti-HTT antibody (Cell Signaling) generated against a synthetic peptide corresponding to residues surrounding HTT proline 1220, detected both FL and HMW proteins in both WT and in Δ1-17 HTT mouse lysates (Fig. 1), demonstrating that the HMW HTT species may be derived from the full-length protein.
One of the challenges in detection of HTT protein from brain tissue lysates involves the presence and activity of transglutaminases, which contribute to aberrant crosslinking of proteins in neurodegenerative disease and potentially impact levels of HTT detected by our western analysis approach defined above. These enzymes are a class of Ca2 +-activated enzymes that catalyze transamidation reactions between glutamine and lysine residues to create irreversible inter- and intra-protein covalent crosslinks. There are four transglutaminases known to be expressed in brain, TG1, TG2, TG3 and TG6 [33]. TG2 plays a normal role in selective autophagic degradation of ubiquitinated proteins and in exosome formation, in addition to its well established functions in cell survival and death, and growth and differentiation [34–36]. TG2 localizes to astrocytes and microglia as well as neurons, and is activated in HD brain [37, 38]. Normal WT HTT is a TG2 substrate in vitro, and protein-protein crosslinking is increased in HD patient CSF [39–41]. Since TG2 can normally crosslink autophagy-related proteins [42] and given that WT HTT can function as an autophagic scaffold for ubiquitinated cargo [9, 19], we asked whether the WT HMW HTT species we detect in brain might reflect irreversibly crosslinked WT HTT created by transglutaminases.
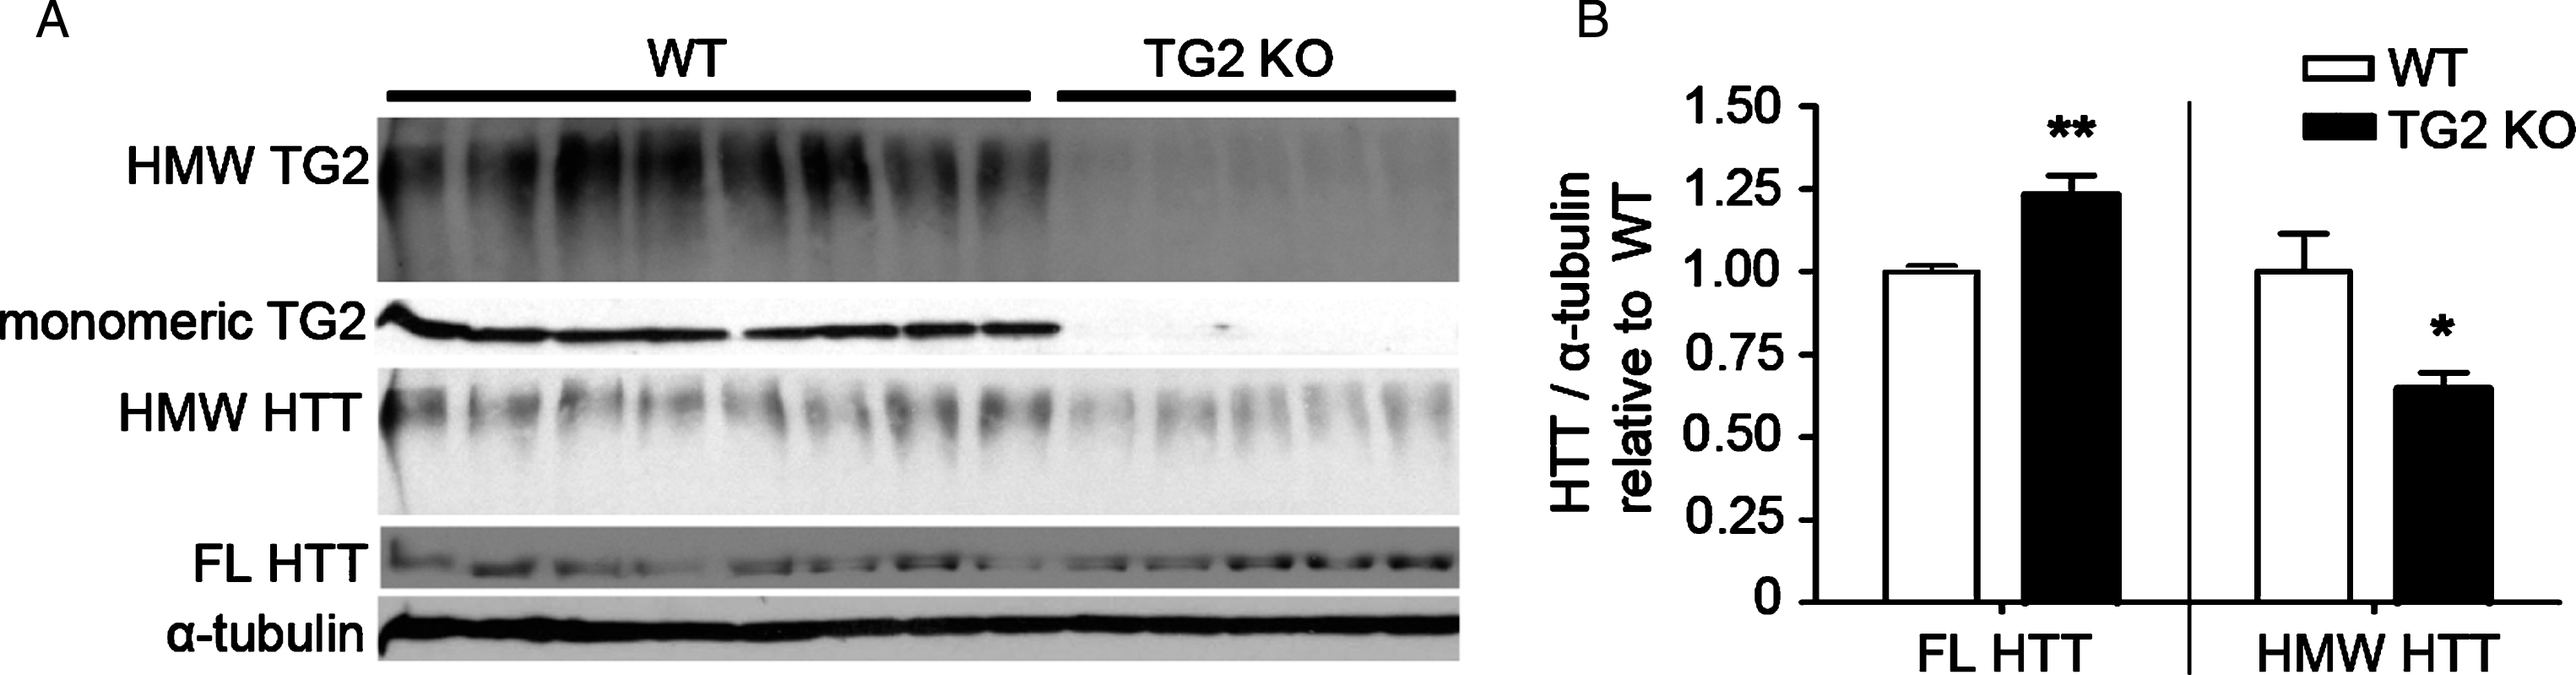
Whole cell levels of FL WT HTT monomer and HMW WT HTT from TG2-/- mice vs. controls were examined from cortical tissues to determine whether the HMW WT HTT species was still present or whether reduction of TG activity prevented its formation. VB3130 anti-HTT antibody was used for detection of the western analysis signal (Fig. 2A, B). TG2 knockout significantly increased levels of FL WT HTT monomer but reduced HMW WT HTT, suggesting that TG2 activity may help create a HMW crosslinked WT HTT species in brain under normal conditions. In addition to WT HTT, TG2 itself was present as a HMW species and as a monomer which suggests that TG2 and WT HTT may be covalently linked as a HMW species. HMW WT HTT was reduced but not absent upon TG2 knockout. This may reflect compensation by other TG isoforms, such as TG6 which is abundant in neurons [33], in the TG2 knockout cortex [36, 43], or by another potential transglutaminase in mammalian neurons, neuron-specific enolase, as its homolog in the yeast Candida albicans was recently found to have transglutaminase activity [44]. Therefore, our data suggests that transglutaminase activity may help create the HMW HTT species, which is of relevance when measuring HTT abundance in brain tissue, where the presence of transglutaminases make resolving total HTT more difficult. This data is important in the development of this western analysis assay, and it should be noted that the lysis buffer used for all brain tissue broken for western analysis in this study contains N-ethylmaleimide which covalently blocks the active site cysteine of transglutaminases [45], inhibiting the activity of transglutaminases during and after cell lysis in this work.
Fig.2
TG2 knockout in WT cortex increases levels of monomeric WT HTT and reduces levels of WT HMW HTT detected with anti-HTT VB3130. (A) Western blots of full-length (FL) HTT (∼350 kDa), high molecular weight (HMW) HTT species (running at the top of the separating gel), HMW TG2 species (running at the top of the separating gel), monomeric TG2 (75kD), and α-tubulin loading control (50kD) were detected in cortical lysates from 8 WT control vs. 5 TG2 knockout mice. (B) Graphs show mean+SEM and statistics were done by Student’s t-test: **p < 0.01, *p < 0.05.
Levels of HTT protein in brain are modulated by aging, tissue type, and HTT mutation
Using the HTT western analysis system described above, we went on to examine levels of FL and HMW mutant HTT in brain tissue over time from two homozygous knock-in (KI) models of HD, Q140 and HdhQ150, backcrossed onto the same C57Bl/6 background. Q140 KI mice express chimeric human/mouse exon 1 with an expanded CAG repeat and the human proline-rich region (PRR) inserted into the mouse Hdh gene, and HdhQ150 mice have 150 CAG repeats inserted into the mouse Hdh gene. Of the various KI models, Q140 [46, 47] and HdhQ150 [48–50] are among the best characterized.
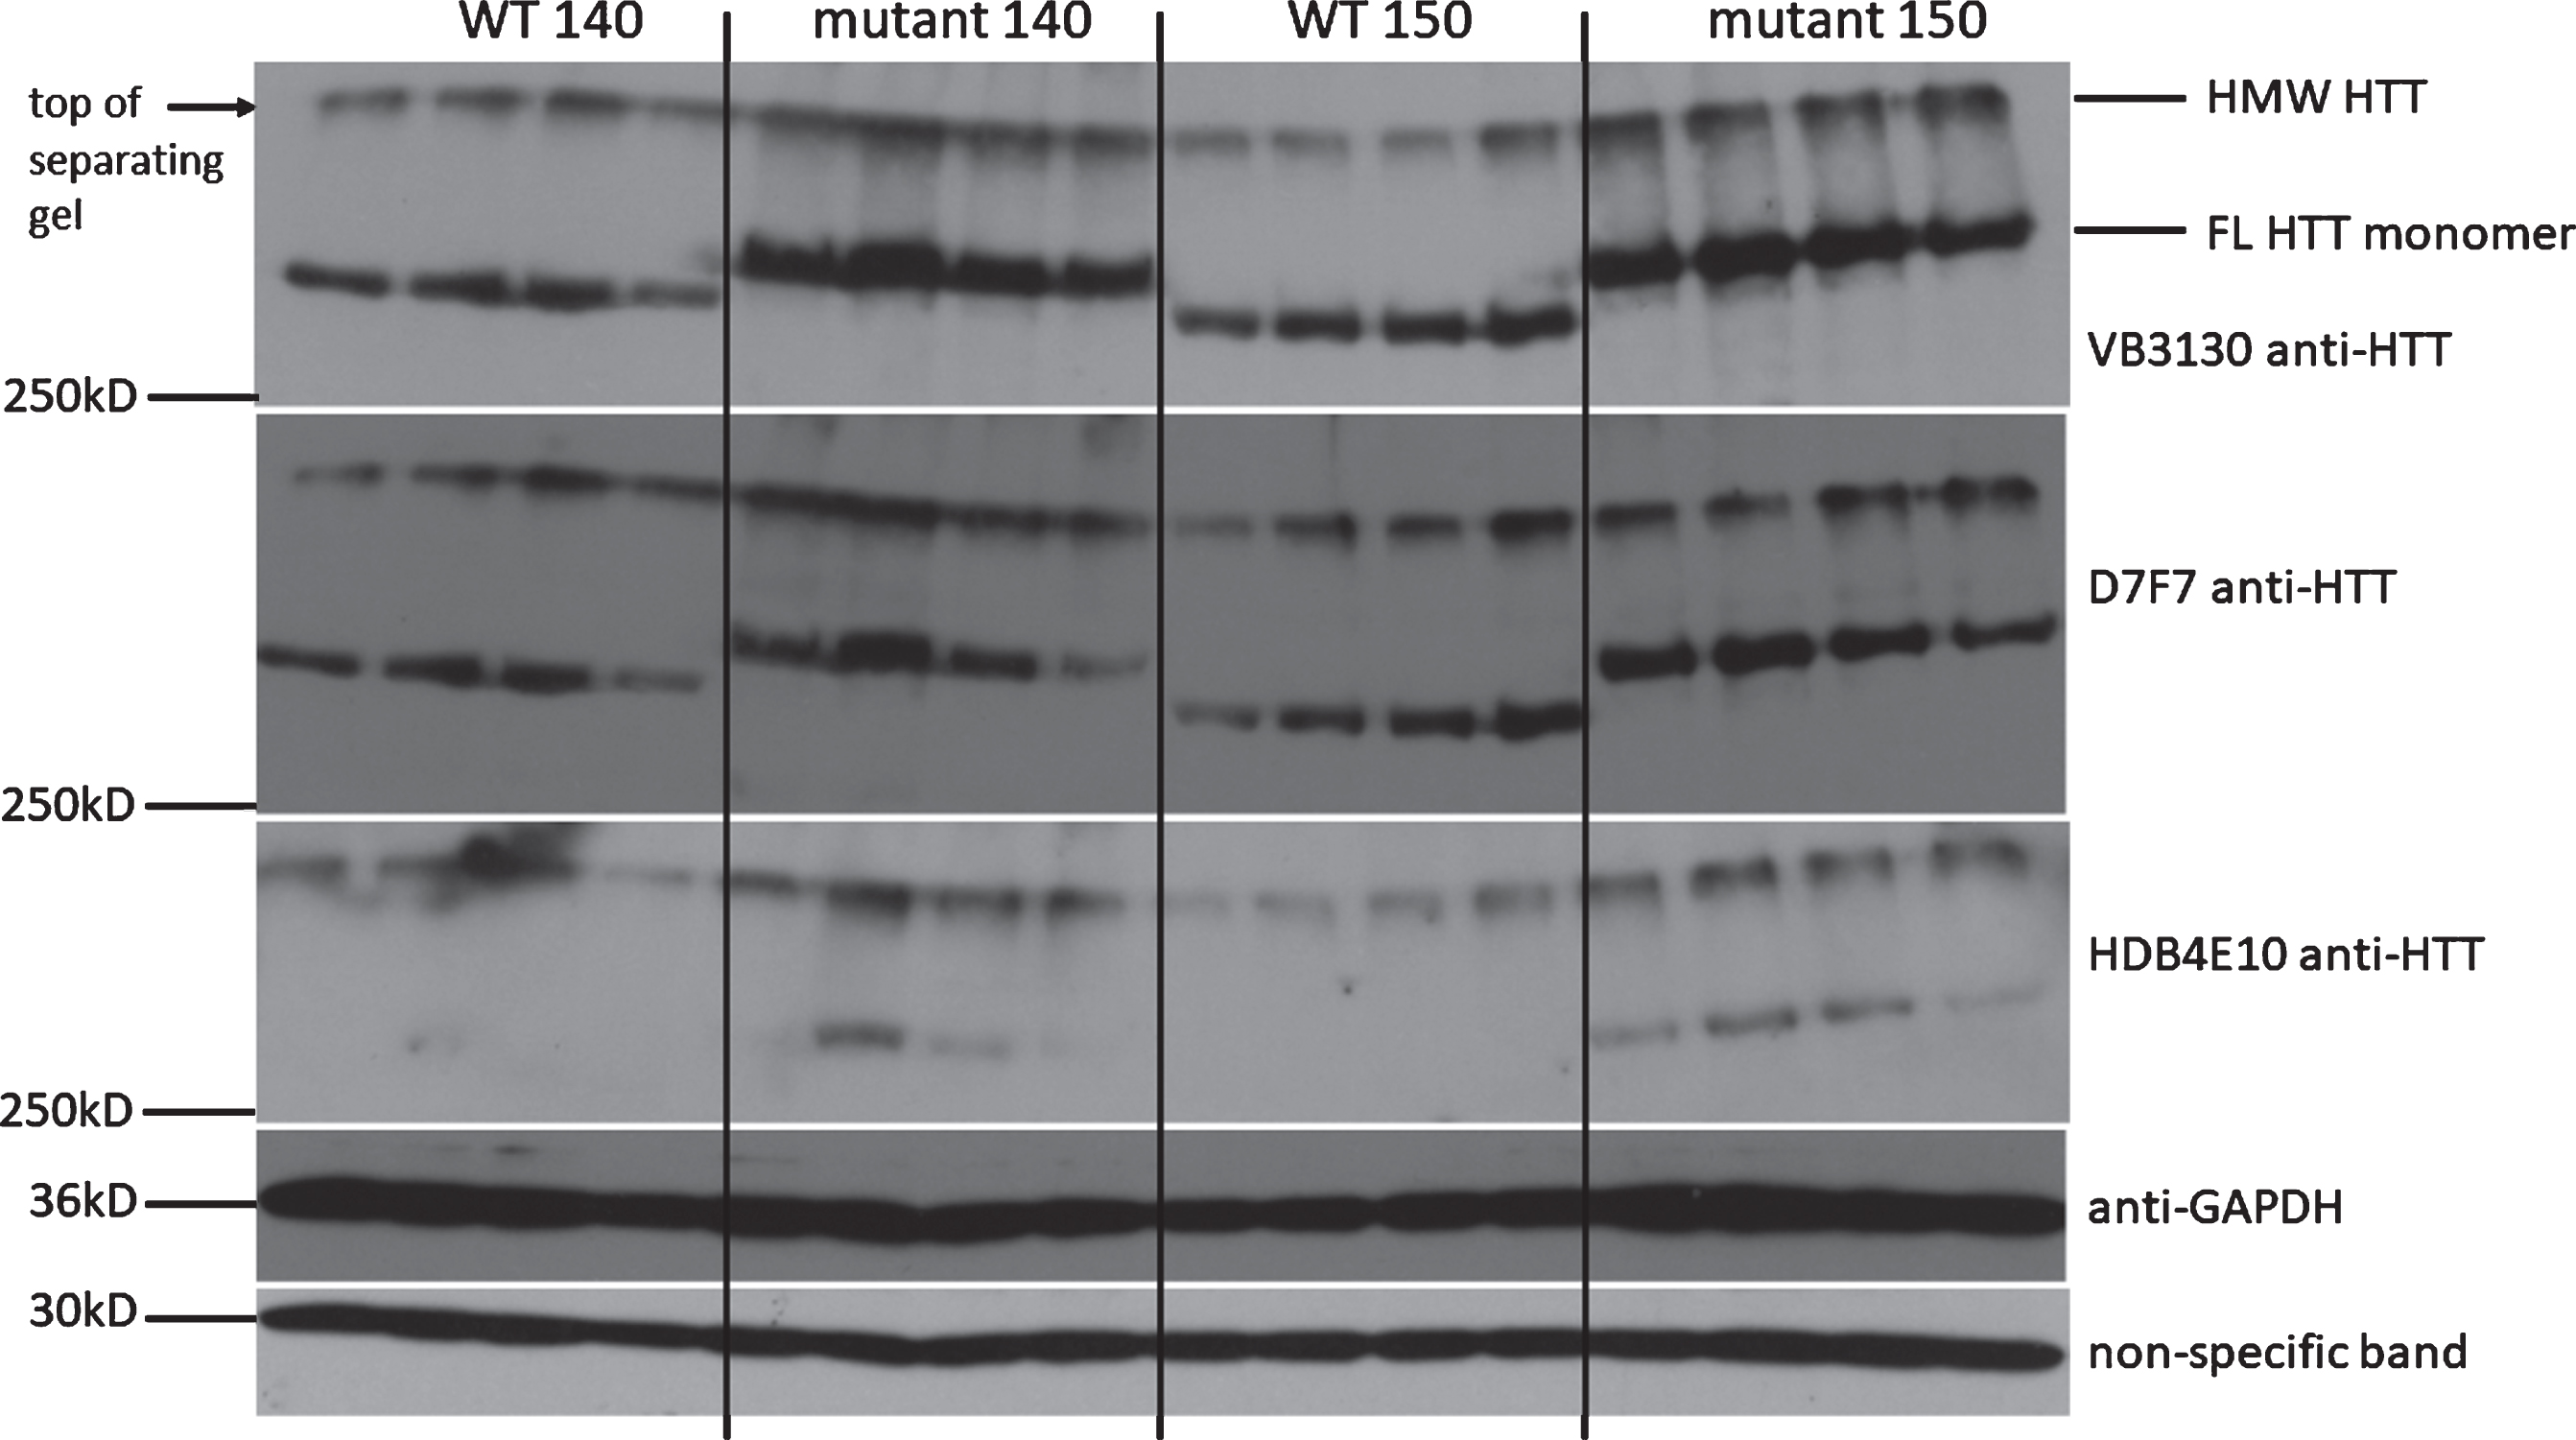
To initially characterize immunoreactivity of FL and HMW HTT protein in brain tissue from these congenic homozygous Q140 and HdhQ150 mice compared with WT controls, tissues were evaluated, first at 3 months of age (Fig. 3). In both homozygous mutant KI models, FL and HMW mutant HTT were detected using 3 separate anti-HTT antibodies that recognize different domains of HTT; VB3130 (amino acids 1–17), D7F7 (amino acids surrounding P1220), and HDB4E10 (amino acids 1844 – 2131). These results demonstrate that the HMW HTT species contains the full-length HTT protein in these KI models.
Fig.3
FL and HMW mutant HTT is detected in striatal lysates by three separate antibodies spanning the length of the HTT protein. In homozygous Q140 and HdhQ150 striatum, mutant FL and HMW HTT levels in whole striatal cell extract are visualized with 3 independent antibodies directed at the amino-terminal domain (VB3130), the central domain (D7F7) and the carboxy-terminal domain (HDB4E10) of HTT, demonstrating the HMW species contains the full-length HTT protein and validates the assay conditions Anti-GAPDH was used as a loading control, and also shown is a non-specific low molecular weight band detected by VB3130 demonstrating equal loading of extracts.
Using western analysis with anti-HTT VB3130, we then quantitatively evaluated mutant and WT HTT abundance in striatum, cortex and cerebellum over time, using tissue from homozygous KI HD models Q140 and HdhQ150 and WT littermate control animals at 3, 6 and 12 months of age (Figs. 4–6). For each model, anti-HTT VB3130 detected FL mutant HTT levels that showed an apparent significant elevation at 3 months above FL WT control levels in all tissues, suggesting increased expression or abundance of the mutant protein in these mice compared to WT mice. FL and HMW HTT, both mutant and WT, significantly declined with age in striatum and cortex (Figs. 4 and 5). In cerebellum (Fig. 6), mutant HTT levels were sustained, in contrast to their observed reduction in striatum and cortex. These data may correlate with the reduced impact of mutant HTT on the cerebellum compared with striatum and cortex in HD [51].
Fig.4
FL and HMW HTT protein levels detected with anti-HTT VB3130 decrease over time in striatum of homozygous Q140 and HdhQ150 mice. Western blots of full-length (FL) HTT (∼350 kDa) and high molecular weight (HMW) HTT species (running at the top of the separating gel) and α-tubulin loading control, at 3, 6 and 12 months of age in knock-in mice and their WT littermates in (A) Q140 striatum, and (B) HdhQ150 striatum. Protein lysate samples were run across two western blots for each knock-in mouse line and data were averaged, n = 3 per group per western blot for a total of n = 6 mice per group. Graphs show mean+SEM (n = 6) HTT/α-tubulin in 3, 6 and 12 months old Q140 and HdhQ150 mice and WT littermates, relative to WT levels at 3 months for (C) striatal FL HTT, and (D) striatal HMW HTT. Two-way ANOVA with Bonferroni post-hoc tests, within each knock-in mouse line: *p < 0.05, **p < 0.01, ***p < 0.001, compared to WT littermates at the same age; ∧ p < 0.05, ∧∧ p < 0.01, ∧∧∧ p < 0.001, compared to 3 month old mice of the same genotype.
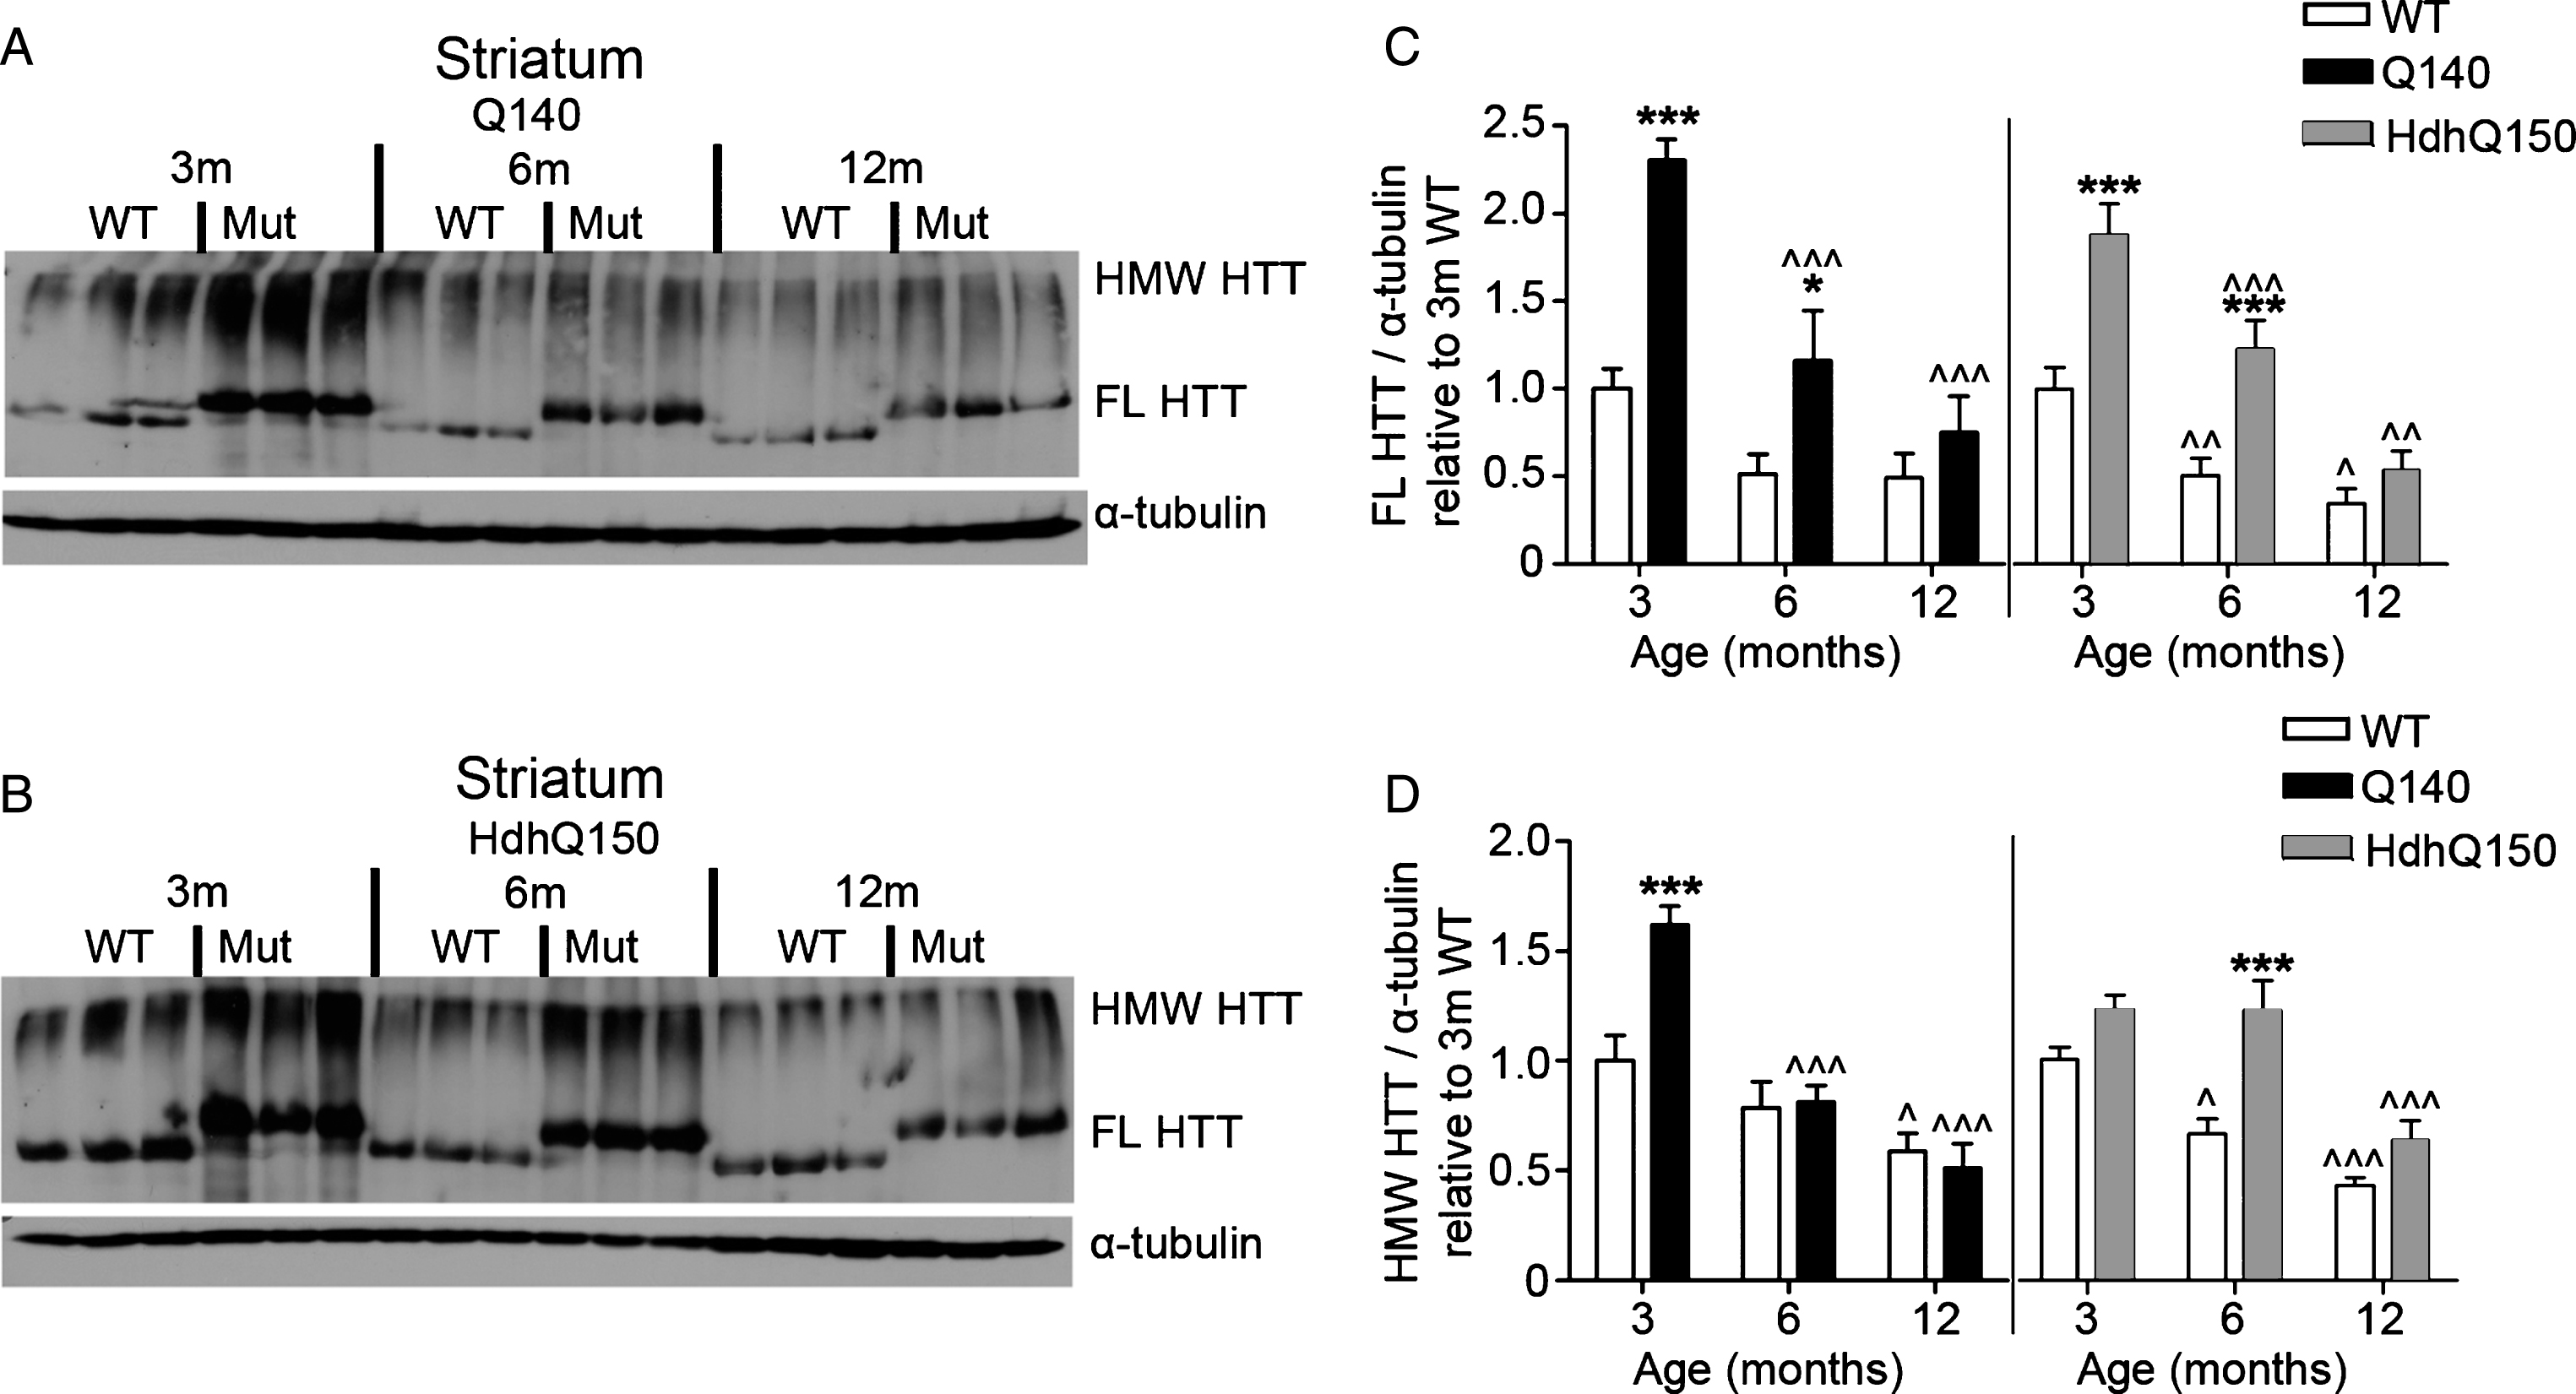
Fig.5
FL and HMW HTT protein levels detected with anti-HTT VB3130 decrease over time in cortex of homozygous Q140 and HdhQ150 mice. Western blots of full-length (FL) HTT (∼350 kDa) and high molecular weight (HMW) HTT (running at the top of the separating gel) species and α-tubulin loading control, at 3, 6 and 12 months of age in knock-in mice and their WT littermates in (A) Q140 cortex, and (B) HdhQ150 cortex. Protein lysate samples were run across two western blots for each knock-in mouse line and data were averaged, n = 3 per group per western blot for a total of n = 6 mice per group. Graphs show mean+SEM (n = 6) HTT/α-tubulin in 3, 6 and 12 months old Q140 and HdhQ150 mice and WT littermates, relative to WT levels at 3 months for (C) cortical FL HTT, and (D) cortical HMW HTT. Two-way ANOVA with Bonferroni post-hoc tests, within each knock-in mouse line: *p < 0.05, **p < 0.01, ***p < 0.001, compared to WT littermates at the same age; ∧ p < 0.05, ∧∧ p < 0.01, ∧∧∧ p < 0.001, compared to 3 month old mice of the same genotype.
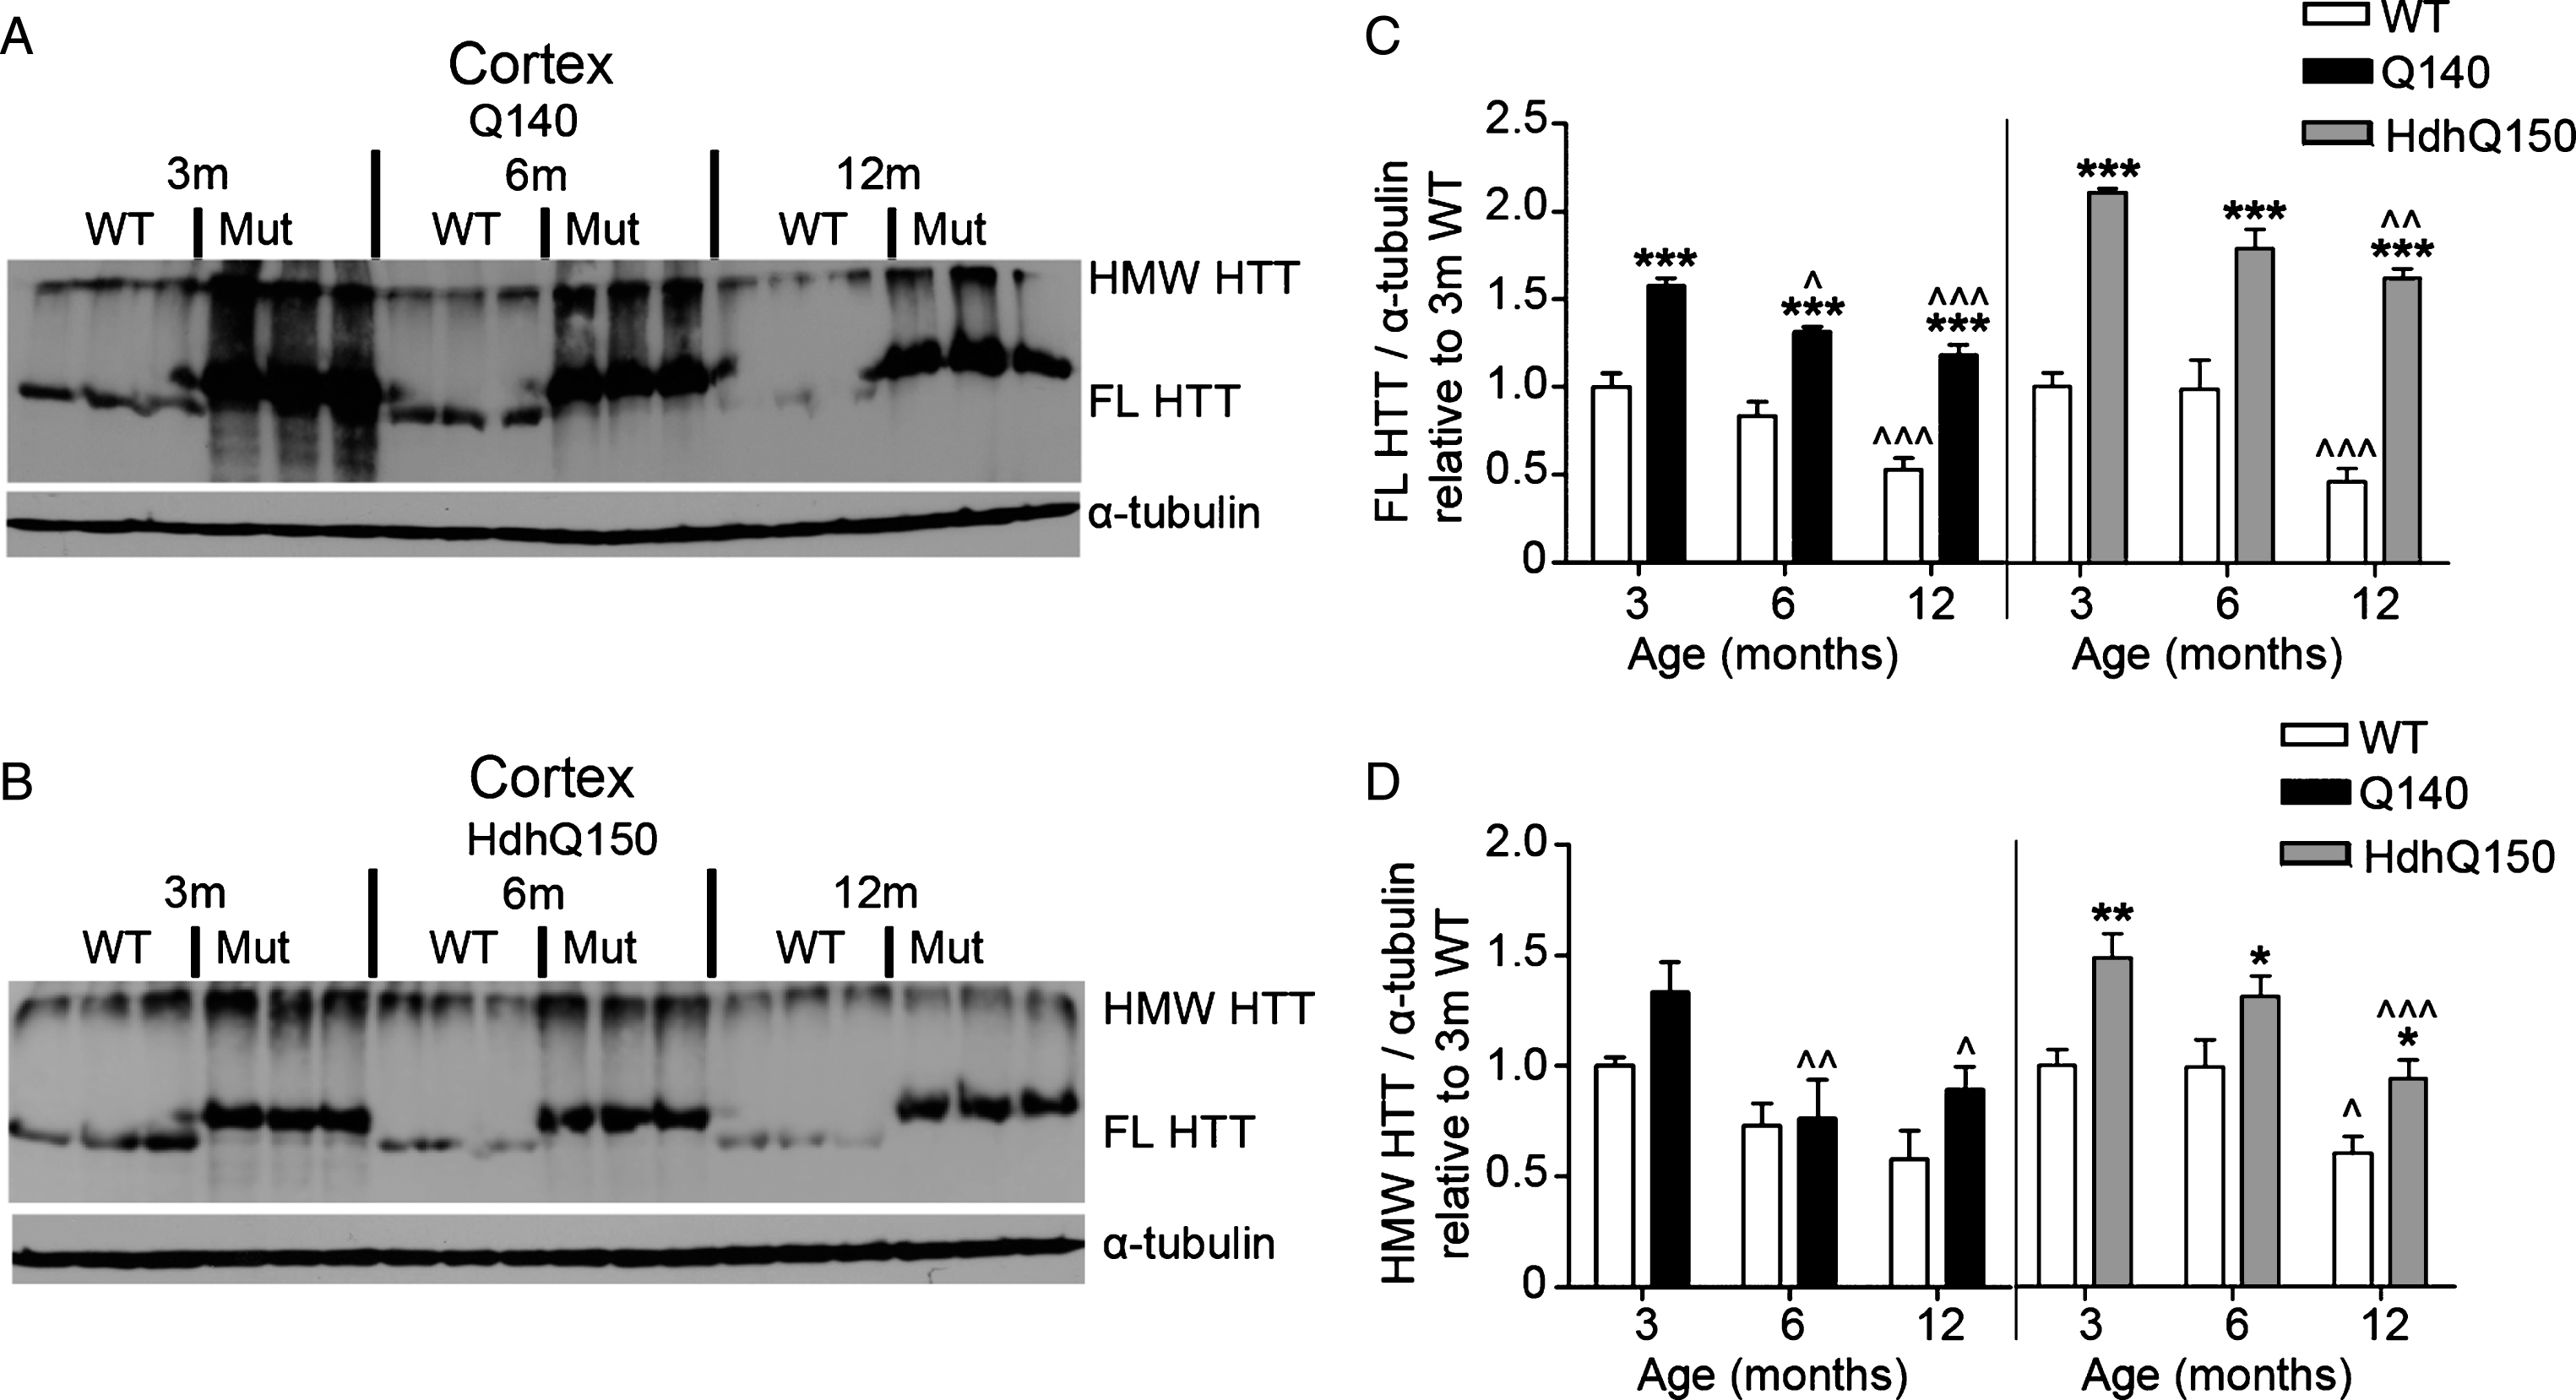
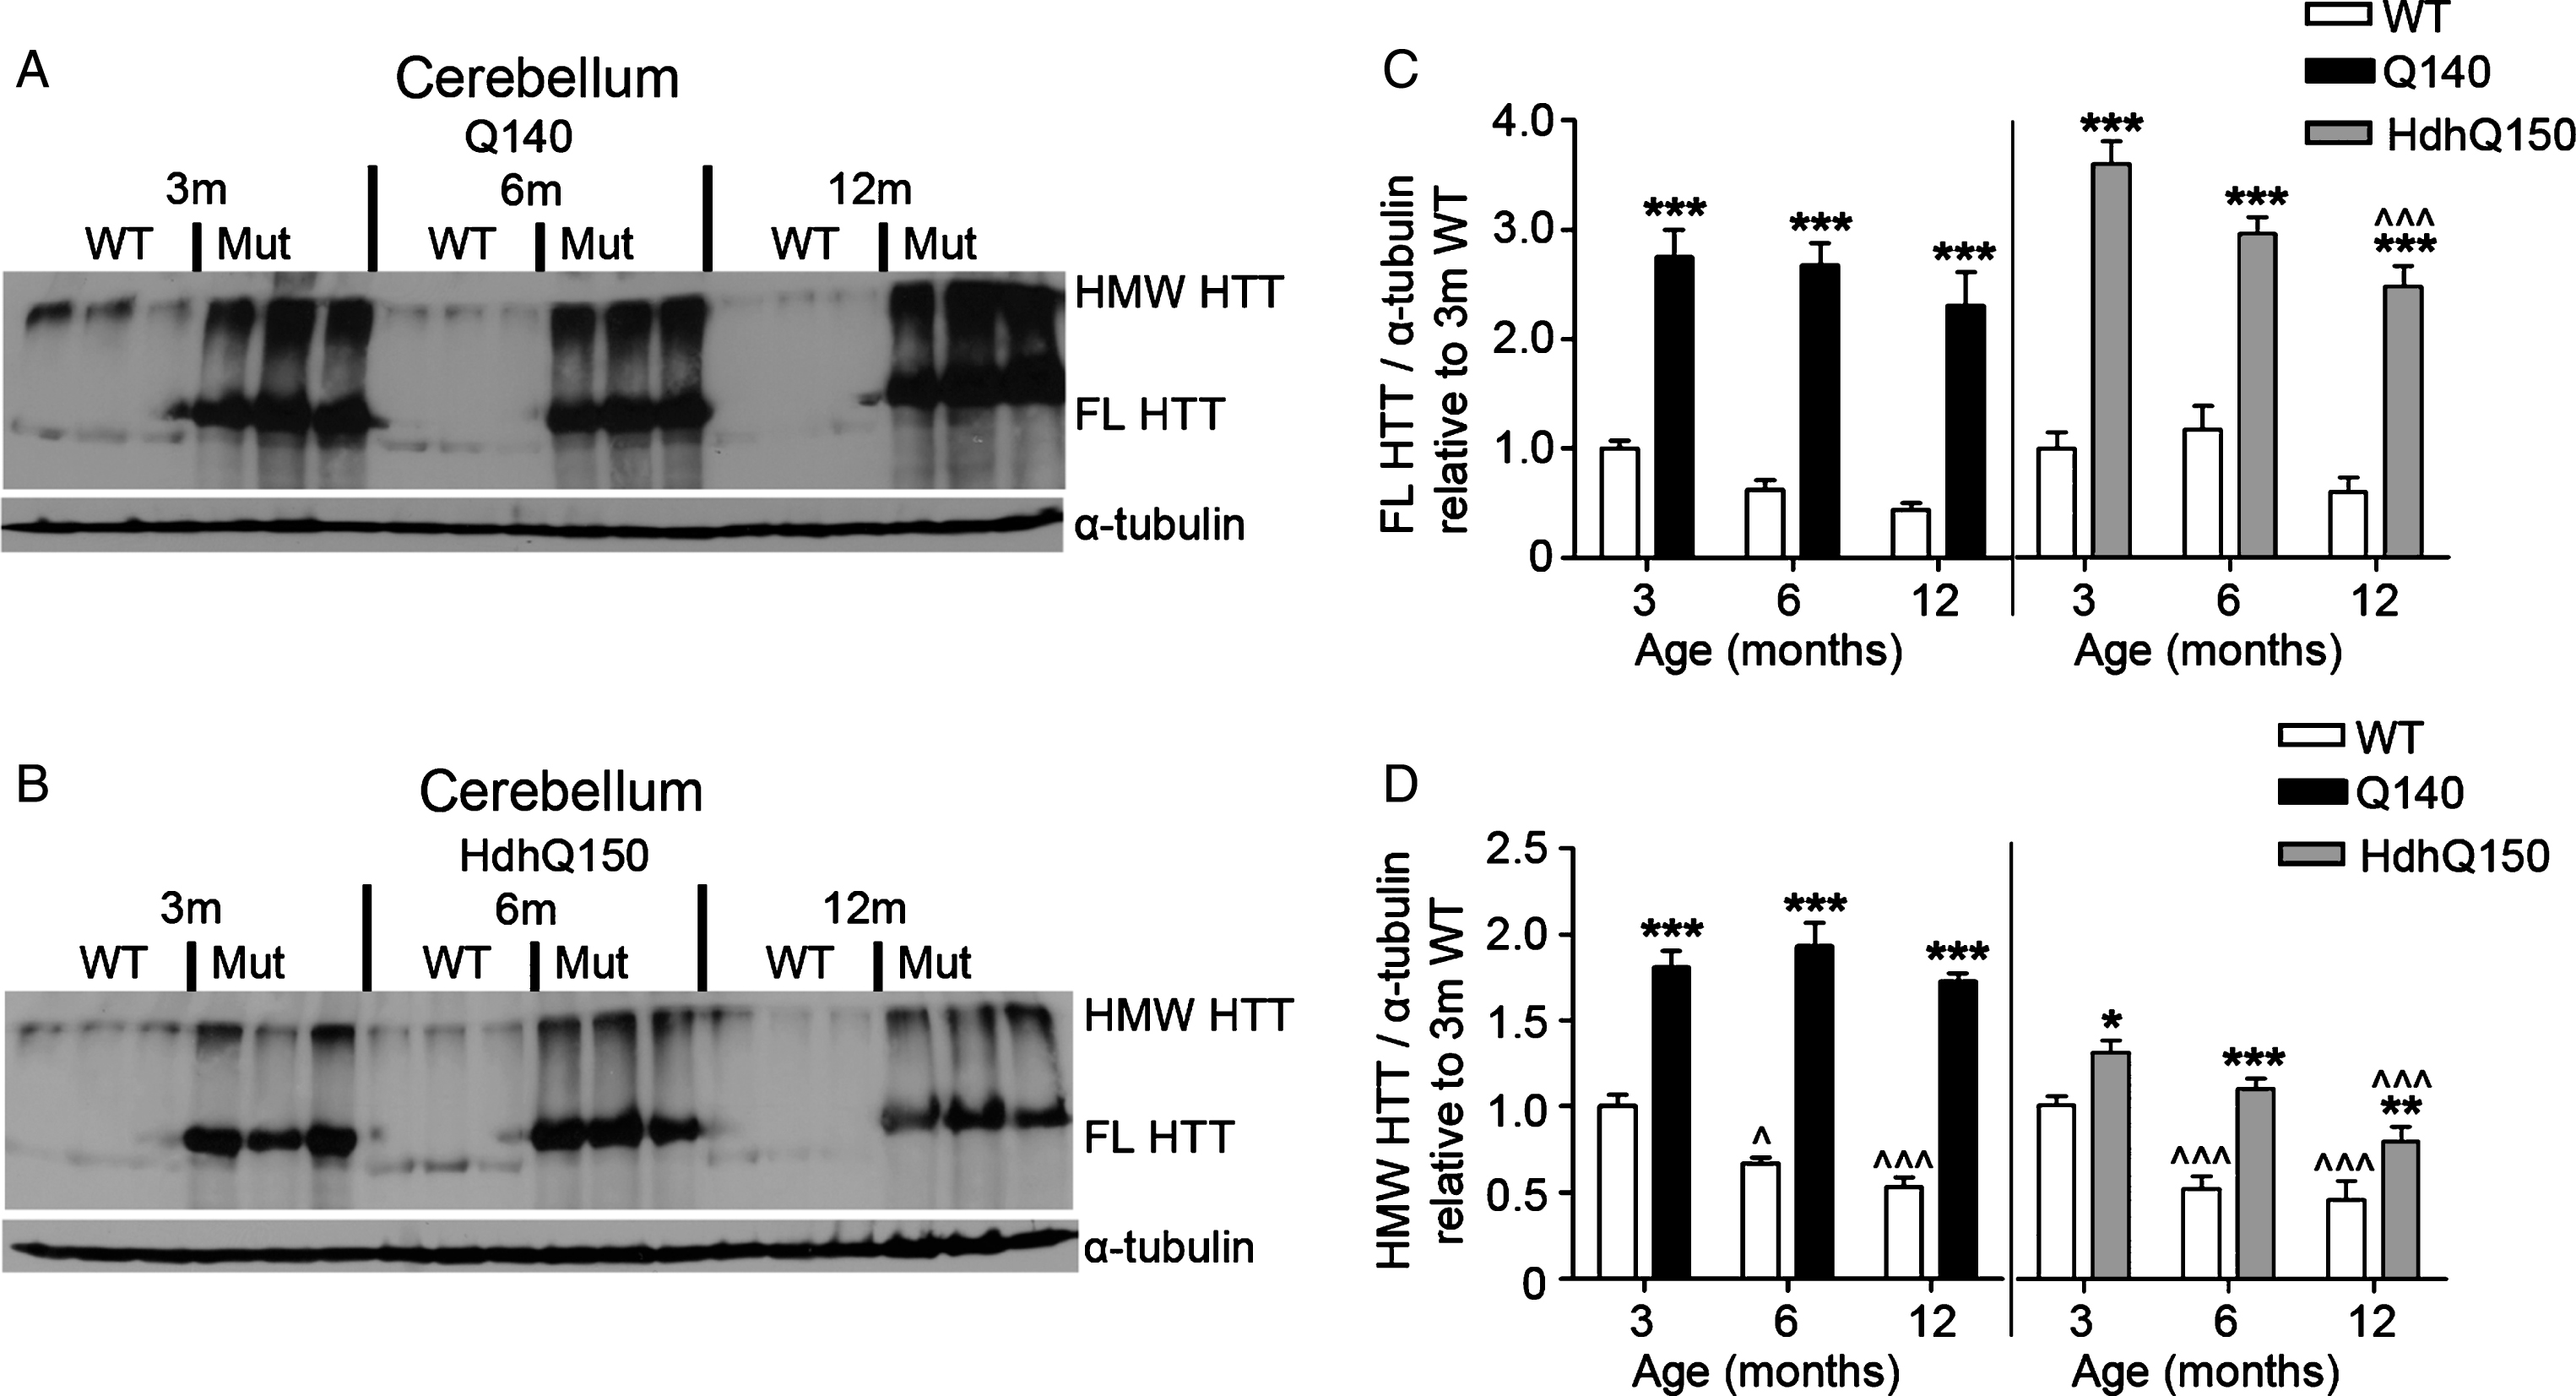
Fig.6
FL and HMW HTT protein levels detected with anti-HTT VB3130 are sustained in cerebellum of homozygous Q140 and HdhQ150 mice. Western blots of full-length (FL) HTT (∼350 kDa) and high molecular weight (HMW) HTT (running at the top of the separating gel) species and α-tubulin loading control, at 3, 6 and 12 months of age in knock-in mice and their WT littermates in (A) Q140 cerebellum, and (B) HdhQ150 cerebellum. Protein lysate samples were run across two western blots for each knock-in mouse line and data were averaged, n = 3 per group per western blot for a total of n = 6 mice per group. Graphs show mean+SEM (n = 6) HTT/α-tubulin in 3, 6 and 12 months old Q140 and HdhQ150 mice and WT littermates, relative to WT levels at 3 months for (C) cerebellar FL HTT, and (D) cerebellar HMW HTT. Two-way ANOVA with Bonferroni post-hoc tests, within each knock-in mouse line: *p < 0.05, **p < 0.01, ***p < 0.001, compared to WT littermates at the same age; ∧ p < 0.05, ∧∧ p < 0.01, ∧∧∧ p < 0.001, compared to 3 month old mice of the same genotype.
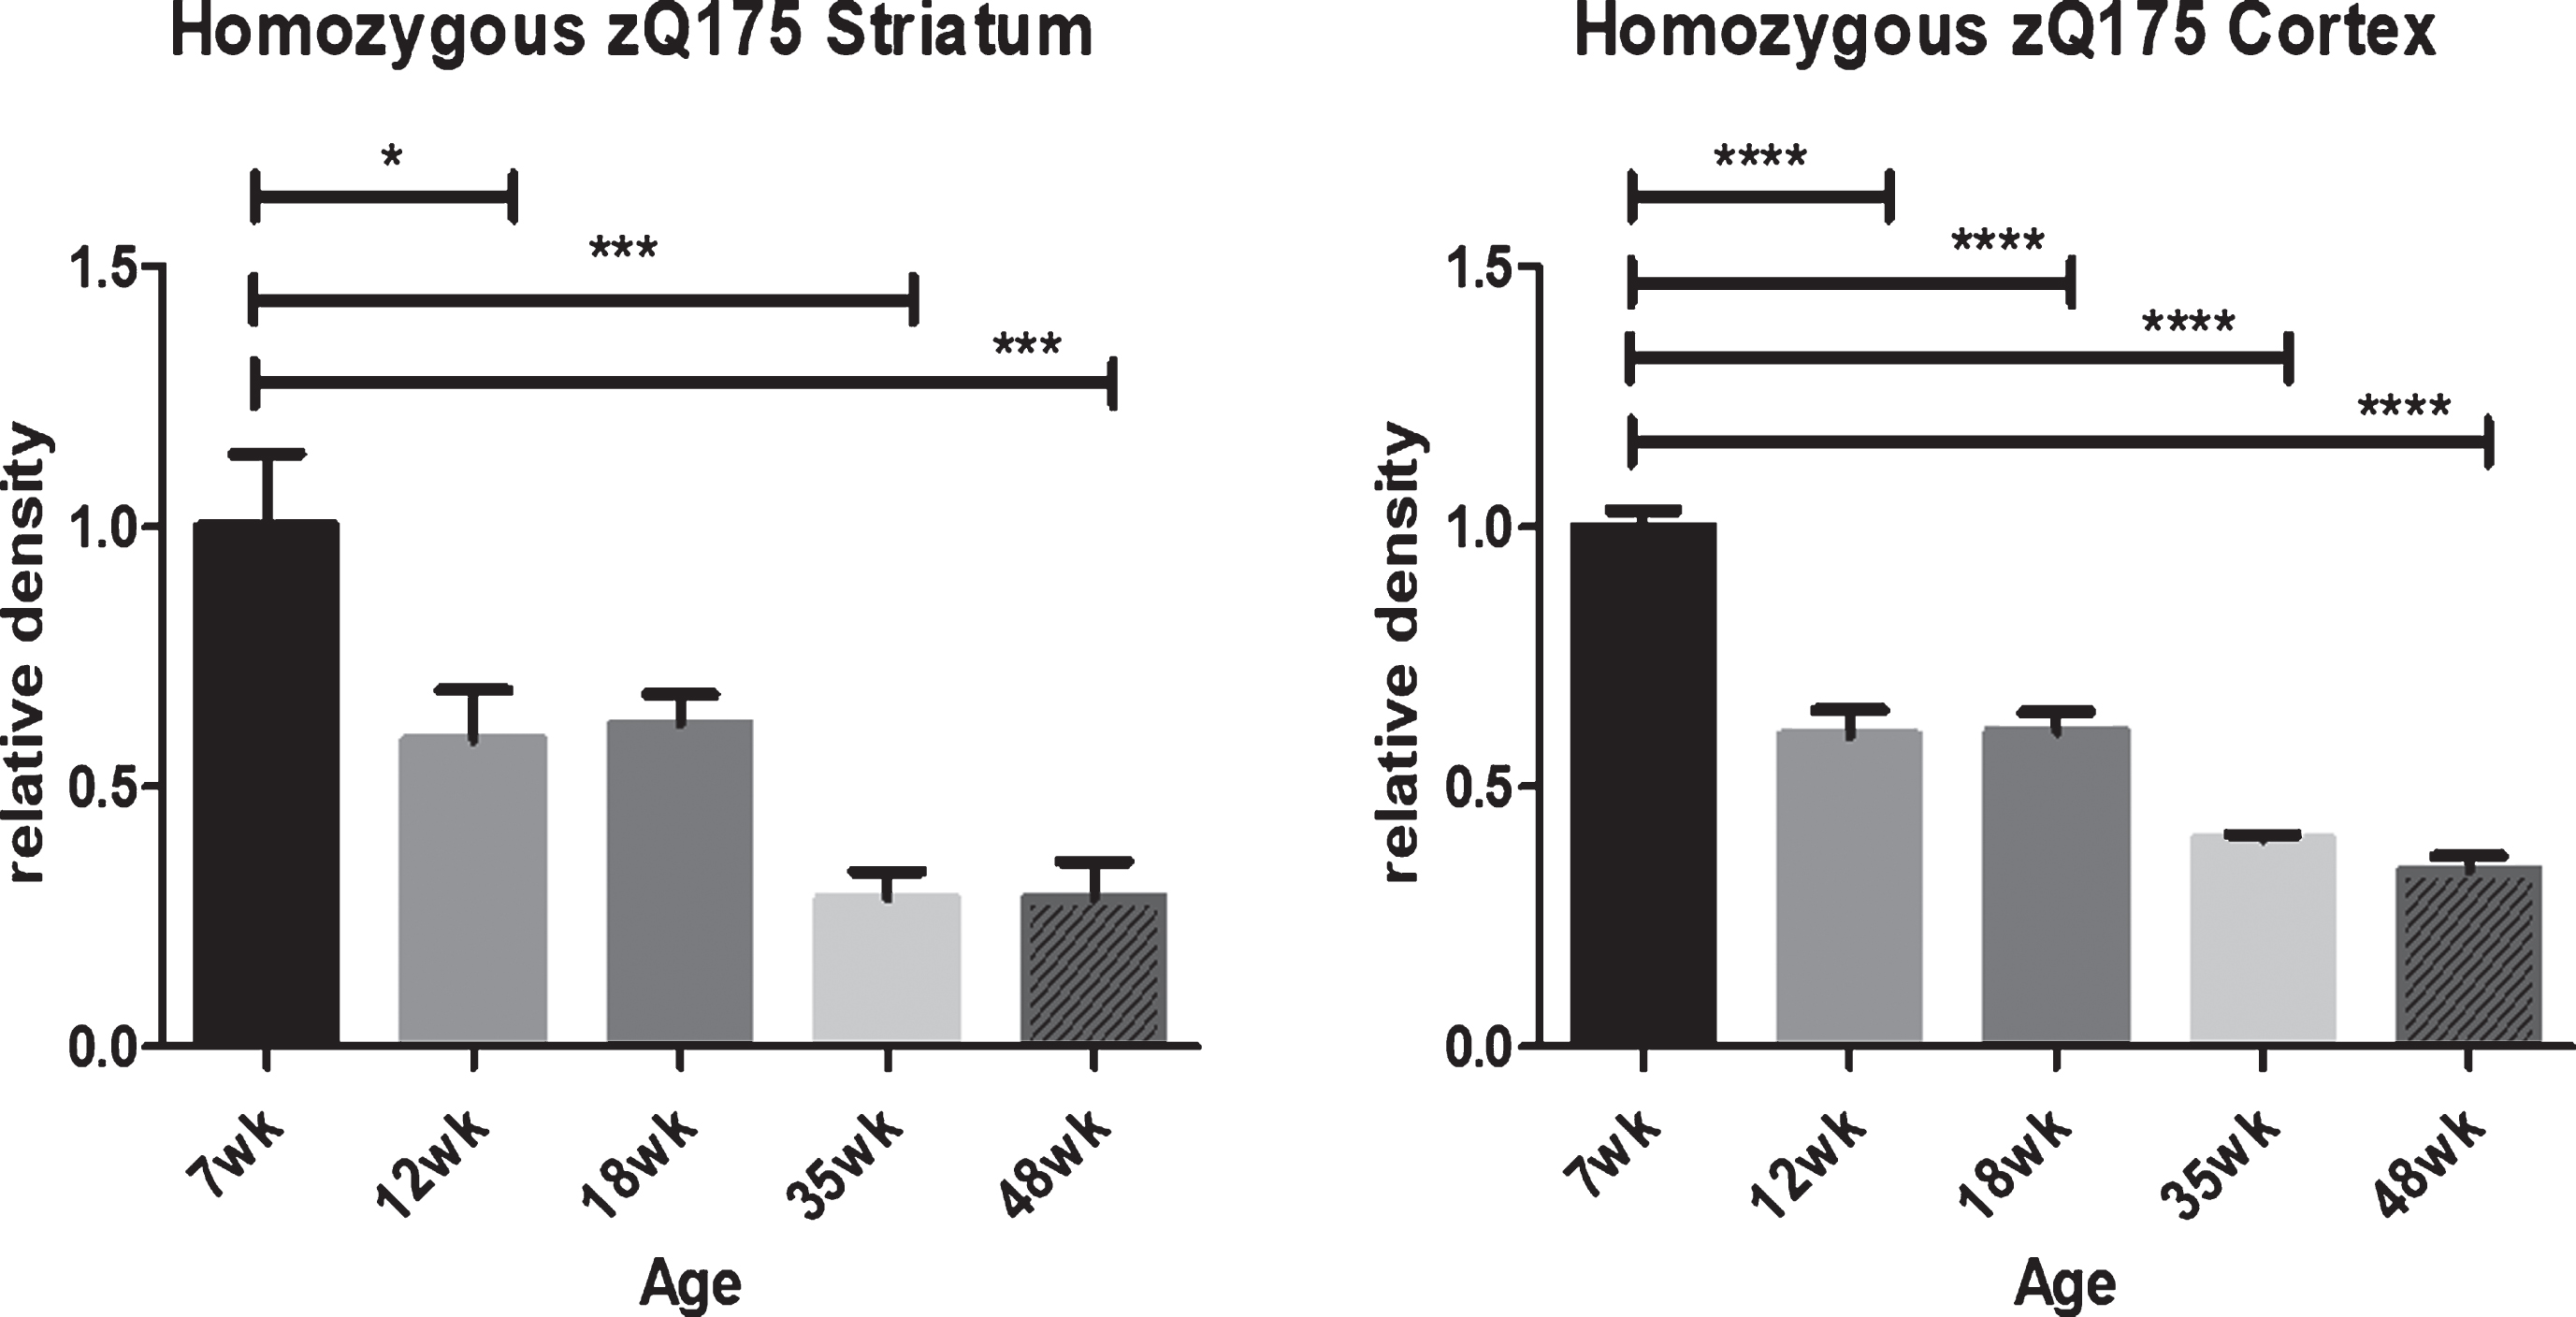
To further confirm the decline in HTT with age in mutant knock-in mouse striatum and cortex by an independent method of analysis (Fig. 7), a comprehensive immunohistochemistry (IHC) study of anti-HTT D7F7 reactivity was run in slices of striatum and cortex over time in homozygous zQ175 knock-in mice, an HD mouse line derived from a spontaneous expansion of the Q140 CAG repeat [52]. This IHC quantitative data confirms that in cortex and striatum, mutant HTT levels decline with age.
Fig.7
HTT levels decline in mutant homozygous zQ175 striatum and cortex with aging as detected by immunohistochemistry with D7F7 anti-HTT antibody. In homozygous zQ175 knock-in mutant mice there is a dramatic reduction in anti-HTT D7F7 detectable mutant HTT by immunohistochemistry analysis (IHC) in both striatum and cortex with age. Consistent regions of interest were identified and the mean density and standard deviation determined for each group of five mice. Statistical differences were determined using one-way ANOVA with Bonferroni’s Multiple Comparison Test. *p < 0.05, ***p < 0.001, ****p < 0.0001. Graphs show mean+SEM (n = 5) relative HTT density.
To determine if ratios between soluble and HMW forms of HTT were altered over time, FL HTT and HMW HTT detected with anti-HTT VB3130 were compared. It was found that this HMW/FL ratio is not significantly altered within each genotype group over the time course of this study (Supplementary Figure 2). We have determined that the HMW HTT species can be detected with phospho- and acetyl-specific anti-HTT antibodies [30, 31], and that the HMW/FL ratio may be dependent on the time of day the mice are sacrificed reflecting diurnal changes in HTT post-translational modification (unpublished results). Because of this observation, for this longitudinal study tissue was collected at the same time of day, during the light phase of the diurnal cycle.
As an independent test of the above standard western blots shown in Figs. 4–6 that used anti-HTT VB3130 normalized to α-tubulin detected by chemiluminescence, we reran striatal and cerebellar tissue lysates from the Q140 and HdhQ150 WT vs. mutant HTT mice using the DATD SDS-PAGE gel system and blotting, but used LI-COR analysis to quantitate levels of FL-HTT using both rabbit VB3130 and mouse MAB2166 anti-HTT antibodies normalized to mouse α-tubulin (Supplementary Figure 3). Due to the system limitations to re-probe and detect using LI-COR, we stripped these blots and re-probed with rabbit D7F7 anti-HTT and detected by chemiluminescence. Similar to the data above (Figs. 4 and 6), VB3130-reactive mutant FL HTT is significantly higher than WT levels at the 3 month time point in both striatum and cerebellum, and then dramatically declines with age in striatum but the high levels are sustained in cerebellum. This relative elevation of striatal mutant HTT over WT levels at this initial time point was also visualized with chemiluminescence using a C-terminal anti-HTT antibody HDB4E10 (Fig. 3), which was not sensitive enough to be used for LI-COR analysis. MAB2166 and D7F7 antibodies also confirmed the significant decline of FL mutant HTT in striatum with age and the correspondingly sustained levels of FL HTT in mutant Q140 cerebellum (Supplementary Figure 3), but do not show the elevated striatal mutant HTT-reactivity over WT levels at 3 months of age. This divergence between immunoreactivity detected by these antibodies may reflect differential post-translational modifications including phosphorylation, acetylation, SUMOylation, ubiquitination, O-GlcNAcylation and transglutamination of HTT in vivo at the 4 different epitopes of VB3130, HDB4E10, MAB2166 and D7F7. For instance, we previously found MAB2166 does not detect S13 phosphorylated HTT adequately by western analysis [31], and the group of Dimitri Krainc has determined that acetylation of HTT K444 blocks the epitope of MAB2166 (personal communication). IHC studies suggest that mice process human HTT differently from human brain, namely that D7F7 fails to react with human HTT in human tissue but reacts strongly with human HTT expressed as BAC97, YAC18 or YAC128 in Htt-/- mice (unpublished results). Whether this is a localized change in the D7F7 epitope is not clear. Paradoxically the mouse HTT sequence differs conservatively at two residues from the sequence of the human peptide immunogen used in the generation of the D7F7 monoclonal (Cell Signaling, personal communication). We conclude that mutant FL HTT levels significantly decline with age in striatum independent of the choice of anti-HTT antibody, despite challenges for the field in generating an anti-HTT antibody that detects all species of HTT.
DISCUSSION
We and others have shown that the HTT protein, mutated by polyQ expansion in HD, can normally function as a scaffold for selective autophagy [9, 18, 19]. Autophagic function declines over the mammalian lifespan, potentially contributing to pathogenesis of diseases associated with aging including neurodegeneration, cardiovascular disease, and cancer [17, 53]. This reduction in autophagic function with aging parallels a progressive reduction in levels of several autophagy proteins over time [21–24]. The goal of the current studies was to evaluate whether levels of HTT exhibit a similar decline and whether there is tissue-specificity in the predicted decline. Future studies will evaluate autophagic function to determine whether the observed decrease translates to an impairment of HTT scaffold activity.
We measured abundance of HTT protein over time in striatum, cortex and cerebellum in two fully backcrossed homozygous knock-in HD mouse models and WT littermate controls. Western analysis was used to ascertain abundance of two specific species of WT and mutant HTT: full length (FL) ∼350kD monomeric HTT and a high molecular weight (HMW) form that migrates at the top of separating SDS-PAGE gels that are specifically designed to resolve this species. Using anti-HTT VB3130, an antibody with an epitope within the first 17 amino acids of HTT, mutant HTT levels fall sharply with aging in striatum and cortex in both models, but not in cerebellum where mutant HTT levels remain high. As cerebellum is significantly less affected in HD compared to striatum and cortex [51], the sustained levels of mutant HTT may be protective to the cerebellum. Using VB3130 antibody, mutant HTT levels in striatum were also observed to be higher over that of WT HTT at the initial time point of three months in both mouse models, however this increase was specific for VB3130 and was not observed with D7F7 and MAB2166 anti-HTT antibodies. Most notably, all 3 antibodies detected the decline in striatal mutant HTT with age, as did IHC analysis of homozygous mutant zQ175 knock-in striatum with anti-HTT D7F7. Differences observed between anti-HTT antibodies, most obvious when comparing levels of WT to mutant HTT, may reflect alterations of the antibody epitopes induced by post-translational modification in vivo. We conclude that independent of the antibody chosen or the technique used for measurement of HTT levels, striatal mutant HTT in knock-in HD mice declines with age.
Autophagy, a lysosomal mechanism of protein and organelle clearance, is activated by, and acts to relieve cellular stress, and is important for organismal health and homeostasis [16]. A loss of autophagy in the CNS can cause neurodegenerative disease phenotypes associated with the accumulation of ubiquitin-containing aggregates and a progressive decline in motor function [54, 55], similar to that observed in HD. Both HTT and the RB1CC1/FIP200 protein in mammalian cells have structure/function similarities with the yeast Atg11 autophagic scaffold protein [18]. Knockout of HTT in the CNS causes a striatal neurodegeneration [56], while CNS knockout of RB1CC1/FIP200 results in degeneration of the cerebellum [57], suggesting differential expression and tissue-selective autophagic function of mammalian Atg11 s in brain, consistent with the observed differential levels of mutant HTT in striatum, cortex and cerebellum.
We also found that the formation of WT HMW HTT levels are at least partially dependent on the presence of TG2, a protein previously described to covalently modify HTT, and to play a role in selective autophagic clearance of ubiquitinated cargos [34, 39–41]. TG2 itself migrates as a monomer and as a HMW species, therefore it is possible that HMW HTT is created through covalent modification by transglutaminases, and that TG2 and HTT may work together in the same crosslinked complex to scaffold ubiquitinated autophagic cargos for degradation by the lysosome, a hypothesis that remains to be tested. It should be noted that transglutaminases may confound quantitation of total HTT using standard SDS-PAGE gels, as a significant amount of HTT in brain tissue may be covalently crosslinked into a HMW species which is not resolved without the use of a DATD stacking gel and unique sample denaturing loading buffer, and not transferred adequately without the use of PVDF membrane with extra methanol and SDS in the western transfer buffer.
In mouse and Drosophila models of HD, transgenic mutant HTT exon 1 protein aggregates in neurons and is sufficient to cause neurodegeneration [58, 59], while in turn can also induce a compensatory activation of autophagy [60–63]. In full-length HD knock-in mouse models and in HD patients, incomplete splicing of mutant exon 1 HTT results in a short polyadenylated mRNA that is translated into mutant exon 1 HTT protein [64, 65]. As expression of autophagy proteins is increased by cellular stress [16], the high levels of mutant HTT we observe using anti-HTT VB3130 in brain at 3 months in homozygous HD knock-in models compared to WT HTT in controls could reflect an early, potentially compensatory, upregulation of autophagy caused by mutant HTT exon 1 protein-induced stress due to incomplete HTT RNA splicing. Therefore, this higher level of VB3130-reactive full-length mutant HTT protein either reflecting increased HTT mutant protein levels and/or alterations in HTT N17 post-translational modification that affect the VB3130 epitope, may in fact be protective, given that mutant HTT is adequate to provide genetic rescue in a null background [11] and can supply cellular functions that promote survival [66, 67]. Higher mutant HTT levels could also combat impaired function of the HTT protein caused by expansion of the polyQ repeat, previously demonstrated to reduce protective phosphorylation events within HTT that may activate its autophagic function and clearance [18, 31, 68–70]. In parallel, lowered HTT levels with aging, even in the context of mutant HTT, could contribute to HD onset due to a reduction in HTT function. It remains to be determined the level of HTT that is sufficient to maintain adequate HTT functions in humans.
Based on the data here and in published literature, we propose that HD may be modulated by a delicate balance between the deleterious effects of the chronic expression of mutant exon 1 HTT protein on one hand [64, 65], and HTT’s normal function on the other [9, 19], that alone is ultimately not sufficient to prevent onset of HD but may serve as a modifier of disease onset and progression. To delay HD onset or slow its progression, we suggest that therapies based on blocking the production of incompletely spliced mutant HTT, thereby reducing mutant exon 1 protein production, or inducing pathways that activate HTT’s autophagic scaffold function and autophagy in general to increase clearance of toxic mutant exon 1 protein fragment are likely to be effective. Moreover, these interventions will be optimal early in disease progression before lysosomal function becomes impaired with aging, which could then render this pathway induction toxic [71–73].
CONFLICT OF INTEREST
The authors have no conflict of interest to report.
ACKNOWLEDGMENTS
We are grateful to Marie-Francoise Chesselet (UCLA) for generously providing mutant homozygous Q140, HdhQ150, and WT littermate control mouse brain tissue for this study. We also thank Marie-Francoise Chesselet, Gillian Bates (University College London), David Housman (MIT), and Simonetta Sipione (University of Alberta) for helpful discussions. Support from HDF John J. Wasmuth fellowship to NRF, HDF to JSS, CHDI Foundation Inc.to JSS, SOZ and AO, the Dr. Miriam and Sheldon G. Adelson Medical Research Foundation to RRR and HD CARE to JSS and LMT. Funds from CHDI Foundation Inc., the Charles H. Markham endowment and other gifts to UCLA Dept. of Neurology to Marie-Francoise Chesselet, UCLA, supported the colonies of Q140 and Hdh150 mice used in this study. NIH funding: NS072453 (JSS), T32 AG000096 (GF), NS052789 (LMT), NS090390 (LMT), NS077926 (SOZ) and NIA AG014930 (RRR). This work is dedicated to the memory of William W. Steffan, whose analytical mind always searched for the truth.
SUPPLEMENTARY MATERIAL
[1] The supplementary material is available in the electronic version of this article: http://dx.doi.org/10.3233/JHD-170274.
REFERENCES
[1] | Saudou F , Humbert S . The Biology of Huntingtin, Neuron (2016) ;89: (5):910–26. |
[2] | Ross CA , Tabrizi SJ . Huntington’s disease: From molecular pathogenesis to clinical treatment, Lancet Neurol (2011) ;10: (1):83–98. |
[3] | Bates GP , Dorsey R , Gusella JF , Hayden MR , Kay C , Leavitt BR , et al. Huntington disease, Nat Rev Dis Primers (2015) ;1: , 15005. |
[4] | Orr HT , Zoghbi HY . Trinucleotide repeat disorders, Annu Rev Neurosci (2007) ;30: , 575–621. |
[5] | Kampinga HH , Bergink S . Heat shock proteins as potential targets for protective strategies in neurodegeneration, Lancet Neurol (2016) ;15: (7):748–59. |
[6] | Zhao T , Hong Y , Li XJ , Li SH Front Mol Neurosci (2016) ;9: , 27–Subcellular clearance and accumulation of Huntington disease proteA mini-review. |
[7] | Margulis J , Finkbeiner S . Proteostasis in striatal cells and selective neurodegeneration in Huntington’s disease, Front Cell Neurosci (2014) ;8: , 218. |
[8] | Labbadia J , Morimoto RI . Huntington’s disease: Underlying molecular mechanisms and emerging concepts, Trends Biochem Sci (2013) ;38: (8):378–85. |
[9] | Ochaba J , Lukacsovich T , Csikos G , Zheng S , Margulis J , Salazar L , et al. Potential function for the Huntingtin protein as a scaffold for selective autophagy, Proc Natl Acad Sci U S A (2014) ;111: (47):16889–94. |
[10] | Maiuri T , Mocle AJ , Hung CL , Xia J , van Roon-Mom WM , Truant R . Huntingtin is a scaffolding protein in the ATM oxidative DNA damage response complex, Hum Mol Genet (2017) ;26: (2):395–406. |
[11] | Gray M , Shirasaki DI , Cepeda C , Andre VM , Wilburn B , Lu XH , et al. Full-length human mutant Huntingtin with a stable polyglutamine repeat can elicit progressive and selective neuropathogenesis in BACHD mice, J Neurosci (2008) ;28: (24):6182–95. |
[12] | Carroll B , Hewitt G , Korolchuk VI . Autophagy and ageing: Implications for age-related neurodegenerative diseases, Essays Biochem (2013) ;55: , 119–31. |
[13] | Tsvetkov AS , Miller J , Arrasate M , Wong JS , Pleiss MA , Finkbeiner S . A small-molecule scaffold induces autophagy in primary neurons and protects against toxicity in a Huntington disease model, Proc Natl Acad Sci U S A (2010) ;107: (39):16982–7. |
[14] | Kaur J , Debnath J . Autophagy at the crossroads of catabolism and anabolism, Nat Rev Mol Cell Biol (2015) ;16: (8):461–72. |
[15] | Farre JC , Subramani S . Mechanistic insights into selective autophagy pathways: Lessons from yeast, Nat Rev Mol Cell Biol (2016) ;17: (9):537–52. |
[16] | He C , Klionsky DJ . Regulation mechanisms and signaling pathways of autophagy, Annu Rev Genet (2009) ;43: , 67–93. |
[17] | Rubinsztein DC , Marino G , Kroemer G . Autophagy and aging, Cell (2011) ;146: (5):682–95. |
[18] | Steffan JS . Does Huntingtin play a role in selective macroautophagy? Cell Cycle (2010) ;9: (17):3401–13. |
[19] | Rui YN , Xu Z , Patel B , Chen Z , Chen D , Tito A , et al. Huntingtin functions as a scaffold for selective macroautophagy, Nat Cell Biol (2015) ;17: (3):262–75. |
[20] | Martinez-Vicente M , Talloczy Z , Wong E , Tang G , Koga H , Kaushik S , et al. Cargo recognition failure is responsible for inefficient autophagy in Huntington’s disease, Nat Neurosci (2010) ;13: (5):567–76. |
[21] | Lipinski MM , Zheng B , Lu T , Yan Z , Py BF , Ng A , et al. Genome-wide analysis reveals mechanisms modulating autophagy in normal brain aging and in Alzheimer’s disease, Proc Natl Acad Sci U S A (2010) ;107: (32):14164–9. |
[22] | Shibata M , Lu T , Furuya T , Degterev A , Mizushima N , Yoshimori T , et al. Regulation of intracellular accumulation of mutant Huntingtin by Beclin 1, J Biol Chem (2006) ;281: (20):14474–85. |
[23] | Cuervo AM , Dice JF . Age-related decline in chaperone-mediated autophagy, J Biol Chem (2000) ;275: (40):31505–13. |
[24] | Simonsen A , Cumming RC , Brech A , Isakson P , Schubert DR , Finley KD . Promoting basal levels of autophagy in the nervous system enhances longevity and oxidant resistance in adult Drosophila, Autophagy (2008) ;4: (2):176–84. |
[25] | Johnson CD , Davidson BL . Huntington’s disease: Progress toward effective disease-modifying treatments and a cure, Hum Mol Genet. (2010) ;19: (R1):R98–R102. |
[26] | Aronin N , DiFiglia M . Huntingtin-lowering strategies in Huntington’s disease: Antisense oligonucleotides, small RNAs, and gene editing, Mov Disord (2014) ;29: (11):1455–61. |
[27] | Wild EJ . Huntington’s disease: The most curable incurable brain disorder? EBioMedicine (2016) ;8: , 3–4. |
[28] | Basso M , Berlin J , Xia L , Sleiman SF , Ko B , Haskew-Layton R , et al. Transglutaminase inhibition protects against oxidative stress-induced neuronal death downstream of pathological ERK activation, J Neurosci (2012) ;32: (19):6561–9. |
[29] | Andre EA , Braatz EM , Liu JP , Zeitlin SO . Generation and characterization of knock-in mouse models expressing versions of Huntingtin with either an N17 or a combined PolyQ and proline-rich region deletion, J Huntingtons Dis (2017) ;6: (1):47–62. |
[30] | Jia H , Kast RJ , Steffan JS , Thomas EA . Selective histone deacetylase (HDAC) inhibition imparts beneficial effects in Huntington’s disease mice: Implications for the ubiquitin-proteasomal and autophagy systems, Hum Mol Genet (2012) ;21: (24):5280–93. |
[31] | Thompson LM , Aiken CT , Kaltenbach LS , Agrawal N , Illes K , Khoshnan A , et al. IKK phosphorylates Huntingtin and targets it for degradation by the proteasome and lysosome, J Cell Biol (2009) ;187: (7):1083–99. |
[32] | O’Rourke JG , Gareau JR , Ochaba J , Song W , Rasko T , Reverter D , et al. SUMO-2 and PIAS1 modulate insoluble mutant Huntingtin protein accumulation, Cell Re (2013) ;4: (2):362–75. |
[33] | Schulze-Krebs A , Canneva F , Schnepf R , Dobner J , Dieterich W , von Horsten S . In situ enzymatic activity of transglutaminase isoforms on brain tissue sections of rodents: A new approach to monitor differences in post-translational protein modifications during neurodegeneration, Brain Res (1631) ;22–33. |
[34] | D’Eletto M , Farrace MG , Rossin F , Strappazzon F , Giacomo GD , Cecconi F , et al. Type 2 transglutaminase is involved in the autophagy-dependent clearance of ubiquitinated proteins, Cell Death Differ (2012) ;19: (7):1228–38. |
[35] | Diaz-Hidalgo L , Altuntas S , Rossin F , D’Eletto M , Marsella C , Farrace MG , et al. Transglutaminase type 2-dependent selective recruitment of proteins into exosomes under stressful cellular conditions, Biochim Biophys Acta (1863) ;8, 2084–92. |
[36] | Basso M , Ratan RR . Transglutaminase is a therapeutic target for oxidative stress, excitotoxicity and stroke: A new epigenetic kid on the CNS block, J Cereb Blood Flow Metab (2013) ;33: (6):809–18. |
[37] | Mastroberardino PG , Iannicola C , Nardacci R , Bernassola F , De Laurenzi V , Melino G , et al. ‘Tissue’ transglutaminase ablation reduces neuronal death and prolongs survival in a mouse model of Huntington’s disease, Cell Death Differ (2002) ;9: (9):873–80. |
[38] | McConoughey SJ , Basso M , Niatsetskaya ZV , Sleiman SF , Smirnova NA , Langley BC , et al. Inhibition of transglutaminase 2 mitigates transcriptional dysregulation in models of Huntington disease, EMBO Mol Med (2010) ;2: (9):349–70. |
[39] | Karpuj MV , Garren H , Slunt H , Price DL , Gusella J , Becher MW , et al. Transglutaminase aggregates huntingtin into nonamyloidogenic polymers, and its enzymatic activity increases in Huntington’s disease brain nuclei, Proc Natl Acad Sci U S A (1999) ;96: (13):7388–93. |
[40] | Jeitner TM , Fuchsbauer HL , Blass JP , Cooper AJ . A sensitive fluorometric assay for tissue transglutaminase, Anal Biochem (2001) ;292: (2):198–206. |
[41] | Jeitner TM , Matson WR , Folk JE , Blass JP , Cooper AJ . Increased levels of gamma-glutamylamines in Huntington disease CSF, J Neurochem (2008) ;106: (1):37–44. |
[42] | Luciani A , Villella VR , Esposito S , Brunetti-Pierri N , Medina D , Settembre C , et al. Defective CFTR induces aggresome formation and lung inflammation in cystic fibrosis through ROS-mediated autophagy inhibition, Nat Cell Biol (2010) ;12: (9):863–75. |
[43] | Iismaa SE , Mearns BM , Lorand L , Graham RM . Transglutaminases and disease: Lessons from genetically engineered mouse models and inherited disorders, Physiol Rev (2009) ;89: (3):991–1023. |
[44] | Reyna-Beltran E , Iranzo M , Calderon-Gonzalez KG , Mondragon-Flores R , Labra-Barrios ML , Mormeneo S , et al. The Candida albicans ENO1 gene encodes a transglutaminase involved in growth, cell division, morphogenesis, and osmotic protection, J Biol Chem (2018) ;293: (12):4304–23. |
[45] | Aeschlimann D , Kaupp O , Paulsson M . Transglutaminase-catalyzed matrix cross-linking in differentiating cartilage: Identification of osteonectin as a major glutaminyl substrate, J Cell Biol (1995) ;129: (3):881–92. |
[46] | Menalled LB , Sison JD , Dragatsis I , Zeitlin S , Chesselet MF . Time course of early motor and neuropathological anomalies in a knock-in mouse model of Huntington’s disease with 140 CAG repeats, J Comp Neurol (2003) ;465: (1):11–26. |
[47] | Hickey MA , Kosmalska A , Enayati J , Cohen R , Zeitlin S , Levine MS , et al. Extensive early motor and non-motor behavioral deficits are followed by striatal neuronal loss in knock-in Huntington’s disease mice, Neuroscience (2008) ;157: (1):280–95. |
[48] | Lin CH , Tallaksen-Greene S , Chien WM , Cearley JA , Jackson WS , Crouse AB , et al. Neurological abnormalities in a knock-in mouse model of Huntington’s disease, Hum Mol Genet (2001) ;10: (2):137–44. |
[49] | Heng MY , Tallaksen-Greene SJ , Detloff PJ , Albin RL . Longitudinal evaluation of the Hdh(CAG)150 knock-in murine model of Huntington’s disease, J Neurosci (2007) ;27: (34):8989–98. |
[50] | Woodman B , Butler R , Landles C , Lupton MK , Tse J , Hockly E , et al. The Hdh(Q150/Q150) knock-in mouse model of HD and the R6/2 exon 1 model develop comparable and widespread molecular phenotypes, Brain Res Bull (2007) ;72: (2-3):83–97. |
[51] | Reiner A , Dragatsis I , Dietrich P . Genetics and neuropathology of Huntington’s disease, Int Rev Neurobiol (2011) ;98: , 325–72. |
[52] | Menalled LB , Kudwa AE , Miller S , Fitzpatrick J , Watson-Johnson J , Keating N , et al. Comprehensive behavioral and molecular characterization of a new knock-in mouse model of Huntington’s disease: zQ175, PLoS One (2012) ;7: (12):e49838. |
[53] | Choi AM , Ryter SW , Levine B . Autophagy in human health and disease, N Engl J Med (2013) ;368: (7):651–62. |
[54] | Hara T , Nakamura K , Matsui M , Yamamoto A , Nakahara Y , Suzuki-Migishima R , et al. Suppression of basal autophagy in neural cells causes neurodegenerative disease in mice, Nature. (2006) ; 441 (7095) 885–9. |
[55] | Komatsu M , Waguri S , Chiba T , Murata S , Iwata J , Tanida I , et al. Loss of autophagy in the central nervous system causes neurodegeneration in mice, Nature. (2006) ; 441 (7095) 880–4. |
[56] | Dragatsis I , Levine MS , Zeitlin S . Inactivation of Hdh in the brain and testis results in progressive neurodegeneration and sterility in mice, Nat Genet (2000) ;26: (3):300–6. |
[57] | Liang CC , Wang C , Peng X , Gan B , Guan JL . Neural-specific deletion of FIP200 leads to cerebellar degeneration caused by increased neuronal death and axon degeneration, J Biol Chem (2010) ;285: (5):3499–509. |
[58] | Mangiarini L , Sathasivam K , Seller M , Cozens B , Harper A , Hetherington C , et al. Exon 1 of the HD gene with an expanded CAG repeat is sufficient to cause a progressive neurological phenotype in transgenic mice, Cell (1996) ;87: (3):493–506. |
[59] | Steffan JS , Bodai L , Pallos J , Poelman M , McCampbell A , Apostol BL , et al. Histone deacetylase inhibitors arrest polyglutamine-dependent neurodegeneration in Drosophila, Nature. (2001) ;413: , 6857; 739–43. |
[60] | Sarkar S , Rubinsztein DC . Huntington’s disease: Degradation of mutant Huntingtin by autophagy, FEBS J (2008) ;275: (17):4263–70. |
[61] | Ravikumar B , Vacher C , Berger Z , Davies JE , Luo S , Oroz LG , et al. Inhibition of mTOR induces autophagy and reduces toxicity of polyglutamine expansions in fly and mouse models of Huntington disease, Nat Genet (2004) ;36: (6):585–95. |
[62] | Iwata A , Riley BE , Johnston JA , Kopito RR . HDAC6 and microtubules are required for autophagic degradation of aggregated huntingtin, J Biol Chem (2005) ;280: (48):40282–92. |
[63] | Yamamoto A , Cremona ML , Rothman JE . Autophagy-mediated clearance of huntingtin aggregates triggered by the insulin-signaling pathway, J Cell Biol (2006) ;172: (5):719–31. |
[64] | Sathasivam K , Neueder A , Gipson TA , Landles C , Benjamin AC , Bondulich MK , et al. Aberrant splicing of HTT generates the pathogenic exon 1 protein in Huntington disease, Proc Natl Acad Sci U S A (2013) ;110: (6):2366–70. |
[65] | Neueder A , Landles C , Ghosh R , Howland D , Myers RH , Faull RLM , et al. The pathogenic exon 1 HTT protein is produced by incomplete splicing in Huntington’s disease patients, Sci Re (2017) ;7: (1):1307. |
[66] | Ruzo A , Croft GF , Metzger JJ , Galgoczi S , Gerber LJ , Pellegrini C , et al. Chromosomal instability during neurogenesis in Huntington’s disease, Development. (2018) ;145: , (2). |
[67] | Dietrich P , Johnson IM , Alli S , Dragatsis I . Elimination of Huntingtin in the adult mouse leads to progressive behavioral deficits, bilateral thalamic calcification, and altered brain iron homeostasis, PLoS Genet (2017) ;13: (7):e1006846. |
[68] | Kratter IH , Zahed H , Lau A , Tsvetkov AS , Daub AC , Weiberth KF , et al. Serine 421 regulates mutant Huntingtin toxicity and clearance in mice, J Clin Invest (2016) ;126: (9):3585–97. |
[69] | Gu X , Greiner ER , Mishra R , Kodali R , Osmand A , Finkbeiner S , et al. Serines 13 and 16 are critical determinants of full-length human mutant Huntingtin induced disease pathogenesis in HD mice, Neuron (2009) ;64: (6):828–40. |
[70] | Aiken CT , Steffan JS , Guerrero CM , Khashwji H , Lukacsovich T , Simmons D , et al. Phosphorylation of threonine Implications for Huntingtin aggregation and neurotoxicity, J Biol Chem (2009) ;284: (43):29427–36. |
[71] | Button RW , Roberts SL , Willis TL , Hanemann CO , Luo S . Accumulation of autophagosomes confers cytotoxicity, J Biol Chem (2017) ;292: (33):13599–614. |
[72] | Wilhelm T , Byrne J , Medina R , Kolundzic E , Geisinger J , Hajduskova M , et al. Neuronal inhibition of the autophagy nucleation complex extends life span in post-reproductive C. elegans, Genes Dev (2017) ;31: (15):1561–72. |
[73] | Rudnick ND , Griffey CJ , Guarnieri P , Gerbino V , Wang X , Piersaint JA , et al. Distinct roles for motor neuron autophagy early and late in the SOD1(G93A) mouse model of ALS. Proc Natl Acad Sci U S A. (2017) ;114: (39):E8294–303. |


