
Potential bioactive ingredient from elderberry fruit: Process optimization for a maximum phenolic recovery, physicochemical characterization, and bioaccesibility
Abstract
BACKGROUND:
Dark-skin berries constitute a polyphenol-rich source of interest for the development of functional ingredients.
OBJECTIVE:
To develop an elderberry powder, addressing technological aspects for maximum bioactive recovery, including physical quality and bioaccesibility of the antioxidant compounds.
METHODS:
An optimization of the combined process of enzyme-assisted extraction and freeze-drying was undertaken. Polyphenols and anthocyanins were quantified by spectrophotometric and HPLC-DAD analysis along processing stages and an in vitro digestion model was used to study the antioxidant compound activity through gastrointestinal tract and after transepithelial transport across a Caco-2 cell monolayer. Powder physical properties were also evaluated.
RESULTS:
The best extraction conditions were 45°C and 160 ppm enzyme. 10% maltodextrin was the minimum carrier concentration needed to get a freeze-dried powder with good physical properties and maximum bioactive content. The phenolic compounds identified in fruits (mainly cyanidin-based anthocyanins, quercetin-3-rutinoside, catechin and, in smaller amounts, gallic and chlorogenic acids) were also present in the optimum extract and the powder. High bioaccesibility of bioactive compounds and antioxidant activity were obtained after in vitro digestion and transepithelial transport.
CONCLUSION:
The designed elderberry powder showed great potential as functional ingredient to be used in berry juice-based beverages or other products formulated with fruit powders.
1Introduction
Nowadays, food industries are constantly seeking new materials and techniques for the development of functional products, aimed at increasingly demanding consumers interested in natural or healthy products. Berries are well known for being a rich source of bioactive compounds, which are responsible for their health benefits. Sambucus nigra (commonly ‘elderberry’) is recognized for its therapeutic properties such as antidiabetic and antiviral effects, diuretic properties, and prevention of atherosclerosis, cardiovascular diseases, and cancer [1].
On the other hand, food industry is focused on the use of green-friendly techniques that do not involve the use of solvents or chemical substances, while avoiding the generation of polluting agents. For instance, in the juice-based beverages area, enzymatic treatments have been applied to improve fruit juice extraction yield. Bioactive extraction employing enzymatic treatments has been studied in many berries, such as raspberry [2], black chokeberry, and blackcurrant [3]. However, most of works were focused on comparing the performance of different commercial enzyme preparations and pre-treatments, but an optimization study of the process variables to achieve maximum extraction of bioactive compounds has not been addressed.
Regarding powder production, some reports show the presence of pigments and bioactive compounds in juice or extracts from different berries (maqui, raspberry, blackcurrant, and elderberry), employing different carriers and mainly spray-drying as dehydration technology [4–6].
In order to obtain dry powders avoiding exposure to high temperatures, and using little amount of carrier agent, freeze-drying may be a good dehydration technology to choose. Previous studies have shown that freeze-drying is an adequate process to preserve or reduce loss of bioactive compounds of fruits, for instance those carried out in murtilla [7], black mulberry [8], bayberry [9], raspberries [10], and maqui [11].
Together with the antioxidants extracted from natural products, current investigations are studying not only the content of bioactive compounds in food but also their metabolism through digestion tract [12]. Polyphenols are known for their antioxidant effect in human body, but their level of bioactivity is conditioned by their bioaccessibility and bioavailability after digestion.
In line with all previously described, the aims of this work were: 1) to generate an elederberry powder from the optimized enzymatic extraction of bioactive compounds and further freeze-drying minimizing the carrier addition, 2) to identify phenolic compounds and quantify changes throughout the different processing steps, and 3) to evaluate the bioaccessibility of antioxidant compounds by using an in vitro model in order to consider this information when designing beverages or other products formulated with fruit powders.
2Materials and methods
2.1Materials and reagents
Elderberry fruits (Sambucus nigra L.) were collected from wild plants grown in the forest matrix of the zone known as Parallel 42° Andean Shire (Argentine Patagonia). Gathering was carried out by experienced rural settlers who are part of the marketing circuits of native and exotic berries in El Bolsón area (Río Negro Province, Argentina). Sambucus nigra L. species (local name: sauco), which belongs to the botanical family Adoxaceae, has been previously taxonomically identified by Ochoa et al. [13], and plant specimens are placed in the IRNAD Institute-National University of Río Negro herbarium (Voucher specimen number: JJO 0011). Fully-ripe fruits were selected and immediately processed by individual quick freezing (IQF process) in an air blast tunnel (T = – 48°C, air speed = 1.5 ms–1) and then stored at – 22°C until use.
A pectinolytic enzyme (Novozymes Pectinex® Ultra Color, Bagsvaerd, Denmark) was used for the enzymatic extractions.
For sugar and organic acids HPLC-RID-DAD analysis: a) solvents for mobile phases were sulfuric acid, Milli-Q water and acetonitrile (ACN), all HPLC grade and acquired from Sintorgan (Sintrogan S.A., Buenos Aires, Argentina); b) the HPLC standards were D-(+)-glucose, D-(–)-fructose, L-malic and L-ascorbic acids from Sigma Aldrich Chemie GmbH (Steinheim, Germany); sucrose, succinic, and L-(+)- tartaric acid from Merck KGaA (Darmstadt, Alemania); citric and acetic acids from Cicarelli (Reagents S.A, Santa Fe, Argentina); and L-lactic acid from Megazyme Ltd. (Bray, Irland).
For phenolic and anthocyanin HPLC-DAD analysis, the following standards were used: cyanidin-3-O-glucoside chloride (kuromanine), delphinidin-3-O-glucoside, (-) epicatechin and resveratrol from Santa Cruz Biotechnology Inc. (Texas, USA); ellagic acid from LGC Standards (Teddington, UK) and gallic acid, chlorogenic acid, p-cumaric acid, ferulic acid, caffeic acid, catechin and quercetin-3-rutinoside (rutin) from Sigma– Aldrich Chemie GmbH (Steinheim, Germany). The solvents for mobile phases were Milli-Q water, HPLC grade methanol, and 85% phosphoric acid provided by Sintorgan (Sintorgan S.A., Buenos Aires, Argentina).
For in vitro gastrointestinal digestion the enzymes were purchased from Sigma– Aldrich Chemie GmbH (Steinheim, Germany). To simulate the process, a solution of α-amylase (A6255, activity = 1500 U/ml) for oral phase, a pepsin (P7000, activity = 25000 U/ml) solution for gastric step, and a pancreatin (P7545, activity = 800 U/ml) solution for intestinal phase, were used.
2.2Enzyme assisted extraction process (EAE)
2.2.1Experimental design
A multifactorial experimental design 32 with interaction analysis was used to find the optimum combination of temperature (40, 50 and 60 °C) and enzyme concentration (80, 120 and 160 ppm) to obtain an optimum elderberry extract (OE) with high level of total polyphenol content (TPC), monomeric anthocyanin content (ACY) and antioxidant activity (AA). Duplicates for each run were carried out.
2.2.2Sample processing
50 g of fruit were thawed at 40 °C and then crushed using a blender for 1 min. The nine combinations of temperature and enzyme concentration were tested to find the optimum conditions (Table 1). The enzyme was added and the mixture was placed into a water bath set at the corresponding temperature. After maceration (60 min), crushed fruit was immersed in boiling water to inactivate the enzyme (1 min at 80 °C); then it was immediately cooled up to 30– 35 °C. Extracts were obtained by filtering the processed pulp with a polyester fabric. A control juice (J) was prepared without the application of heat and enzymes.
Table 1
Experimental design results for total phenolic content (TPC), antioxidant activity (AA) and total anthocyanin content (ACY) of elderberry enzymatic extracts
| Factors | TPC† | AA† | ACY‡ | |
| T (°C) | CE (ppm) | (mg gallic acid/100g extract) | (mg gallic acid/100g extract) | (mg cyn-3-glu/100g extract) |
| 40 | 80 | 630±31 Ba | 267±46 Ab | 267±8 e |
| 40 | 120 | 623±18 Ba | 296±10 Ab | 272±13 de |
| 40 | 160 | 646±7 Aa | 338±40 Aa | 271±20 de |
| 50 | 80 | 604±33 Ba | 291±36 Ab | 280±10 cde |
| 50 | 120 | 617±19 Ba | 294±13 Ab | 360±8 ab |
| 50 | 160 | 654±4 Aa | 346±20 Aa | 366±9 a |
| 60 | 80 | 525±28 Ca | 241±7 Bb | 312±27 cd |
| 60 | 120 | 487±23 Ca | 227±37 Bb | 312±33 cd |
| 60 | 160 | 498±75 Ca | 274±7 Ba | 320±12 bc |
†Main effects of factors were significant (p < 0.05). In each column, different capital letters indicate main effect of temperature (T). Different lowercase letters indicate main effect of the enzyme concentration (CE). ‡Interaction T*CE was significant (p < 0.05). Different lowercase letters indicate significant differences.
Additionally, the liquid extraction yield (YE) was calculated according to eq. (1):
(1)
Once all the experiments were completed, a multiple response optimization was performed by using the desirability function, and the OE was obtained under the optimized conditions. The OE was used for the following assays.
2.3Ingredient formulation and freeze-drying
The optimum extract (OE) was added with different maltodextrin DE12 (Givaudan S.A, Buenos Aires, Argentina) concentrations (5, 10, 15, and 20% w/w), and freeze-dried (48 h, – 84 °C, 0.04 mbar) using an Alpha 1– 4 LD/2– 4 LD-2 (Martin Christ, Gefriertrocknungsanlagen GmbH, Osterode, Germany) device.
2.4Physicochemical and functional properties
2.4.1Water content and water activity
Water content of elderberry fruit was determined gravimetrically after vacuum drying at 60 °C with desiccant. In freeze-dried powders, it was performed by Karl Fischer titration with a TIM 980 Titration Manager (Villeurbanne Cedex, France). Methanol was used as solvent and Hydranal Titrant Composite 5 from Riedel-de Haën (Germany) as titration reagent [5]. An Aqualab Series 3 TE (Decagon Devices, Pullman, WA, USA) was used to measure water activity (aw) at 25±1°C, of fruit and powder samples [14].
2.4.2Acidity, pH and soluble solids content
Crushed fruit, J, and OE samples were characterized according to AOAC methods [14]: pH (945.27), acidity (945.26), and soluble solids (932.12).
2.4.3Glass transition temperature (Tg)
The powders Tg was evaluated using differential scanning calorimetry (onset values) in a DSC 822e Mettler Toledo calorimeter (Schwerzenbach, Switzerland). The device was calibrated using indium (156.6 °C), lead (327.5 °C) and zinc (419.6 °C). All determinations were carried out at a heating rate of 10 °C/min from 25 °C to 100 °C. Samples were loaded in hermetically sealed 40μL medium pressure pans (an empty pan was employed as a reference) with approx. 10 mg sample mass. The thermograms were evaluated using the Mettler Stare program.
2.4.4Water sorption isotherms
Powder samples (0.2 – 0.4 g) were loaded into glass vials and kept at 20±1°C in desiccators with different salt solutions that provided relative humidities (RH) of 11% (LiCl), 22% (CH3COOK), 33% (MgCl2), 43% (KCO3), 52% (Mg(NO3)2) and 75% (NaCl) [15]. Samples were stored until equilibrium was reached (nearly 15 days); then glass transition temperature (Tg), water activity, and water content were determined for each sample.
2.4.5Solubility
Solubility was calculated according to Gagneten [5]. Powder samples (0.5 g) were dissolved in 50 ml of distilled water and then centrifuged at 3000 g for 5 minutes. 10 ml of supernatant were transferred to a glass capsule and dried in an air-oven at 105 °C till constant weight. Solubility (%) was calculated by weight difference.
2.4.6Superficial color
A photocolorimeter model CR400 (Minolta Co, Tokyo, Japan) was used. Color functions were calculated in the CIELAB uniform color space for illuminant C at 2° standard observer. Values of L* (luminosity/darkness), a* (redness/greenness) and b* (yellowness/blueness) were obtained. Powders were analyzed using glass vials containing 1 cm height of powder, and initial fruits were directly assessed. Measurements were standardized using a white cylindrical cup to cover the vial [5].
2.4.7Sugar and organic acids HPLC-RID-DAD analysis
Sucrose, glucose and fructose content, as well as malic, citric, succinic, tartaric, acetic, lactic, and ascorbic acids were measured in elderberry fruit.
Preparation of extracts: an aqueous extract was prepared for fruit samples by mixing 2-3 g of mashed fruit with 15 ml of distilled water. After 5 min of constant agitation, the sample was vacuum filtered and the pellet was again extracted using the same procedure but with 10 ml of water. Following the extraction process, more distilled water was added to reach a final volume of 25 ml. Soluble solids were determined and the sample was diluted to achieve 2° Brix. Finally, the aqueous extract was filtered with a 0.2μm Nylon filter (Genbiotech SRL, Buenos Aires, Argentina) into a vial for HPLC analysis.
Chromatographic analysis: fructose, glucose, and acids were separated by injecting 20μl of extract in an Agilent 1260 HPLC (Agilent Techonologies, USA) equipped with an automatic injector (ALS) and two detectors: a diode array detector (DAD, organic acids analysis) and a refractive index detector (RID, sugar analysis). Separation was performed using a Hiplex H column (300×7.7 mm, 8 mm particle size, Agilent Technologies, USA) at 75 °C, and a mobile phase composed of 0.001 M H2SO4 with a flow rate of 0.4 ml/min (isocratic). For sucrose quantification, a ZORBAX carbohydrate column (150×4.66 mm, 5μm particle size, Agilent Technologies, USA) and a mobile phase composed of 75% ACN and 25% Milli-Q water, were used. The analysis was performed at 30 °C with a flow rate of 1.4 ml/min. Chromatograms were recorded at 214 nm and calibration curves were created using the mentioned standards with a high linearity (r2 > 0.999).
2.4.8Bioactive compounds and antioxidant activity
Phenolic and anthocyanin contents and antioxidant activity were analyzed by spectrophotometric and chromatographic techniques.
2.4.8.1Spectrophotometric analysis of total phenolic and anthocyanin content, and antioxidant activity
Preparation of the extracts: two extraction procedures were used [5], with some modifications. 15 ml of solvent were added to 1 g of each sample (fruit, J, OE, and reconstituted powder) and homogenized with constant agitation for 5 min. Then, the mixture was filtered and 10 ml of solvent was applied again to the pellet. Both filtered solutions were joined up to a final volume of 25 ml. For fresh fruit, 2-3 g of crushed fruit were used and, for powder samples, measurements were performed on the powder reconstituted with distilled water (g powder:g water ratio = 1:4). Pure methanol was used as solvent for polyphenol and antioxidant activity assessment, and ethanol acidified with HCl 1.5N (85:15) for anthocyanin content and polymeric color.
Spectrophotometric analysis: methodologies described previously were used [5]. Total phenolic content (TPC) was determined using the Folin Cicocalteu reagent, monomeric anthocyanin content (ACY) was measured with the pH differential method, antioxidant activity (AA) was analyzed using the ABTS bleaching method, and polymeric color (PC) through the metabisulfite method. Additionally, polyphenol content attached to tissue cell walls was determined by alkaline hydrolysis according to Bunzel [16]. All absorbance measurements were carried out using a T60 UV-Visible spectrophotometer (PG Instruments, Leicestershire, United Kingdom) and results were expressed as mg gallic acid per 100 g of sample for TPC and AA, mg cyanidin-3-O-glucoside (cyn-3-glu) per 100 g of sample for ACY, and polymeric color as percent of total color density (% PC).
2.4.8.2Qualitative-quantitative HPLC-DAD analysis
Preparation of extracts: samples were prepared in the same way as described in section 4.7 but using pure methanol. Then, a cleanup step was performed, which consisted in a solid phase extraction (SPE) executed using a HyperSep C18 cartridge (40 to 60μm particle size, 3 ml column volume, Thermo ScientificTM, USA). 3 ml of pure methanol were added to humidify the cartridge, followed by 3 ml of methanolic sample extract. Eluted samples were collected and filtered with a 0.2μm Nylon filter (Genbiotech SRL, Buenos Aires, Argentina) into a vial for HPLC analysis.
Chromatographic analysis: it was performed using an Agilent 1260 HPLC system (Agilent Technologies, Waldbronn, Germany) with a diode array detector (DAD), controlled by Agilent's OpenLAB Chem Station software. Separations were carried out on a ZORBAX Eclipse XDB-C18 column (4.6×100 mm, 3.5μ; Agilent Technologies) operated at 25 °C, flow rate at 0.5 ml/min, and injection volume of 5μl. The elution solvents were Milli-Q water (solvent A), 85% w/v phosphoric acid (solvent B) and methanol (solvent C). The linear gradient started with 99% solvent A and 1% solvent B, reaching 79.2% solvent A and 0.8% solvent B at 10 min, 59.4% solvent A and 0.6% solvent B at 20 min, 39.6% solvent A and 0.4% solvent B at 30 min, 19.8% solvent A and 0.2% solvent B at 40 min. A 6 min equilibrium time was allowed between injections. The detection wavelength was 280 nm (signal A) for flavan-3-ols and gallic acid, 323 nm (signal B) for hydroxycinnamic acids and stilbenes, 365 nm (signal C) for flavonols and ellagic acid, and 520 nm (signal D) for anthocyanidins. These compounds were identified by comparing the retention times and the UV– Vis spectra (recorded between 210 and 610 nm) with the standards. Quantification was performed by the external standard method. For this, the calibration curves were prepared in three mixes, in a range of 0.05 to 200 mg/l.
2.5Optimum extract cytotoxicity analysis
Cell culture and cytotoxicity analysis were performed according to the protocol described by Soria [17], with some modifications.
2.5.1Cell culture
Vero cells (kidney epithelial cells from African green monkey; European Collection of Cell Cultures) were cultured in Dulbecco’s modified Eagle’s medium (DMEM) completed with 10% fetal bovine serum, 100 U/ml penicillin-G, and 40μg/ml gentamicin sulphate, incubated at 37°C in a 5% CO2 atmosphere.
2.5.2Cellular viability
6000 Vero cells per well were seeded in a multiwell plate with 200μl of medium and incubated for 24 hours. Next, the medium was replaced with a fresh one containing different concentrations of elderberry optimum extract (μg solids/ml medium) and a control (wells only with culture medium), which were incubated for 2 hours. The culture medium was removed and a drop of 0.5% violet crystal in 50% methanol was added per well and left to act for 15 minutes. Then, violet crystal was removed with 50% methanol and 50μl/well of a solution containing 80% 0.1 M sodium citrate (pH 5.4) and 20% methanol was added, to solubilize the cells. Finally, the absorbance at 630 nm was read on the microElisa plate reader, and the viability percentage was calculated as the difference between the absorbance of the extracts and the control.
2.6Powder ingredient in vitro digestion (bioaccesibility evaluation)
The digestion of 5 g of reconstituted powder (powder:distilled water ratio = 1:4) was performed. Oral, gastric, and small intestinal digestion phases were simulated according to Minekus [12]. In all phases, samples were incubated at 37 °C in a Function Line 7000 drying stove (Heraeus, Germany) and under constant agitation with an orbital shaker Vicking M-23 (Vicking SRL, Argentina) at 100 rpm. After the in vitro digestion, samples were centrifuged at 13,000 g for 10 minutes, dividing the soluble (supernatant) and the insoluble (residue) fractions.
Antioxidant activity, and phenolic and anthocyanin content were analyzed in the supernatant. Results were expressed as mg bioactive per g of sample, and bioaccesibility (%) was calculated according to eq. (2) [6]:
(2)
2.7Antioxidant activity after epithelial transport
The antioxidant activity of the supernatant obtained from in vitro digestion after being transported by the Caco-2 (ATCC) cell line monolayer was evaluated [18]. 1×10⁶ Caco-2 cells were seeded (per well) on inserts transwell Corning Inc. (Lowell, MA, USA) (12 mm diameter polycarbonate membranes, 0.4μm pore membrane and a growth area of 1.13 cm2). 1000μl of Dulbecco’s Modified Medium (DMEM) were placed on the apical (AP) side and 1200μL in the basolateral (BL) side. Cells were incubated at 37°C in a humidified atmosphere containing 5% CO2, and the medium was changed every 48– 72 hours. The integrity of the monolayer of differentiated cells was monitored by measuring the transepithelial electrical resistance (TEER) value. The development and differentiation of Caco-2 cells was considered when the TEER measurement reached equilibrium with values higher than 300 Ωxcm2 [19]. For the test, 500μl of intestinal fluid diluted 1:1 with HBSS buffer at 37°C was placed on the AP side of the Caco-2 system, and 1500μl of the same buffer was placed on the BL side. After 1 hour of incubation at 37°C, the solution of the BL side was recovered, and the antioxidant activity was evaluated by the method previously described. At the beginning and at the end of the transport test, TEER was monitored to ensure the integrity of the Caco-2 monolayer.
2.8Statistical analysis
The physicochemical properties were determined in triplicate. Data were expressed as means±standard deviation. Analysis of variance (ANOVA) and Tukey’s test were applied to compare results from different treatments using the software Infostat© version 2016.11.17 (UNC, Argentina). Experimental design and response surfaces were evaluated by using Statgraphics Centurion XVI.I software (StatPoint Technologies Inc., Warrenton, VA, USA).
3Results and discussion
3.1Fruit characterization
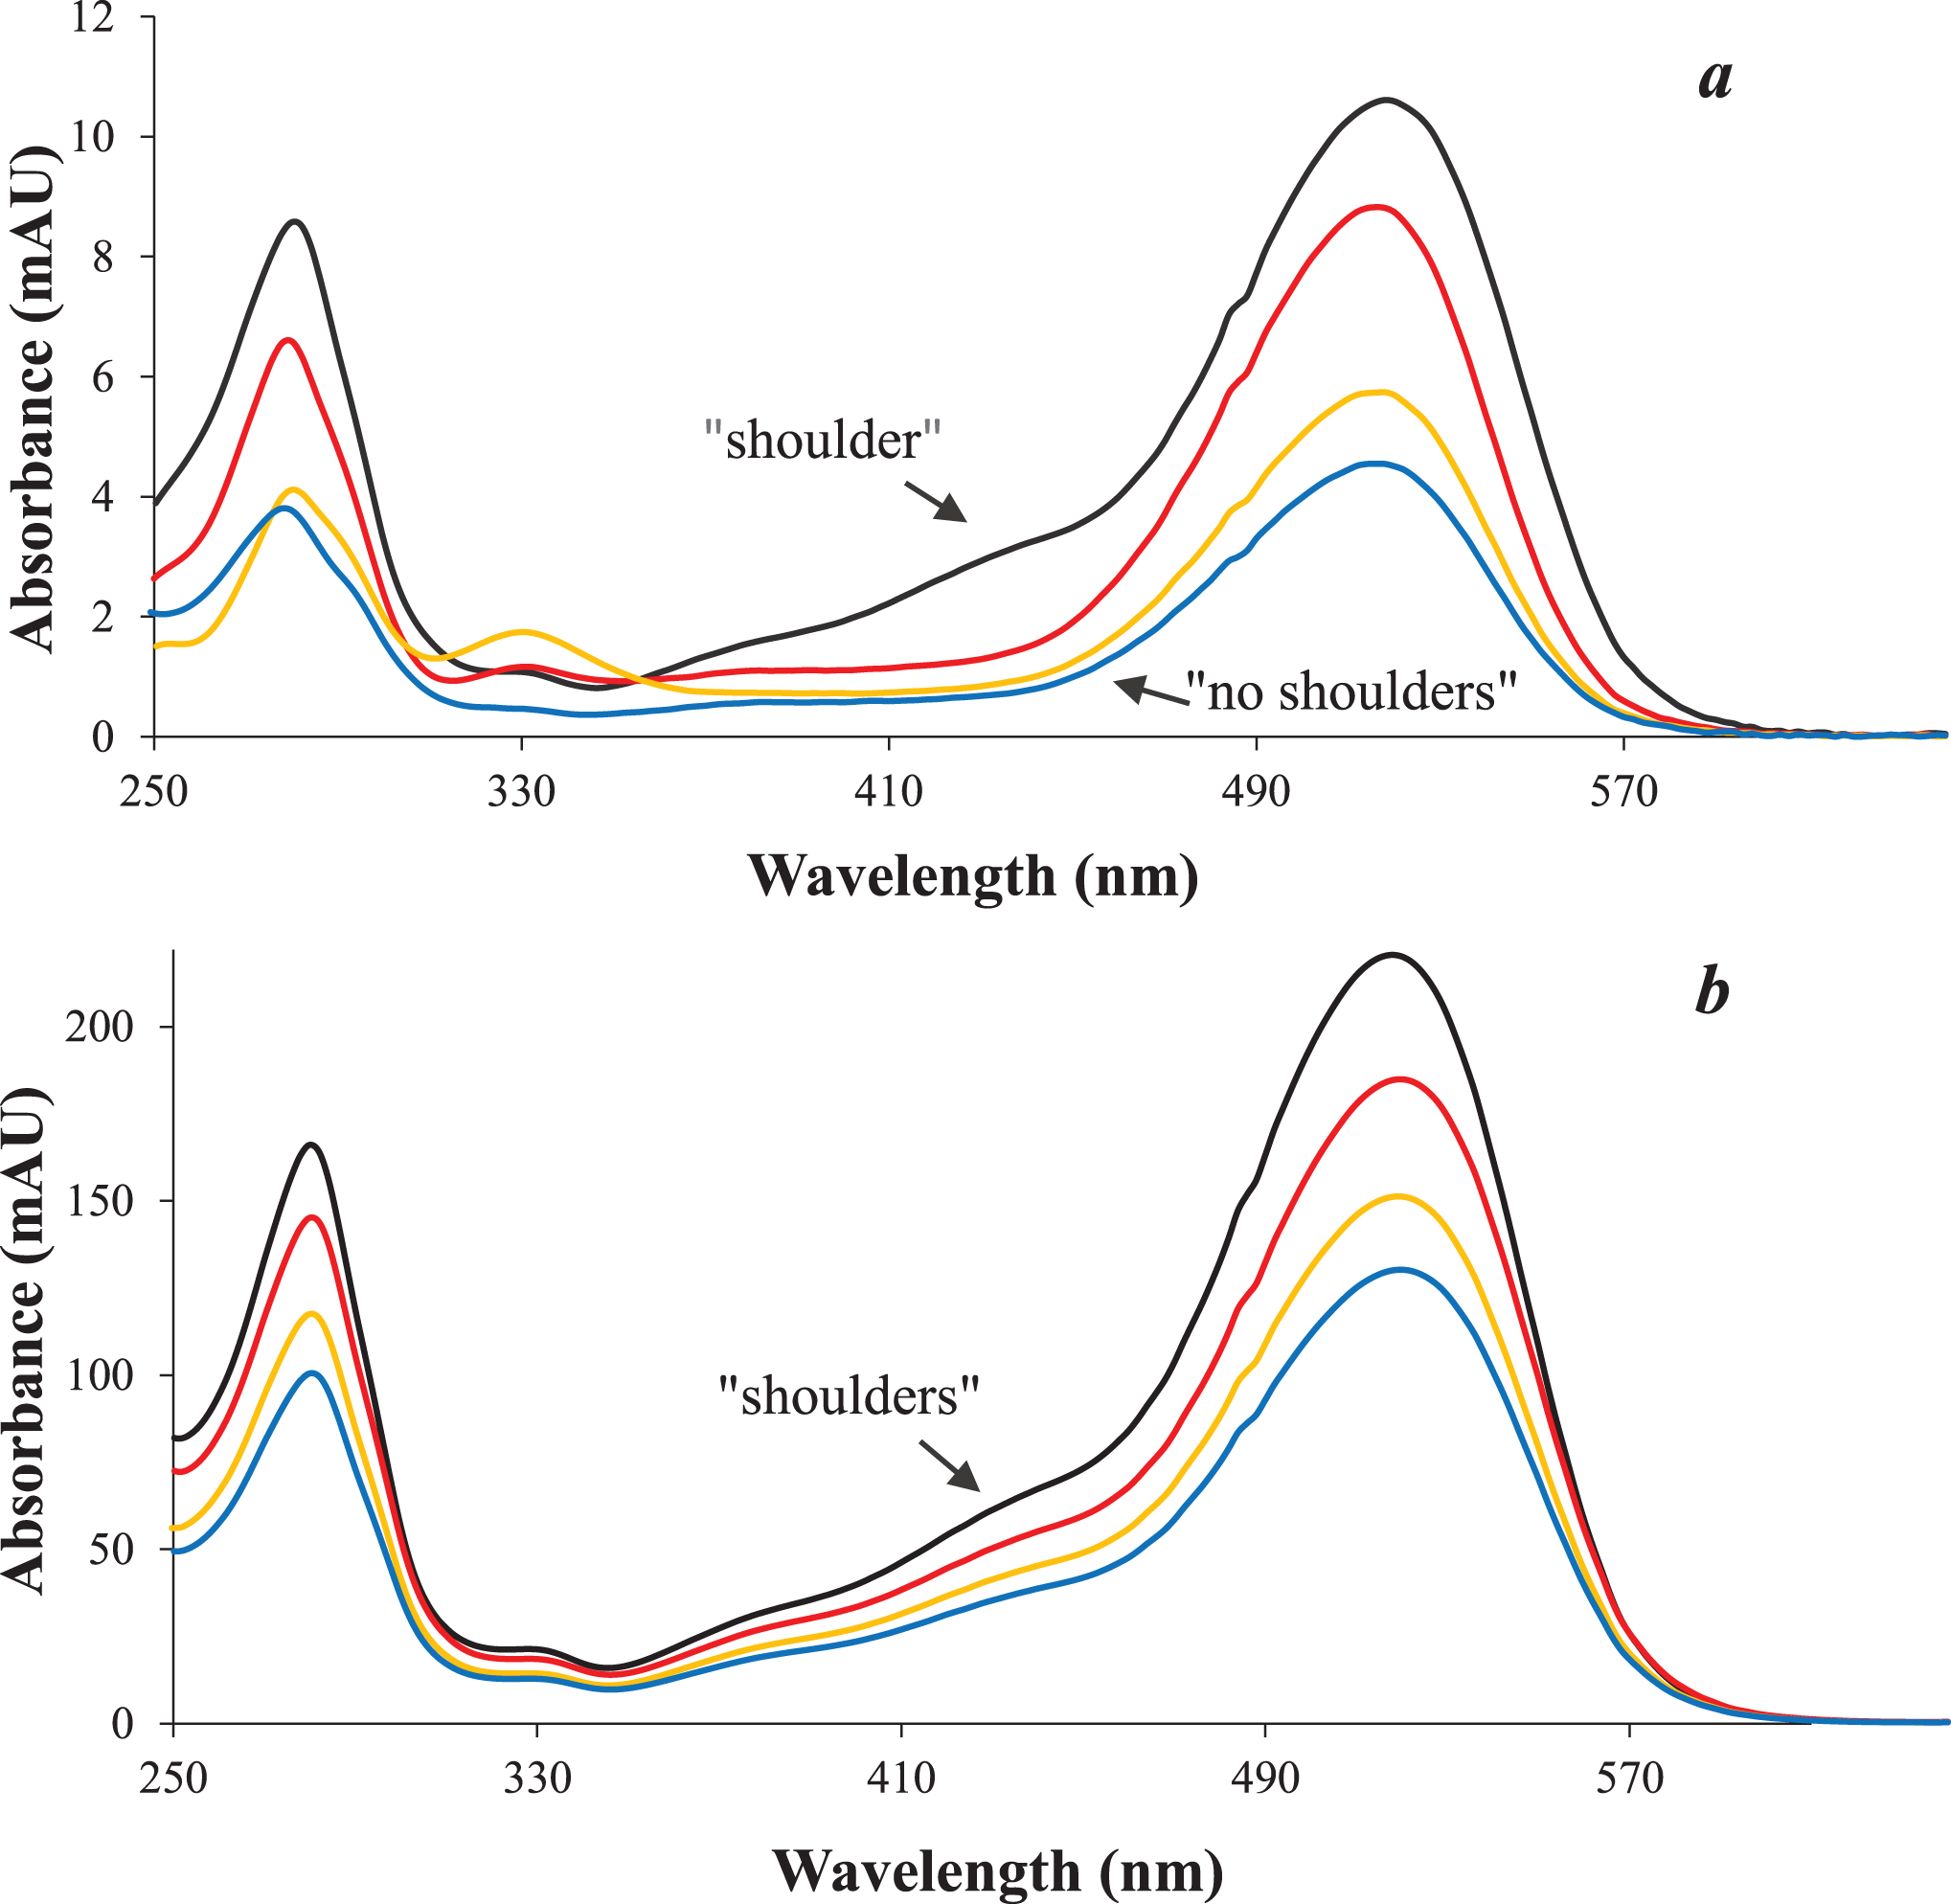
Some physicochemical properties of elderberry fruit are shown in Table 2. Results are consistent with the values reported by other authors. For instance, Vulic [20] informed ≈80 % water content, and Perkins [21], when studying some genotypes of Sambucus nigra observed a soluble solid content ranging from 9.3 to 12.2°Brix, pH from 4.73 to 5.19, and acidity from 0.42 to 0.58 g citric acid/100 g. Regarding bioactive compounds, these authors also informed a TPC range of 439 – 719 mg gallic acid/100 g and an ACY content of 105 – 328 mg cyn-3-glu/100 g. These data were consistent with our results. The individual phenolic compounds identified by HPLC-DAD and UV-Vis spectra in elderberry fruit are shown in Table 3 and the corresponding chromatograms are provided in Fig. 1. Anthocyanins represented the main phenolic group (≈70%), followed by flavonols accounting for 14% (mainly quercetin-3-rutinoside), and catechin, among the analyzed flavanols (12%). Phenolic acids (mainly gallic and chlorogenic) were also detected but in much smaller contents. Cyanidin-based anthocyanins have been reported as the only group of anthocyanins in elderberry, being cyanidin-3-glucoside and cyanidin-3-sambubioside the most prevalent [22– 24]. However, separation and peak identification of these two anthocyanins is not always possible because of identical retention times under the conditions of the chosen method, as it was also reported [25, 26]. Therefore the peak 5 eluting at 20.2 min (Fig. 1d) could be tentatively considered a mixture of these two anthocyanins. Additionally, peak 3 (eluting at 17.1 min) could be ascribed to cyanidin-3,5-O-di-glucoside or a mixture with cyanidin-3-O-sambubioside-5-O-glucoside, since these compounds exhibit similar chromatographic behavior and have been also reported to be in considerable amounts in elderberry [1, 26]. The greater polarity (earlier elution) of the unknown compounds associated with peak 3 in relation to the corresponding cyanidin-3-glucosides/ sambubioside identified in peak 5 suggested the presence of polyglycosylated anthocyanin. On the other hand, the UV-Vis spectra obtained in elderberry fruit (Fig. 2), not only showed that compounds associated with both peaks would correspond to cyanidin derivatives showing λmax at 280 and 518 nm, but also that peak 3 did not exhibit the shoulder around 420– 455 nm, characteristic of 3-glycosylated anthocyanidins of peak 5. This would support the existence of substitution at positions 3 and 5 of the aglycone in the compounds associated with the peak 3 [27]. According to previous reports, anthocyanins would be the main responsible of elderberry antioxidant capacity and color [25, 28].
Table 2
Physical and chemical properties of elderberry fruit
| Water content (g water/100 g FW) | 82.7±0.9 |
| aw | 0.979±0.03 |
| Total soluble solids (g solids/100 g FW) | 10.4±0.2 |
| Acidity (g citric acid/100 g FW) | 1.02±0.04 |
| pH | 4.20±0.02 |
| Spectrophotometric measurements | |
| TPC (mg gallic acid/100 g FW) | |
| Fruit methanolic extraction | 483±70 |
| Alkaline hydrolysis | 556±74 |
| ACY (mg Cyn-3-glu/100 g FW) | 262±53 |
| AA (mg gallic acid/100 g FW) | 234±25 |
| Polymeric color (%) | 9.6±0.2 |
| HPLC analysis Sugars | |
| Glucose (g/100 g FW) | 1.8±0.1 |
| Fructose (g/100 g FW) | 1.6±0.3 |
| Sucrose (g/100 g FW) | <LOQ |
| Organic acids | |
| Citric acid (g/100 g FW) | 0.54±0.02 |
| Malic acid (g/100 g FW) | 0.08±0.01 |
| Superficial color | |
| L* | 18.5±0.6 |
| a* | 3±1 |
| b* | 1.1±0.4 |
| Cab | 3±1 |
| hab | 21.9±0.7 |
FW: fresh weight. LOQ: limit of quantification (0.05 g/100 g)
Table 3
Content of phenolic compounds, sugar and organic acids detected by HPLC-UV analysis (mean±standard deviation in mg/g sample)
| Phenolics | Elderberry fruit | OE | Freeze-dried powder | |
| (mg/g fruit) | (mg/g extract) | (mg/g powder) | ||
| Total phenolic acids | 0.11±0.07 | 0.21±0.06 | 0.63±0.03 | |
| Hydroxybenzoic acids | Gallic acid | 0.057±0.004 | 0.15±0.03 | 0.46±0.04 |
| Ellagic acid | 0.006±0.002 | 0.008±0.004 | <LOQ | |
| Hydroxycinnamic acids | Chlorogenic acid | 0.045±0.003 | 0.048±0.001 | 0.16±0.01 |
| Ferulic acid | 0.0010±0.0002 | <LOQ | <LOQ | |
| p-Coumaric acid | 0.0010±0.0007 | 0.0024±0.0006 | 0.010±0.004 | |
| Caffeic acid | nd. | nd. | nd. | |
| Total Flavan-3-ols | 0.28±0.02 | 0.41±0.08 | 1.81±0.09 | |
| (+)-Catechin | 0.28±0.02 | 0.41±0.08 | 1.81±0.09 | |
| (–)-Epicatechin | nd. | nd. | nd. | |
| Total Flavonols | 0.32±0.06 | 0.46±0.04 | 1.99±0.08 | |
| Quercetin | 0.014±0.06 | 0.03±0.02 | 0.010±0.003 | |
| Rutin | 0.31±0.05 | 0.4±0.1 | 2.0±0.1 | |
| Total Anthocyanins | 1.6±0.2 | 2.1±0.3 | 7.7±0.3 | |
| Cyn-3-glu/Cyn-3-samb | 1.5±0.1 | 1.9±0.2 | 6.8±0.2 | |
| Cyn-3-diglu/Cyn-3-samb-5-glu | 0.09±0.02 | 0.21±0.03 | 0.89±0.07 | |
| Delph-3-glu | nd. | nd. | nd. | |
| Stilbenes | Resveratrol | nd. | nd. | nd. |
| Total phenolics | 2.3±0.3 | 3.2±0.2 | 12±1 |
Cyn-3-glu: Cyanindin-3-O-glucoside. Cyn-3-samb: Cyanidin-3-O-sambubioside. Cyn-3-diglu: Cyanidin-3,5-O-diglucoside. Cyn-3-samb-5-glu: Cyanidin-3-sambubiosyl-5-glucoside. Delph-3-glu: Delphinidin-3-glucoside. nd.: not detected. LOQ: limit of quantification (0.05 mg/g).
Fig. 1
HPLC chromatogram of elderberry fruit. (a) 280 nm, signal A; (b) 323 nm, signal B; (c) 365 nm, signal C; (d) 520 nm, signal D. The peaks correspond to: 1. Gallic acid, 2. Catechin, 3. Cyanidin diglucoside (presumed), 4. Chlorogenic acid, 5. Cyanidin monoglycosides, 6. p-Cumaric acid, 7. Ferulic acid, 8. Quercetin-3-rutinoside (Rutin), 9. Ellagic acid, 10. Quercetin.
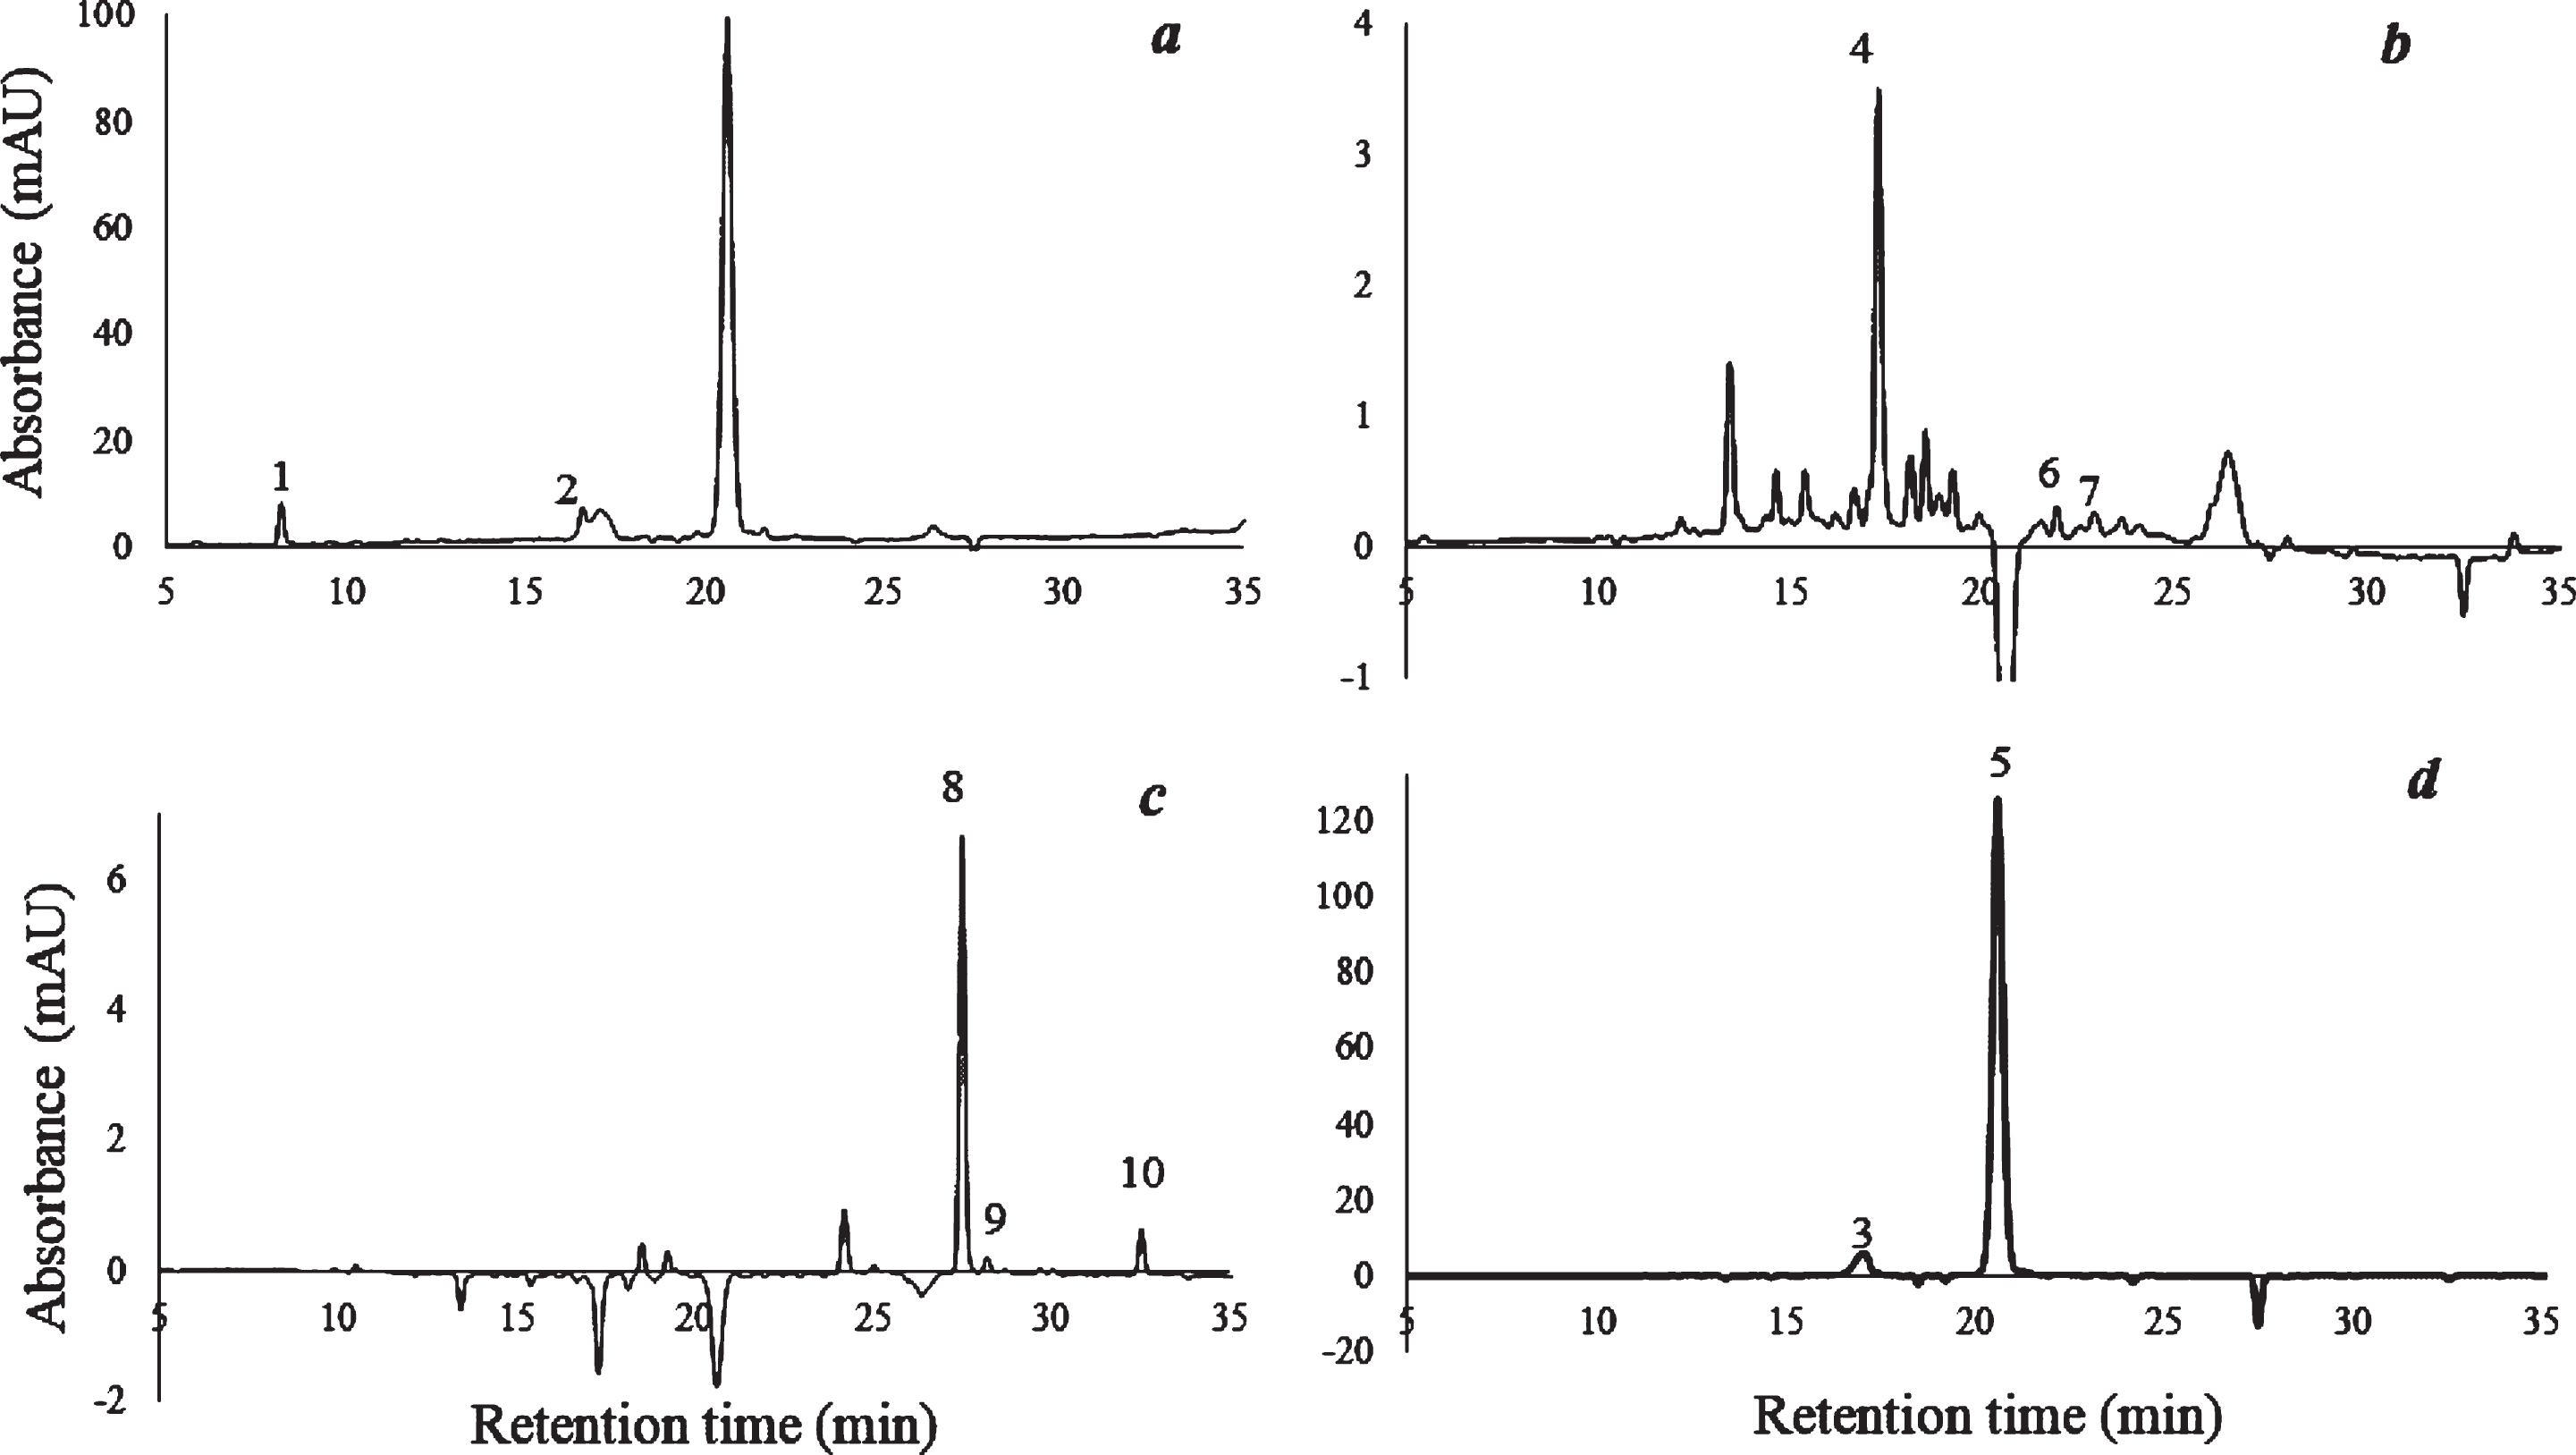
Fig. 2
UV absorption spectra corresponding to the presence of cyanidin 3,5-O-diglucosides (a) and cyanidin-3-O-glucosides (b) in elderberry fruit (red line), OE (yellow line) and freeze-dried powder (blue line), compared to the cyanidin-3-O-glucoside standard (black line).
Regarding sugars, fructose and glucose were the most abundant, whereas sucrose content was below the limit of quantification (Table 2). Among the analyzed organic acids, citric and malic acids were detected, being citric acid the preponderant [1].
Concerning chromatic parameters, elderberry fruit was found in the first quadrant having b* and a* positive values, specifically in the area corresponding to dark red colors due to a low saturation and poor lightness.
3.2Achieving of the optimum extract
At subcellular level, soluble phenolic compounds are mostly located in vacuoles; however, some compounds may accumulate in the cell wall either associated to lignin or as simpler molecules, primarily in the skin, and therefore their solvent extraction is very difficult [29]. After alkaline hydrolysis, polyphenol content appeared to be higher than that obtained through methanolic extraction of the fruit (Table 2), which can be taken as evidence of the presence of polyphenols forming insoluble complexes coupled to cell wall polymers. In this context, the use of enzymes was chosen as a suitable treatment to release the bioactive compounds from the fruit tissue and obtain polyphenol-rich extracts, while avoiding the use of not green-friendly techniques, like inorganic or organic solvents.
The optimal operating conditions of the enzymatic process were found considering temperature (T = X1) and enzyme concentration (CE = X2) as process variables, and TPC, AA, and ACY, as the response variables. The experimental results shown in Table 1 led to the second-order polynomial models describing TPC (eq. 3), ACY (eq. 4), and AA (eq. 5) behavior:
(3)
(4)
(5)
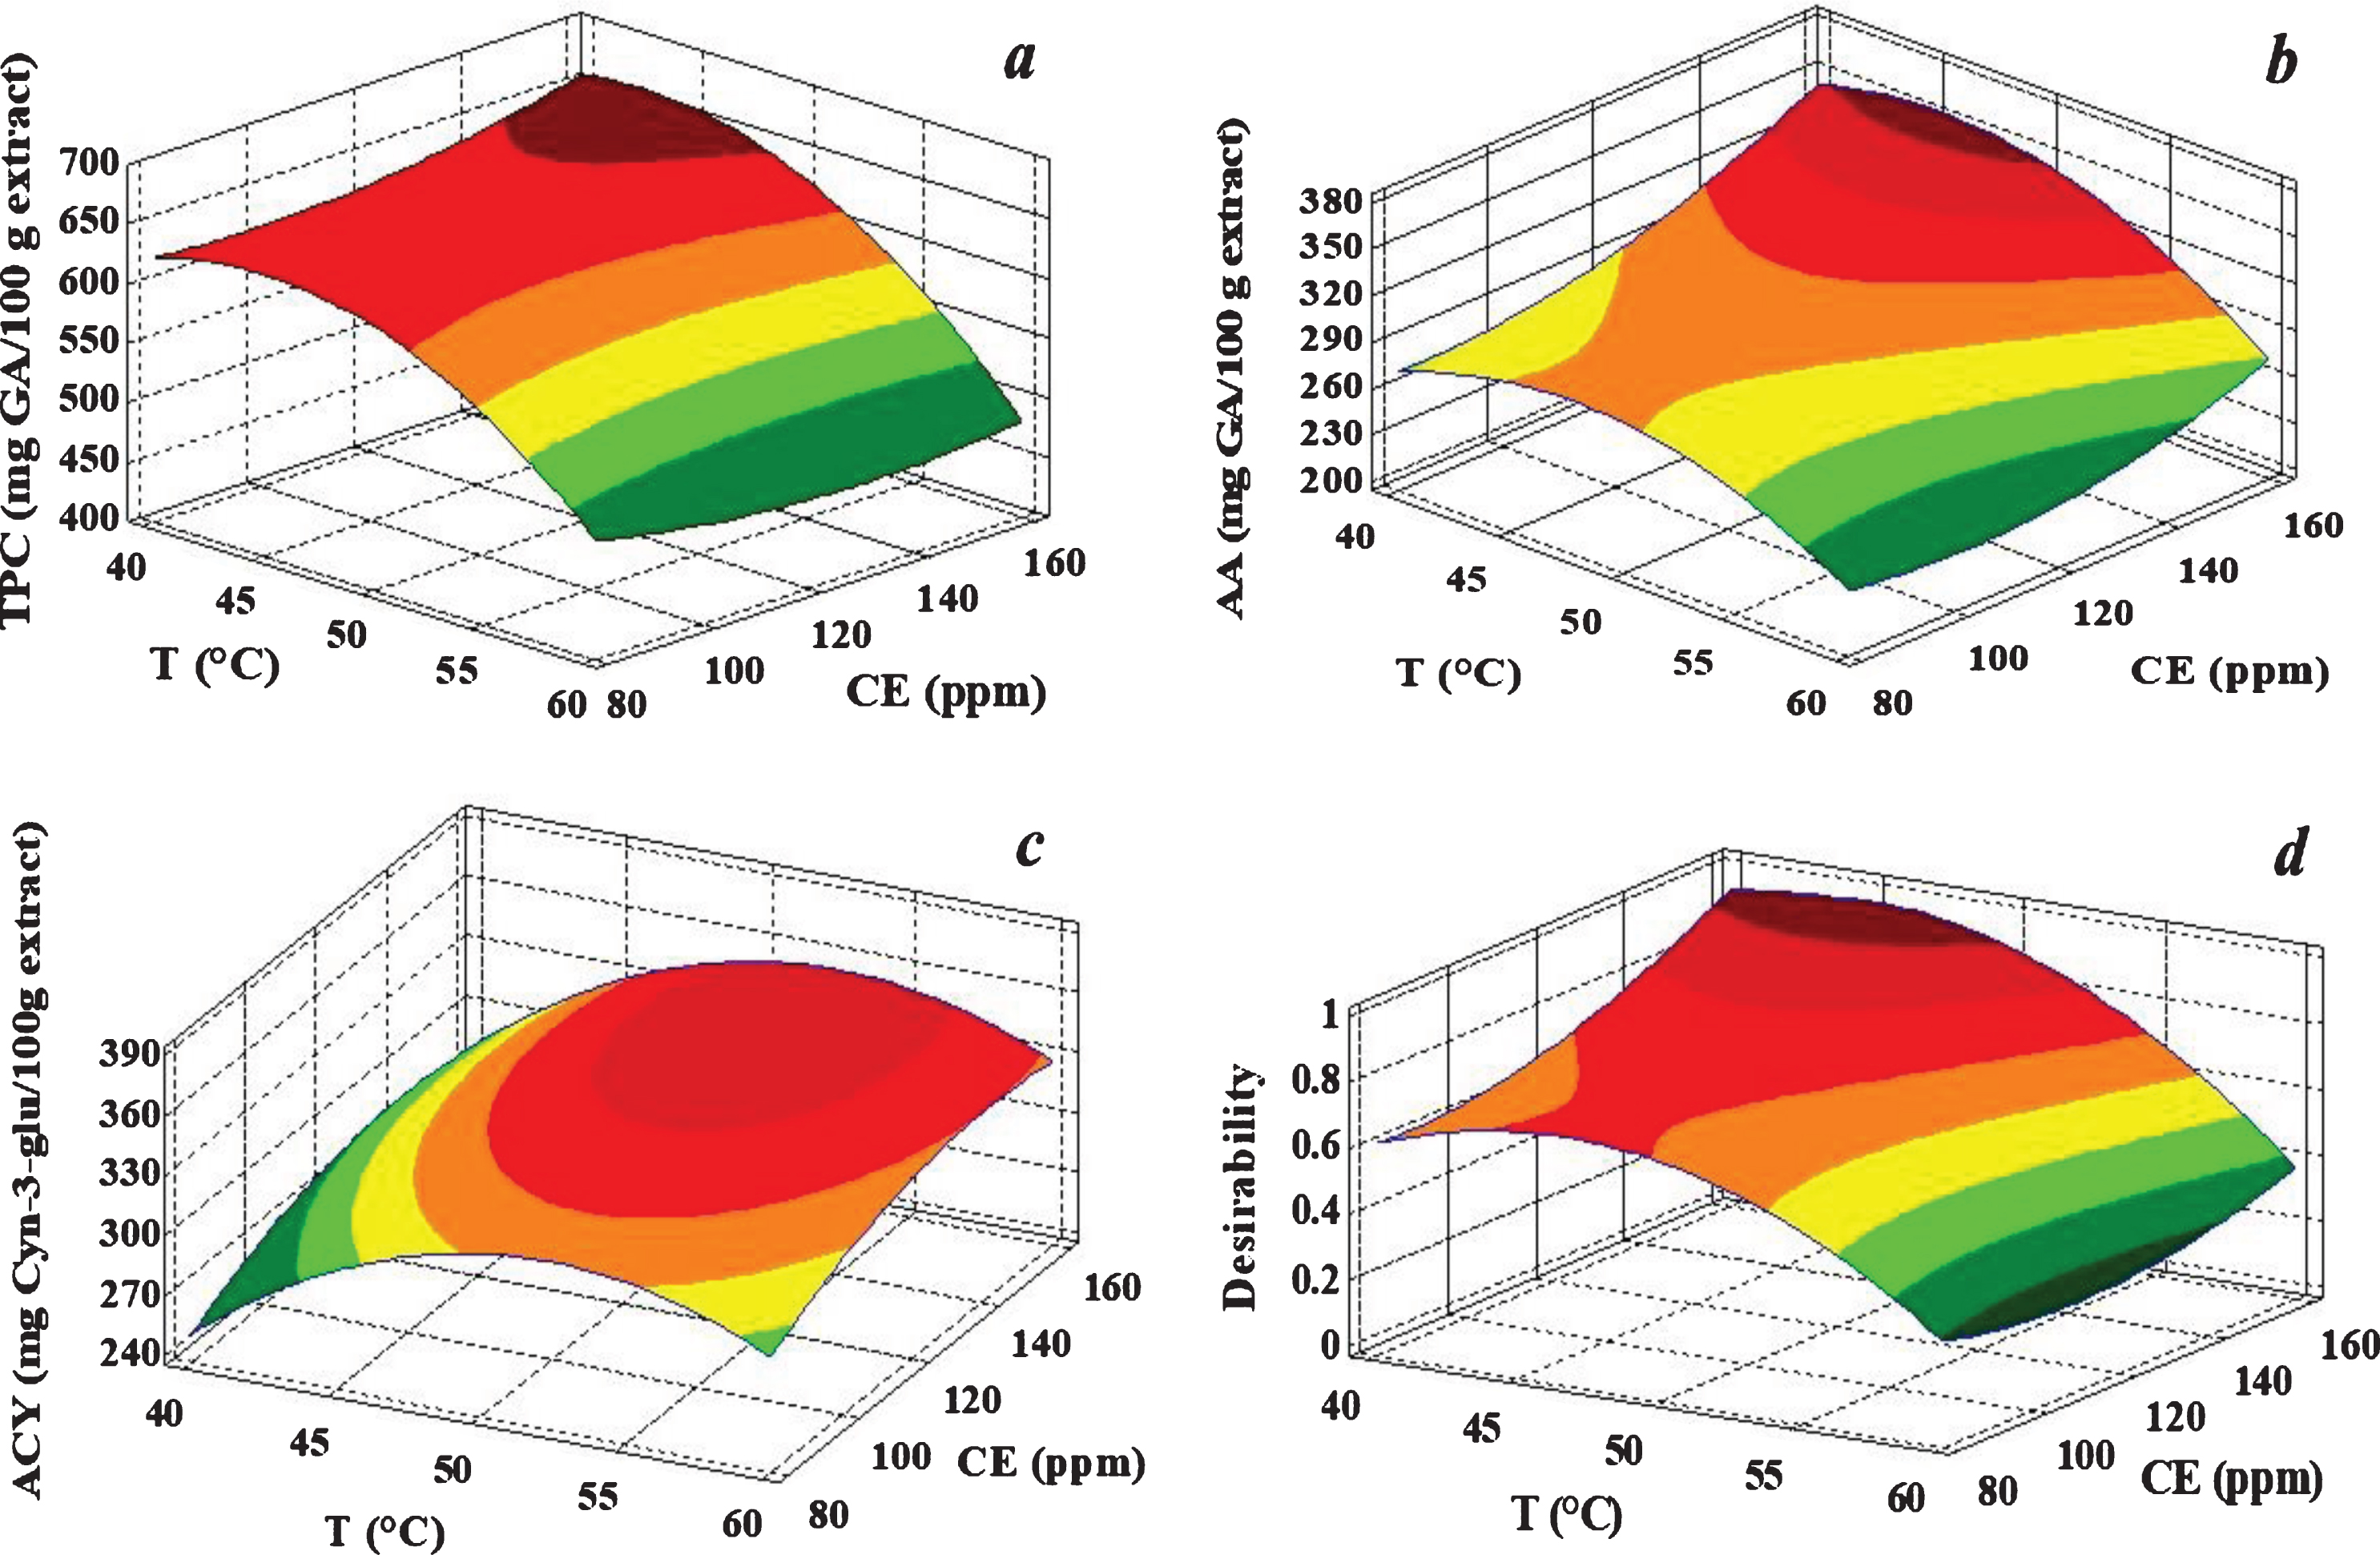
ANOVA results showed a significant effect of T factor (p < 0.05) on the three responses, being the interaction with CE also important (p < 0.05) for ACY. CE affected individually AA (p < 0.05) but had no effect on TPC. Figure 3 shows the surface plots for each response variable. A TPC decrease was observed when increasing temperature from 50°C to 60°C (Fig. 3a), probably due to polyphenol thermal degradation or enzyme activity reduction. Antiradical activity was affected by both T and CE factors but without significant interaction between them (Table 1). For a particular temperature, AA improved as the enzyme concentration increased in the sample, being the values significantly higher at low temperatures (Fig. 3b). At 60°C and 160 ppm of CE, AA decreased by 20% compared with the experiments performed at temperatures of 40 and 50°C, consistent with the observed TPC decrease at high temperatures. The highest antiradical activity (AA) was achieved at low temperature and high enzyme concentration (Fig. 3b). ACY response surface (Fig. 3c) presented a concave curvature, with maximum values at intermediate temperatures and high enzyme concentrations. The best condition for the pigment release was achieved at 50°C, with a clear effect of enzyme concentration, mainly when changing from 80 to 120 ppm.
Fig. 3
Response Surface plots for TPC (a), AA (b) and ACY (c) variables obtained from experimental design, and desirability function (d) after multiple response optimization.
According to these results, maceration temperatures higher than 50°C should not be used for a better retention of pigments, polyphenol compounds and antioxidant power. The results are in agreement with enzymatic extraction studies reported in bibliography, such as those of Swer [30] when optimizing anthocyanin extraction from Sohiong (Prunus nepalensis), in a temperature range of 35 – 50°C and 5 – 15% of cellulase concentration, and Landbo and Mayer [2] when using pectinolytic enzymes in blackcurrant at temperatures ranging from 50°C and 70°C. These authors also found that anthocyanin extraction yield was greater than polyphenol yield, attributing this finding to the presence of glycosylated anthocyanins mostly bounded to skin cell walls released by the use of higher enzyme concentrations.
Optimization was conducted using the desirability function to yield high bioactive compounds and AA values (Fig. 3d). The best experimental conditions obtained (D value = 0.96) were a temperature of 45.3°C and an enzyme concentration of 160 ppm, which would result in a TPC value of 656 mg gallic acid/100 g, an ACY value of 326 mg cyn-3-glu/100 g, and AA value of 353 mg gallic acid/100 g. The juice extraction yields (YE) obtained were similar and near a value of 60% in all cases.
EAE was again conducted using the optimal set of operating conditions, obtaining results consistent with the predicted values. When compared to an elderberry juice (J), the optimum extract (OE) exhibited similar values of acidity, pH, soluble solids, and color parameters (Table 4), but a significant improvement of TPC and ACY (43.7 and 42.0 %, respectively) was observed. When compared with other reported studies concerning elderberry extracts optimized by different extraction methods, the OE of the current work could be considered a better alternative for a bioactive-rich ingredient formulation. For instance, Dominguez et al. [31] after studying the effect of pH, ethanol proportion and temperature, produced an optimum alcoholic extract with TPC and ACY values 31 % and 80 % lower than OE, respectively.
Table 4
Physicochemical characterization of elderberry juice (J) and optimum extract (OE)
| OE | J | |
| Total soluble solids (g solids/100 g) | 11.5±0.4b | 9.5±0.2a |
| Acidity (g citric acid/100 g) | 0.65±0.01a | 0.64±0.02a |
| pH | 4.16±0.02b | 4.24±0.02a |
| Superficial color | ||
| L* | 13.8±0.3a | 14±2a |
| a* | 3.3±0.3b | 1.4±0.4a |
| b* | 0.8±0.4a | 0.4±0.3a |
| Cab | 3±1b | 1.5±0.5a |
| hab | 14±8a | 14±9a |
| TPC (mg gallic acid/100 g) | 502±13a | 341±19b |
| ACY (mg Cyn-3-glu/100 g) | 284±16a | 201±13b |
| AA (mg gallic acid/100 g) | 294±12a | 201±22b |
Different lowercase letters indicate significant differences (p < 0.05) between samples.
Moreover, prevalent individual phenolic compounds of elderberry fruit were also identified in a high proportion in the optimum extract (Table 3), showing the usefulness of enzymatic assisted extraction to take advantage of the fruit antioxidants compounds. These results are not in accordance with those reported by Kaack et al. [32] and Szalóki-Dorkó et al. [33] who observed that most investigated phenolic compounds after elderberry juice processing with a pectinolytic treatment were lower compared to the juices produced without the use of enzyme. However, these works did not include an optimization of the extraction conditions.
The bioactive content results could explain the antioxidant activity increase obtained in OE (294±12 mg gallic acid/100 g) compared to J (201±22 mg gallic acid/100 g).
Taking into account some other beverages considered as source of antioxidants, the contribution of a glass of elderberry extract would be far above the polyphenol supply of a glass of wine [34] (approx. 10 times higher) or a glass of blueberry juice [35] (approx. 3 times higher).
Elderberry plant is known for containing cyanogenic glycosides in seeds and unripe fruits, which are potentially harmful compounds if high doses are consumed [24]. In this work, fully ripe elderberry fruits were used. Moreover, a toxicity assay was performed on OE to guarantee a secure ingredient. The results obtained after exposing different concentrations of the extract to kidney epithelial cells (Vero cells) showed the absence of toxic effect (viability values near 100 %) over the concentration range studied (0-7000μg/ml).
3.3Elderberry powder: development and characterization
Different powders were formulated by freeze-drying of a feed prepared with the optimum extract and the addition of maltodextrin (MD) in different concentrations. This carrier is known to render good physical properties upon drying and also to preserve compounds of interest in different encapsulation techniques such as spray- or freeze-drying [36]. As expected, Tg values increased and water content decreased while increasing MD concentration (Fig. 4a). Given that the initial focus was to use as little MD as possible, the analysis of Fig. 4a leads to the conclusion that a formulation containing 10% carrier would be adequate to preserve physical properties of the powder at room temperature while reducing the effect of dilution of elderberry bioactive compounds in the powder. The powder obtained by using a feed containing OE and 10% MD showed water content (3.2±0.2 g H2O/100 g) and aw (0.28±0.02) values suitable for a dehydrated product, as well as a good solubility (90±1%). Additionally, the obtained Tg (43±1°C) is a favorable condition for maintaining the product stable and in glassy state at room temperature.
Fig. 4
Water content (blue line) and glass transition temperature (black line) values for maltodextrin formulation study (a) and elderberry freeze-dried powder sorption behavior (b).
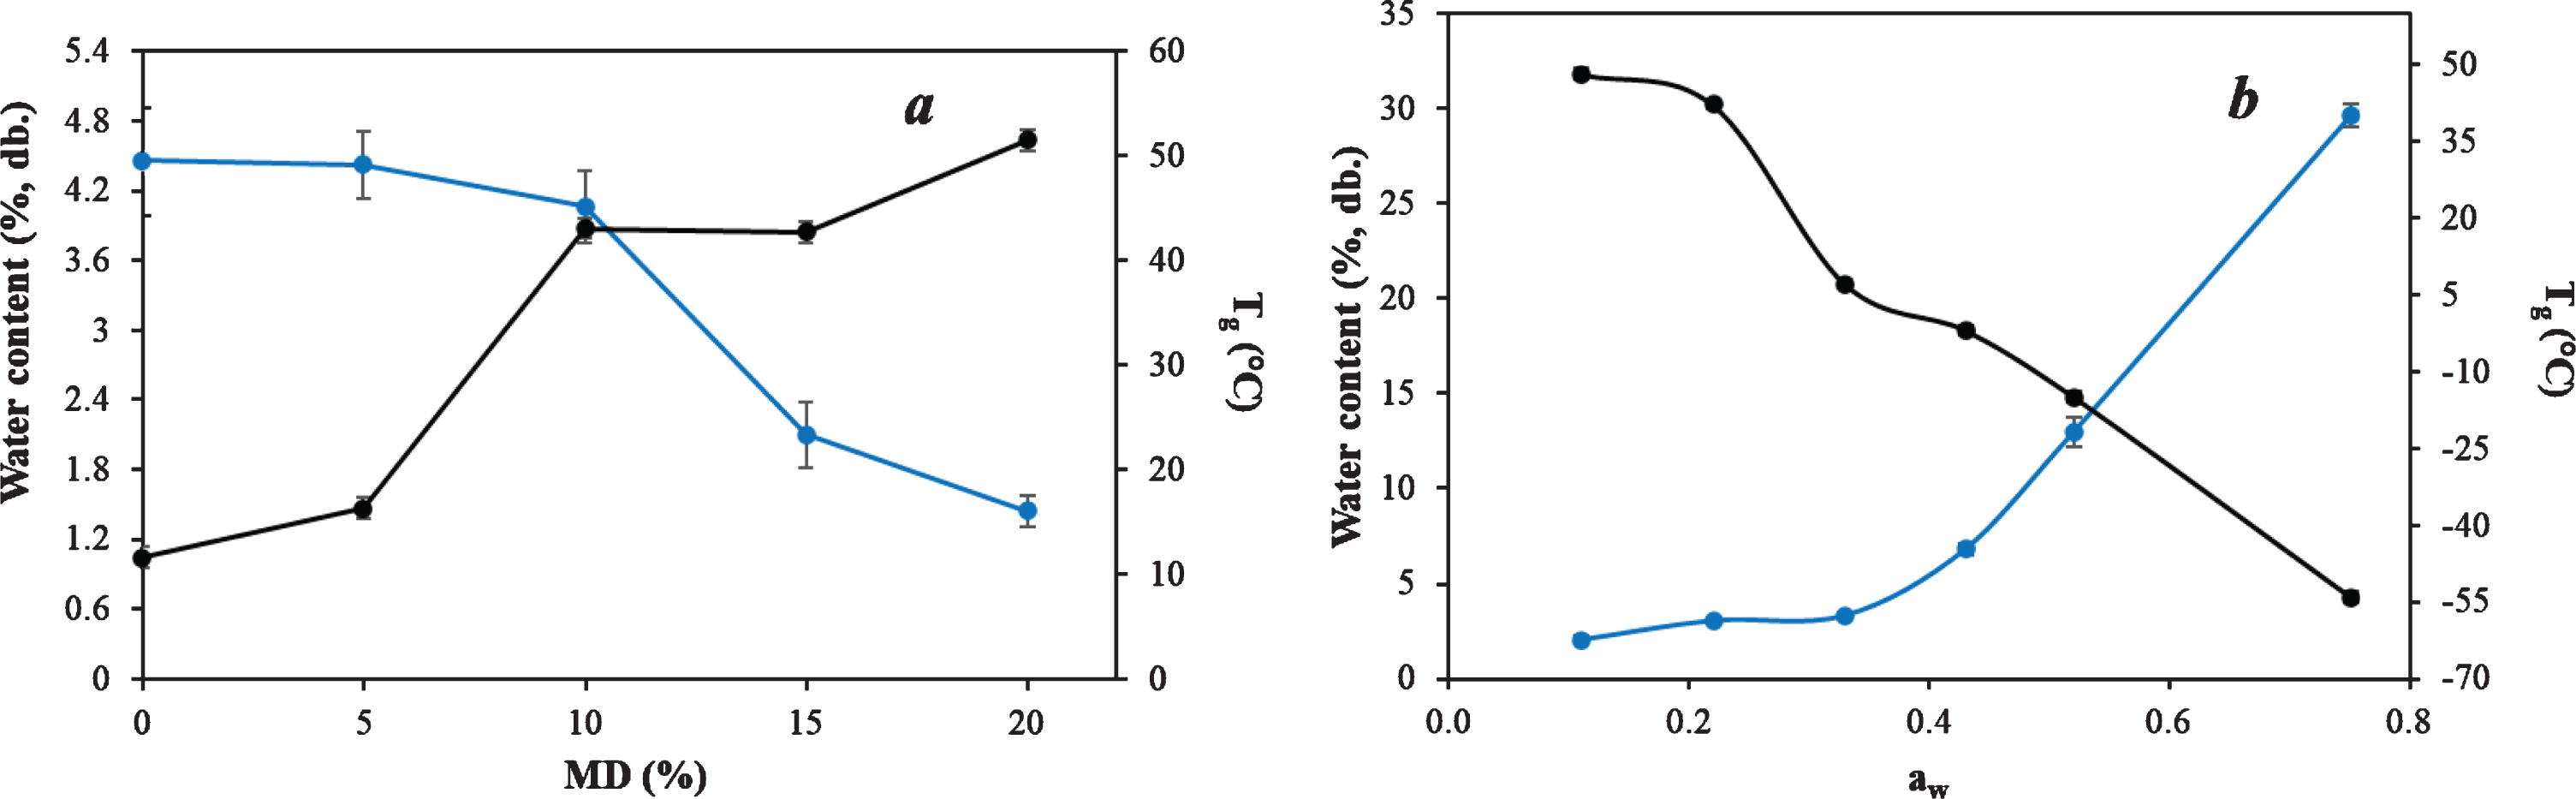
Water sorption behavior at 20°C and Tg evolution with water activity are shown in Fig. 4b. Tg decreased as water content increased, and the powder changed from glassy to supercooled state. Stickiness and caking could be visually detected in samples exposed to aw values≥0.43. According to these results, a good packaging against ambient humidity will be essential for ensuring powder physical stability.
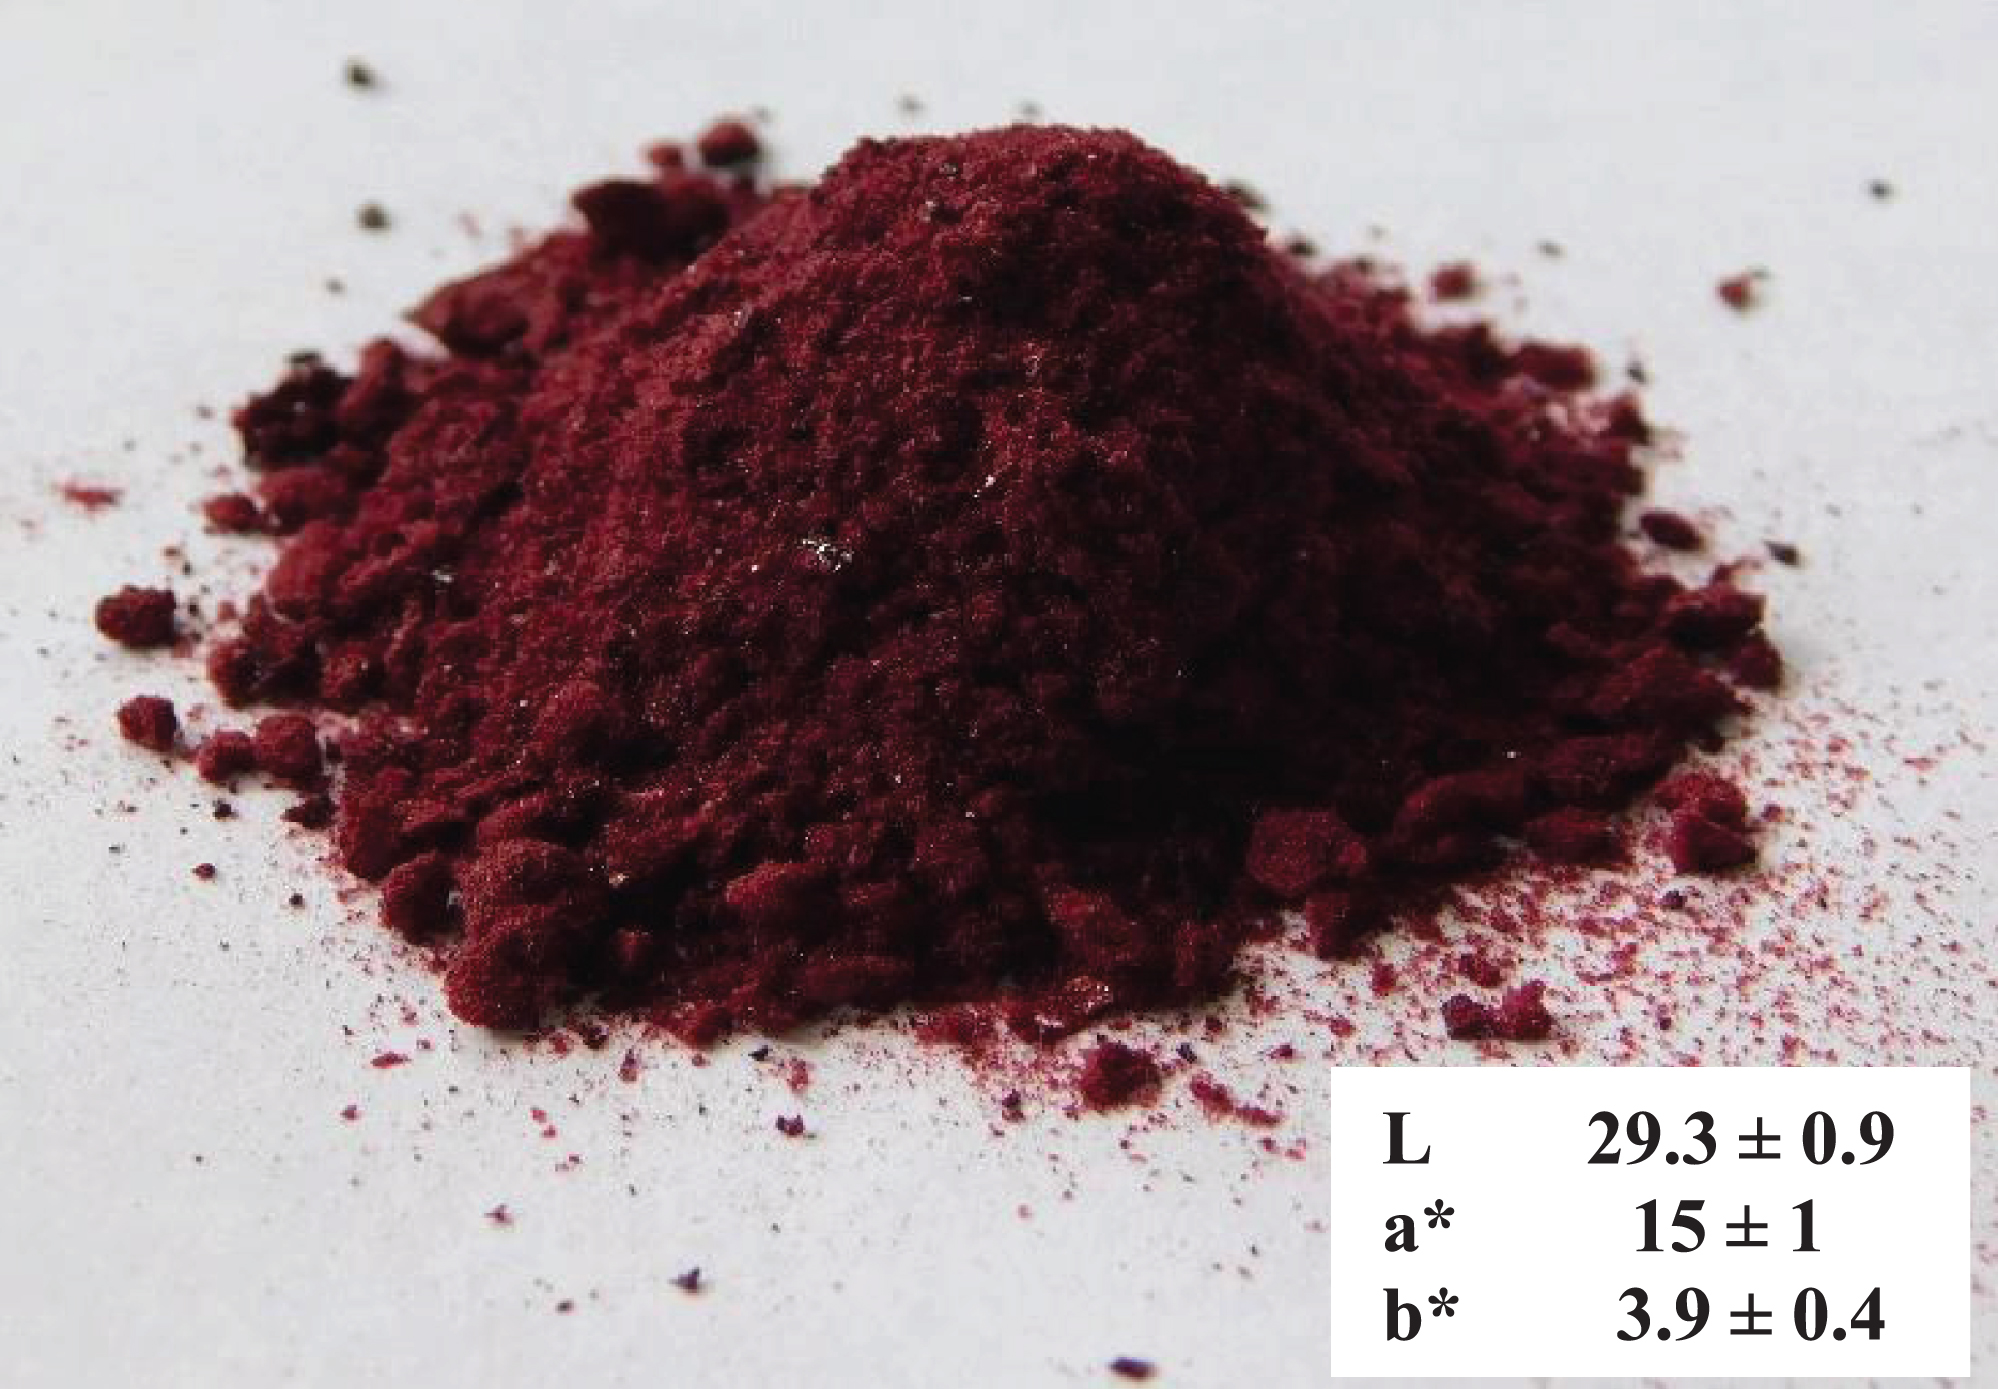
A reconstitution of the elderberry powder was performed until the water content of the original optimum extract was reached and significant values of antioxidant activity (AA = 262±57 mg gallic acid/100 g) and bioactive compound concentrations (TPC = 501±10 mg gallic acid/100 g, ACY = 265±21 mg cyn-3-glu/100 g) were also observed in the reconstituted powder. Moreover, individual phenolic compounds of the optimum extract were identified in the freeze-dried powder (Table 3). When comparing elderberry fruit, optimum extract, and powder, the proportions of the main phenolic groups (anthocyanins, flavan-3-ols, flavonols, and phenolic acids) remained without significant changes despite the different treatments applied throughout the processing steps (Fig. 5). In line with total and individual anthocyanin compounds results, the powder polymeric color (% PC = 8±1) was similar to that of OE (% PC = 6.0±0.3). Polymeric color is an indicator of polymerized pigments, including phenol-anthocyanin complexes and brown compounds [37]. These compounds do not seem to have formed upon freeze-drying. These results would indicate a high protection of monomeric anthocyanins during processing with the consequent color preservation. Fig. 6 shows that powder exhibited a crimson tone in accordance with the dark red tones of elderberries.
Fig. 5
Main phenolic groups (%) in samples produced after processing steps: elderberry fruit, OE, freeze-dried powder, and reconstituted powder. Phenolic acids (black), flavan-3-ols (dark gray), flavonols (light gray), anthocyanins (white).
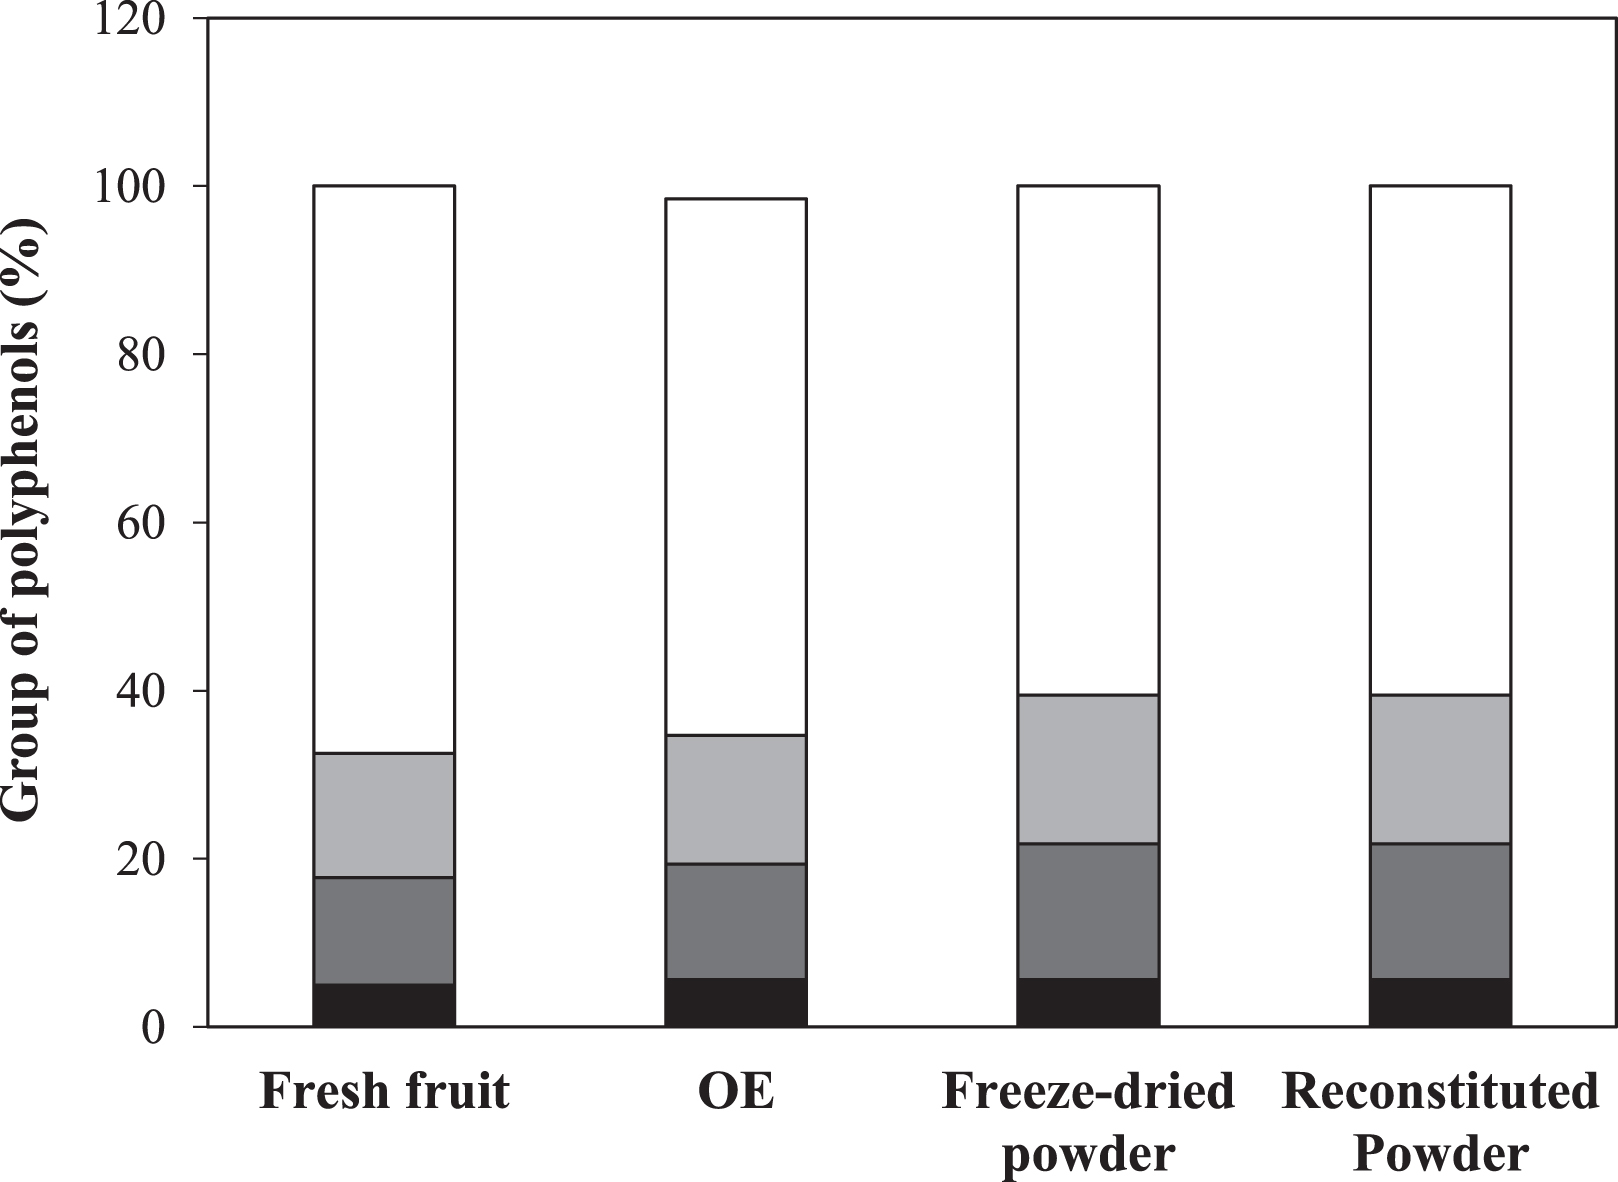
Fig. 6
Elderberry freeze-dried powder appearance and CIELab parameters.
The literature about elderberry powders is scarce. Gagneten et al. [5] showed that ultrasound-assisted extraction and further spray-drying with 20 % MD allowed obtaining powders with good physical properties but lower bioactive compounds content (TPC = 427 mg gallic acid/100 g and ACY = 223 mg cyn-3-glu/100 g). The optimized powder of this work was even richer in bioactive compounds (TPC = 2637±57 mg gallic acid/100 g and ACY = 1399±120 mg cyn-3-glu/100 g) than that reported by Busso Casati et al. [38] obtained by direct freeze-drying of elderberry pulp with 20% carriers (TPC = 1242 mg gallic acid/100 g and ACY = 178 mg cyn-3-glu/100 g).
3.4Bioaccesibility analysis upon in vitro gastrointestinal digestion
In order to evaluate the bioaccesibility of the encapsulated bioactive compounds, an in vitro gastrointestinal digestion (GID) study was performed on the developed powder ingredient. The soluble fraction obtained after digestion contains the compounds that resist all the GID stages and would be accessible to be absorbed by intestinal cells [12]. In this case, after GID analysis the sample presented TPC, AA and ACY values of 0.29±0.02 mg gallic acid/g, 0.21±0.02 mg gallic acid/g and 0.093±0.006 mg cyn-3-glucoside/g, respectively. Then, the bioaccessibility was 39% and 23% for TPC and ACY, respectively. Regarding antioxidant activity, a bioaccessibility higher than 50% was obtained. Several studies carried out on different berry fruits reported a decrease ranging between 50 and 80% of the anthocyanin and polyphenol content after intestinal digestion in comparison with the non-digested sample [39]. Olejnik [23] studied the digestion of elderberry freeze-dried pomace and reported a significant decrease in anthocyanins and polyphenols content, between stomach and small intestinal phases. Anthocyanins decrease could be mainly attributed to the alkaline conditions in the intestinal phase that could cause ring cleavage of most anthocyanins, which could also result in a loss of antioxidant activity [6]. However, the significant reduction of monomeric anthocyanin after digestion does not necessarily imply the complete loss or not absorption of these compounds, since it has been reported that about 20% could be absorbed during the gastric phase [40]. Despite the bioactive content decrease after digestion, the impact on the antioxidant activity was less severe, probably because of the release of compounds or generation of new molecules with antioxidant properties through the digestion process.
3.5Antioxidant activity after intestinal transport
The transepithelial transport assay was developed after in vitro digestion in order to evaluate the effective antioxidant activity given by the total antioxidant compounds that could be present in the bloodstream. The diluted intestinal fluid presented AA = 0.105 mg gallic acid/ml and after transport by the Caco-2 system, the basolateral side fluid showed AA = 0.047±0.001 mg gallic acid/ml. This result is very favorable since it means that almost 50% of the antioxidant compounds initially present in the digestive fluid of the elderberry juice could be recovered. Part of the antioxidant compounds could have been used by Caco-2 cells. Different studies on antioxidant compounds such as curcuma derivatives [18], proanthocyanidins [41], among others, indicated that the main transport mechanisms for this type of compounds would be passive diffusion or paracellular diffusion. It is likely that the antioxidant compounds transport from elderberry intestinal juice could occur through the same mechanisms.
Taking these results into account, together with those obtained after in vitro digestion, it can be observed that a quarter of the total antioxidant activity in reconstituted powder could reach the bloodstream. Although carried out using in vitro models, this type of study involves a closer approach to the real contribution of the antioxidant compounds that food can provide through the diet.
4Conclusion
An integral optimization of processing steps was successfully carried out for the design of a dry ingredient based on elderberry fruits. On one hand an enzyme-assisted extraction proposed as a first green-friendly step was effective for the fruit bioactive compounds release. From the optimum extract, adequately formulated in order to reduce carrier concentration, it was possible to obtain by freeze-drying a powder with high retention of elderberry bioactive compounds and high antioxidant activity while preserving the initial fruit color and other physical properties relevant in terms of storage stability. These results suggest that, adequately packaged, the powder could be used as stable and attractive ingredient applied as natural colorant, functional ingredient or nutraceutical.
The simulation of the gastrointestinal digestion process on an elderberry juice prepared from the powder enabled the analysis of the bioaccesible fraction of TPC, AA, and ACY. The AA bioaccesible fraction recovery upon the digestion process was relatively high (50%). Additionally, the transport of the intestinal fluid using an in vitro model constituted by a Caco-2 monolayer showed a relevant recovery of antioxidant activity, which could be available in the bloodstream. It is interesting to note that the antioxidant compounds that are not recovered after transepithelial intestinal transport would have the potential of exerting a beneficial effect in the gut, protecting the microbiota and the intestinal cells from oxidative stress.
Conflict of interest
The authors have no conflict of interest to report.
Acknowledgments
The authors acknowledge the financial support from National University of Comahue, University of Buenos Aires, the National Council for Scientific and Technical Research and the National Agency for the Promotion of Scientific and Technical Research of Argentina.
References
[1] | Mlynarczyk K , Walkowiak-Tomczak D , Lysiak GP . Bioactive properties of Sambucus nigra L.as a functional ingredient for food and pharmaceutical industry.. J of Funct Foods. (2018) ;40: :377–90. doi:10.1016/j.j.2017.11.025 |
[2] | Landbo A , Meyer A . Effects of different enzymatic maceration treatments on enhancement of anthocyanins and other phenolics in black currant juice. Innov Food Sci and Emerg Technol. (2004) ;5: :503–13. doi:10.1016/j.ifset.2004.08.003 |
[3] | Vagiri M , Jensen M . Influence of juice processing factors on quality of black chokeberry pomace as future resource for color extraction. Food Chem. (2017) ;217: :409–17. doi:10.1016/j.foodchem.2016.08.121 |
[4] | Garrido Makinistian F , Sette P , Gallo L , Bucalá V , Salvatori D . Optimized aqueous extracts of maqui (Aristotelia chilensis) suitable for powder production. J Food Sci Technol. (2019) ;56: (7):3553–3560. doi:10.1007/s13197-019-03840-4 |
[5] | Gagneten M , Corfield R , Gomez Mattson M , Sozzi A , Leiva G , Salvatori D , et al. Spray-dried powders from berries extracts obtained upon several processing steps to improve the bioactive components content. Powder Technol. (2019) ;342: :1008–15. doi:10.1016/j.powtec.2018.09.048 |
[6] | Fredes C , Osorio MJ , Parada J , Robert P . Stability and bioaccessibility of anthocyanins from maqui (Aristotelia chilensis Stuntz) juice microparticles. LWT-Food Sci and Technol. (2018) ;91: :549–56. doi:10.1016/j.lwt.2018.01.090 |
[7] | Alfaro S , Mutis A , Quiroz A , Seguel I , Scheuermann E . Effects of drying techniques on Murtilla fruit polyphenols and antioxidant activity. J of Food Res. (2014) ;3: (5):73–82. doi:10.5539/jfr.v3n5p73 |
[8] | Qinqin C , Li Z , Bi J , Zhou L , Yi J , Wu X . Effect of hybrid drying methods on physicochemical, nutritional and antioxidant properties of dried black mulberry. LWT - Food Sci and Technol. (2017) ;80: :178–84. doi:10.1016/j.lwt.2017.02.017 |
[9] | Cheng A , Xie H , Qi Y , Liu C , Guo X , Sun J , et al. Effects of storage time and temperature on phenolic content and qualitative characteristics of freeze-dried and spray dried bayberry powder. LWT - Food Sci and Technol. (2017) ;78: :235–40. doi:10.1016/j.lwt.2016.12.027 |
[10] | Sette P , Franceschinis L , Schebor C , Salvatori D . Fruit snacks from raspberries: influence of drying parameters on color degradation and bioactive potential. Int. J of Food Sci and Technol. (2017) ;52: :313–28. doi:10.1111/ijfs.13283 |
[11] | Romero-González J , Shun Ah-Hen K , Lemu-Mondaca R , Muñoz-Fariña O . Total phenolics, anthocyanin profile and antioxidant activity of maqui, Aristotelia chilensis (Mol.) Stuntz, berries extract in freeze-dried polysaccharides microcapsules. Food Chem. (2019) ;313: :126115. doi: https://doi.org/10.1016/j.foodchem.2019.126115 |
[12] | Minekus M , Alminger M , Alvito P , Balance S , Bohn T , Bourlieu C , et al. A standardised static in vitro digestion method suitable for food - an international consensus. Food & Function. (2014) ;5: :1113–24. doi:10.1039/C3FO60702J |
[13] | Ochoa JJ , Moncunill ELN , Puntieri JG , Güenuleo BS , Stefe SE , Cardozo ML , Nerazi Barriga F , Martinez EE , Torrego S , Naon S . Local knowledge and edible fruits of native plants in the Andean region of the Parallel 42. 445 (Patagonia, Argentina). Ethnoscientia. 2019;4. doi:10.22276/ethnoscientia.v4i1.247 |
[14] | Sette P , Fernandez A , Soria J , Rodriguez R , Salvatori D , Mazza G . Integral valorization of fruit waste from wine and cider industries. J Clean Prod. (2020) ;242: :118486. doi: https://doi.org/10.1016/j.jclepro.2019.118486 |
[15] | Greenspan L . Humidity fixed points of binary saturated aqueous solutions. J. Res. Natl. Bur. Stand. Section A. Physics and Chemistry. (1977) ;81: :89–95. doi:10.6028/jres.081A.011 |
[16] | Bunzel M , Ralph J , Marita J , Steinhart H . Identification of 4-O-5’-coupled diferulic acid from insoluble cereal fiber. J of Agric Food Chem. (2000) ;48: :3166–9. doi:10.1021/jf000125n |
[17] | Soria EA , Goleniowski ME , Cantero JJ , Bongiovanni GA . Antioxidant activity of different extracts of Argentinian medicinal plants against arsenic-induced toxicity in renal cells. Hum Exp Toxicol. (2008) ;27: :341–6. doi:10.1177/0960327108092192 |
[18] | Zeng Z , Shen ZL , Zhai S , Xu JL , Liang H , Shen Q , et al. Transport of curcumin derivatives in Caco-2 cell monolayers. Eur J of Pharmaceutics and Biopharmaceutics. (2017) ;117: (17):123–11. doi:10.1016/j.ejpb.2017.04.004 |
[19] | Shima M , Tanaka M , Kimura Y , Adachi S , Matsuno R . Enhancement in transport of a hydrophilic marker through intestinal epithelial cell (Caco-2) monolayer by W/O/W multiple emulsion containing C8TG. Food Hydrocoll. (2005) ;19: (2):321–8. doi:10.1016/j.foodhyd.2004.07.004 |
[20] | Vulic JJ , Vračar LO , Šumić ZM . Chemical characteristics of cultivated elderberry fruit. Acta Periodica Technol. (2008) ;39: (6):85–90. doi:10.2298/APT0839085V |
[21] | Perkins-Veazie P , Thomas AL , Byers PL , Finn CE . Fruit composition of elderberry (Sambucus spp.) genotypes grown in Oregon and Missouri, USA. Acta Horticulturae. (2015) ;(1061):219–24. doi:10.17660/actahortic.2015.1061.24 |
[22] | Veberic R , Slatnar A , Bizjak J , Stampar F , Mikulic-Petkovsek M . Anthocyanin composition of different wild and cultivated berry species. LWT - Food Sci Technol. (2015) ;60: :509–17. doi:10.1016/j.lwt.2014.08.033 |
[23] | Olejnik A , Olkowicz M , Kowalska K , Rychlik J , Dembczyński R , Myszka K . et al. Gastrointestinal digested Sambucus nigra L. fruit extract protects in vitro cultured human colon cells against oxidative stress. Food Chem. (2016) ;197: :648–657. doi:10.1016/j.foodchem.2015.11.017 |
[24] | Senica M , Stampar F , Veberic R , Mikulic-Petkovsek M . Processed elderberry (Sambucus nigra L.) products: A beneficial or harmful food alternative? LWT - Food Sci Technol. (2016) ;72: :182–8. doi:10.1016/j.lwt.2016.04.056 |
[25] | Veberic R , Jakopic J , Stampar F , Schmitzer V . European elderberry (Sambucus nigra L.) rich in sugars, organic acids, anthocyanins and selected polyphenols. Food Chem. (2009) ;114: :511–5. doi:10.1016/j.foodchem.2008.09.080 |
[26] | Neves D , Valentão P , Bernardo J , Oliveira MC , Ferreira J , Pereira DM , et al. A new insight on elderberry anthocyanins bioactivity: Modulation of mitochondrial redox chain functionality and cell redox state. J Funct Foods. (2019) ;56: :145–55. doi: https://doi.org/10.1016/j.jff.2019.03.019 |
[27] | Santos-Buelga C , García-Viguera C , Tomás-Barberán F . On-Line identification of flavonoids by HPLC coupled to Diode Array Detection. In: Gary Williamson, editor. Methods in Polyphenol Analysis. Cambridge: The Royal Society of Chemistry; 2003, chp. 5. |
[28] | Duymus HG , Göger F , Hüsnü Can Başer K . In vitro antioxidant properties and anthocyanin compositions of elderberry extracts. Food Chem. (2014) ;155: :112–9. doi:10.1016/j.foodchem.2014.01.028 |
[29] | Macheix JJ , Fleuriet A , Billot J . Fruit phenolics. 1st edn. Boca Raton:CRC Press; (1990) . |
[30] | Swer TL , Mukhim C , Bashir K , Chauhan K . Optimization of enzyme aided extraction of anthocyanins from Prunus nepalensis L. Food Sci and Technol. (2018) ;91: :382–90. doi:10.1016/j.lwt.2018.01.043 |
[31] | Dominguez R , Zhang L , Rocchetti G , Lucini L , Pateiro M , Munekata PES , Lorenzo JM . Elderberry (Sambucus nigra L.) as potential source of antioxidants. Characterization, optimization of extraction parametres and bioactive properties. Food Chem. (2020) ;330: :127266. doi: https://doi.org/10.1016/j.foodchem.2020.127266 |
[32] | Kaack K , Fretté XC , Christensen LP , Landbo AK , Meyer AS . Selection of elderberry (Sambucus nigra L.) genotypes best suited for the preparation of juice. Eur Food Res Technol. (2008) ;226: :843–55. doi:10.1007/s00217-007-0605-0 |
[33] | Szalóki-Drokó L , Stéger-Maté M , Abrankó L . Effects of fruit juice concentrate production on individual anthocyanin species in elderberry. Int J Food Sci and Technol. (2016) ;51: :641–8. doi:10.1111/ijfs.13031 |
[34] | Scalbert A , Manach C , Morand C , Rémésy C , Jiménez L . Dietary polyphenols and the prevention of diseases. Crit Rev in Food Sci and Nutr. (2005) ;45: (4):287–306. doi:10.1080/1040869059096 |
[35] | Granato D , Karnopp AR , M van Ruth S . Characterization and comparison of phenolic composition, antioxidant capacity and instrumental taste profile of juices from different botanical origins. J of the Sci of Food and Agric. (2015) ;95: :1997–2006. doi:10.1002/jsfa.6910 |
[36] | Fang Z , Bhandari B . Encapsulation of polyphenols - a review. Trends in Food Sci Technol. (2010) ;21: :510–23. doi:10.1016/j.tifs.2010.08.003 |
[37] | Giusti MM , Wrolstad RE . Anthocyanins. Characterization andmeasurement of anthocyanins by UV-visible spectroscopy. In Wrolstad R. E., editor. Current Protocols in Food Analytical Chemistry. New York: John Wiley & Sons; 2001.Unit F1.2.1-1. |
[38] | Busso Casati C , Baeza R , Virginia S . Physicochemical properties and bioactive compounds content in encapsulated freeze-dried powders obtained from blueberry, elderberry, blackcurrant and maqui berry. J of Berry Res. (2019) ;9: (3):431–47. doi:10.3233/JBR-190409 |
[39] | Thomas-Valdés S , Theoduloz C , Jiménez-Aspee F , Burgos-Edwards A , Schmeda-Hirschmann G . Changes in polyphenol composition and bioactivity of the native Chilean white strawberry (Fragaria chiloensis spp. chiloensis f. chiloensis) after in vitro gastrointestinal digestion. Food Res Int. (2018) ;105: :10–8. doi:10.1016/j.foodres.2017.10.074 |
[40] | Fernandes I , Faria A , Calhau C , de Freitas V , Mateus N . Bioavailability of anthocyanins and derivatives. J of Funct Foods. (2014) ;7: :54–66. doi:10.1016/j.jff.2013.05.010 |
[41] | Deprez S , Mila S , Huneau JF , Tome D , Scalbert A . Transport of proanthocyanidin dimer, trimer, and polymer across monolayers of human intestinal epithelial Caco-2 cells. Forum Original Research Communication. Antioxid & Redox Signal. (2001) ;3: (6):957–67. doi:10.1089/152308601317203503 |


