
Physiological response and susceptibility of strawberry cultivars to the charcoal rot caused by Macrophomina phaseolina under drought stress conditions
Abstract
BACKGROUND:
Charcoal rot of strawberry (Macrophomina phaseolina) is an emerging disease difficult to manage, a desirable alternative is the use of resistant cultivars. However, little is known regarding the reaction of cultivars to the pathogen under water stress conditions.
OBJECTIVE:
The aims of this work were to study the effect of water stress on the physiology of four strawberry cultivars during the infection, and to determine the relationship between water stress and cultivar susceptibility.
METHODS:
Healthy and inoculated plants of ‘Monterey’, ‘Albion’, ‘Camarosa’ and ‘Sabrina’ were maintained under no irrigation and full irrigation regimes, in greenhouse conditions. Stem water potential (SWP) and stomatal conductance (gs) were evaluated. The disease severity was recorded weekly for seven weeks.
RESULTS:
The disease detrimentally affected the water relations in ‘Sabrina’, ‘Albion’ and ‘Monterey’. A significant correlation was detected between the evaluated parameters and the disease severity. The disease severity increases in plants with no irrigation, regardless of cultivar.
CONCLUSIONS:
Our results show that the infection caused by M. phaseolina increases the negative effects of water stress, depending on the genotype, and that the cultivars that were able to maintain more stable water relations respond better to the disease.
1Introduction
Macrophomina phaseolina (Tassi) Goid. is a soilborne fungal pathogen that causes the disease known as charcoal rot in several hosts, including crops such as soybean, sorghum, corn, cotton [1], jute [2], sunflower [3], sesame [4], common bean [5] and strawberry [6].
The emergence of charcoal rot on strawberry has been devastating in the main crop-producing regions and has been reported in several countries in the past decades [6–13].
The main symptoms of the disease are foliage wilt and growth restriction. Affected plants have necrotic lesions with orange-brown discolorations and cracks in the crown tissue [9, 13, 14]. The disease often occurs in the summer during harvest season, coinciding with periods of high temperatures and water stress. The main source of inoculum has been determined to be microsclerotia that remain in the soil from one harvesting season to the next and are able to survive extreme drought and high-temperature conditions for long durations [15–18].
Several diseases whose severity is affected by drought have been described. Together, these biotic and abiotic stresses are seen as having a high impact because the combination of stresses strongly affects crop productivity [19]. In sorghum, soybean, common bean and moth bean, drought is known to be a predisposing factor for the development of the disease caused by M. phaseolina because drought promotes root infection, increasing the disease incidence and severity [17, 20–23]. In sorghum and common bean, susceptibility to the disease increases under drought conditions, which are associated with a lower capacity of the plants to manage their water balance, and in common bean plants infected with the pathogen also present a decrease in stomatal conductance (gs) [23, 24]. In sorghum, a significant decrease in the stem (xylem) water potential (SWP) of diseased plants has also been observed [25].
Strawberry cultivation is constantly increasing around the world; thanks to the varietal innovation, there are a constant release of new cultivars with the ultimate aim to expand the crop to different environments and growing systems [26]. The use of resistant cultivars is a desirable option for the integrated management of charcoal rot of the strawberry, and progress has been made in recent years regarding the characterization of various genotypes in terms of their response to pathogen infection [14, 27, 28]. However, little information is available on the relationship between the infection caused by M. phaseolina and water stress, including the effect of this stress on the plant response to the disease. In this study, we describe the effect of water stress on the physiology of the ‘Albion’, ‘Monterey’, ‘Camarosa’ and ‘Sabrina’ cultivars during the early stages of a M. phaseolina infection as well as the relationship between water stress and the disease susceptibility of these cultivars.
2Methodology
2.1Plant material
Frigo plants of the cultivars ‘Monterey’, ‘Albion’, ‘Camarosa’ and ‘Sabrina’ were obtained from commercial nurseries in Chile. Each of 48 plants per cultivar was transplanted into a separate 1–L pot containing 2/3 peat and 1/3 coconut fiber. The plants were fertilized with 1 g of slow-release fertilizer and well irrigated by watering every two days to saturation under greenhouse conditions before the treatments were applied.
2.2Inoculum preparation
The Mp21.A isolate of M. phaseolina was used. This isolate was previously evaluated for pathogenicity and molecularly identified utilizing the species-specific primers MpKFI and MpKRI (29). The inoculum consisted of infected oat seeds. To prepare the inoculum, oat seeds held in 5–kg bags were twice sterilized for 60 minutes. Then, the bags were inoculated with mycelium from a pure culture and kept in dark conditions at 30±2°C for two months.
2.3Establishment of the trials
Six weeks after transplanting, one half of the plants of each cultivar were infected with 9 g of inoculated oats added to and carefully mixed with the substrate; the other half received the same amount of uninoculated oat seed, which was similarly incorporated into the substrate. One week after inoculation, two levels of irrigation were applied. Half of the inoculated plants and half of the uninoculated plants were submitted to seven days of water stress, which consisted of absolute water restriction, while the other half was irrigated to compensate for 100% of the evapotranspiration, estimated by the water balance and gravimetric water content. After the drought stress period, the plants were maintained with a normal irrigation regimen for five weeks. The treatments included the four cultivars, two inoculum levels and two irrigation regimes, with three replicates per treatment; thus, the experimental design corresponded to a completely randomized experiment conducted as a 4×2×2 factorial with three replications, and the experimental unit corresponded to four strawberry plants.
2.4Drought stress evaluations
Through the experimental period, the air temperature (T°, °C), air relative humidity (RH%) and vapor pressure deficit (VPD, KPa) were continuously monitored with a data logger (H4011206, Keytag®).
The substrate moisture content (SMC) was determined three hours after the irrigation of control plants by inserting a capacitance probe (FDR Sensor GS–1® Decagon device) in the root zone at the middle of each pot height. Volumetric water content was estimated by using an obtained equation developed after associating FDR water content to the actual volumetric water content of the substrate. A regression curve was performed after saturating the susbtrate and taking samples for 4 days. Volumetric water content was calculated after measuring water content with the gravimetric method, by using the formula: ω= (wet soil weigh-dry soil weigh)/dry soil weigh, where ω: gravimetric water content. Then, volumetric water content (θ) was calculated by multiplying ω by de bulk density of the substrate (0.078 g/cm3). The correlation curve gave an association equation of Y = 0.9477x + 15.18 with R2 of 0.883 and a p value < 0.0001.
Water relations (SWP, gs) and photosynthesis measurements (SPAD value, Fv/Fm) were taken on three occasions: the first day of water stress (one-week post-inoculation), after seven days of water stress (two weeks post-inoculation) and after seven days of recovery (three weeks post-inoculation). The evaluations were performed at noon during a time of relatively high crop water demand (between 11:00 and 15:00 hours).
SWP was measured using the technique described by [30] with a pressure chamber [31]; gs (mmol m–2 s–1) was measured using a portable porometer (SC1 porometer® Decagon device). Both SWP and gs were measured in completely expanded trifoliate leaves located at the central portion of the plant. At the end of the drought stress period, stomatal impressions were made in the same leaf where gs was determined, with silicone (Oranwash L® Zhermack) applied to a 2–cm2 area of the leaf abaxial surface [32]. The stomatal impressions were observed with an optical microscope to determine the stomatal density and the proportion of open stomata, which was related to the gs value. The reduction in the chlorophyll content was evaluated using a chlorophyll meter (SPAD 502®, Minolta). The variable to maximal chlorophyll fluorescence ratio (Fv/Fm) was determined with a portable fluorometer (Pocket PEA®, Hansatech Instruments).
2.5Disease assessment
Disease severity was estimated according to the symptoms on the aerial part of the infected plants and the level of damage observed in the crown. The symptomatology of the aerial part was monitored weekly for seven weeks after inoculation and was scored based on the severity of symptoms on a scale from 0 to 5, as described by Fang et al. [33]. The area under the disease progress curve (AUDPC) was calculated. The severity of crown tissue damage was assessed at the end of the trial by making longitudinal cuts of the crowns. The degree of tissue necrosis was scored based on an arbitrary visual scale, with values from 0 to 5, where 0 corresponds to a completely healthy crown and 5 to a completely affected crown. To confirm that the symptoms observed were a consequence of the inoculated pathogen, a re-isolation of the pathogen on PDA medium was performed from crown and root tissues at the end of the experiment. The effect of M. phaseolina on plant development was also assessed by measuring the reduction in the total dry weight of plants. The plants were dried in an oven at 50°C for 72 hours and then weighed. The reduction in dry weight per treatment was estimated, based on the weight difference between each inoculated plant and the average value for the uninoculated control plants of that cultivar.
2.6Data analysis
All the evaluated parameters, except for the crown damage (not parametric data), were analyzed via a factorial analysis. For drought stress, the following factors were analyzed: cultivar (C), disease (D) and irrigation (I); for disease severity, the following factors were analyzed: cultivar (C) and irrigation (I). The means were separated by the LSD multiple-range test, with a 5% significance level. The Kruskal-Wallis test was used for the crown damage (showing nonparametric data). All the percentage data were transformed via Bliss analysis. The correlations coefficients between the disease severity (AUDPC, crown damage) and the physiological and growth characteristics were calculated. All the data collected in the study were analyzed using STATISTIX 8 [34].
3Results
The physiological response to water stress was evaluated in different plant cultivars inoculated and not inoculated with M. phaseolina. The susceptibility of plants to the disease under conditions of water stress was evaluated based on the severity of symptoms developed by the plants and the negative effects on their growth.
3.1Physiological response to water stress
The environmental parameters were evaluated daily between 11:00 and 15:00 hours during the period of water restriction and recovery. The average environmental temperature was 31.5±4°C, with an average RH of 41±6.6%, while the VPD value was approximately 3.8±0.9 kPa. The moisture content of the substrate was monitored in all the experimental units (Supplementary Figure 1); according to the calibration curve performed on the FDR values, the volumetric soil content in the fully irrigated plants remained close to 31.2±4 % and close to 15.3±0.9 % in the non-irrigated plants after seven days of water restriction (Supplementary Figure 2).
Regarding the plant water relations, both the gs and the SWP values were affected by water stress and disease (Table 1). The cultivars showed basal differences in gs from the onset of water stress. ‘Albion’ and ‘Monterey’ showed higher values than those of ‘Camarosa’ and ‘Sabrina’ cultivars (C, p < 0.0001). After seven days of water stress (two weeks post-inoculation), all four cultivars showed a decrease in gs (C×I, p < 0.0001), but ‘Sabrina’ and ‘Camarosa’ presented the most pronounced responses of the four cultivars. A combined effect of the cultivar and disease factors was also detected (C×D, p = 0.0309), with ‘Sabrina’ being the only cultivar for which the gs value of the inoculated plants decreased. After the recovery period, ‘Camarosa’ continued to show comparatively low gs values (C, p = 0.0006), with no significant effect of the other treatments (Table 1).
Table 1
Water relations in four strawberry cultivars inoculated and not inoculated with M. phaseolina, under no irrigation and full irrigation regimens
| Cultivar | Irrigation | Inoculation | SWP (Mpa) | gs (mmol mm2s–1) | ||||
| Onset of WS | 7 days after WS | Recuperation | Onset of WS | 7 days after WS | Recuperation | |||
| Albion’ | No irrigated | No Inoculated | –0.83 | –0.73 | –0.68 | 466.15 | 203.07 | 318.37 |
| Inoculated | –0.87 | –1.74 | –0.72 | 476.57 | 205.35 | 439.90 | ||
| Full irrigated | No Inoculated | –0.88 | –0.88 | –0.75 | 455.53 | 363.48 | 401.23 | |
| Inoculated | –0.90 | –0.98 | –0.67 | 500.30 | 406.63 | 395.23 | ||
| mean | –0.87 | –1.08 | –0.70 | 474.64 | 294.63 | 388.68 | ||
| Monterey’ | No irrigated | No Inoculated | –0.87 | –0.99 | –0.72 | 503.37 | 158.95 | 423.40 |
| Inoculated | –0.83 | –1.63 | –0.68 | 490.32 | 166.52 | 405.80 | ||
| Full irrigated | No Inoculated | –0.82 | –0.97 | –0.58 | 413.82 | 486.18 | 371.40 | |
| Inoculated | –0.85 | –1.35 | –0.65 | 443.03 | 511.48 | 374.27 | ||
| mean | –0.84 | –1.24 | –0.66 | 462.63 | 330.78 | 393.72 | ||
| Camarosa’ | No irrigated | No Inoculated | –0.91 | –1.97 | –0.73 | 394.80 | 105.98 | 283.07 |
| Inoculated | –0.87 | –1.87 | –1.03 | 415.23 | 107.57 | 278.08 | ||
| Full irrigated | No Inoculated | –0.85 | –1.00 | –0.72 | 417.93 | 296.55 | 293.45 | |
| Inoculated | –0.89 | –0.94 | –0.68 | 455.87 | 299.25 | 276.93 | ||
| mean | –0.88 | –1.45 | –0.79 | 420.96 | 202.34 | 282.88 | ||
| Sabrina’ | No irrigated | No Inoculated | –0.52 | –1.41 | –0.57 | 414.22 | 98.33 | 348.07 |
| Inoculated | –0.83 | –1.95 | –0.97 | 384.20 | 94.53 | 288.53 | ||
| Full irrigated | No Inoculated | –0.65 | –1.01 | –0.75 | 379.72 | 396.77 | 324.80 | |
| Inoculated | –0.72 | –1.54 | –0.67 | 419.40 | 306.47 | 325.20 | ||
| mean | –0.68 | –1.48 | –0.74 | 399.38 | 224.03 | 321.65 | ||
| Probability level of significance (ANOVA) | ||||||||
| Source of variation | ||||||||
| C | <0.0001 | 0.0003 | NS | <0.0001 | <0.0001 | 0.0006 | ||
| I | NS | <0.0001 | NS | NS | <0.0001 | NS | ||
| D | 0.0145 | <0.0001 | NS | NS | NS | NS | ||
| C×I | NS | 0.0007 | NS | NS | <0.0001 | NS | ||
| C×D | NS | 0.0033 | NS | NS | 0.0309 | NS | ||
| I×D | 0.0034 | 0.0376 | 0.0437 | NS | NS | NS | ||
| C×I×D | ° | ° | NS | 0.054 | NS | NS | NS | NS |
Data means are shown; n = 3.
Regarding the SWP data, before the irrigation treatment started, that is, one week after the inoculation, a significant interaction between the “cultivar” and “disease” factors was already detectable (C×D, p = 0.0034). For the ‘Sabrina’ cultivar, the inoculated plants showed lower SWP values than those shown by the healthy plants. No differences were observed for the other genotypes (Table 1).
Two weeks post-inoculation after seven days of water stress, the SWP value varied depending on the cultivar, irrigation treatment and disease presence (C×I×D, p = 0.0554). In ‘Albion’, infected plants under water stress showed lower SWP values (–1.74 MPa) compared with fully irrigated infected plants (–0.98 MPa), healthy plants without irrigation (–0.88 MPa) and fully irrigated healthy plants (–0.73 MPa). ‘Monterey’: diseased plants with and without water restriction were affected to a relatively great extent (–1.63 MPa and –1.35 MPa, respectively), whereas healthy plants showed relatively high SWP regardless of the irrigation treatment (–0.98 and –0.97, respectively). For the ‘Camarosa’ cultivar, a significant and large decrease in this parameter occurred under water stress conditions, with no significant difference detected between healthy and infected plants (–1.87 and –1.97 MPa, respectively); this large decrease in SWP did not occur in the well–irrigated and healthy plants (–0.99 and –0.94 MPa, respectively). For the ‘Sabrina’ cultivar, the infected and non-irrigated plants presented a very low SWP value (–1.95 MPa), unlike the fully irrigated infected plants (–1.54 MPa) and the healthy non-irrigated plants (–1.43 MPa), between which there was no difference. The fully irrigated healthy ‘Sabrina’ plants maintained high values for this parameter (–0.73 MPa) (Table 1).
After the recovery period at three weeks post-inoculation, the effect of the infection on SWP increased with water stress. Unlike in the first evaluations, no significant effect of the cultivar variable occurred, with the irrigation treatment and presence of disease being the factors with the greater influence on SWP (I×D, p = 0.0437). The inoculated plants that experienced a period of water restriction presented lower SWPs than those of the healthy plants under the same conditions and did not present signs of SWP recovery (Table 1).
The average stomatal density of the cultivars was determined for all the treatments at the end of the water restriction period, that is, after seven days without irrigation. The following values were obtained: ‘Albion’, 119.3±21 stomata/mm2; ‘Monterey’, 142.7±42 stomata/mm2; ‘Camarosa’, 101.2±30 stomata/mm2; and ‘Sabrina’, 109.7±30 stomata/mm2. This parameter did not present a significant correlation with gs or SWP (data not shown).
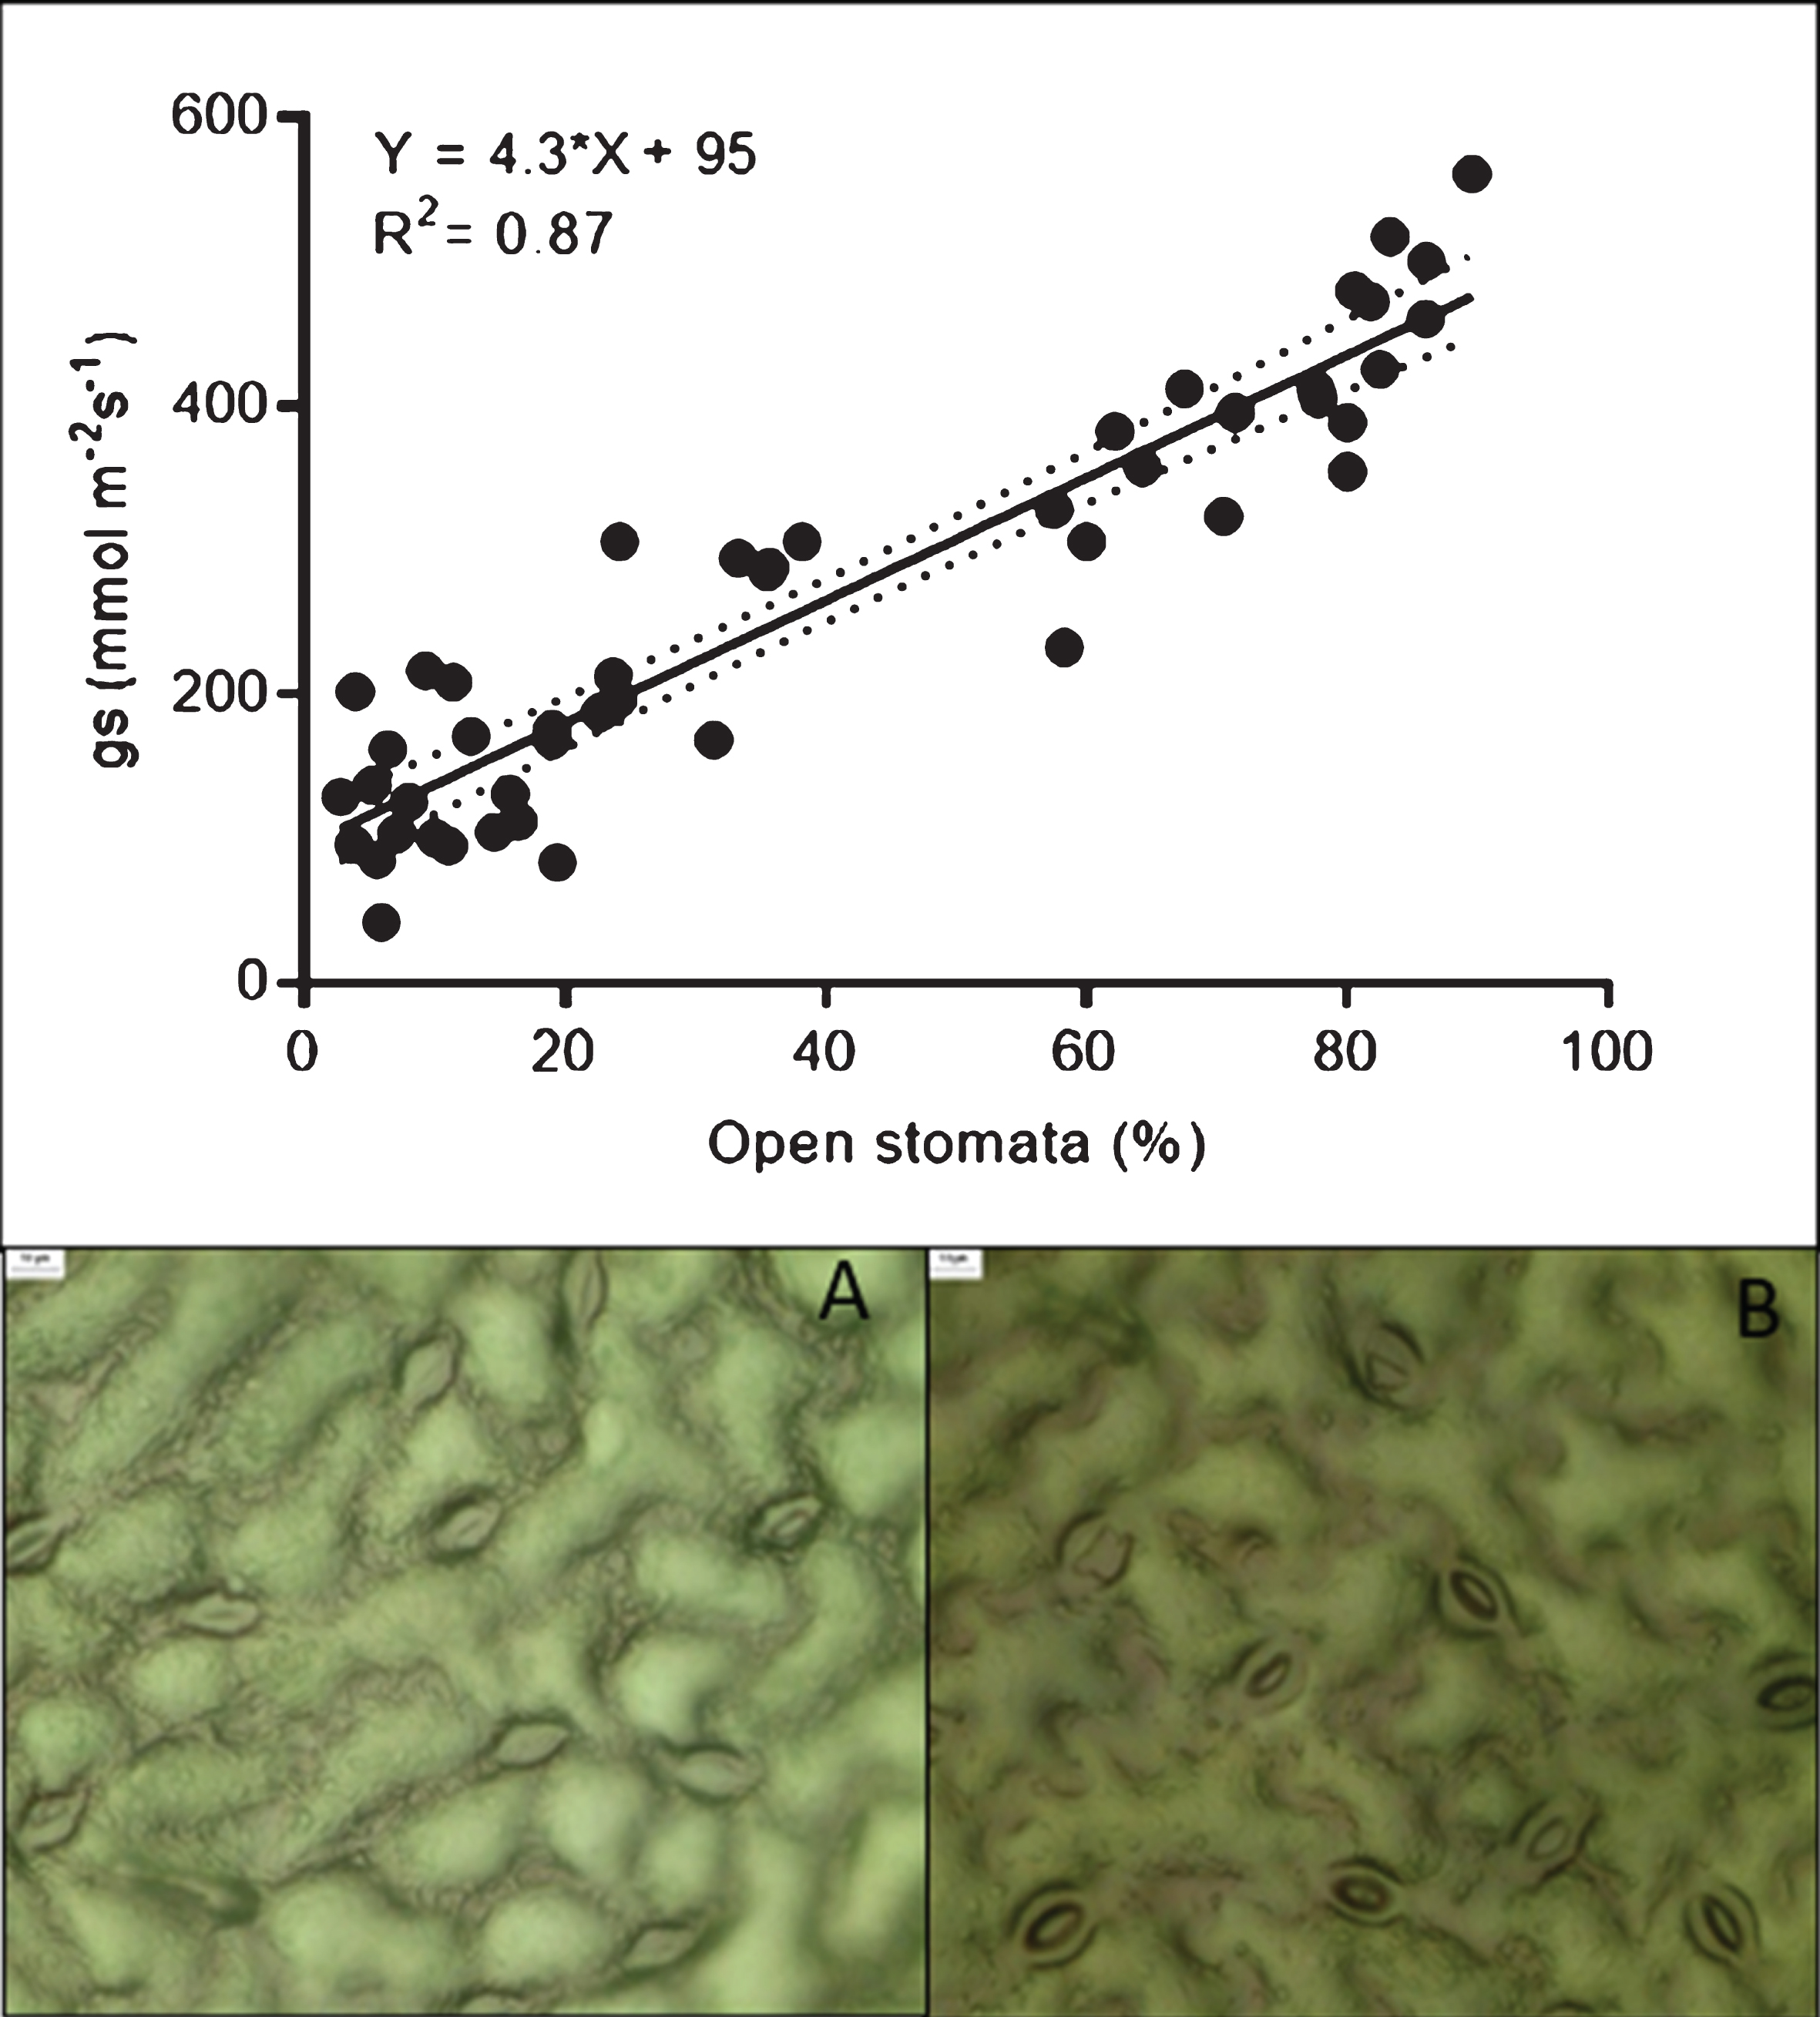
When the percentage of stomata opening was evaluated in the same samples, an interaction between the cultivar and irrigation treatments was detected (C×I, p < 0.0001). Under normal irrigation conditions, ‘Camarosa’ presented the lowest number of open stomata, reaching only 38%; followed by ‘Sabrina’, with 53%; while ‘Albion’ and ‘Monterey’ presented values above 60%. Under water stress conditions, all the cultivars tended to close their stomata, with approximately 20% of the stomata remaining open (Fig. 1). When analyzing data pooled from all the treatments, gs values were directly correlated with the percentage of stomata that were open (R2 = 0.87; Fig. 2 A, B and C). Note also that the responses characterized two groups (those with either low or high values for both stomatal opening and gs) that were associated with the degree of water stress, regardless of the disease presence.
No significant effect of the treatments on chlorophyll fluorescence (Fv/Fm) was observed. However, differences in the SPAD chlorophyll content between cultivars were detected, with ‘Albion’ presenting the highest values and standing out from the other cultivars. In this parameter no effects of the irrigation and inoculation treatments were detected (data not shown).
Fig.1
Open stomata in four Fragaria × ananassa (strawberry) cultivars infected (two weeks after inoculation) and not infected with M. phaseolina under no irrigation (NI, seven days of water stress) and full irrigation (FI) regimens. Data means, and SEMs are shown; n = 3.
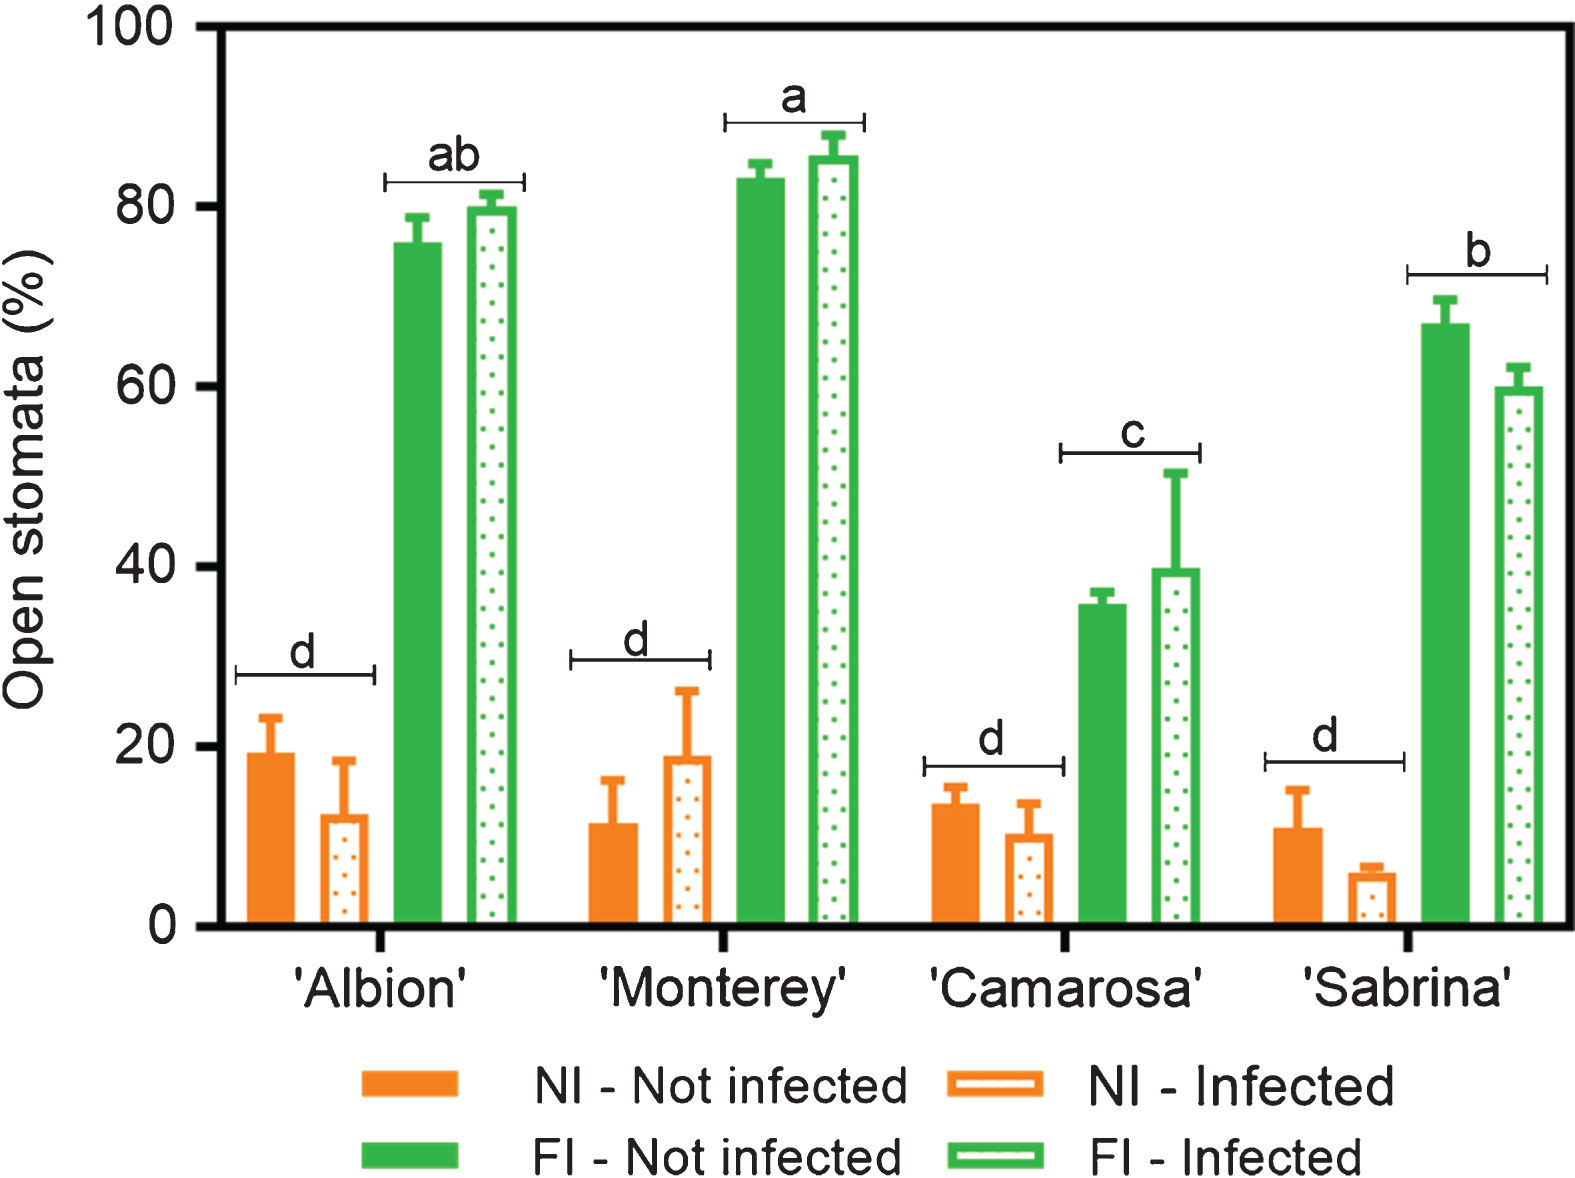
Fig.2
The upper figure shows the relationship between stomatal conductance and stomatal opening. Figures A and B show views of stomata impressions prepared at gs values of 86 and 480 mmol m−2 s−1, respectively.
3.3Severity of the disease
The symptoms presented in the aerial part of the plants were monitored for seven weeks post inoculation in order to study the effect of water stress on the disease susceptibility of the cultivars. The first symptoms were observed one week after inoculation in all four cultivars, although different dynamics of disease progress were observed depending on the irrigation treatment. The final symptomatology for all the cultivars was more severe in the plants that suffered water stress (Fig. 3).
Fig.3
Disease progress curves according to the severity of aerial symptoms in plants of four cultivars inoculated with M. phaseolina and maintained with no irrigation and full irrigation under greenhouse conditions. Disease severity was measured according to an arbitrary 0-to-5 scale.
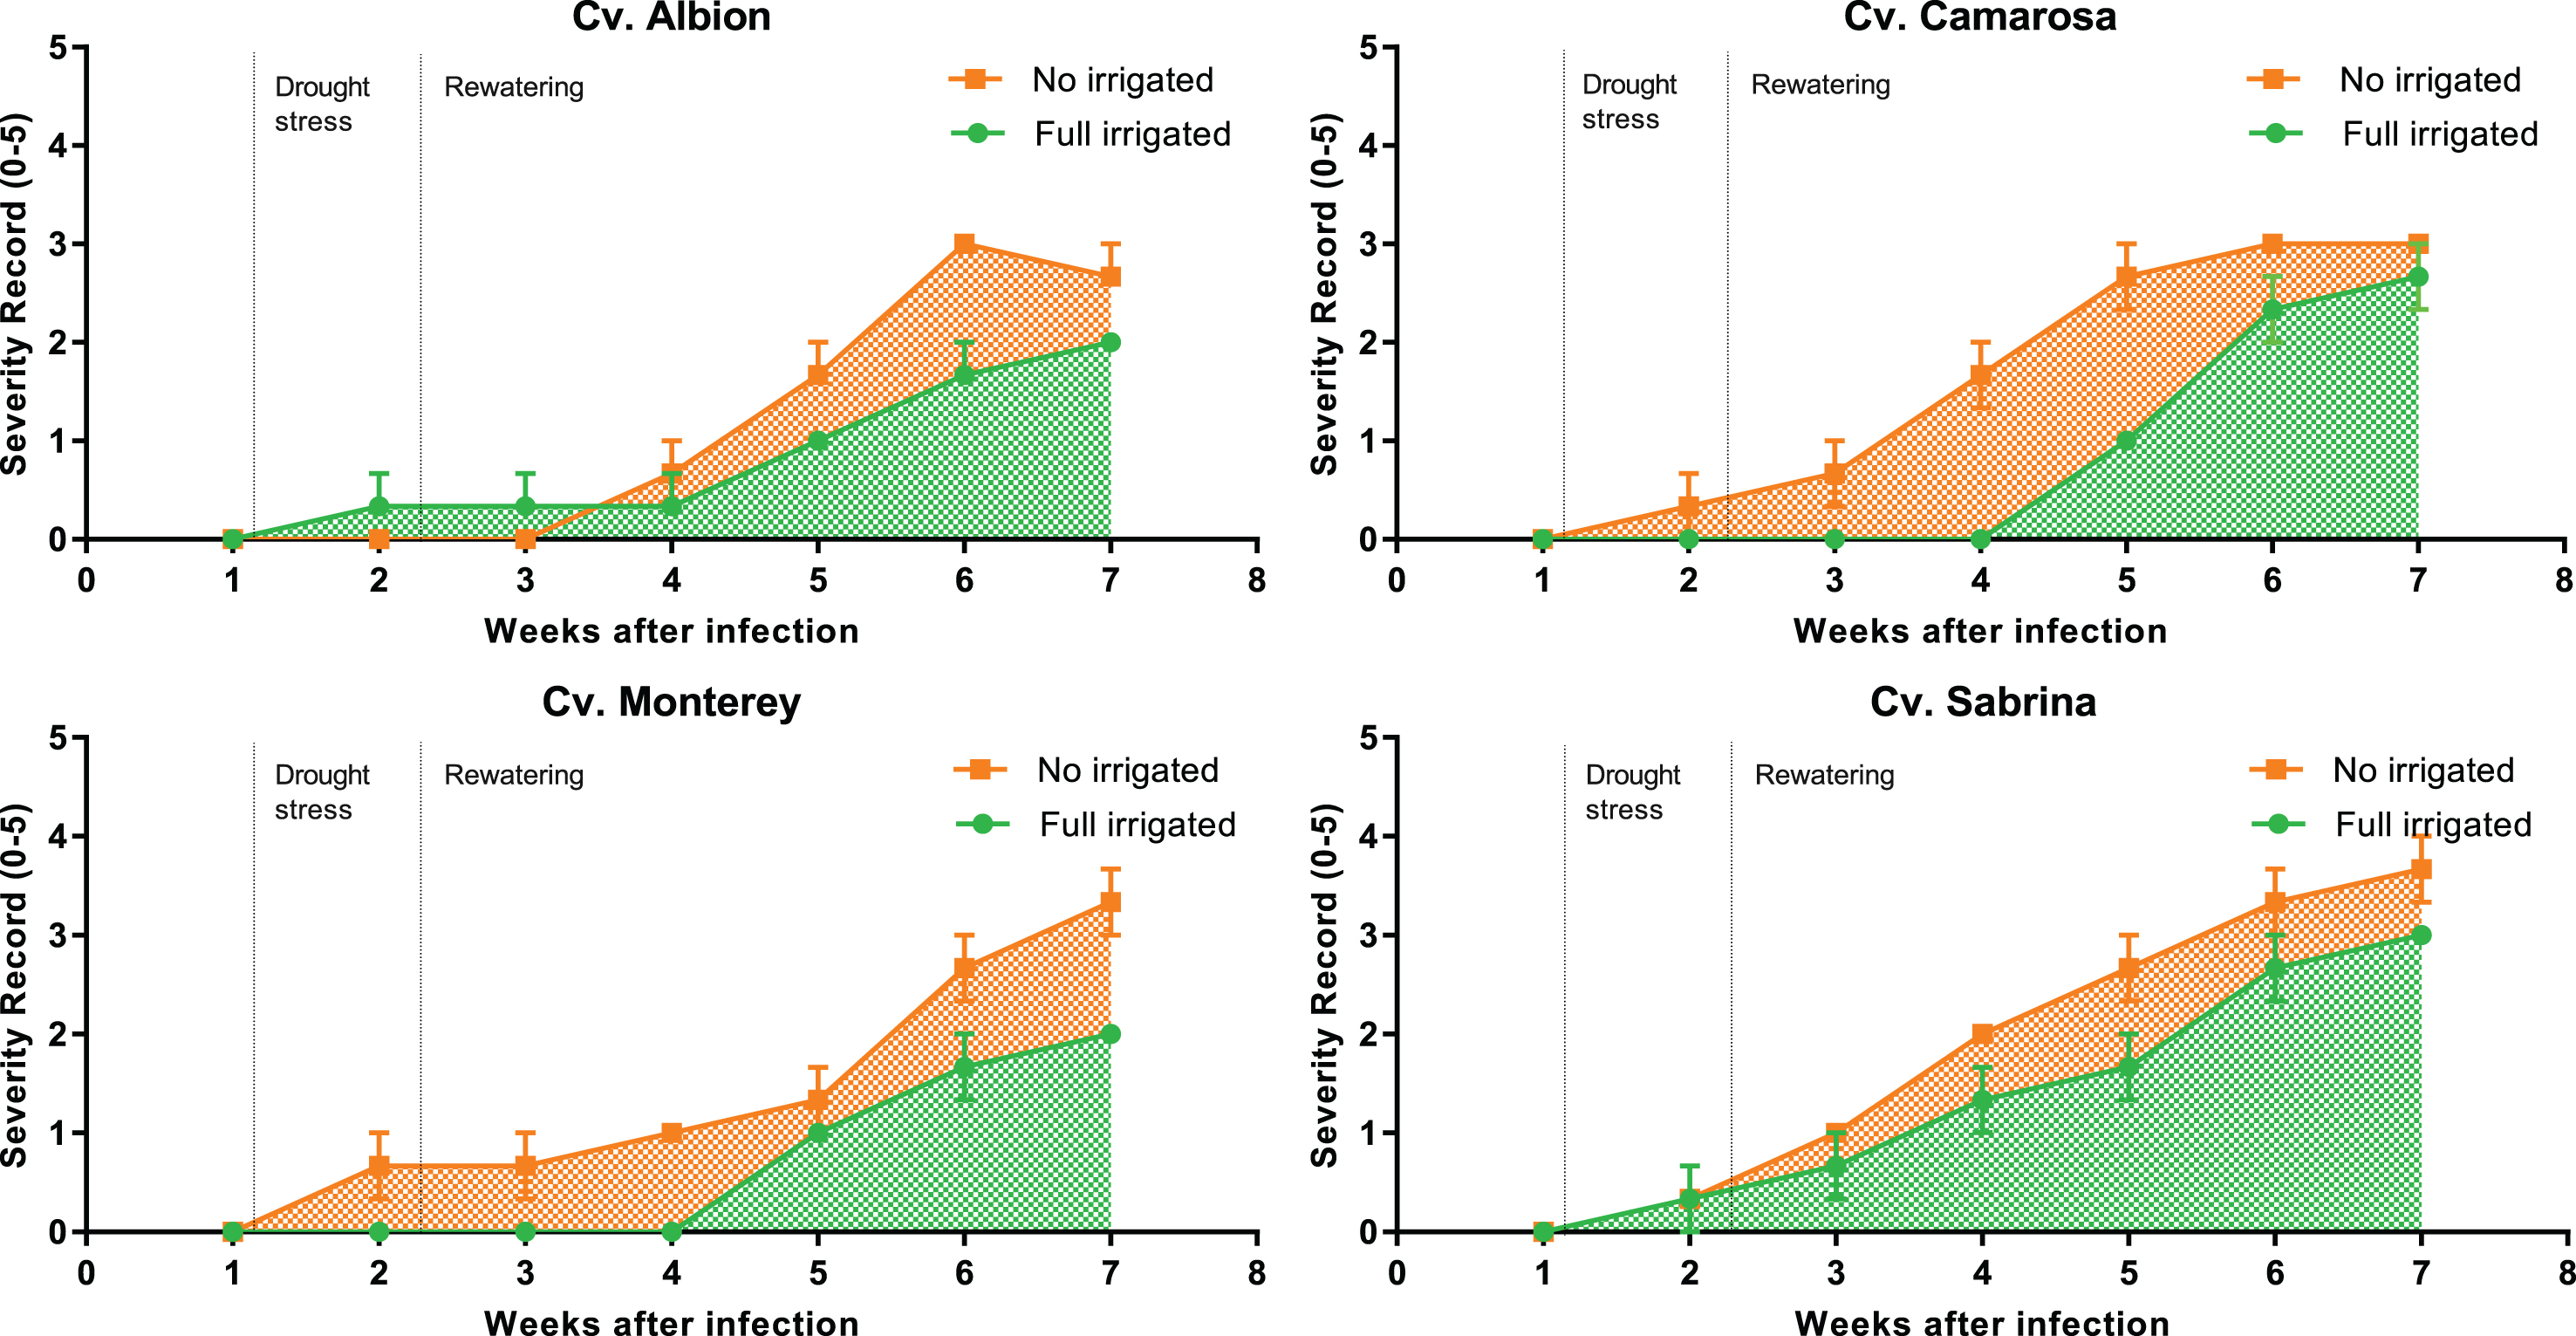
This difference in severity is supported by the results of the AUDPC, which showed that ‘Sabrina’ was the most severely affected cultivar. Analyzing the irrigation treatment effect, the plants that suffered water stress accumulated greater disease severity over time, compared with the irrigated ones (Table 2).
Table 2
Susceptibility of strawberry cultivars to M. phaseolina infection measured by the severity of symptoms and growth reduction under no irrigation and full irrigation regimens
| Cultivar | Irrigation | Disease severity AUDPC Aerial severity | Growth reduction DRY WEIGHT1 (%) | ||
| Albion | None | 46.67 | 24.39 | b | |
| Full | 32.67 | 03.37 | c | ||
| Mean | 39.67 | b | 13.88 | ||
| Monterey | None | 56.00 | 34.65 | ab | |
| Full | 25.67 | 31.25 | ab | ||
| Mean | 40.84 | b | 32.95 | ||
| Camarosa | None | 68.83 | 23.71 | b | |
| Full | 32.67 | 00.00 | c | ||
| Mean | 50.75 | b | 11.85 | ||
| Sabrina | None | 78.17 | 40.04 | ab | |
| Full | 57.17 | 25.34 | b | ||
| Mean | 68.00 | a | 32.69 | ||
| Probability level of significance (ANOVA) | |||||
| Source of variation | |||||
| Cultivar | 0.002 | <0.0001 | |||
| Irrigation | <0.0001 | <0.0001 | |||
| Cultivar×Irrigation | ns | 0.0052 |
Means followed by the same letter in each column are not significantly different, according to Tukey’s HSD test (p≤0.05). 1Reduction calculated based on uninoculated control plants. The reduction in dry mater was calculated based on uninoculated and fully irrigated plants for the inoculated fully irrigated plants and on uninoculated and not irrigated plants for the inoculated not irrigated plants.
For ‘Albion’ and ‘Camarosa’, plants that were under a period of water stress conditions showed a greater dry weight reduction than that shown by the fully irrigated plants. In contrast, ‘Sabrina’ and ‘Monterey’ were the most highly disease-affected cultivars regardless of the water stress (Table 2).
The disease severity in the aerial part of the plants (AUDPC) was negatively correlated with SWP, gs and the degree of stomatal opening (%), whereas a positive correlation existed with the reduction in the plant dry matter (Table 3).
Table 3
Correlation coefficients (r) between disease severity (AUDPC) and water relation and growth parameters in fully irrigated and not irrigated strawberry plants inoculated with M. phaseolina
| Characteristic | Disease severity | |
| AUDPC | ||
| r | p | |
| Stem water potential | –0.67 | 0.0004 |
| Stomatal conductance | –0.78 | <0.0001 |
| Stomatal opening (%) | –0.68 | 0.0003 |
| Growth reduction | 0.56 | 0.0045 |
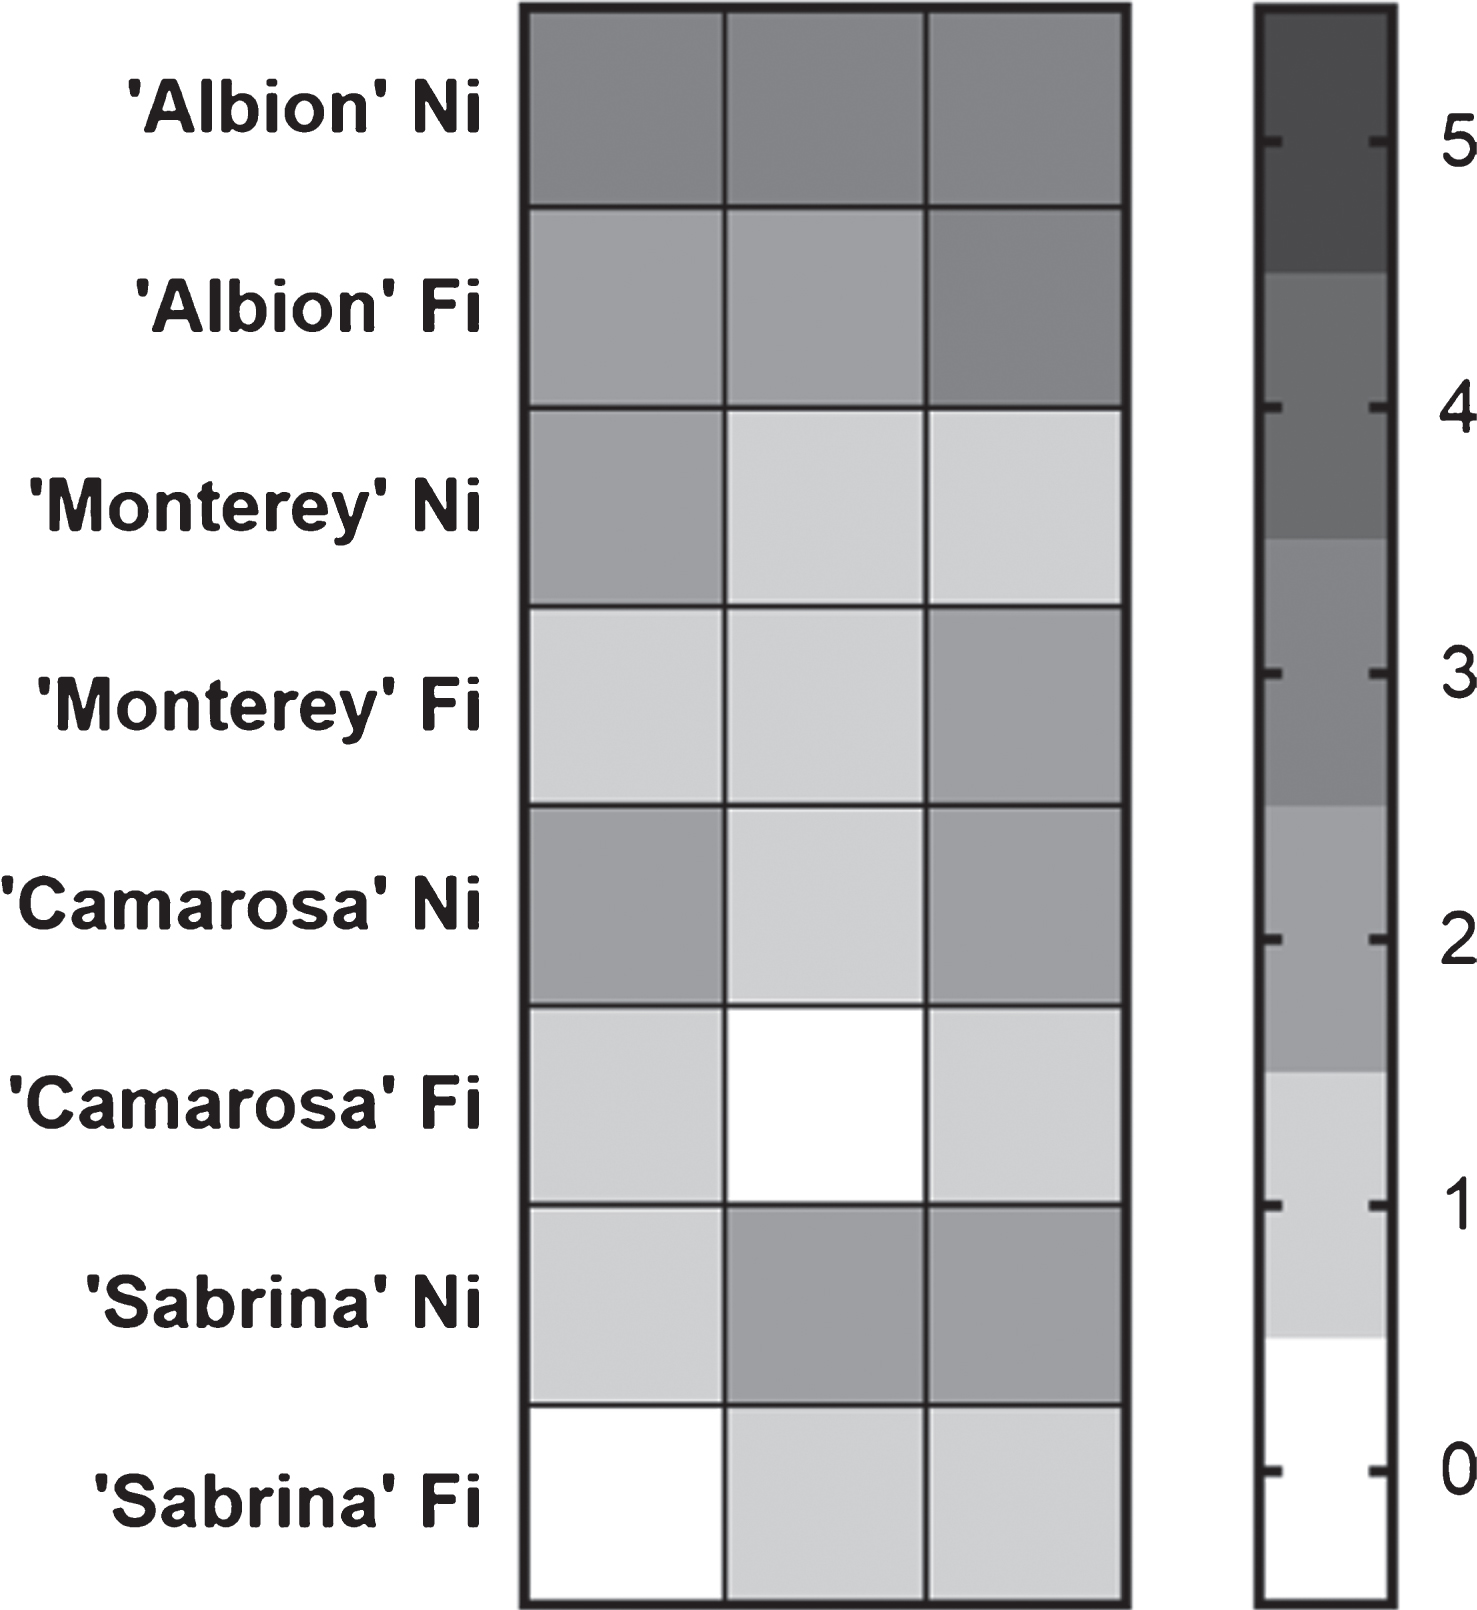
The cultivar most affected by damage to the crown seven weeks after inoculation was ‘Albion’, which presented a clear symptom increase in the plants that has subjected to a period of water stress. The cultivars ‘Sabrina’ and ‘Camarosa’ presented similar behavior, with greater crown damage in the plants exposed to water stress. In contrast, ‘Monterey’ plants showed a similar level of damage when fully watered and when subjected to water restriction (Fig. 4). Note that M. phaseolina was re-isolated from all the plants showing the presence of necrotic lesions in the crown tissue, fulfilling Koch’s postulate.
Fig.4
Heat map of crown damage of full irrigated (FI) and not irrigated (NI), infected plants. The scale was from 0 to 5, where 0 corresponds to a completely healthy crown and 5 to a completely affected crown.
4Discussion
The water stress to which the plants were subjected had an important effect on the parameters that describe water relations, influencing mainly the gs and SWP values.
After seven days of water restriction, all the plants showed significantly decreased gs, especially the cultivars ‘Sabrina’ and ‘Camarosa’. Note that these cultivars presented the lowest initial gs values, that is, those recorded prior to the water stress. Other authors have also described this behavior in plants of the genus Fragaria under water stress conditions [35, 36] and indicated that this stress response was highly dependent on the genotype [37, 38].
Additionally, the plants reduced their SWP values during this period from close to –0.8 MPa in the fully irrigated plants to between –1.23 and –2.1 MPa in the non-irrigated plants. These values approximate those described by [35], who found that strawberry plants subjected to four days of water restriction decreased their SWP from –1 MPa to –2 MPa. Reports for strawberries indicate that xylem potentials close to –1 MPa mark the beginning of drought stress; values close to –1.7 MPa coincide with the onset of wilting; and –2.5 MPa designates the beginning of irreversible effects caused by water stress [39]. Therefore, the SWP values observed in the present trial indicate that the irrigation restriction produced water stress in the plants without causing irreversible damage.
The cultivars ‘Camarosa’ and ‘Sabrina’ showed comparatively high sensitivity to a period of severe water stress, due their SWP and gs values were greatly affected by water restriction. ‘Albion’ and ‘Monterey’ presented more stable SWPs.
We can probe that the disease detrimentally affected the water relations of the plants, with an intensity that depended on the cultivar and the irrigation treatment. One of the most affected cultivars was ‘Sabrina’, in which SWP and gs were relatively highly affected in the inoculated plants subjected to water stress. In ‘Albion’, the period of water stress increased the negative effect of the disease on the SWP value. In ‘Camarosa’, however, the effect of irrigation was more important than that of the disease. These results indicate that the response of strawberry plants to the combined stress of water shortage and pathogen infection is highly dependent on the genotype. To our knowledge, no previous literature descriptions regarding the interaction of these factors exist for strawberry, but other studies—conducted in sorghum, cowpea and common bean—found that plant water relations are impacted as a result of this interaction [23, 25, 40].
In our study, SWP showed great sensitivity to disease development. Healthy plants subjected to water stress showed a recovery of SWP after irrigation was reestablished, whereas the diseased plants did not. Changes in water potential have been described not only to relate directly to soil moisture but also to be affected by pathogens that disrupt vascular system function in plants [19]. Note that M. phaseolina colonizes the epidermal and cortical tissue of plants as well as their vascular system, developing microsclerotia that block the xylem, affecting the normal transport of water from the plant [23].
The photosynthetic parameters evaluated did not show clear trends indicating a photosynthetic sensitivity to water stress or disease presence. However, the loss of water is restricted more rapidly and with greater intensity compared with the inhibition of photosynthesis [41]. The seven days of water restriction in the present trial were most likely not enough to produce detectable changes in the photosynthetic parameters.
The cultivars studied had a differential susceptibility to infection caused by M. phaseolina. This behavior has previously been observed in different genotypes [27, 28]. However, in all four strawberry cultivars, the disease severity increased in the aerial part of the plants had suffered severe water restriction. This finding is consistent with observations in other crops, namely, that drought and high temperatures are predisposing factors for the disease [17, 20, 21–33]. In addition, a lower soil moisture content increases the survival of microsclerotia and facilitates root infection [23].
A significant correlation was identified between the plant water relations and disease severity. Strawberry plants that showed the most severe symptoms in their aerial parts also showed the lowest SWP and gs values. Similar results have been described in other species: Sorghum bicolor plants with low water potentials had severe symptoms caused by M. phaseolina, and Phaseolus vulgaris cultivars with strong resistance to M. phaseolina were able to maintain higher water potentials compared with very susceptible cultivars [23]. Plants that are able to maintain a healthy water status under water restriction conditions generally have a high resistance to drought and pathogens that affect the vascular system; therefore, the water potential of plants has been suggested to be an important physiological indicator for evaluating the combined resistance to drought stress and pathogens, such as M. phaseolina [19].
The level of crown tissue damage observed in our experiments may not necessarily be related to the severity of the aerial symptomatology. The ‘Albion’ cultivar presented not only a great amount of crown necrosis but also an association between increased damage and having suffered a period of severe water stress. However, the ‘Sabrina’ plants showed little crown tissue damage despite highly evident symptoms in the aerial parts. This pattern could indicate the existence of a complex interaction between the defense response of plants to the pathogen and its ability to maintain water relations; however, the current study did not provide the additional information needed to elucidate the mechanisms involved.
Our results show that the infection caused by M. phaseolina increases the negative effects of water stress, depending on the genotype, and that the cultivars that are able to maintain more stable water relations, despite irrigation deficit conditions, respond better to the disease. Nevertheless, as in other species, the disease severity increases in plants that have suffered water stress and is significantly lower in fully watered plants. More studies are required to better understand the plant-pathogen-water stress interaction and the strategies used by plants against combined biotic and abiotic stresses as a basis for defining breeding programs, and developing efficient management tools in a scenario of changing weather conditions.
Funding
This study was supported by GOODBERRY (European Union’s Horizon 2020 research and innovation programme; grant agreement N° 679303). And by CONICYT (FONDECYT, Postdoctoral fellowship N° 3160694).
Conflict of interest
The authors have no conflict of interest to report.
Supplementary material
[1] The supplementary material is available in the electronic version of this article: http://dx.doi.org/10.3233/JBR-180329.
Acknowledgments
The authors have no acknowledgments.
References
[1] | Su G , Suh SO , Schneider RW , Russin JS . Host specialization in the charcoal rot fungus, Macrophomina phaseolina. Phytopathology. (2001) ;91: :120–6. |
[2] | De BK , Chattopadhya SB . Effect of potash on stem rot diseases of jute caused by Macrophomina phaseolina. J Mycopathol Res. (1992) ;30: :51–5. |
[3] | Khan SN . Macrophomina phaseolina as causal agent for charcoal rot of sunflower. Mycopath. (2007) ;5: :111–8. |
[4] | Dinakaran D , Mohammed SEN . Identification of resistant sources to root rot of sesame caused by Macrophomina phaseolina (Tassi.) Goid. Sesame and Safflower Newsletter. (2001) ;16: :68–71. |
[5] | Mayék-Pérez N , López-Castañeda C , González-Chavira M , Garcia-Espinosa R , Acosta-Gallegos J , de la Vega OM , Simpson J . Variability of Mexican isolates of Macrophomina phaseolina based on pathogenesis and AFLP genotype. Physiological and Molecular Plant Pathology. (2001) ;59: :257–64. |
[6] | Baudry AA , Morzières JP . First report of charcoal rot of strawberry in France. Acta Horticulturae. (1993) ;348: :485–8. |
[7] | Zveibil A , Freeman S . First report of crown and root rot in strawberry caused by Macrophomina phaseolina in Israel. Plant Disease. (2005) ;89: :1014. |
[8] | Mertely JJ , Seijo TT , Peres NN . First report of Macrophomina phaseolina causing a crown rot of strawberry in Florida. Plant Disease. (2005) ;89: :434. |
[9] | Avilés M , Castillo S , Bascon J , Zea-Bonilla T , Martín-Sánchez PM , Pérez-Jiménez RM . First report of Macrophomina phaseolina causing crown and root rot of strawberry in Spain. Plant Pathology. (2008) ;57: :382. |
[10] | Baino OM , Salazar SM , Ramallo AC , Kirschbaum DS . First report of Macrophomina phaseolina causing strawberry crown and root rot in northwestern Argentina. Plant Disease. (2011) ;95: :1477. |
[11] | Sharifi K , Mahdavi M . First report of strawberry crown and root rot caused by Macrophominaphaseolina in Irán. Iranian Journal of Plant Pathology. (2012) ;47: :161. |
[12] | Hutton DG , Gomez AO , Mattner SW . Macrophomina phaseolina and its association with strawberry crown rot in Australia. International Journal of Fruit Science. (2013) ;13: :149–55. |
[13] | Sánchez S , Gambardella M , Henríquez JL , Díaz I . First Report of Crown Rot of Strawberry Caused by Macrophomina phaseolina in Chile. Plant Disease. (2013) ;97: :996. |
[14] | Koike ST , Gordon TR , Daugovish O , Ajwa H , Bolda M , Subbarao K . Recent developments on strawberry plant collapse problems in California caused by Fusarium and Macrophomina. International Journal of Fruit Science. (2013) ;13: :76–83. |
[15] | Manici LM , Caputo F , Cerato C . Temperature responses of isolates of Macrophomina phaseolina from different climatic regions of sunflower production in Italy. Plant Disease. (1995) ;79: :834–8. |
[16] | Olaya G , Abawi GS , Weeden NF . Inheritance of resistance to Macrophomina phaseolina and identification of RAPD markers linked to the resistance genes in beans. Phytopathology. (1996) ;86: :674–9. |
[17] | Goudarzi A , Banihashemi Z , Maftoun M . Effect of water potential on sclerotial germination and mycelial growth of Macrophomina phaseolina. Phytopathologia Mediterranea. (2008) ;47: :107–14. |
[18] | Akhtar KP , Sarwar G , Arshad HMI . Temperature response, pathogenicity, seed infection and mutant evaluation against Macrophomina phaseolina causing charcoal rot disease of sesame. Archives of Phytopathology and Plant Protection. (2011) ;44: :320–30. |
[19] | Pandey P , Irulappan V , Bagavathiannan MV , Senthil-Kumar M . Impact of combined abiotic and biotic stresses on plant growth and avenues for crop improvement by exploiting physio-morphological traits. Frontiers in Plant Science. (2017) ;8. |
[20] | Dhingra OD , Sinclair JB Biology and pathogenicity of Macrophomina phaseolina. (1978) . Viscosa, Brazil. Universidade Federal de Viscosa pp. 166. |
[21] | Sandhu A , Singh RD , Sandhu A . Factors influencing susceptibility of cowpea to M. phaseolina. Journal of Mycological Plant Pathology. (1999) ;29: :421–4. |
[22] | Kendig SR , Rupe JC , Scott HD . Effect of irrigation and soil water stress on densities of Macrophomina phaseolina in soil and roots of two soybean cultivars. Plant Disease. (2000) ;84: :895–900. |
[23] | Mayék-Pérez N , Garcia-Espinosa R , Lopez-Castaneda C , Acosta-Gallegos JA , Simpson J . Water relations, histopathology and growth of common bean (Phaseolus vulgaris L) during pathogenesis of Macrophomina phaseolina under drought stress. Physiol Mol Plant Pathol. (2002) ;60: :185–95. |
[24] | Pastor-Corrales MA , Abawi GS . Reactions of selected bean accessions to infection by Macrophomina phaseolina. Plant Disease. (1988) ;72: :39–41. |
[25] | Diourte M , Starr JL , Jeger MJ , Stack JP , Rosenow DT . Charcoal rot (Macrophomina phaseolina) resistance and the effects of water stress on disease development in sorghum. Plant Pathol. (1995) ;44: :196–202. |
[26] | Mezzetti B , Giampieri F , Yun-tao Z , Chuan-fei , Z . Status of strawberry breeding programs and cultivation systems in Europe and the rest of the world. Journal of Berry Research, (Preprint). (2018) ;1–17. |
[27] | Fang X , Phillips D , Verheyen G , Li H , Sivasithamparam K , Barbetti MJ . Yields and resistance of strawberry cultivars to crown and root diseases in the field, and cultivar responses to pathogens under controlled environment conditions. Phytopathologia Mediterranea. (2012) ;51: :69–84. |
[28] | Sánchez S , Henríquez JL , Urcola LA , Scott A , Gambardella M . Susceptibility of strawberry cultivars to root and crown rot caused by Macrophomina phaseolina. Journal of Berry Research. (2016) ;6: :345–54. |
[29] | Babu BK , Saxena AK , Srivastava AK , Arora DK . Identification and detection of Macrophomina phaseolina by using species-specific oligonucleotide primers and probe. Mycologia. (2007) ;99: :797–803. |
[30] | Meyer W , Reickosky DC . Enclosing leaves for water potential measurements and its effects on interpreting soil induced water stress. Agric Meteorol. (1985) ;35: :187–92. |
[31] | Scholander PF , Bradstreet ED , Hemmingsen EA , Hammel HT . Sap pressure in vascular plants: Negative hydrostatic pressure can be measured in plants. Science. (1965) ;148: :339–46. |
[32] | Celedón JM , Gil PM , Ferreyra R , Maldonado P , Barrera C . Sensitivity and variability of two plant water stress indicators: Exploring criteria for choosing a plant monitoring method for avocado irrigation management. Chilean Journal of Agricultural Research. (2012) ;72: :379. |
[33] | Fang X , Phillips D , Li H , Sivasithamparam K , Barbetti MJ . Comparisons of virulence of pathogens associated with crown and root diseases of strawberry in Western Australia with special reference to the effect of temperature. Scientia Horticulturae. (2011) ;131: :39–48. |
[34] | Thomas CR , Maurice SC Statistix 8, in Managerial Economics, 9th edition, McGraw-Hill/Irwin, New York, NY. (2009) . |
[35] | Blanke MM , Cooke DT . Effects of flooding and drought on stomatal activity, transpiration, photosynthesis, water potential and water channel activity in strawberry stolons and leaves. Plant Growth Regulation. (2004) ;42: :153–60. |
[36] | Surbanovski N , Sargent DJ , Else MA , Simpson DW , Zhang H , Grant OM . Expression of Fragaria vesca PIP aquaporins in response to drought stress: PIP down-regulation correlates with the decline in substrate moisture content. PloS One. (2013) ;8. |
[37] | Zhang B , Archbold DD . Water relations of a Fragaria chiloensis and a F. virginiana selection during and after water deficit stress. Journal of the American Society for Horticultural Science. (1993) ;118: :274–9. |
[38] | Ghaderi N , Siosemardeh A . Response to drought stress of two strawberry cultivars (cv. Kurdistan and Selva). Horticulture, Environment, and Biotechnology. (2011) ;52: :6–12. |
[39] | Sruamsiri P LenzF. Photosynthesis and stomatal behavior of strawberries. IV. Effects of water deficiency. Gartenbau. (1986) ;51: :84–92. |
[40] | Burman U , Lodha S . Macrophomina phaseolina induced changes in plant water relations of resistant and susceptible cowpea genotypes. Indian Phytopathol. (1996) ;49: :254–9. |
[41] | Klamkowski K , Treder , W . Response to drought stress of three strawberry cultivars grown under greenhouse conditions. Journal of Fruit and Ornamental Plant Research. (2008) ;16: :179–88. |

