
Characterisation of bioactive compounds in berries from plants grown under innovative photovoltaic greenhouses
Abstract
BACKGROUND:
Bioactive compounds, mainly polyphenols, present in berries, are thought to be responsible for the health benefits of these fruit. Therefore, it is worthwhile to define the optimal environmental conditions to maximise their polyphenol content.
OBJECTIVE:
With the aim to define the optimal conditions for berry cultivation in an innovative environment, red raspberry, wild strawberry and blackberry plants were grown in a traditional greenhouse in comparison with two photovoltaic greenhouses with different shading area.
METHODS:
Hydroalcoholic extracts of ripe berries were evaluated by HPLC analysis, for their anthocyanins, organic acids and sugar contents. Moreover, phenolic content (by the Folin-Ciocalteu assay) and antioxidant activity (by the Trolox equivalent antioxidant capacity-TEAC assay) were assayed on the same berry extracts.
RESULTS:
Total anthocyanins, phenols content and antioxidant capacity tended to increase in berries grown under shading. The sugars content was, mostly, not negatively influenced by the shading. Conversely, the organic acids content, in some instances, increased along with the shading percentage.
CONCLUSIONS:
It can be concluded that it is possible to combine the greenhouse production of high-quality berries (with a particular focus on polyphenols, bioactive compounds valuable for human health) with the production of renewable energy, in the context of sustainable agriculture.
1Introduction
In the past few years, European government remuneration policies have promoted the realisation of building-integrated photovoltaic (PV) systems instead of on-ground PV plants. Consequently, in rural areas, greenhouses covered with PV modules have been developed [1]. The introduction of photovoltaic greenhouses (PVGs) helps to reduce energy consumption from traditional fossil fuels, which is partly compensated by renewable energy sources [2]. Therefore, with the aims of both shading and producing energy in a renewable system, solar PVG can be used for the cultivation of targeted crops [3]. Besides energy production, the removal of all direct radiation can prevent up to 77% of the solar heating from entering the greenhouse, significantly reducing the required cooling capacity, particularly during summer [4]. Nevertheless, the shading caused by the 100% covering with traditional PV modules limits the photosynthetically active radiation (PAR), thus, reducing plant photosynthesis, quality and productivity. An elevated and undesired nitrate content in rocket grown under low levels of solar radiation, due to high shading in a greenhouse covered with traditional PV modules, has been reported [3]. Hence, there is a need to achieve the optimal balance between shade reduction (to maintain optimal levels of photosynthesis) and energy production. To this aim, the integrated semi-transparent PV panels have been proposed as the optimal conditions for energy production, thermal balance inside the greenhouse, and a PAR sufficient to support a high-quality production [3, 5, 6].
In order to avoid high percentages of coverage, local laws require that shaded areas are ≤25% of the projection on the soil of the covered roof [1, 7, 8]. Nevertheless, this percentage seems not to be based on scientific evidence about the agricultural performances of the greenhouse but only on empirical assessments [1]. Thus, more studies are needed to verify the possibility of increasing this coverage limit, as well as evaluate the crops that best fit the light conditions under PVGs.
It is well known that some wild berry plants grow well in the underwood with a high percentage of canopy closure, without compromising the nutritional quality of the fruit. Bilberry plants grown under different habitat conditions (open field vs forest stands) show the same nutritional profile of the fruit, regarding mineral composition and metabolites [9]. Still, no data are documented in the literature, concerning the effects of different shading percentages on the quality of berries grown under PVGs.
Berries are an important source of phytochemicals, particularly phenolics, which influence the quality of fruit, contributing to both the sensorial and organoleptic attributes and their nutraceutical value [10–12]. The general goal of this study was to verify the possibility of combining the greenhouse production of high-quality berries with the production of renewable energy in a context of sustainable agriculture. More specifically, it evaluated some nutritional quality traits of the fruit produced by red raspberry, wild strawberry and blackberry plants grown in a traditional greenhouse in comparison with two PVGs with different shading areas.
2Material and methods
2.1PVGs, plant material and cultivation
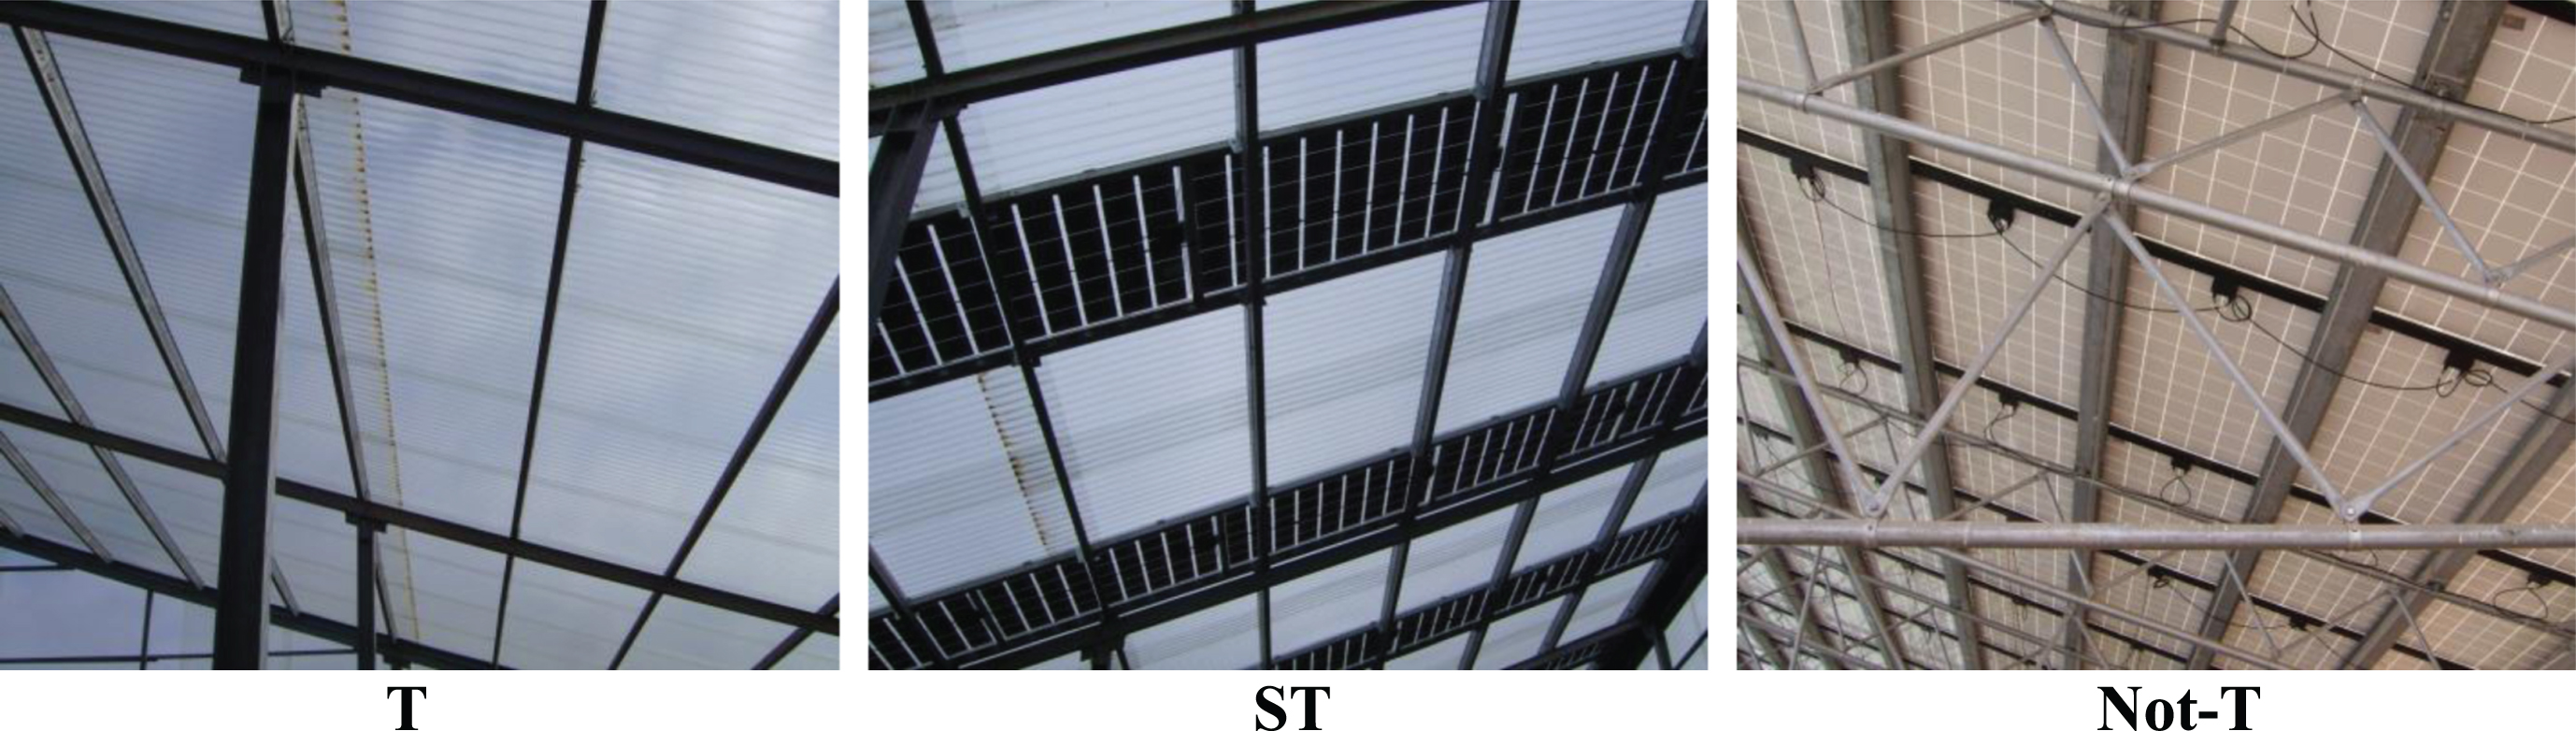
The experiments were conducted in Avetrana (TA), Apulia region (Southern Italy, 40°20′N, 17°43′E). Three types of commercial greenhouses, with differing cover material, including transparent (T) polycarbonate modules, semi-transparent (S-T) integrated PV modules, and non-transparent (Non-T) traditional PV modules, were used (Fig. 1).
Fig.1
Details of greenhouse cover materials: (T) transparent modules; (S-T) semi-transparent modules; (Non-T) non-transparent modules.
The structure specification and cover material properties are presented in Table 1. The PV output terminals were connected to an inverter, to supply the PV-produced electricity for alternating current appliances. Greenhouses were located along their common east-west axis and separated by 5 m. Each greenhouse consisted of a single sloping roof pitch of 19° degrees and south-facing aspect. Ventilation was provided by manually opening front windows and by automatically opening lateral and roof windows, depending on the temperature and relative humidity inside the greenhouse.
Table 1
Structure specifications, cover material properties, photosynthetic photon flux density (PPFD) and main air temperature of the photovoltaic greenhouses
| Greenhouse | |||
| T | S-T | Non-T | |
| Cover material | Transparent modules | Semi-transparent modules | Non-transparent modules |
| Cover with PVM(*) (%) | 0 | 32 | 100 |
| Cover without PVM (%) | 110 | 68 | 0 |
| Transparency PVM (%) | – | 20 | 0 |
| Shaded area (%) | 0 | 25** | 100 |
| PVM model | – | V-ENERGY | SOLSONICA 610 |
| 154PVTT | |||
| Solar cell technology | – | Polycrystalline silicon | Polycrystalline silicon |
| Solar cell per module (n°) | – | 54 | 60 |
| Solar cell format (mm) | – | 156×156 | 156×156 |
| Solar cell dimensions (mm) | – | 1663×998 | 1663×998 |
| Solar cell maximum power (Wp) | – | 200 | 230 |
| Solar cell efficiency (%) | – | 12.21 | 13.86 |
| PPFD (μmol s–1 m–2) inside the greenhouse | 911 | 620 | 134 |
| PPFD reduction (%) relative to outside the greenhouse | –30 | –52 | –90 |
| Mean air temperature (°C) | 22.3 | 21.7 | 20.0 |
*PVM = photovoltaic modules. **maximum value set by Apulian regional regulations (Regione Puglia, 2012).
Red raspberry (Rubus idaeus L.) cv. ‘Tulameen’, wild strawberry (Fragaria vesca L.) cv. ‘Regina delle Valli’ and blackberry (Rubus fruticosus L.) cv. ‘Loch Tay’, were investigated. The plants were grown in a soilless growing system, in greenhouses with specified characteristics (Table 1), during April−June 2013. Ten-litre pots were used, containing a mixture (1:2 v/v) of peat (Brill 3 Special, Brill Substrates, Georgsdorf, Germany) and perlite (Agrilite P3, Perlite Italiana, Corsico, Italy). The plants were fertigated by a drip irrigation system, with a nutrient solution (NS) maintaining a drainage solution level of about 20% of the total NS volume applied. The NS used for fertigation was composed of (mg L–1) 157 N, 43 P, 165 K, 112 Ca, 17 Mg and 45 S as macronutrients, whereas micronutrients were supplied according to [13]. The well water used had the following characteristics: pH 7.1 and 1.1 dS m–1 electrical conductivity. The NS pH was adjusted to 5.5–6.0, using 1 M H2SO4.
For the period of the trials (April−June), the air temperature inside the greenhouses and PAR were measured. The photosynthetic photon flux density (PPFD) (μmol m–2 s–1) was measured with four Li-Cor LI-190SA (Li-Cor Inc., USA) quantum sensors connected to WatchDog 1000 Series Micro Stations (Spectrum Technologies Inc., Plainfield, IL). One sensor was placed outside; three sensors were installed inside the greenhouses at the southern side of the intermediate steel columns at 1.60 m from the ground. Data were gathered every 30 min and collected using a data logger. The PPFD distribution inside the three greenhouses was estimated using the method developed by [14], based on a combination of a commercial lighting simulation software and meteorological data.
2.2Sample material and chemicals
At least 100 g of healthy fruit (at the ripe stage) from three plants were harvested, thus, providing triplicates. The fruit was immediately cooled on ice and then stored at –20°C until processed (within 2 months). Fruit were ground in a Waring blender with liquid nitrogen, freeze-dried using a Freezone® 2.5 model 76530 lyophiliser (Labconco Corp., Kansas City, MO, USA) for 48 h and stored at –20°C. This product was defined as the dry weight (DW) of the processed fruit.
Authentic standards of kuromanin chloride (cyanidin 3-O-glucoside chloride), keracyanin chloride (cyanidin 3-O-rutinoside chloride), callistephin chloride (pelargonidin 3-O-glucoside chloride) and cyanidin 3-O-sophoroside chloride were purchased from Extrasynthèse, Genay, France. Folin−Ciocalteu (F−C) phenol reagent, gallic acid, (S)-(-)-6-hydroxy-2,5,7,8-tetramethylchroman-2-carboxylic acid (Trolox), 2,2’-azino-bis (3-ethylbenzothiazoline-6-sulphonic acid) (ABTS), acetonitrile, ethanol, methanol, acetone, formic acid and acetic acid (all HPLC grade) were from Sigma-Aldrich (St. Louis, MO, USA). In all experiments, Milli-Q (Merck Millipore, Darmstadt, Germany) water was used.
2.3Extraction of anthocyanins and polyphenols
Freeze-dried fruit (200 mg), in triplicate, were macerated with 10 mL of methanol/water/formic acid (70:28:2, v/v/v), at 4°C overnight. Samples were centrifuged at 4000 g for 10 min, and the slurry was re-extracted with an additional 10 mL on a rotary shaker for 1 h, at room temperature. Pooled supernatants were evaporated in vacuo at 32°C using an R-205 Büchi Rotavapor (Büchi Labortechnik, AG, Flawil, Switzerland), up to 5% of the initial volume. The residue was suspended in a final volume of 4 mL with acidified (0.5% formic acid) Milli-Q water, portioned and stored at –20°C.
2.4Identification and quantification of phenolic compounds
Fruit extracts were filtered through 0.45-μm nylon membranes and analysed by an HPLC apparatus, equipped with a photodiode array (PDA) detector (Agilent 1100 series, Agilent Technologies, Santa Clara, CA, USA). Instrument control, data acquisition and processing were provided by the ChemStation software (Agilent Technologies). Separations were performed at 30°C on a Luna RP-C18 column (250×4.6 mm I.D., 5 μm) (Phenomenex, Torrance, CA, USA), equipped with a guard cartridge column. The sample was eluted following the multi-segment linear gradient employed in [15], using 5% (v/v) formic acid both in water (mobile phase A) and in acetonitrile (mobile phase B). The flow rate was 0.7 mL min−1 and, after each separation, the column was equilibrated to the initial conditions for 10 min. UV-Vis spectra were recorded in the 200–800 nm range and chromatograms were acquired at 280 and 520 nm. Individual polyphenolic compounds were identified, by comparing their peak retention times and UV-Vis spectra with those of commercial standards. The identified phenolic compounds were quantified by the external standard method, using calibration graphs obtained with solutions of available authentic standards at five different concentration levels within the linear dynamic range of the UV detector. Cyanidin-based anthocyanins were quantified by using a calibration graph constructed with standard kuromanin chloride (cyanidin 3-O-glucoside chloride), whereas cyanidin 3-O-sophoroside and pelargonidin 3-O-glucoside were quantified using a calibration graph established with standard cyanidin 3-O-sophoroside chloride and callistephin chloride (pelargonidin 3-O-glucoside chloride), respectively.
2.5Identification and quantification of sugars and organic acids
Sugars and organic acids were extracted by macerating 200 mg of sample, plus 200 mg polyvinylpolypyrrolidone in 10 mL extraction solvent (Mill-Q-water), for 1 h at room temperature. After centrifugation of the slurry (4000 g for 10 min) the supernatant was collected, then a further 10 mL of extraction solvent was added to the pellet, and the extraction continued on a rotary shaker for 1 h. The pooled supernatants were mixed, and an aliquot (1 mL) was further centrifuged (15500 g for 10 min), followed by injection into the HPLC system (Agilent 1100 Series). For the identification and quantification, the HPLC system was equipped with a pump system, an Aminex HPX-87H column (300×7.8 mm, 9 μm) (Bio-Rad, Hercules, CA, USA), maintained at 55° C, a refractive index detector for sugar analysis, and a UV/Vis detector, set at 210 nm, for organic acids analysis. The analytical conditions used were the same as reported in [15].
2.6Antioxidant capacity of berries extracts
2.6.1Trolox equivalent antioxidant capacity (TEAC)
The TEAC assay was performed as reported in [15]. Briefly, ABTS•+ solution (prepared as described in [16]) was diluted with Milli-Q water to an absorbance of at least 0.40 (±0.02) at 734 nm and equilibrated at 30°C (ABTS•+ working solution). Next, 10 μL of the Trolox standard solution or the appropriately diluted sample and 200 μL of ABTS•+ working solution were placed in Costar 96-well, transparent, round-bottomed plates (Corning, Tewksbury, MA, USA). Appropriate solvent blanks were run in each assay. The absorbance at 734 nm was determined using a Tecan Infinite M200 microplate reader (Tecan Group Ltd, Männedorf, Switzerland), 10 min after adding ABTS•+. All reaction mixtures were prepared in triplicate, and each sample was independently assayed twice. The percentage (%) inhibition of absorbance at 734 nm was calculated and plotted as a function of the Trolox reference standard. The results were expressed as μmol TE Trolox equivalents g−1 of DW.
2.6.2Folin−Ciocalteu (F−C) assay
The F−C reducing capacity of berry extract was assessed according to [17], using a Tecan Infinite M200 microplate reader, with Costar 96-well transparent, round-bottomed plates (Corning). Briefly, 50 μL of gallic acid standard (prepared daily) or sample and 50 μL of F−C reagent (1:5, v/v) were placed in each well, then 100 μL of sodium hydroxide (0.35 M) was added. The absorbance of the blue complexes was monitored at 760 nm after 5 min. The intrinsic absorption of the sample was determined by replacing the F−C reagent with 50 μL of 0.4 M acetic acid and the reagent blank was evaluated by replacing the standard or sample with 50 μL of Milli-Q water. The interfering reducing substances present in the specimens, such as ascorbic acid, were also evaluated by applying the indirect method proposed by [18]. An aliquot of the sample was heated in a water bath at 80°C for 2 h and finally cooled in a water-ice bath. Heated and non-heated samples were then subjected to the F−C assay. The absorbances of the samples were compared against a gallic acid standard curve (R2 ≥0.997; concentration range, 2.5−40.0 mg L−1) and the F−C reducing capacity was expressed as gallic acid equivalents (GAE) μg g−1 DW. All experiments were performed in triplicate, and each sample was quantified in two independent assays.
2.7Statistical analysis
The effect of environmental growing conditions was tested by one-way analysis of variance (ANOVA). The means were separated by the Student-Newman-Keuls (SNK) test, while standard deviation (SD) was also calculated for the data.
3Results and discussion
3.1Identification of anthocyanins in raspberry, strawberry (woodland), and blackberry fruits
The HPLC anthocyanin profile of raspberry extract (at λ= 520 nm) presented three peaks, identified by their respective UV-Vis absorption spectra, the chromatographic retention times of the standards and previous reports of raspberry anthocyanins [19, 20]. The two major peaks were identified as cyanidin 3-O-sophoroside (peak 1) and cyanidin 3-O-glucoside (peak 3), and the third (peak 2) was assigned to cyanidin 3-O-glucosylrutinoside, based on literature data (Fig. 2, Panel A). This profile was similar for the three growing conditions (T, S-T and Non-T), with some differences in the peak ratios.
Fig.2
Chromatographic profiles of anthocyanin extracts from raspberry (panel A), strawberry (panel B) and blackberry (panel C) fruit, from plants grown in photovoltaic greenhouses. Peak assignment: 1: cyanidin 3-O-sophoroside; 2: cyanidin 3-O-glucosyl rutinoside; 3: cyanidin 3-O-glucoside; 4: pelargonidin 3-O-glucoside; 5: peonidin 3-O-glucoside; 6: cyanidin 3-O-malonyl glucoside; 7: pelargonidin 3-O-malonyl glucoside; 8: peonidin 3-O-malonyl glucoside; 9: cyanidin 3-O-rutinoside; 10: cyanidin 3-O-xyloside, and 11: cyanidin 3-O-dioxalyl glucoside.
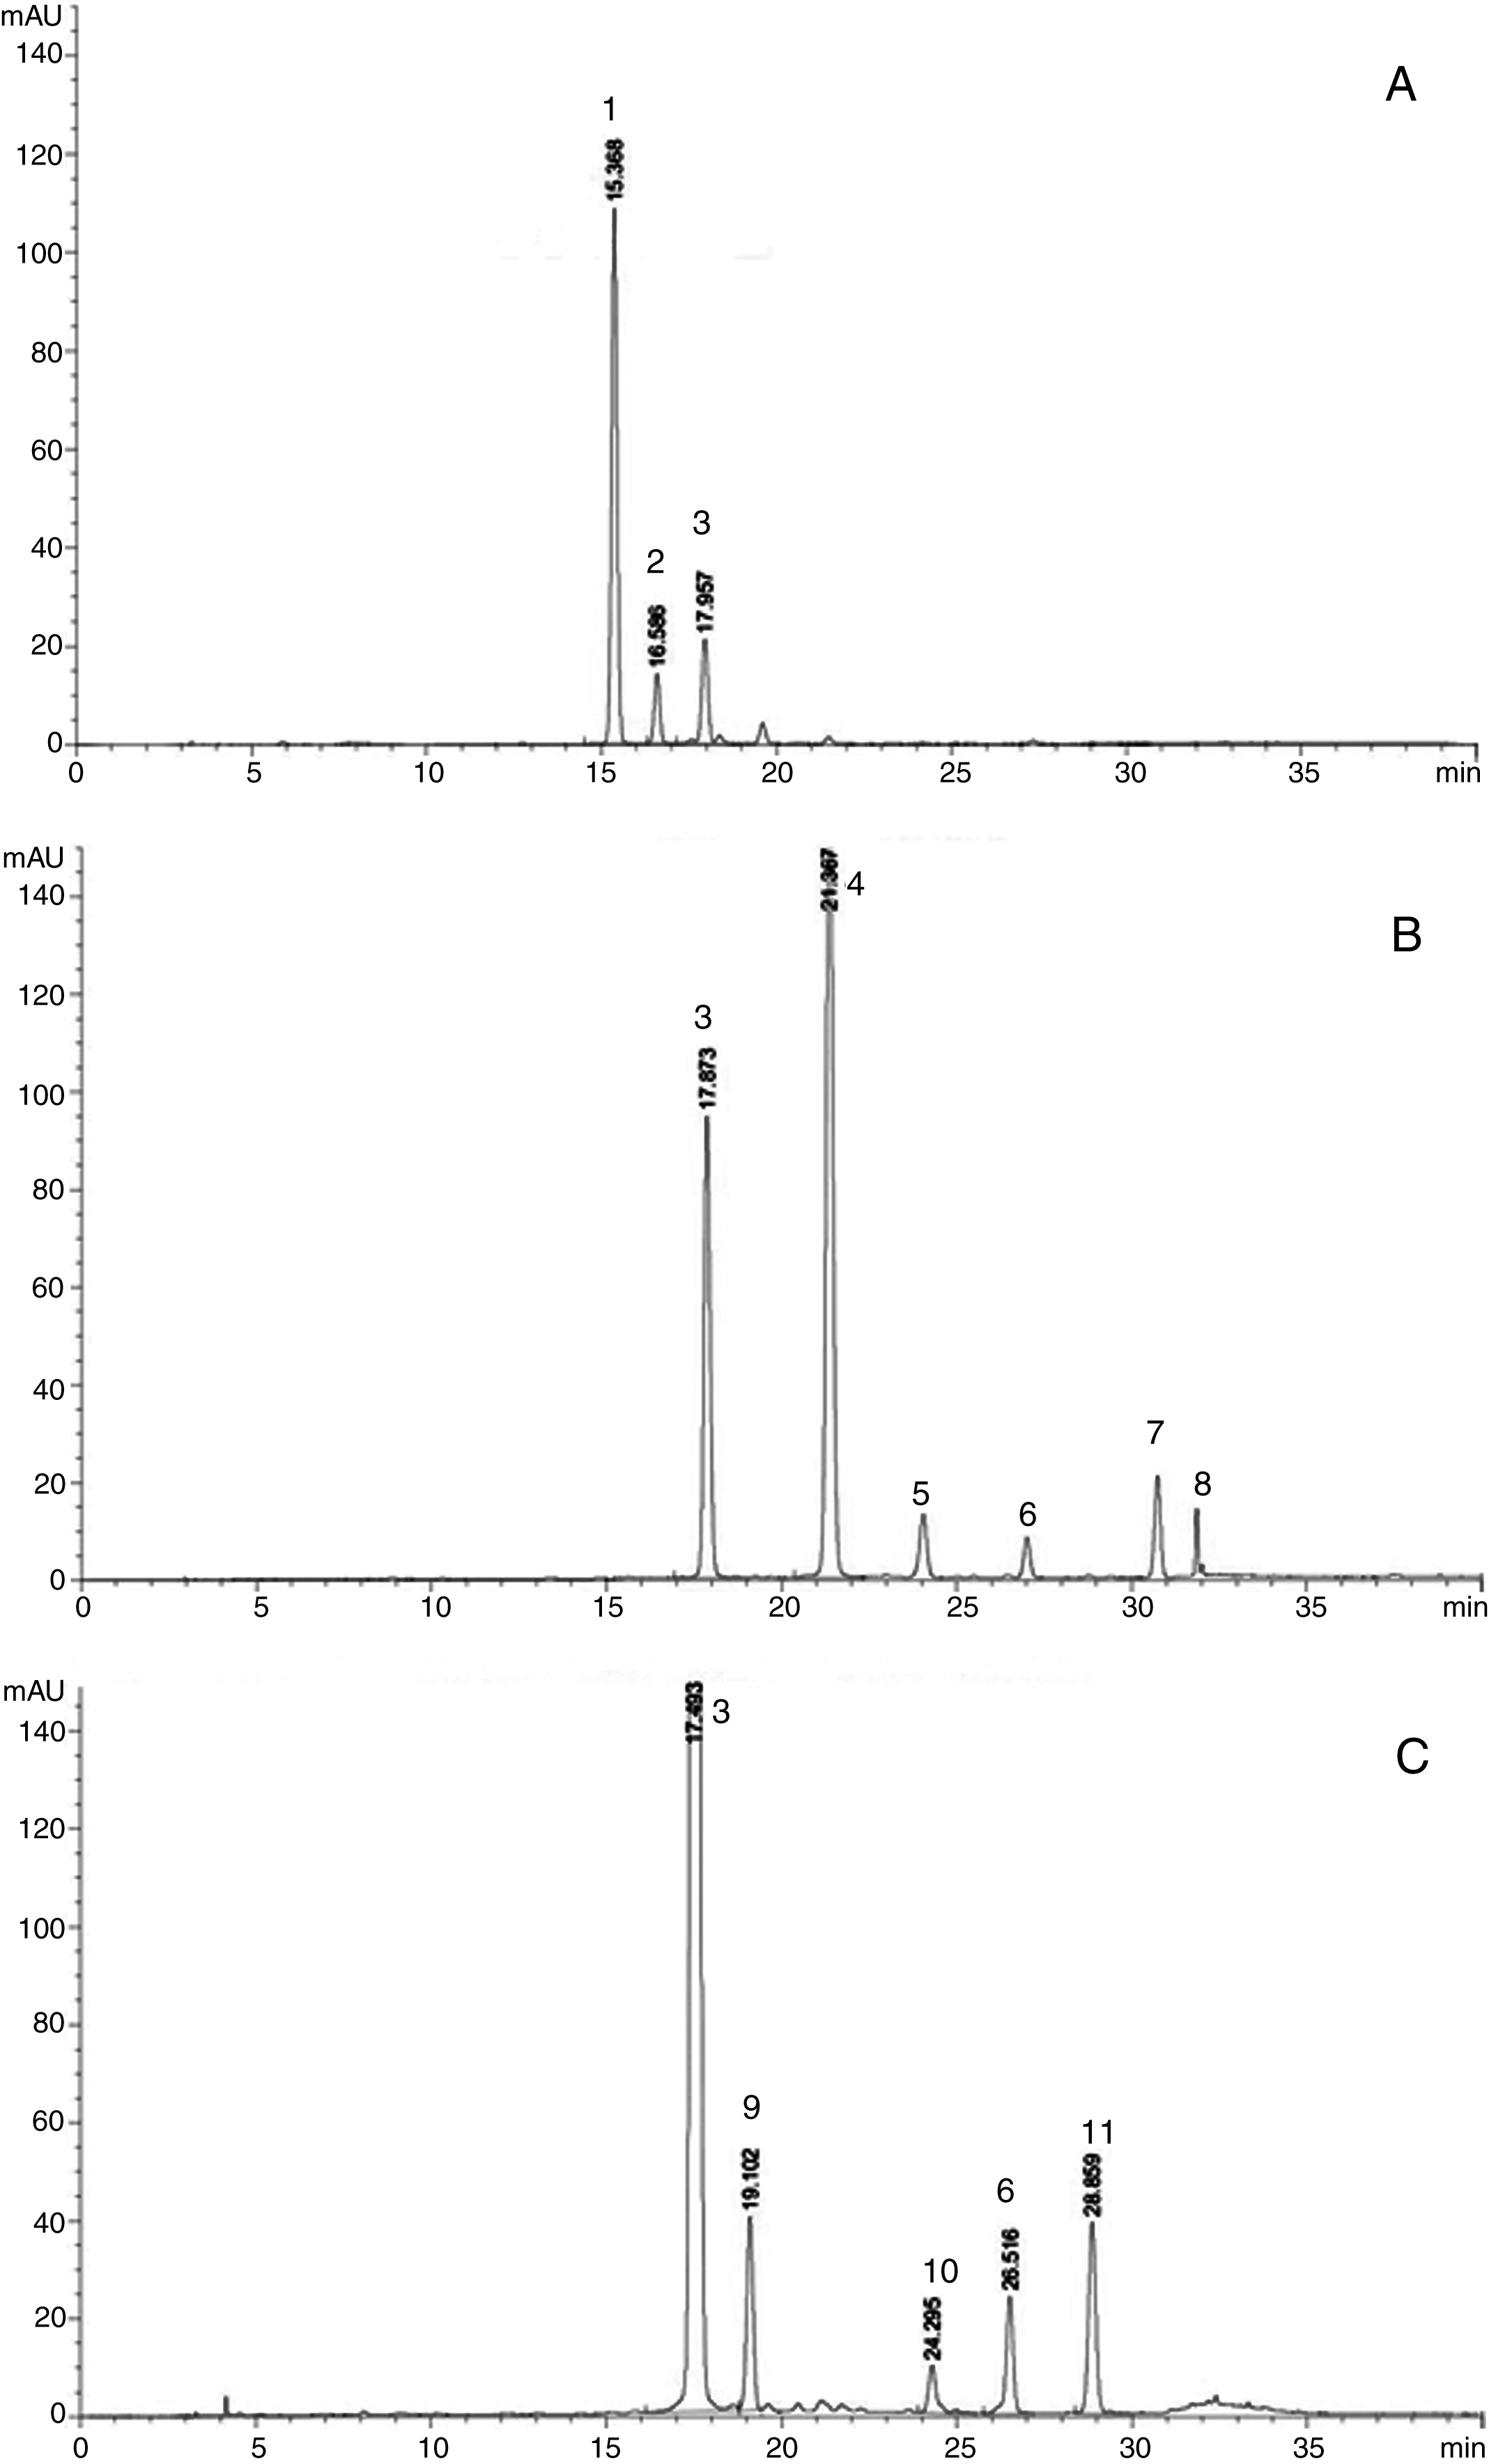
In woodland strawberry fruit extract, two major peaks and four minor ones were detected and identified, based on their respective UV-Vis absorption spectra, the chromatographic retention times of the standards and a previous report of anthocyanins [21]. Pelargonidin 3-O-glucoside (peak 4), and cyanidin 3-O-glucoside (peak 3) (Fig. 2, Panel B) were evident, while peaks 5−8 were putatively assigned to peonidin 3-O-glucoside, cyanidin 3-O-malonylglucoside, pelargonidin 3-O-malonylglucoside and peonidin 3-O-malonylglucoside, respectively, according to literature data [21]. The same profile was observed for the three growing conditions (T, S-T and Non-T).
In blackberry, a major peak was identified as cyanidin 3-O-glucoside (peak 3) and a minor peak as cyanidin 3-O-rutinoside (peak 9), based on their respective UV-Vis absorption spectra and the chromatographic retention times of authentic standards (Fig. 2, Panel C). Some additional minor peaks (6, 10 and 11) were putatively assigned to cyanidin 3-O-xyloside, cyanidin 3-O-malonylglucoside and the newly identified cyanidin 3-O-dioxalylglucoside, in agreement with previous reports on blackberry anthocyanins [22, 23].
The individual anthocyanin content was evaluated relative to the growing conditions. Table 2 shows the % variation of the main anthocyanins found in the studied berries, under the various growing conditions. Results indicated that shading (Non-T) affected the ratios of the individual anthocyanins, with a decrease in the dominant compound and an increase in the second most abundant. This trend was evident in strawberry. However, in raspberry, shading increased the second-ranking anthocyanin, cyanidin 3-O-glucoside but also the peak tentatively assigned to cyanidin 3-O-glucosyl rutinoside, being 8.5 and 8.7% in S-T and T, respectively, compared to 14.7% in Non-T. On the contrary, for blackberry under shaded conditions, the second most abundant anthocyanin (cyanidin 3-O-rutinoside) increased at the expenses of the other minor peaks (indicated as 6, 10 and 11, in Fig. 2).
Table 2
Anthocyanin peak comparison (as % peak areas at λ= 520 nm) for raspberry, strawberry and blackberry, grown in photovoltaic greenhouses under three different conditions§ (T, S-T, Non-T)
| % Area of the main anthocyanin | % Area of the second anthocyanin | |
| Cyanidin 3-O-sophoroside | Cyanidin 3-O-glucoside | |
| Raspberry (T) | 67.1±1.0 | 14.0±0.3 |
| Raspberry (S-T) | 59.6±0.1 | 20.0±0.2 |
| Raspberry (Non-T) | 52.5±0.7 | 17.3±0.1 |
| Pelargonidin 3-O-glucoside | Cyanidin 3-O-glucoside | |
| Strawberry (T) | 54.6±0.7 | 27.5±0.3 |
| Strawberry (S-T) | 55.6±1.4 | 29.5±0.5 |
| Strawberry (Non-T) | 50.8±1.1 | 33.8±0.3 |
| Cyanidin 3-O-glucoside | Cyanidin 3-O-rutinoside | |
| Blackberry (T) | 83.2±0.3 | 4.4±0.0 |
| Blackberry (S-T) | 85.4±0.1 | 3.2±0.1 |
| Blackberry (Non-T) | 85.1±0.1 | 6.9±0.1 |
§For T, S-T and Non-T description, see Table 1.
3.2Total anthocyanins relative to growing conditions
The total anthocyanins in extracts of the three, berry species grown under different conditions were determined by HPLC (Table 3). In raspberry, the anthocyanins ranged from a low of 2.3 mg g−1 in the high light (T) condition to ∼2.6 mg g−1 in shadow (Non-T) and a high 3.3 mg g−1 in medium-shadow (S-T). In strawberry, the values were similar for T and S-T light treatments (1.07 and 1.06 mg g−1, respectively), and lower than that observed for the shadow condition (∼1.6 mg g−1; Non-T). In blackberry, there was an increasing effect of shade on anthocyanin content, with ∼6.1 mg g−1 for high light (T), 8.9 mg g−1 for medium-shadow (S-T) and 9.8 mg g−1 for shadow (Non-T) conditions.
Table 3
Total anthocyanins, phenols and antioxidant capacity in raspberry, strawberry and blackberry fruit, from plants grown in photovoltaic greenhouses with different cover material
| Cover material§ | Value | Total anthocyanins (mg AntE° g–1 DW) | Total phenols (μg GAE g–1 DW) | Antioxidant activity (μmol TE g–1 DW) |
| Raspberry | ||||
| T | Mean | 2.33b | 8.25b | 130.17b |
| SD | 0.55 | 0.92 | 9.15 | |
| S-T | Mean | 3.31a | 11.35a | 177.84ab |
| SD | 0.1 | 0.68 | 16.76 | |
| Non-T | Mean | 2.59ab | 12.59a | 214.72a |
| SD | 0.42 | 0.34 | 43.31 | |
| Significance1 | * | *** | * | |
| Strawberry | ||||
| T | Mean | 1.07b | 12.59a | 180.02b |
| SD | 0.08 | 0.28 | 41.00 | |
| S-T | Mean | 1.06b | 10.53b | 169.33b |
| SD | 0.21 | 0.25 | 1.82 | |
| Non-T | Mean | 1.59a | 12.94a | 263.75a |
| SD | 0.31 | 1.69 | 15.02 | |
| Significance1 | * | * | ** | |
| Blackberry | ||||
| T | Mean | 6.06c | 17.75c | 238.56b |
| SD | 0.16 | 2.01 | 6.75 | |
| S-T | Mean | 8.92b | 28.75a | 318.83a |
| SD | 0.33 | 0.28 | 14.63 | |
| Non-T | Mean | 9.82a | 21.98b | 253.86b |
| SD | 0.31 | 1.13 | 17.08 | |
| Significance1 | *** | *** | *** | |
§For T, S-T and Non-T description, see Table 1. °‘mg AntE’ means cyanidin 3-O-sophoroside equivalents (for raspberry) or keracyanin equivalents (KE) (for strawberry and blackberry). Mean values±standard deviation (SD) are expressed on a dry weight (DW) basis as anthocyanin equivalents° for anthocyanins, as gallic acid equivalents (GAE) for phenols, and as Trolox equivalents (TE) for antioxidant activity. 1 ***, ** and * significant at P≤0.001, 0.01 and 0.05, respectively. For each parameter, the same letters in the same column indicate that mean values are not significantly different (P = 0.05).
Anthocyanins are important health-promoting pigments that make a major contribution to the quality of fruit, vegetables and derived food products [24, 25]. These coloured compounds can be considered markers of ripening, as most fruit accumulate anthocyanins only in their ripening stages. Apart from the genetic background, which primarily influences the anthocyanin content of plant tissues, environmental factors including temperature, light conditions, nutritional status and biotic stresses can cause qualitative and quantitative changes in the composition of polyphenolic compounds [26]. However, the influence of environmental factors (i.e. light and temperature) on the accumulation of bioactive compounds in fruit, is inconsistent, both because of the difficulties in managing these multi-faceted agronomic studies and inability to directly compare the growing conditions (i.e. different latitude cultivation vs protected cultivation in one single site).
The biosynthesis of anthocyanins has been well characterised, and the key regulatory genes that control the pathway have been isolated in many plant species [27]. Light-regulated anthocyanin biosynthesis and distribution are associated with light perception and signal transduction through the light-inducible R2R3-MYB transcription factors [28]. Recently, new insight into anthocyanin biosynthesis in fruit has been gathered, regarding both environmental and developmental regulation [29]. Studies revealed that light exposure mainly has positive effects on anthocyanin concentration. Light exposure (within certain limits) increases, while shading decreases, the anthocyanin content in fruit [26–30]. Nevertheless, in grape, it has been found that intense sunlight caused excessive sunburn in exposed berries and reduced the anthocyanin accumulation [31]. In another study, involving fruit-zone leaf removal, the increased sunlight exposure caused sunburn damage and reduced anthocyanin accumulation [32].
The temperature during fruit development is an important factor that affects fruit quality. Fruit colour is the result of anthocyanin biosynthesis and its degradation. When dealing with the effect of light exposure on anthocyanin accumulation, the ‘temperature effect’ must also be considered. Primarily, the anthocyanin concentration is positively correlated with temperature, at least up to 25°C [33]. Thus, temperatures below 25°C favour anthocyanin biosynthesis, whereas high temperatures, such as 35°C, are associated with anthocyanin degradation and inhibition of anthocyanin accumulation [34–36]. Studies of apples and pears demonstrated that below 10°C, biosynthesis and degradation proceed at a low rate, between 10 and 20°C biosynthesis exceeds degradation and above 30°C, degradation dominates over synthesis [37, 38]. Again, in an apple study, high temperatures (30−35°C) were shown to decrease anthocyanin content in the skin [39].
In strawberry, contradictory results are reported. High temperatures were associated with redder berries and an increased anthocyanin content [40, 41], probably because those temperatures did not exceed the temperatures that promote anthocyanin degradation. On the contrary, in strawberry ‘Sachinoka’ fruit, a high air temperature was shown to cause poor fruit colouration, as the anthocyanin content decreased [42]. Moreover, the expression of the flavonoid pathway genes was lowered, displaying a pattern of expression that corresponded to anthocyanin concentration [42]. In grape, a high temperature up-regulated the expression level of MYB4, a repressor of UDP-glucose: flavonoid 3-O-glucosyltransferase (UFGT), critical for anthocyanin biosynthesis [26, 27]. Thus, for the maximum production of anthocyanins in grape berries, moderate sunlight exposure is necessary, but the extent varies among different cultivars.
From the temperature variation inside the PVG during the berries development, shading reduced the air temperature by ∼1°C on average (from T to S-T, and from S-T to Non-T, respectively). The mean air temperatures reported in Table 1 are the medium between the night and day temperatures. Nevertheless, the daily temperatures in T were always above 35°C, whereas, in S-T and Non-T, they were around 30 and 27°C, respectively, throughout the growing cycle (April−June) (data not reported). Therefore, the highest temperature registered in the T condition, even though it had a high light exposure (i.e. elevated biosynthesis of anthocyanins), exhibited a physiologically adverse influence on anthocyanin accumulation. As reported in grape [26], in the current study, raspberry, strawberry and blackberry produced fewer anthocyanins under high light (and high temperature) conditions (Table 3).
Given poor fruit colouration often reduces the market price, cultivation techniques that overcome high temperature-mediated colour suppression are valuable to commercial producers. Moreover, during the last 10 years, considerable evidence of the health benefits of anthocyanins has been experimentally reported and extensively reviewed, and mechanisms other than antioxidant ability are thought to be implicated in their health properties [24, 43].
3.3Total phenols and TEAC antioxidant activity
As reported in Table 3, in raspberry, the total phenols ranged from a low 8.2 μg g−1 DW (T) to 11.3 and 12.6 μg g−1 DW (S-T and Non-T, respectively). For strawberry, the total phenols ranged from a low 10.5 μg g−1 DW (S-T) to 12.6 and 12.9 μg g−1 DW (T and Non-T, respectively). In blackberry, the total phenols increased from 17.7 μg g−1 DW in high light (T), to ∼22 μg g−1 DW in shade (Non-T) and 28.7 μg g−1 DW in medium light (S-T).
Among the T, S-T and Non-T conditions, in raspberry, the anthocyanins were maximised under S-T, while most phenols were detected under S-T and Non-T. Also, in strawberry, the anthocyanins and phenols were higher in Non-T, and in blackberry, the anthocyanins were maximised in Non-T, while most phenols were detected under S-T conditions. This trend was also found for the TEAC antioxidant capacity. It is well established that antioxidant capacity correlates better with polyphenols than with anthocyanins [44].
The highest TEAC antioxidant activity for both, raspberry and strawberry, was recorded in shaded conditions (Non-T), whereas, for raspberry, it did not correspond to the condition where anthocyanin content was maximised (S-T). This feature could be due to the two different antioxidant contributors usually present in raspberry, ascorbic acid and ellagitannins, which are reported to increase in cold temperature growing conditions, such as in northern latitude climates [33, 45, 46]. Strawberry is documented to have a minor ellagitannin content compared to raspberry [10]. Hence, it can be hypothesised that anthocyanins largely contributed to the high antioxidant activity recorded under the shaded condition (Non-T). Regarding ascorbic acid, it seems that our samples were deficient in this antioxidant compound, due to indirect observations that the decrease in the colourimetric value (F−C assay) after thermal treatment at 80°C for 2 h, was less than 5%, at least for raspberry (data not shown) [18]. Moreover, it has been reported that although raspberry is rich in ascorbic acid, the main contributors to its antioxidant capacity are phenolic compounds [33].
In blackberry, the best condition for maximal phenol compounds and TEAC antioxidant activity was the S-T PV module. Again, the maximum TEAC antioxidant activity was not linked to the condition where anthocyanin content was maximised (Non-T) but, instead, where substantial amounts of phenols were biosynthesised (S-T). Also, ellagitannins are reported to be the major antioxidant contributor under these conditions [47]. After all, it is well known that while strawberry prefers a woodland habitat, blackberry colonises open, marginal fields.
The ranking of TEAC antioxidant activity in the three species agrees with the report of [48]: blackberry > strawberry > raspberry. Our results on TEAC antioxidant capacity in berry grown under different light (and consequently different temperature) conditions indicated that under the T condition (where a high temperature is recorded), the antioxidant capacity of the fruit extracts is decreased (Table 3).
3.4Organic acids and sugars
Sugar content is an important quality parameter of fruit, and the quantities of the sugars and organic acids, and their interactions are related to the flavour quality of fruit [49]. Citric acid was the predominant organic acid in raspberry and strawberry, while a lower amount of organic acids, including citric and malic acids, was detected in blackberry (Table 4). A reduction of PPFD led to an increase in tartaric, malic, succinic and shikimic acids in raspberry, of citric acid in strawberry and of tartaric and malic acids in blackberry; shading had no significant effect on the remaining values (Table 4). These results are consistent with earlier studies that found a negative correlation between radiation intensity and organic acid accumulation in tomato and strawberry [4, 41, 50]. The literature states that organic acids aid to stabilise anthocyanins [51]. Hence, the accumulation of organic acids, together with the lower mean air temperature under the Non-T condition, could explain the increased anthocyanin content in berries grown under shading (Table 3).
Table 4
Organic acid content in raspberry, strawberry and blackberry fruit, from plants grown in photovoltaic greenhouses with different cover material
| Raspberry | ||||||
| Cover material§ | Value | Citric | Tartaric | Malic | Succinic | Shikimic |
| (g 100 g–1 DW) | (mg 100 g–1 DW) | |||||
| T | Mean | 12.70 | 0.396b | 0.511b | 0.300c | ND |
| SD | 1.91 | 0.006 | 0.081 | 0.069 | – | |
| S-T | Mean | 11.24 | 0.386b | 0.383c | 0.430b | ND |
| SD | 0.54 | 0.013 | 0.025 | 0.034 | – | |
| Non-T | Mean | 12.75 | 0.746a | 0.768a | 0.904a | 4.04 |
| SD | 0.51 | 0.039 | 0.032 | 0.043 | 0.26 | |
| Significance | NS | *** | *** | *** | *** | |
| Strawberry | ||||||
| Cover material | Value | Citric | Tartaric | Malic | Shikimic | Fumaric |
| (g 100 g–1 DW) | (mg 100 g–1 DW) | |||||
| T | Mean | 8.75b | 0.516 | 1.42 | 7.25 | 14.55b |
| SD | 0.20 | 0.153 | 0.10 | 0.34 | 0.38 | |
| S-T | Mean | 7.91c | 0.375 | 1.32 | 7.99 | 11.94c |
| SD | 0.15 | 0.036 | 0.08 | 0.78 | 0.03 | |
| Non-T | Mean | 10.30a | 0.523 | 1.25 | 8.68 | 16.31a |
| SD | 0.09 | 0.006 | 0.16 | 1.17 | 0.30 | |
| Significance | *** | NS | NS | NS | *** | |
| Blackberry | ||||||
| Cover material | Value | Citric | Tartaric | Malic | Succinic | Shikimic |
| (g 100 g–1 DW) | (mg 100 g–1 DW) | |||||
| T | Mean | 3.93 | 0.621b | 2.88c | 1.04b | 5.08 |
| SD | 0.18 | 0.058 | 0.22 | 0.08 | 0.31 | |
| S-T | Mean | 3.97 | 0.938a | 3.55b | 1.32a | 4.50 |
| SD | 0.21 | 0.037 | 0.22 | 0.08 | 0.17 | |
| Non-T | Mean | 3.95 | 0.951a | 5.06a | 0.94b | 5.23 |
| SD | 0.09 | 0.033 | 0.10 | 0.03 | 0.26 | |
| Significance | NS | *** | *** | ** | NS | |
§For T, S-T and Non-T description, see Table 1. Significance: NS, not significant; ***P≤0.001 and **P≤0.01 significance. For each parameter, the same letters in the same column indicate that mean values are not significantly different (P = 0.05). Mean values±standard deviation (SD) are expressed as dry weight (DW) basis. ND = not detected.
Glucose and fructose concentrations of raspberries grown under different PPFD conditions remained unaffected, likewise, for fructose in blackberry. In strawberry, both sugars were statistically higher under the S-T condition, while in blackberry, glucose was lower for the S-T than T and Non-T conditions (Table 5). This behaviour is consistent with [4] for tomato, where reduction of solar intensity did not affect sugar concentration, but contrary to [52] for strawberry, where shading treatment resulted in a reduction of glucose and fructose, compared with the unshaded treatment. As mentioned above, the ‘temperature’ factor contributes to the ‘light’ factor response. Hence, even if increased light means increased photosynthetic biosynthesis of sugars [40], a negative correlation between temperature and soluble solids content/total acidity has been reported in strawberry [45, 50]. Therefore, no reduction of sugar content in berry grown under increasing shading may result from the negative effect of the high temperature measured in T greenhouse (Table 1).
Table 5
Glucose and fructose contents in raspberry, strawberry and blackberry fruit, from plants grown in photovoltaic greenhouses with different cover material
| Cover material§ | Value | Glucose | Fructose |
| (g 100 g–1 DW) | |||
| Raspberry | |||
| T | Mean | 10.37 | 10.39 |
| SD | 1.51 | 1.28 | |
| S-T | Mean | 8.45 | 10.71 |
| SD | 0.68 | 0.28 | |
| Non-T | Mean | 10.03 | 10.81 |
| SD | 0.88 | 0.37 | |
| Significance | NS | NS | |
| Strawberry | |||
| T | Mean | 20.90b | 25.25b |
| SD | 0.85 | 0.62 | |
| S-T | Mean | 23.03a | 27.50a |
| SD | 0.70 | 1.03 | |
| Non-T | Mean | 19.88b | 25.26b |
| SD | 0.07 | 0.42 | |
| Significance | ** | * | |
| Blackberry | |||
| T | Mean | 17.91a | 18.32 |
| SD | 0.21 | 0.59 | |
| S-T | Mean | 14.88b | 15.79 |
| SD | 1.12 | 1.72 | |
| Non-T | Mean | 20.28a | 22.02 |
| SD | 1.69 | 3.96 | |
| Significance | * | NS | |
§For T, S-T and Non-T description, see Table 1. Significance: NS, not significant; **P≤0.01 and *P≤0.05 significance. For each parameter, the same letters in the same column indicate that mean values are not significantly different (P = 0.05). Mean values±standard deviation (SD) are expressed on a dry weight (DW) basis.
4Conclusions
In this study, for the first time, some berry species were grown under PVGs with different shading area in comparison with a traditional greenhouse without PV modules. The different environmental conditions (light and temperature) of the PVGs affected the nutraceutical quality of the berries, driving a metabolic shift of the main polyphenolic compounds and also an altered ratio among the diverse anthocyanin structures. Total anthocyanins, phenols content and antioxidant capacity tended to increase in berries grown under shading. The sugars content was, largely, not negatively influenced by the shading. Conversely, the organic acids content, in some instances, increased along with the shading percentage.
Bioactive compounds, mainly polyphenols, present in berries, are thought to be responsible for their health benefits [53]. Therefore, it is valuable to define the optimal environmental conditions to maximise polyphenol biosynthesis [54]. From this study, it could be concluded that it is possible to combine greenhouse production of high-quality berries (with a particular focus on polyphenols) with the production of renewable energy, in a context of sustainable agriculture. Moreover, the results of the present study suggest that greenhouses, 100% covered with PV modules, can also be used for the cultivation of the targeted crop, such as berry species. This feature confirms that the percentage limit of PVGs shading required by some local laws is not based on scientific evaluation of the agricultural performances but only on empirical assessments. Nevertheless, more agronomic information is needed before any large-scale cultivation of berries under PVGs, to optimise renewable energy production without negatively influencing crop performance.
Acknowledgments
This research was supported by the Italian Ministry of Agricultural and Forestry Policies within the research project “Improvement of plant production performance with soilless systems under greenhouse covered with semi-transparent photovoltaic modules (Hortisolar)”.
References
[1] | Castellano S . Photovoltaic greenhouses: Evaluation of shading effects and its influence on agriculture performances. J Agric Eng. (2014) ;45: (4):168–75. doi: 10.4081/jae.2014.433 |
[2] | Yano A , Furue A , Kadowaki M , Tanaka T , Hiraki E , Miyamoto M , et al. Electrical energy generated by photovoltaic modules mounted inside the roof of a north–south oriented greenhouse. Biosyst Eng. (2009) ;103: (2):228–38. |
[3] | Buttaro D , Renna M , Gerardi C , Blando F , Santamaria P , Serio F . Soilless production of wild rocket as affected by greenhouse coverage with photovoltaic modules. Acta Sci Pol Hortorum. (2016) ;15: (2):129–42. |
[4] | Kläring HP , Krumbein A . The effect of constraining the intensity of solar radiation on the photosynthesis, growth, yield and product quality of tomato. J Agron Crop Sci. (2013) ;199: :351–59. |
[5] | Yano A , Onoe M , Nakata J . Prototype semi-transparent photovoltaic modules for greenhouse roof applications. Biosyst Eng. (2014) ;122: :62–73. |
[6] | Castellano S , Santamaria P , Serio F . Photosynthetic photon flux density distribution inside photovoltaic greenhouses, numerical simulation, and experimental results. Appl Eng Agric. (2016) a;32: :861–69. |
[7] | Regione Sardegna (2010). Decreto N. 1820/DecA/73 del 20/07/2010. Available: http://www.regione.sardegna.it/documenti/1_22_20100720131025.pdf |
[8] | Regione Puglia (2012). B.U.R.P. - n. 20 del 20/02/2012, pages 3623-3629. Available: http://www.sanita.puglia.it/portal/page/portal/SAUSSC/Aziende%20Sanitarie/AZIENDE%20OSPEDALIERE/Azienda%20Ospedaliero%20Universitaria%20Consorziale%20Policlinico/Organo%20di%20Indirizzo/N20_08_02_12[1.pdf] |
[9] | Barizza E , Guzzo F , Fanton P , Lucchini G , Sacchi GA , Lo Schiavo F , et al. Nutritional profile and productivity of bilberry (Vaccinium myrtillus L.) in different habitats of a protected area of the eastern Italian Alps. J Food Sci. (2013) ;78: (5):.673–8. doi: 10.1111/1750-3841.12120 |
[10] | Tulipani S , Mezzetti B , Capocasa F , Bompadre S , Beekwider J , Ric de Vos CH , et al. Antioxidants, phenolic compounds, and nutritional quality of different strawberry genotypes. J Agric Food Chem. (2008) ;56: (3):696–704. doi: 10.1021/jf0719959 |
[11] | Battino M , Beekwilder J , Denoyes-Rothan B , Laimer M , McDougall GJ , Mezzetti B . Bioactivies of berries relevant to human health. Nutr Rev. (2009) ;67: :145–50. |
[12] | Caruso MC , Galgano F , Tolve R , Pecora M , Tedesco I , Favati F , et al. Nutraceutical properties of wild berry fruits from Southern Italy. J Berry Res. (2016) ;6: (3):321–32. doi: 10.3233/jbr-160140 |
[13] | Johnson CM , Stout PR , Broyer TC , Carlton AB . Comparative chlorine requirements of different plant species. Plant Soil. (1957) ;8: :337–53. |
[14] | Castellano S , Santamaria P , Serio F . Solar radiation distribution inside a monospan greenhouse with the roof entirely covered by photovoltaic panels. J Agric Eng. (2016) b;47: :1–6. |
[15] | Gerardi C , Tommasi N , Albano C , Blando F , Pinthus E , Rescio L , et al. Prunus mahaleb L. fruit extracts: A novel source for natural pigments. Eur Food Res Technol. (2015) ;241: (5):683–95. |
[16] | Re R , Pellegrini N , Proteggente A , Pannala A , Yang M , Rice-Evans C . Antioxidant activity applying an improved ABTS radical cation decolorization assay. Free Radic Biol & Med. (1999) ;26: :1231–37. |
[17] | Blando F , Albano C , Yazheng L , Nicoletti I , Corradini D , Tommasi N , et al. Polyphenolic composition and antioxidant activity of the underutilized Prunus mahaleb L. fruit. J Sci Food Agric. (2016) ;96: (8):2641–49. doi: 10.1002/jsfa.7381 |
[18] | Georgé S , Brat P , Alter P , Amiot MJ . Rapid determination of polyphenols and vitamin C in plant-derived products. J Agric Food Chem. (2005) ;53: :1370–73. |
[19] | Pirogovskaia T , Kempler C , Kitts DD , Lund ST . Phenotypic diversity in antioxidant phytochemical composition among fruits from several genotypes of red raspberry (Rubus idaeus L.). J Berry Res. (2012) ;2: :229–38. |
[20] | de Ancos B , Gonzalez E , Cano MP . Differentiation of raspberry varieties according to anthocyanin composition. Eur Food Res Technol. (1999) ;208: :33–8. |
[21] | Sun J , Liu X , Yang T , Slovin J , Chen P . Profiling polyphenols of two diploid strawberry (Fragaria vesca) inbred lines using UHPLC-HRMSn. Food Chem. (2014) ;146: :289–98. |
[22] | Fan-Chiang H-J , Wrolstad R . Anthocyanin pigment composition of blackberries. J Food Sci. (2005) ;70: (3):C198–C201. |
[23] | Stintzing FC , Stintzing AS , Carle R , Wrolstad RE . A novel zwitterionic anthocyanin from evergreen blackberry (Rubus laciniatus Willd.). J Agric Food Chem. (2001) ;50: :396–99. |
[24] | Tsuda T . Dietary anthocyanin-rich plants: Biochemical basis and recent progress in health benefits studies. Mol Nutr Food Res. (2012) ;56: :159–70. |
[25] | Gerardi C , Albano C , Calabriso N , Carluccio MA , Durante M , Mita G , et al. Techno-functional properties of tomato puree fortified with anthocyanin pigments. Food Chem. (2018) ;240: :1184–92. |
[26] | Azuma A , Yakushiji H , Koshita Y , Kobayashi S . Flavonoid biosynthesis-related genes in grape skin are differentially regulated by temperature and light conditions. Planta. (2012) ;236: :1067–80. |
[27] | Quattrocchio F , Baudry A , Lepiniec L , Grotewold E . The regulation of flavonoid biosynthesis. In: Grotewold E editor. The Science of Flavonoids. New York: Springer, Science+Business Media; (2006) , pp. 97–122. |
[28] | Zoratti L , Karppinen K , Luengo Escobar A , Haggman H , Kaakola L . Light-controlled flavonoid biosynthesis in fruits. Front Plant Sci. (2014) ;5: :534. doi: 10.3389/fpls.2014.00534 |
[29] | Jaakola L . New insights into the regulation of anthocyanin biosynthesis in fruits. Trends Plant Sci. (2013) ;18: (9):477–83. doi: 10.1016/j.tplants.2013.06.003 |
[30] | Takos AM , Jaffé FW , Steele RJ , Bogs J , Robinson SP , Walker AR . Light-induced expression of a MYB gene regulates anthocyanin biosynthesis in red apples. Plant Physiol. (2006) ;142: :1216–32. |
[31] | Spayd SE , Tarara JM , Mee DL , Ferguson JC. Separation of sunlight and temperature effects on the composition of Vitis vinifera cv. Merlot berries. Am J Enol Viticult. (2002) ;53: (3):171–82. |
[32] | He F , Mu L , Yan G-L , Liang N-N , Pan Q-H , Wang J , et al. Biosynthesis of anthocyanins and their regulation in colored grapes. Molecules. (2010) ;15: :9057–91. |
[33] | Remberg SF , Sønsteby A , Aaby K , Heide OM . Influence of post-flowering temperature on fruit size and chemical composition of Glen Ample raspberry (Rubus idaeus L.). J Agric Food Chem. (2010) ;58: :9120–28. |
[34] | Maccarone EA . Stabilization of anthocyanins of blood orange fruit. J Food Sci. (1985) ;50: :901–4. |
[35] | Shahidul IM , Jalaluddin M , Garner JO , Yoshimoto M , Yamakawa O . Artificial shading and temperature influence on anthocyanin compositions in sweet potato leaves. HortSci. (2005) ;40: :176–80. |
[36] | Costa RC , Calvete EO , Bordigno CLJ , Francescatto V , Reginatto FH . Chemical analysis of strawberry fruit grown in a protected greenhouses under different shading screens. Acta Hortic. (2012) ;926: :509–15. |
[37] | Steyn WJ , Holcroft DM , Wand SJE , Jacobs G . Anthocyanin degradation in detached pome fruit with reference to preharvest red color loss and pigmentation patterns of blushed and fully red pears. J Am Soc Hortic Sci. (2004) ;129: (1):13–9. |
[38] | Curry EA . Temperatures for optimal anthocyanin accumulation in apple tissue. J Hortic Sci. (1997) ;72: :723–29. |
[39] | Lin-Wang K , Micheletti D , Palmer J , Volz R , Lozano L , Esplay R , et al. High temperature reduces apple fruit colour via modulation of the anthocyanin regulatory complex. Plant Cell Environ. (2011) ;34: :1174–90. |
[40] | Hoppula KB , Karhu ST . Strawberry fruit quality responses to the production environment. J Food Agric & Environ. (2006) ;4: (1):166–70. |
[41] | Wang SY , Zheng W . Effect of plant growth temperature on antioxidant capacity in strawberry. J Agric Food Chem. (2001) ;49: :4977–82. |
[42] | Matsushita K , Sakayori T , Ikeda T . The effect of high air temperature on anthocyanin concentration and the expression of its biosynthetic genes in strawberry ‘Sachinoka’. Environ Control Biol. (2016) ;54: (2):101–7. |
[43] | Li D , Wang P , Luo Y , Zhao M , Chen F . Health benefits of anthocyanins and molecular mechanisms: Update from recent decade. Crit. Rev Food Sci Nutr. (2015) ;57: (8):1729–41. DOI: 10.1080/10408398.2015.1030064 |
[44] | Prior RL , Cao G , Martin A , Sofic E , McEwen J , O’Brien C , et al. Antioxidant capacity as influenced by total phenolic and anthocyanin content, maturity, and variety of Vaccinium species. J Agric Food Chem. (1998) ;46: (7):2686–93. DOI: 10.1021/jf980145d |
[45] | Wang SY , Camp MJ . Temperatures after bloom affect plant growth and fruit quality of strawberry. Sci. Hortic. (2000) ;85: :183–99. |
[46] | Krüger E , Josuttis M . Effects of growing and climate conditions on berry yield and nutritional quality. Acta Hortic. (2014) ;1017:351–62. |
[47] | Vrhovsek U , Giongo L , Mattivi F , Viola R . A survey of ellagitannin content in raspberry and blackberry cultivars grown in Trentino (Italy). Eur Food Res Technol. (2008) ;226: :817–24. |
[48] | de Souza RV , Pereira PAP , da Silva TLT , de Oliveira Lima LC , Pio R , Queiroz F . Determination of bioactive compounds, antioxidant activity and chemical composition of Brazilian blackberry, red raspberry, strawberry, blueberry and sweet cherry fruits. Food Chem. (2014) ;156: :362–68. |
[49] | Mikulic-Petkovsek M , Koron D , Zorec Z , Veberic R . Do optimally ripe blackberries contain the highest levels of metabolites? Food Chem (2017) ;215: :41–9. |
[50] | Krüger E , Josuttis M , Nestby R , Toldam-Andersen TB , Carlen C , Mezzetti B . Influence of growing conditions at different latitudes of Europe on strawberry growth performance, yield and quality. J Berry Res. (2012) ;2: :143–57. |
[51] | Cordenusi BR , Nascimento JRO , Lajolo FM . Physico-chemical changes related to quality of five strawberry fruit cultivars during cool-storage. Food Chem. (2003) ;83: (2):167–73. |
[52] | Watson R , Wright CJ , McBurney T , Taylor AJ , Linforth RST . Influence of harvest date and light integral on the development of strawberry flavor compounds. J Exp Bot. (2002) ;53: :2121–29. doi: 10.1093/jxb/erf088 |
[53] | Forbes-Hernandez TY , Gasparrini M , Afrin S , Bompadre S , Mezzetti B , Quiles JL , et al. The healthy effects of strawberry polyphenols: Which strategy behind antioxidant capacity? Crit Rev Food Sci Nutr. (2016) ;56: :S46–S59. DOI: 10.1080/10408398.2015.1051919 |
[54] | Jaganath IB , Zainal A . Controlled environment for enhanced and consistent production of (poly)phenols in specialty crops. In: Asaduzzaman Md., editor. Controlled Environment Agriculture - Production of Specialty Crops Providing Human Health Benefits through Hydroponics. Nova Science Publishers, Hauppauge, NY, US; (2016) , pp. 1–42. |


