
Monitoring mechanical, color and anthocyanin changes during rehydration of raspberry-based products
Abstract
BACKGROUND:
Raspberry is a very popular berry, with a short postharvest life. Drying was proposed for obtaining different raspberry-based products. When rehydration is needed for foods direct consumption or use in composite products, a comprehensive understanding of the rehydration characteristics and quality attributes changes is necessary for a proper selection of processing.
OBJECTIVE:
The aim of the present work was to analyze the evolution of anthocyanin pigments and several physical properties upon rehydration of dried raspberries.
METHODS:
Raspberries were dehydrated (air- and freeze-drying) with sugar infusion pretreatments, and then rehydrated at different temperatures. Rehydration kinetics and several quality parameters were analyzed.
RESULTS:
Pretreated dried samples showed a significantly reduced rehydratability, and preserved dried fruit firmness. Upon rehydration, anthocyanins retention range was 8–42% in control raspberries and 40–90% in pretreated samples. Freeze-dried fruits showed a rapid water uptake but could not restore the water lost upon drying. These samples exhibited a high retention of anthocyanins and color, and a soft texture. When raisin-like fruits are required, samples with pretreatments and further drying should be selected, since they better maintained texture characteristics during a short period of consumption (5–20 min); however, the anthocyanin content was lower than that for control samples. Both freeze- and air-dried control samples preserved the red hues, while maintaining the luminosity during rehydration.
CONCLUSIONS:
The evaluation of quality parameters of rehydrated raspberries, such as color, anthocyanin content, texture and volume, as well as the rehydration indices appeared to be useful to select the best drying and rehydration conditions.
Nomenclature
DI | dry infusion |
WI | wet infusion |
AC | citric acid |
B | sodium bisulphite |
F | freeze-dried |
A | air-dried |
C | control sample, without pretreatment |
aw | water activity |
X | water content (kg H2o/100 kg) |
d.b. | dry matter |
w.b. | wet matter |
RR | rehydration relationship |
RA | rehydration ability |
ACY | monomeric anthocyanin |
L* | luminosity |
C*ab | chroma |
hab | hue angle |
VR | volume recovery |
Fmax | peak force (N) |
k1 | Peleg parameter (kg d.b./kg H2o.min) |
k2 | Peleg parameter (kg d.b./kg H2o) |
α | Weibull parameter (dimensionless) |
β | Weibull parameter (1/min) |
r2 | determination coefficient |
RMSE | root mean square error |
χ2 | reduced chi square |
1Introduction
Raspberries are very labile fruits and have a short postharvest life due to their high respiration rate, loss of firmness and freshness, and susceptibility to darkness. Although the main destiny is the frozen market, the products have limited applications. Drying is a known method used to increase the shelf stability of fruits and vegetables. Although dried products can be consumed as a raspberry-based snack, sometimes they must be rehydrated for their direct consumption or use as an ingredient in different processes. However, product quality could be affected throughout processing stages, mainly fresh characteristics in terms of texture, color and nutritive value. Drying is an irreversible process due to starch gelation and/or cellulose crystallization and/or different moisture contents that produce cellular rigidity and/or protein denaturation. In raspberries, the high content of anthocyanin pigments is responsible for the attractive red color and also contributes to the antioxidant properties of the fruit [1]. However, these compounds are highly unstable and very susceptible to degradation [2] affecting product quality and therefore consumer acceptance. The main objective of a correct rehydration is to be able to reconstitute the dehydrated food in a way that is as close as possible to its fresh state.
It is important to consider that rehydration is not the reverse process of dehydration, since both phenomena take place through different mass transfer mechanisms and depend on several factors. Some authors consider that the rehydration includes three simultaneous stages: water absorption in the dry material, volume increase of the rehydrated product, and the leaching of soluble components [3]. Other authors consider rehydration is a simultaneous process of water transfer into the food and loss of solids to the liquid phase [4].
On the other hand, the selected dehydration method and the operative conditions chosen at the different stages of processing must be taken into account in order to achieve the desired quality criteria. For example, freeze-dried products are rehydrated at a higher rate than those subjected to hot air-drying due to differences in size, distribution and volume of the spaces in which gas is occluded [5, 6]. In addition, pretreatments applications before dehydration have a marked influence on the characteristics and composition of the rehydrated product. Previous studies have shown that the use of osmotic dehydration pretreatments, using sugar as an osmotic agent, affects the rehydration process in different ways, for example, it decreases rehydration rate of the impregnated fruit [7, 8]. In this sense, it is important to consider that certain sugars exhibit a protective behavior on the cell structure, not only during dehydration but also during subsequent rehydration, by modifying the phase transition conditions of membrane lipids [9]. Another aspect to consider is that a significant amount of soluble solids and pigments can migrate to the solution during rehydration, affecting the nutritional quality of the product and its capacity to absorb water [10]. Those pretreatments that contribute to maintain tissues integrity could reduce the solids loss. Ability of food products to reconstitute their original structure will depend on the internal structure and the damage degree of the main components that retain water (e.g. protein and starch) caused by dehydration [11].
Even though dehydration processes of fruits have been extensively studied, only few works [5, 12] have focused on the loss of quality parameters of products throughout rehydration. Among the most important quality aspects of a dehydrated food that has been rehydrated are the structural, optical (color and appearance), textural and nutritional properties. The evaluation of all or some of these properties depends on the parameters to be considered for a specific market.
The aim of the present work was to analyze the evolution of anthocyanin pigments and several physical properties upon rehydration of dried raspberries.
2Materials and methods
2.1Fruits
Frozen raspberries (Rubus idaeus L.) of Autumn Bliss cultivar grown in Plottier (Neuquén province, Argentina) were used. After harvest, fruits were immediately individually quick frozen (IQF process) and stored at –22°C. The selection of the fruit to be used for this work, as well as the characterization of the frozen fruit were carried out as previously described by Sette et al. [13].
2.2Treatments
Fruits were subjected to sugar infusion pretreatments and further air- or freeze-drying. Infusions were performed at room temperature in glass vessels (8×16 cm). Different systems were prepared by immersing the frozen fruits into a mixture (dry or wet) of sucrose (osmotic agent) and preservatives. Potassium sorbate and sodium bisulphite were used as antimicrobial agents during infusion; sodium bisulphite also acts as inhibitor of enzymatic and non-enzymatic browning. Citric acid was also added in order to favor red hues of anthocyanins. The amount of sugar and chemical agents used were determined according to the weight of the fruit (100 g) and the final levels required after equilibration of the components between the food system and the generated syrup during infusion (aw = 0.85). Three systems were prepared by using the methodology of Sette et al. [13]:
1) Dry infusion with citric acid and sodium bisulphite (DI-BAC): dry mixture of fruits and additives.
2) Wet infusion with citric acid and sodium bisulphite (WI-BAC): fruits immersed in an aqueous solution of additives.
3) Reference samples: frozen fruits.
Samples with and without pretreatments were then subjected to different drying processes (air- and freeze-drying) to reach a final aw value of 0.33 as described by Sette et al. [14]:
1) Freeze-drying (F): it was carried out in a freeze drier Alpha 1–4 LD/2-4 LD-2 (Martin Christ, Gefriertrocknungsanlagen GmbH, Osterode, Germany). It was operated at –55°C at a chamber pressure of 4 Pa.
2) Air-drying (A): an air convection oven model Venticell 111-Standard (MMM Medcenter Einrichtungen GMBH, Munich, Germany) was used (air at 60±1°C, ≈10% relative humidity and speed = 1–1.5 m/s).
The concentration of additives, both in dried fruits as well as in rehydrated fruits, did not exceed the maximum values according to the “Codex General Standard for Food Additives” (Codex STAN 192–1995).
2.3Rehydration process
Rehydration process was carried out in a thermostated water bath at 25, 40, and 60°C, using 1 g of dehydrated fruit in 20 mL of water. Rehydration curves were obtained by weighing the samples at different intervals until reaching a plateau and/or a decrease in weight gain. For physicochemical studies, three specific values of time were chosen: 5 min, 20 min and the end of rehydration process. Before weighing, samples were taken out from the water bath and placed on filter paper in order to remove the unbound water.
2.4Modeling of rehydration kinetics
Rehydration curves were mathematically described by using two empirical models: Peleg’s model and the Weibull distribution function. Peleg’s model is represented by the following equation:
(1)
where t is the drying time (min), X is the water content (kg water/kg dry matter) at time t, X0 is the initial water content (kg water/kg dry matter), k1 parameter (kg dry matter/kg water.min) is defined as the inverse of the water transfer rate at the beginning of the rehydration process and k2 (kg dry matter/kg water) is related to the maximum capacity of water [15], so that:
at t = 0 dX/dt = 1/k1
at t⟶∞ Xe = X0 + 1/k2
Weibull’s model is described by the following equation:
(2)
Where t is the drying time (min), Xe is the equilibrium water content (kg water/kg dry matter), α and β are the kinetic parameters of the model. β parameter (1/min) is analogous to k1 constant of Peleg’s model, since it measures the water absorption rate of the process when the superficial capillaries and cavities fill very fast. The shape parameter (α) (dimensionless) is an index of the product behavior during rehydration; it would be related to the different transport mechanisms that can take place such as diffusive, convective and relaxation mechanisms of the tissue matrix [15].
2.5Rehydration indices
In order to quantify the rehydration capacity of the dehydrated raspberries, two coefficients were calculated: the rehydration relationship (RR) and the rehydration ability (RA). The rehydration relationship (RR) was defined according to Wang and Chao [16] as:
(3)
The rehydration ability (RA) was defined according to Meda and Ratti [5] as:
(4)
Where mrh is the weight of rehydrated sample (kg), mdh is the weight of dehydrated sample (kg) and mo is the weight of the fresh sample (kg).
2.6Sample analysis
2.6.1Water content and water activity
The water content analysis was carried out according to the AOAC method [17]. Water activity (aw) was measured at 25°C with a psycrometer model Series 3 (Aqua-Lab, Decagon Devices Inc., Pullman, Washington, USA), calibrated with saturated saline aqueous solutions.
2.6.2Monomeric anthocyanin content (ACY)
Extracts were obtained according to Nikkhah et al. [18] with some modifications as previously described by Sette et al. [13]. ACY was determined using the pH-differential method [19]. The absorbance was measured at 510 and 700 nm using a UV–Vis spectrophotometer model 1700 (Metrolab Instruments, Buenos Aires, Argentina). The major phenolic component identified in the raspberry extracts was cyanidin-3-glucoside [20], therefore the monomeric anthocyanin content was calculated according to Eq. 5 and expressed as cyanidin-3-glucosideper 100 g of wet basis (w.b.).
(5)
Where,
MW = molecular weight of cyanidin-3-glucoside (445.2 g/mol)
DF = dilution factor
L = optical step (cm)
ɛ= molar extinction coefficient of cyanidin-3-glucoside (29.600 L/cm mol.).
2.6.3Color analysis
The superficial color of raspberries was determined by measuring tristimulus parameters (CIELAB color space) with a photocolorimeter model CR 400 (Minolta, Tokyo, Japan) using illuminant C and 2° observer angle. The instrument was calibrated (standardized) each time with a white ceramic plate. Measurements were performed in 10 rehydrated raspberries for each condition with two readings in the equatorial zone. The parameters L*, a*, b* of CIELAB color space were recorded. These numerical values were converted into “chroma” (C*ab) and “hue angle” (hab) using the following equations:
(6)
(7)
2.6.4Volume recovery (VR)
Measurements of sample volume change were performed in order to study the fruit swelling occurred during the rehydration process. Distilled water displacement in a pycnometer was used to estimate the volume as follows:
(8)
where: V = sample volume (l); Mm = sample weight (kg); Mp +w = weight of pycnometer with distilled water (kg); Mp +w +m = weight of pycnometer with distilled water containing the sample (kg); ρw= water density, corrected for temperature (kg/l).
The volume recovery following rehydration was calculated as follows:
(9)
where: V0 = fresh average volume (taken from 10 fresh raspberries) and V = volume of each raspberry after rehydration process. Volume recovery was determined in quintupled.
2.6.5Mechanical properties
A retro extrusion test was performed using an Instron universal testing machine Model 3344 (Instron Corporation, Canton, MA, USA), connected by a computer to the Instron Bluehill Material Testing Software. To this purpose, a cylindrical container of 95 mm height and 52 mm internal diameter, as well as a flat-cylindrical plunger of 45 mm diameter were used. Container was filled with 30 mm height of rehydrated raspberries. Compression test started when the plunger got in contact with product surface, and finished when the sample flowed up through the annulus between the plunger and the cell wall. The crosshead speed used in all experiments was 20 mm/min and the sensor scale was 0–5 kN. Force–distance curves were recorded during the test while the flat-cylindrical plunger descended through the sample bed of raspberries. The maximum peak force (Fmax) reflected the mechanical resistance during sample extrusion. The reported values correspond to the average of individual measurements of ten samples for each type of rehydrated raspberry.
2.7Statistical analysis
A completely randomized design was used. For all determinations, except for superficial color, volume recovery and mechanical properties, three replicates were measured. The results were expressed by mean and standard deviation of the mean (SD). An analysis of variance was performed to establish the presence or absence of significant differences in parameters according to the factors “rehydration temperature”, “type of infusion” and “drying method”. Multiple comparisons were carried out by using the Tukey test and significance level was set at p < 0.05. In the case of significant interactions between factors, the Tukey test was run for the interaction. For not significant interaction between factors, a Tukey test of main effects was performed. All statistical analyses were carried out using the data analysis software system STATISTICA version 8.0 (StatSoft, Inc., Tulsa, OK, USA).
The selected models were fitted to the rehydration curves, and the model parameters were determined by nonlinear least-squares regression analysis. The quality of fit was evaluated through the determination coefficient (r2), the root mean square error (RMSE) and the reduced chi square (χ2):
(10)
(11)
where: Xexp is the experimental water content and Xpre is the water content calculated with each model.
3Results and discussion
3.1Rehydration curves and fitting to the proposed models
Figure 1 shows the experimental rehydration curves obtained at different water temperatures (25°C, 40°C, and 60°C), and Table 1 shows the results of fitting the data with the Peleg’s model and the Weibull distribution function. For Weibull’s model, values of r2 > 0.98 and RMSE<0.05 were obtained in most cases; therefore, this model was selected for the representation of the predicted data in the figures. Several authors obtained similar results when studying the rehydration kinetics in different plant products like air-dried and freeze-dried carrots [21], air-dried mushrooms [22] and air-dried aloe vera [12].
Fig.1
Comparison of experimental and predicted rehydration curves of raspberries: experimental data (symbols) and prediction given by Weibull’s model (lines): (a) 25°C, (b) 40°C, (c) 60°C. Air-drying (empty symbols and dotted lines) and freeze-drying (filled symbols and continuous lines). C (circles), WI-BAC (triangles), DI-BAC (diamonds).
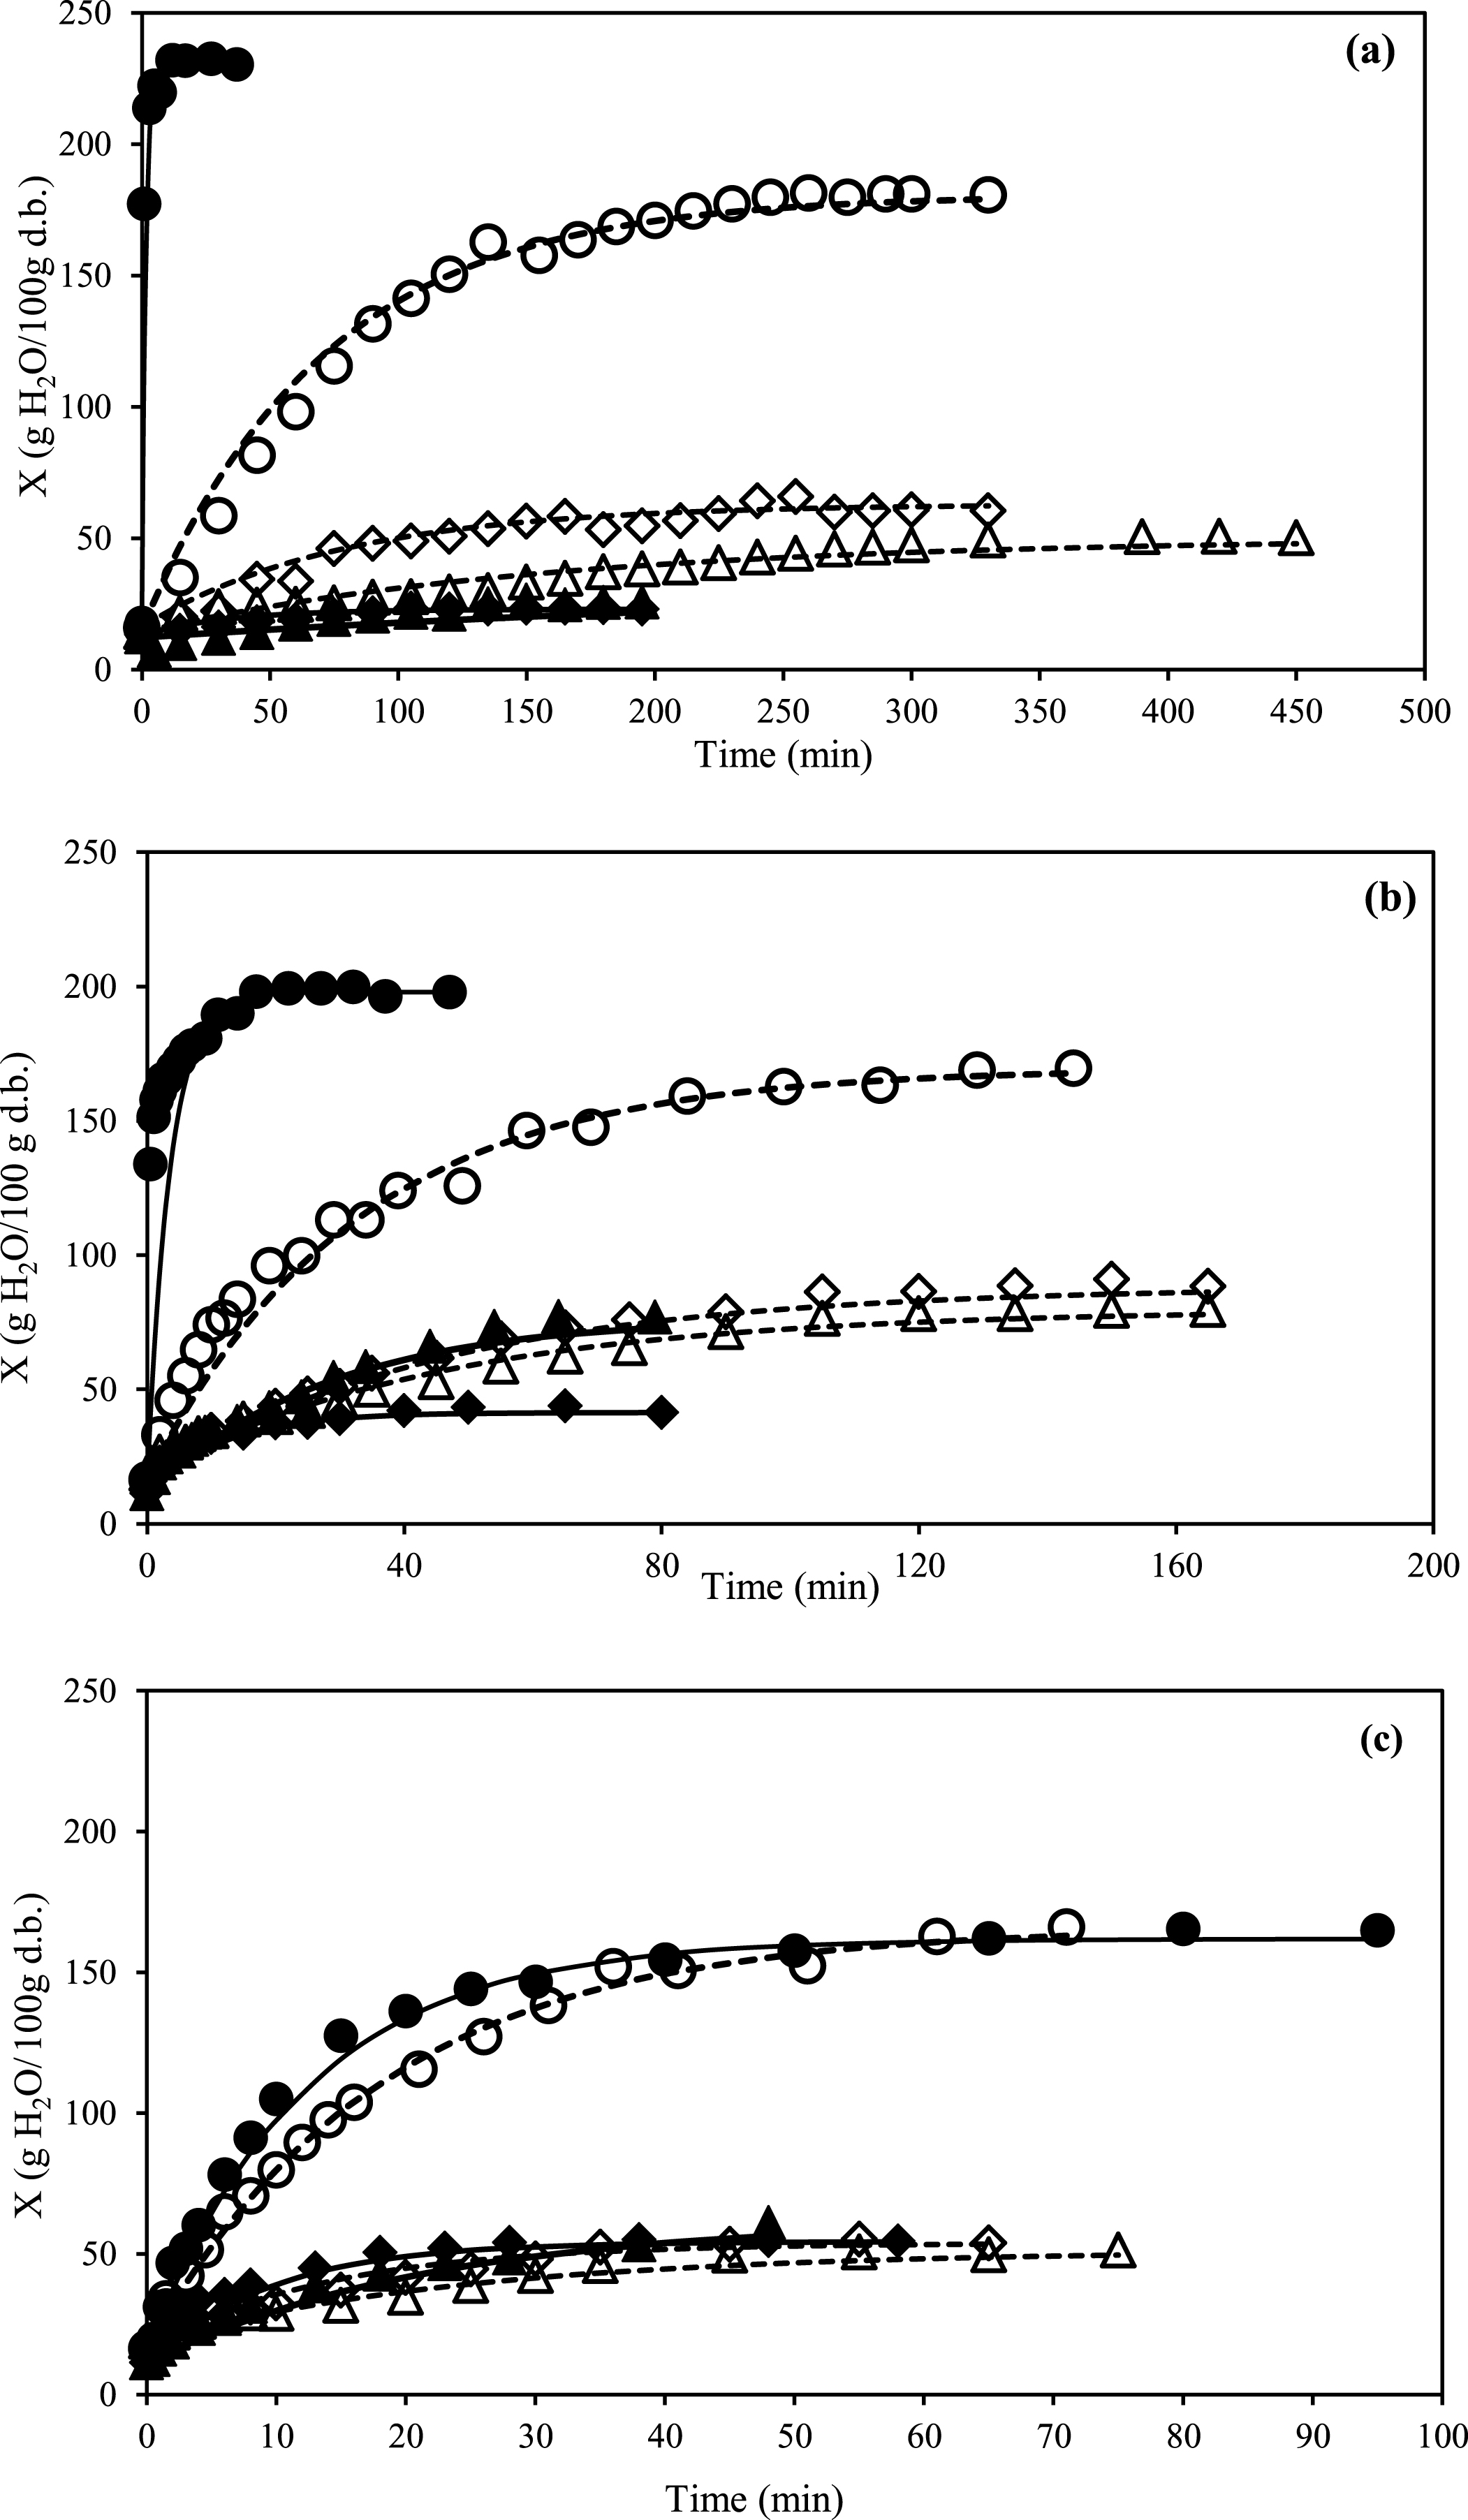
Table 1
Model parameters estimated from Eqations 1–2 and statistics used to evaluate the goodness of fit for each experimental condition
| PELEG MODEL | ||||||
| Samples | k1 | k2 | r2 | χ2 | RMSE | |
| 25°C | ||||||
| A | C | 0.56±0.08a | 0.0038±0.0005ab | 0.99 | 5.485 | 2.238 |
| WI-BAC | 5.27±0.09b | 0.016±0.003e | 0.97 | 3.705 | 1.849 | |
| DI-BAC | 7.2±0.2c | 0.0023±0.0002a | 0.98 | 4.452 | 2.012 | |
| F | C | 0.0033±0.0003a | 0.0056±0.0004abcd | 0.99 | 12.967 | 3.287 |
| WI-BAC | 6.9±0.9c | 0.007±0.002bcd | 0.97 | 1.588 | 1.173 | |
| DI-BAC | 6.3±0.6c | 0.059±0.003g | 0.95 | 0.566 | 0.697 | |
| 40°C | ||||||
| A | C | 0.12±0.02a | 0.0048±0.0002abc | 0.99 | 1.082 | 0.992 |
| WI-BAC | 0.51±0.04a | 0.0098±0.0007d | 0.98 | 0.675 | 0.774 | |
| DI-BAC | 0.51±0.09a | 0.00875±0.00001bcd | 0.99 | 0.466 | 0.435 | |
| F | C | 0.003±0.002a | 0.00501±0.00001abc | 0.97 | 3.25 | 1.693 |
| WI-BAC | 0.34±0.07a | 0.0089±0.0009cd | 0.97 | 1.131 | 0.989 | |
| DI-BAC | 0.1386±0.0105a | 0.028±0.002f | 0.97 | 0.253 | 0.464 | |
| 60°C | ||||||
| A | C | 0.066±0.005a | 0.0047±0.0004abc | 0.99 | 1.89 | 1.279 |
| WI-BAC | 0.59±0.02a | 0.017195±0.00002e | 0.97 | 0.358 | 0.557 | |
| DI-BAC | 0.25±0.03a | 0.0178±0.0001e | 0.97 | 0.444 | 0.617 | |
| F | C | 0.015±0.001a | 0.00602±0.00004abcd | 0.96 | 5.432 | 2.201 |
| WI-BAC | 0.1005±0.0174a | 0.0152±0.0012e | 0.97 | 0.747 | 0.769 | |
| DI-BAC | 0.08±0.02a | 0.019±0.0012e | 0.98 | 0.315 | 0.506 | |
| InteractionI | Drying*infusion* | Drying*infusion* | ||||
| rehydration temp. | rehydration temp. | |||||
| WEIBULL MODEL | ||||||
| Samples | α | β | r2 | χ2 | RMSE | |
| 25°C | ||||||
| A | C | 1.259±0.024e | 89.55±0.31f | 0.99 | 0.0003 | 0.016 |
| WI-BAC | 1.08±0.23de | 171.33±3.16g | 0.94 | 0.0048 | 0.068 | |
| DI-BAC | 2.3±0.4f | 178.9±3.2g | 0.98 | 0.0027 | 0.045 | |
| F | C | 0.467±0.107ab | 0.68±0.05a | 0.99 | 0.002 | 0.035 |
| WI-BAC | 2.636±0.107g | 95.7073±6.1005f | 0.96 | 0.0035 | 0.082 | |
| DI-BAC | 1.8±0.2f | 62.33±6.15e | 0.97 | 0.0035 | 0.057 | |
| 40°C | ||||||
| A | C | 0.87±0.09bcde | 28.3±2.4c | 0.99 | 0.0008 | 0.027 |
| WI-BAC | 0.92±0.03bcde | 42.99±5.59d | 0.97 | 0.0027 | 0.052 | |
| DI-BAC | 0.99±0.02cde | 45.8±5.8de | 0.99 | 0.0011 | 0.0285 | |
| F | C | 0.34±0.09a | 1.19±1.14ab | 0.98 | 0.0011 | 0.025 |
| WI-BAC | 0.93±0.05bcde | 26.12±2.53c | 0.96 | 0.004 | 0.062 | |
| DI-BAC | 0.64±0.06abcd | 7.3±0.4ab | 0.98 | 0.0025 | 0.045 | |
| 60°C | ||||||
| A | C | 0.88±0.07bcde | 15.99±1.44bc | 0.99 | 0.00109 | 0.03 |
| WI-BAC | 0.9576±0.1017cde | 23.96±1.15c | 0.96 | 0.00447 | 0.062 | |
| DI-BAC | 1.08±0.06de | 15.18±1.54abc | 0.99 | 0.0011 | 0.032 | |
| F | C | 0.49±0.03abc | 5.94±0.14ab | 0.99 | 0.00106 | 0.027 |
| WI-BAC | 0.81±0.21abcde | 17.6±14.5abc | 0.98 | 0.0045 | 0.062 | |
| DI-BAC | 0.66±0.16abcd | 6.3±0.6ab | 0.99 | 0.0025 | 0.046 | |
| InteractionI | Drying*infusion* | Drying*infusion* | ||||
| rehydration temp. | rehydration temp. | |||||
In each column means with a different lowercase superscript letter are significantly different (p < 0.05). IInteraction obtained from factorial ANOVA analysis.
The freeze-dried sample without pretreatment (CF) presented a higher rehydration rate than the air-dried control samples (CA) (Fig. 1) and the rate decreased at higher rehydration temperatures. The CF curve showed a steeper initial slope (>1/k1 and 1/β) reaching its maximum rehydration capacity in a very short period of time (<1 min). It has been reported that during the first rehydration stage, water fills the air spaces present in the dehydrated food products [23]. The higher porosity of the freeze-dried sample may explain the higher rehydration rate compared to the CA sample. Previous studies on freeze-dried products have also obtained highly porous matrices with high rehydration capacity, due to the characteristics of the freeze-drying process [5, 24, 25]. At the early stage of the rehydration process, water rapidly fills the empty spaces of the freeze-dried matrices, producing an instantaneous increase in water absorption [24]. On the other hand, the high temperatures to which the tissue is subjected during air-drying lead to a structure of collapsed capillaries that reduce the rehydration rate [26]. This behavior occurred at 25°C and 40°C, but at 60°C both samples reached the maximum rehydration capacity at similar speed and time, reaching the same final water content after the rehydration process (≈k2).
Temperature influences certain characteristics of the product such as the cell wall structure and cell membranes [27], normally producing the loss of nutrients and pigments which can be avoided in part with some pretreatments before drying. It has been shown that rehydration at temperatures below 40°C maintains the original structure of cell wall pectins improving the water absorption capacity of the tissue [28].
Pretreated raspberries (Fig. 1) had lower water incorporation capacity than control samples at all the rehydration times evaluated. This fact could be attributed to the changes in the chemical composition and the distribution of components in the tissue caused by the osmotic dehydration. When raspberries were immersed in the hypertonic solution, an increase in sugar content and a decrease in water content occurred. Also, this pretreatment caused the development of a concentrated solids surface layer, and the reduction of tissue porosity and shrinkage due to sugar infiltration [14]. A much lower water incorporation rate (>k1) and a lower equilibrium value were evidenced, especially at 25°C, probably due to the presence of an additional resistance generated by the concentration of solutes in the fruit during the previous osmosis process. In the early stages of rehydration, this superficial sugar dissolves, making the absorption of water more difficult. This behavior was not observed in control dehydrated fruits (C), which exhibit the more abrupt initial slope in the rehydration rate with respect to the pretreated samples.
Regarding the characteristic parameters obtained by the Weibull’s model (Table 1), the temperature did not have a clear influence on the parameter α, since it decreased at 40°C, but at 60°C the behavior did not follow a particular trend. Similarly to the k1 Peleg parameter, the β parameter evolved in an inversely proportional way to the applied rehydration temperature, except for the CF samples, where an increase of β and k1 was observed with temperature. This behavior could be due to the damage on tissue porosity caused by the high temperatures on freeze-dried samples without pretreatment. On one hand during freeze-drying process a more porous structure is achieved, which usually allows a rapid intake of water. However, the effect of pre-freezing leads to a more fragile tissue that upon rehydration at high temperatures is disorganized and exhibits a porosity loss, leading to a lower capacity to recover the initial water of the fresh fruit.
3.2Rehydration indices, volume recovery and mechanical behavior
As rehydration behavior can be considered as a measure of injuries caused to the materials by treatments, some rehydration indices are often used as indicative of the loss of cell integrity occurred in the plant tissues not only during pre-drying treatments and subsequent drying, but also during rehydration per se. In this study, two indices were used to evaluate the rehydration performance. The RR index, named rehydration percentage, rehydratability or restoration ratio [9], that measures the relative mass increase of dried materials under rehydration in water, whereas RA index (rehydration ability) represents the matrix ability to recover the water lost during the dehydration processes [5]. Table 2 shows RR index calculated at three values of time selected as convenient for different applications of the raspberry products. The 5 min time corresponds to the consume period for the fruits included in a cereal mix; 20 min would be an appropriate time to recover the fresh fruit characteristics to be used in yogurts or desserts; and the equilibrium time allows an in-depth understanding of the rehydration process at the assayed conditions. At 25°C 5 min was enough time to fully rehydrate freeze-dried samples without pretreatments (CF), while air-dried raspberries (CA) at 20 min reached only 55% of their maximum rehydration capacity. At 40°C, CF samples also showed rapid water absorption, achieving 86% of the equilibrium value in 5 min. However, at 60°C CF samples presented a different behavior, as they exhibited lower and significantly different (p < 0.05) RR indices at each value of time, in contrast to the values observed for CA samples that increased with the rehydration temperature. However, Fig. 2-a shows that at 25°C, both, air- and freeze-drying led to the same recovery of fresh fruit water content (RA) at the end of the rehydration process, despite CF samples are more porous and presented ≈ 10% shrinkage according to Sette et al. [14]. Despite the instantaneous rehydration observed at short times, water-holding capacity diminished along time, probably due to the structural damage caused by the freezing step during the freeze-drying process.
Table 2
Rehydration relationship (RR) of raspberries rehydrated at 25°C, 40°C and 60°C at 5 min, 20 min and at the end of the rehydration process. Raspberries obtained after the application of air-drying or freeze-drying: control (C) and pretreated (WI-BAC and DI-BAC)
| Rehydration temperature | Samples | RR 5min | RR 20min | RR final |
| 25°C | ||||
| Air-drying | C | 115.9±0.9Abcd | 131.02±13.15Acde | 239.5±10.2Bf |
| WI-BAC | 102.3±0.5Aab | 107.8±1.6Aab | 128.8±1.7Babc | |
| DI-BAC | 100.5±0.7Aab | 102.46±3.08Aa | 138.2±1.6Bbcd | |
| Freeze-drying | C | 243.7±1.7Ag | 253.9±7.4Ahi | 240.6±16.6Af |
| WI-BAC | 96.84±4.05Aa | 100.18±3.13Aa | 119.74±1.13Bab | |
| DI-BAC | 100.36±0.09Aab | 101.1±0.3Aa | 108.3±0.4Ba | |
| 40°C | ||||
| Air-drying | C | 129.02±6.83Ad | 178.3±7.3Bf | 248.3±4.5Cf |
| WI-BAC | 112.2±0.5Abc | 123.2±1.9Bbcd | 162.6±4.7Ce | |
| DI-BAC | 109.33±0.06Aabc | 124.81±3.14Bbcd | 170.3±1.8Ce | |
| Freeze-drying | C | 248.3±13.44Ag | 269.51±7.12Ai | 288.1±6.9Ag |
| WI-BAC | 115.5±0.5Abcd | 129.9±2.9Bcde | 165.2±0.9Ce | |
| DI-BAC | 114.5±2.6Abc | 122.82±4.06Bbcd | 131.2±2.9Cbc | |
| 60°C | ||||
| Air-drying | C | 142.3±6.8Ae | 203.3±6.9Bg | 251.6±7.4Cf |
| WI-BAC | 109.5±1.6Aabc | 115.9±1.9Babc | 133.5±1.5Cbcd | |
| DI-BAC | 110.4±1.3Abc | 125.5±3.9Bcd | 138.6±1.13Ccd | |
| Freeze-drying | C | 214.9±3.5Af | 247.5±0.7Bh | 292.9±8.8Cg |
| WI-BAC | 123.02±1.44Acd | 145.3±3.2Be | 150.3±0.7Bde | |
| DI-BAC | 124.5±1.8Acd | 138.05±2.48Bde | 143.199±0.115Bcd | |
| InteractionI | Drying*infusion* | Drying*infusion* | Drying*infusion* | |
| rehydration temp. | rehydration temp. | rehydration temp. |
In each column means with a different lowercase superscript letter are significantly different (p < 0.05). In each row means with a different superscript capital letter are significantly different (p < 0.05). IInteraction obtained from factorial ANOVA analysis.
Fig.2
Volume recovery, Vrfinal (circles) and rehydration ability, RA final (quadrates) at the end of the rehydration process raspberries obtained after the application of air-drying (empty symbols and dotted lines) or freeze-drying (filled symbols and continuous lines). Control samples (a), WI-BAC samples (b) and DI-BAC samples (c). Bars represent standard deviation of the means. Interaction between the three studied factors was significant for both variables.
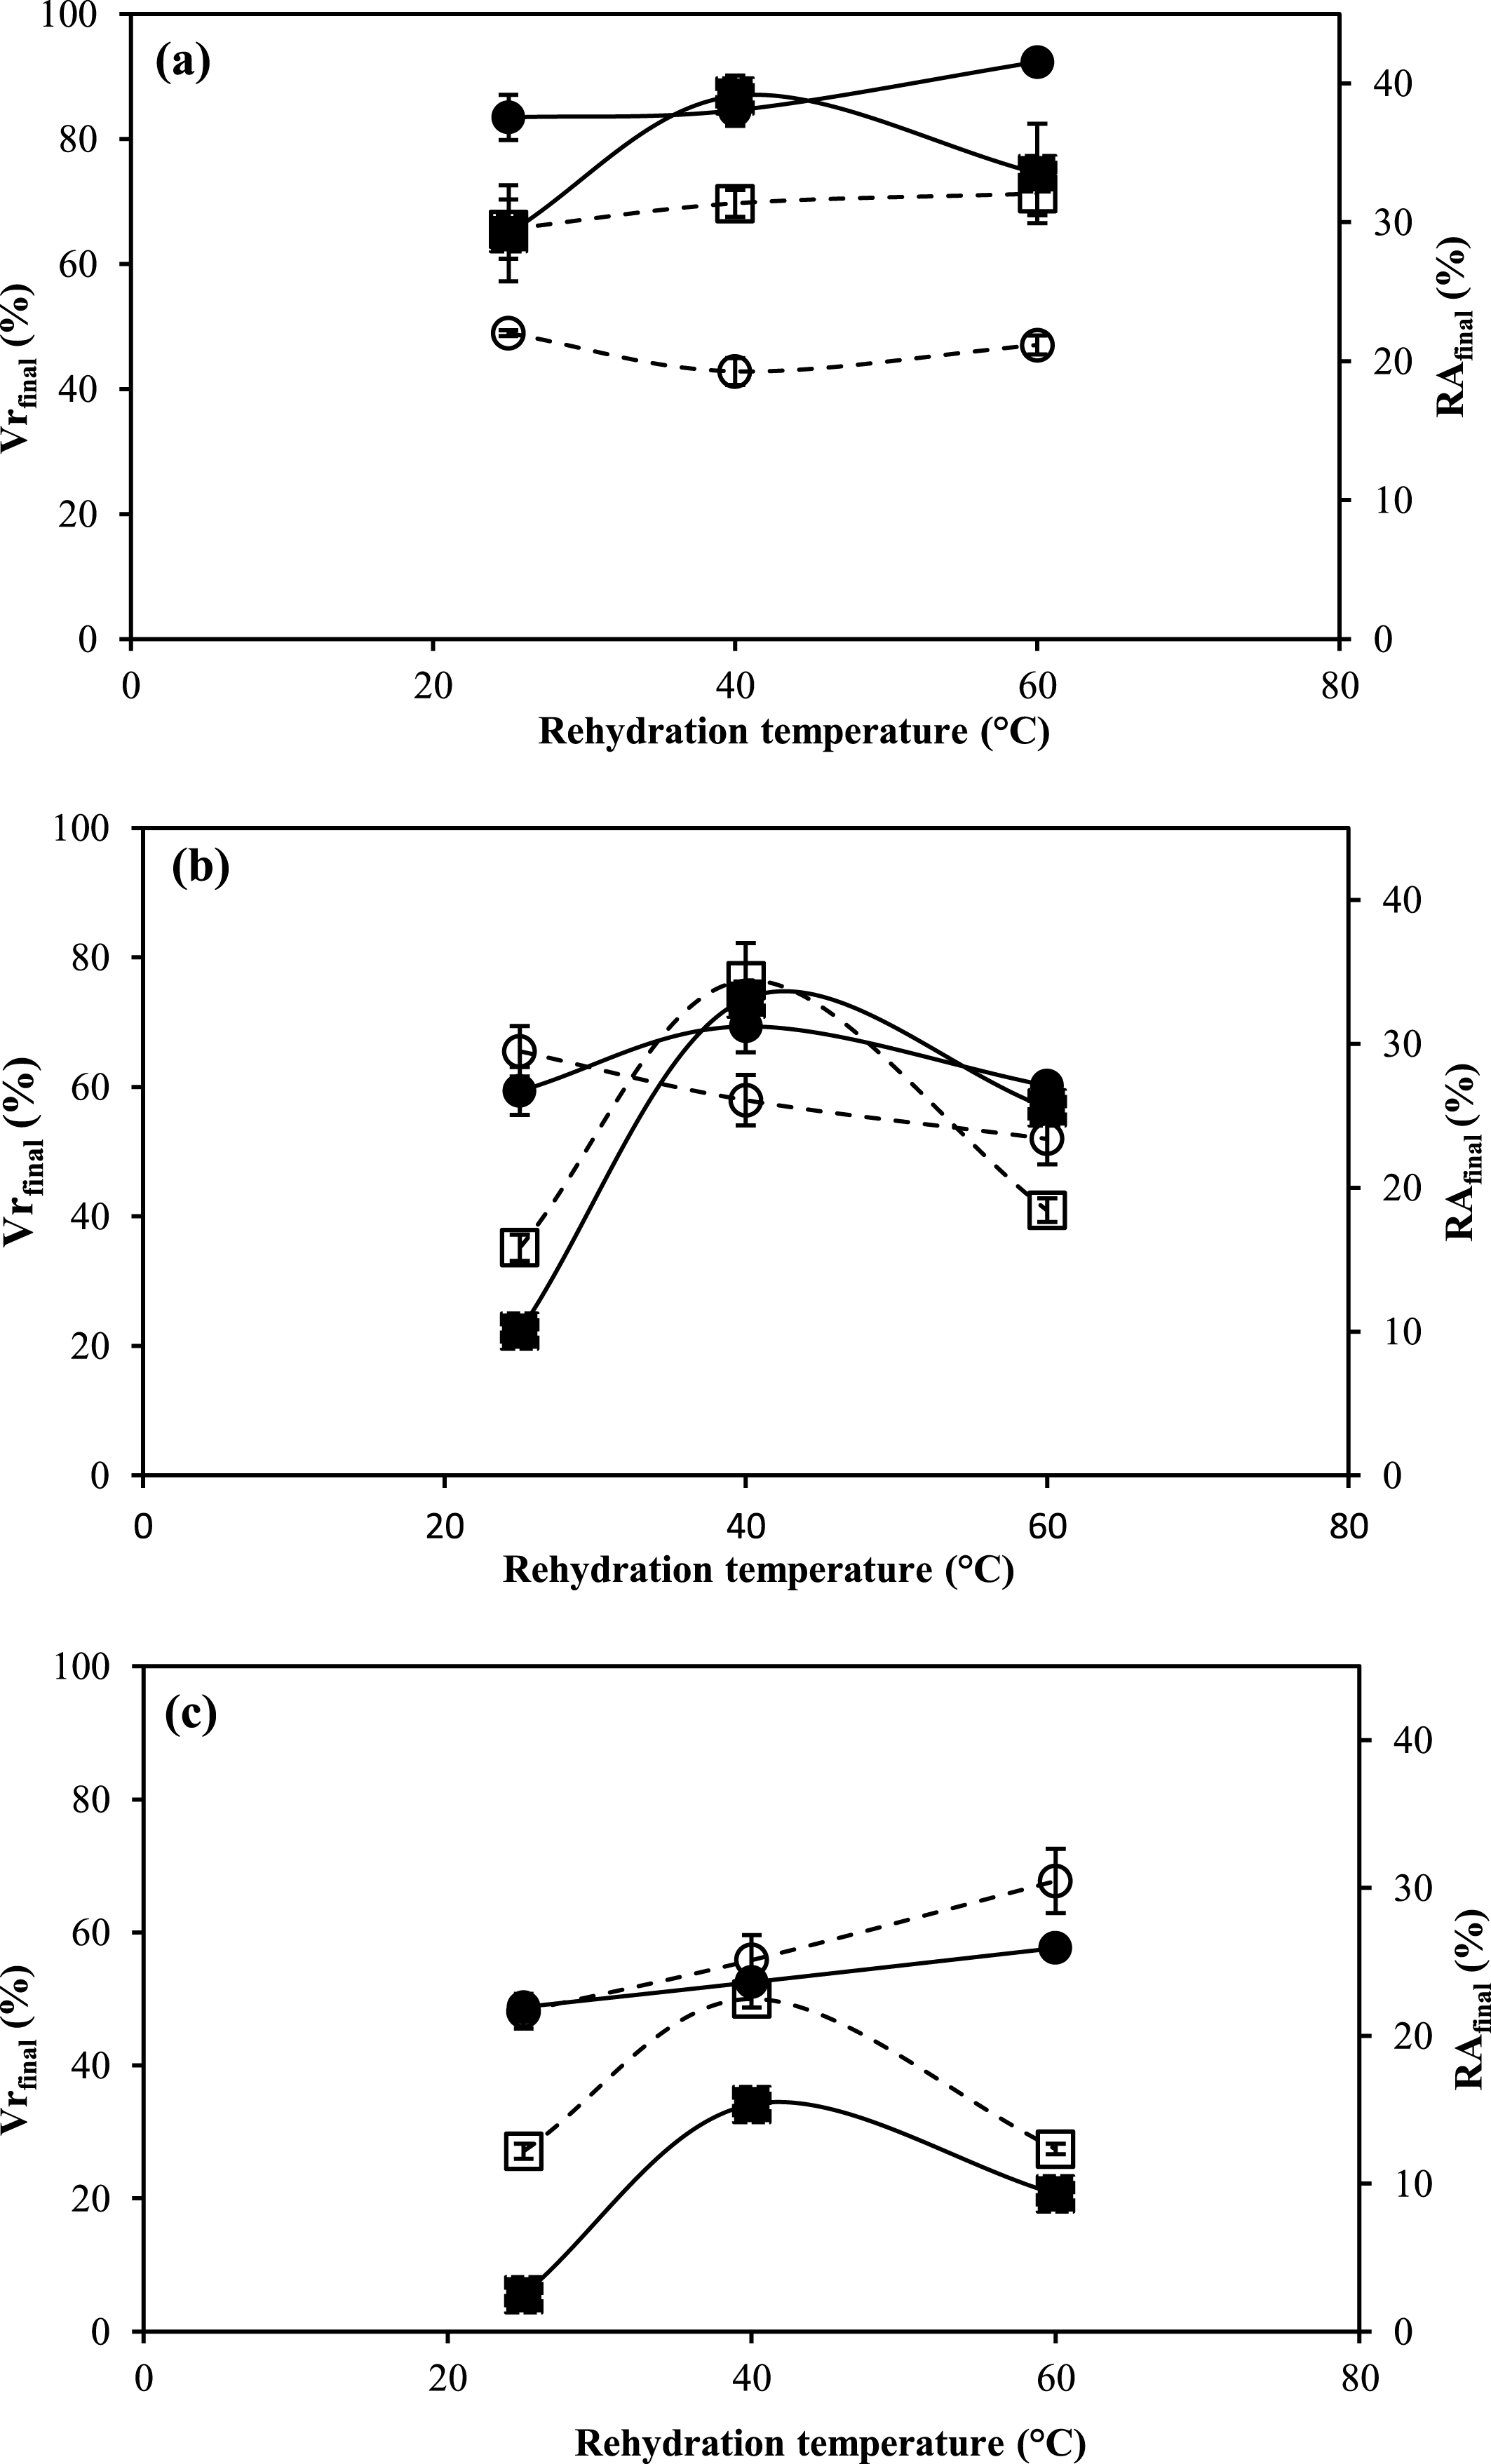
As saturation moisture achieved by air-dried samples was much lower than that of fresh fruit (567±14 kg water/100 kg wet basis) and maintained at all rehydration temperatures (Fig. 1), it can be assumed that structural changes occurred in plant tissues during dehydration processes have been irreversible, restoring only 30% of fresh fruit water content and ≈ 50% of the initial volume (Fig. 2). These results demonstrate that, although freeze-drying protects the primary structure and the materials shape during water sublimation, with minimal collapse, a complete recovery of fresh samples in terms of moisture content was not attained. By analyzing the mechanical properties of these control fruits by back-extrusion tests (Fig. 3-a), a higher firmness in air-dried fruits was observed when compared to the freeze-dried ones after 5 and 20 min of rehydration at 25°C and 40°C. The mechanical behavior of air-dried control raspberries has been previously ascribed to the crust formation during air-drying, as well as to the greater shrinkage and the lower water content exhibited by the samples [14]. The freeze-dried fruits had a very low resistance to the extrusion force at all rehydration conditions. According to Prothon et al. [29], the fact that a tissue apparently has a better preserved structure, does not necessarily mean that its microstructure is not damaged and this appears to take place in freeze-dried raspberries, which have a much more fragile structure despite not showing structural collapse. Ice crystals formed during freezing step cause cell structure disruption, and, after sublimation, this generates, not only air-filled pores in the intercellular spaces of the fruit, but also new pores, resulting in an extremely porous structure. This will produce a texture loss during the subsequent rehydration. The above mentioned authors introduced the concept of “textural collapse” to describe this phenomenon.
Fig.3
Peak force (Fmax, N) of raspberry products rehydrated for 5 min ( ) and 20 min (
 ), at 25°C (a), 40°C (b) and 60°C (c). Fresh sample and raspberries obtained after the application of air-drying or freeze-drying: control (C) and pretreated (WI-BAC, DI-BAC). Bars represent standard deviation of the means. Interaction between the three studied factors was significant.
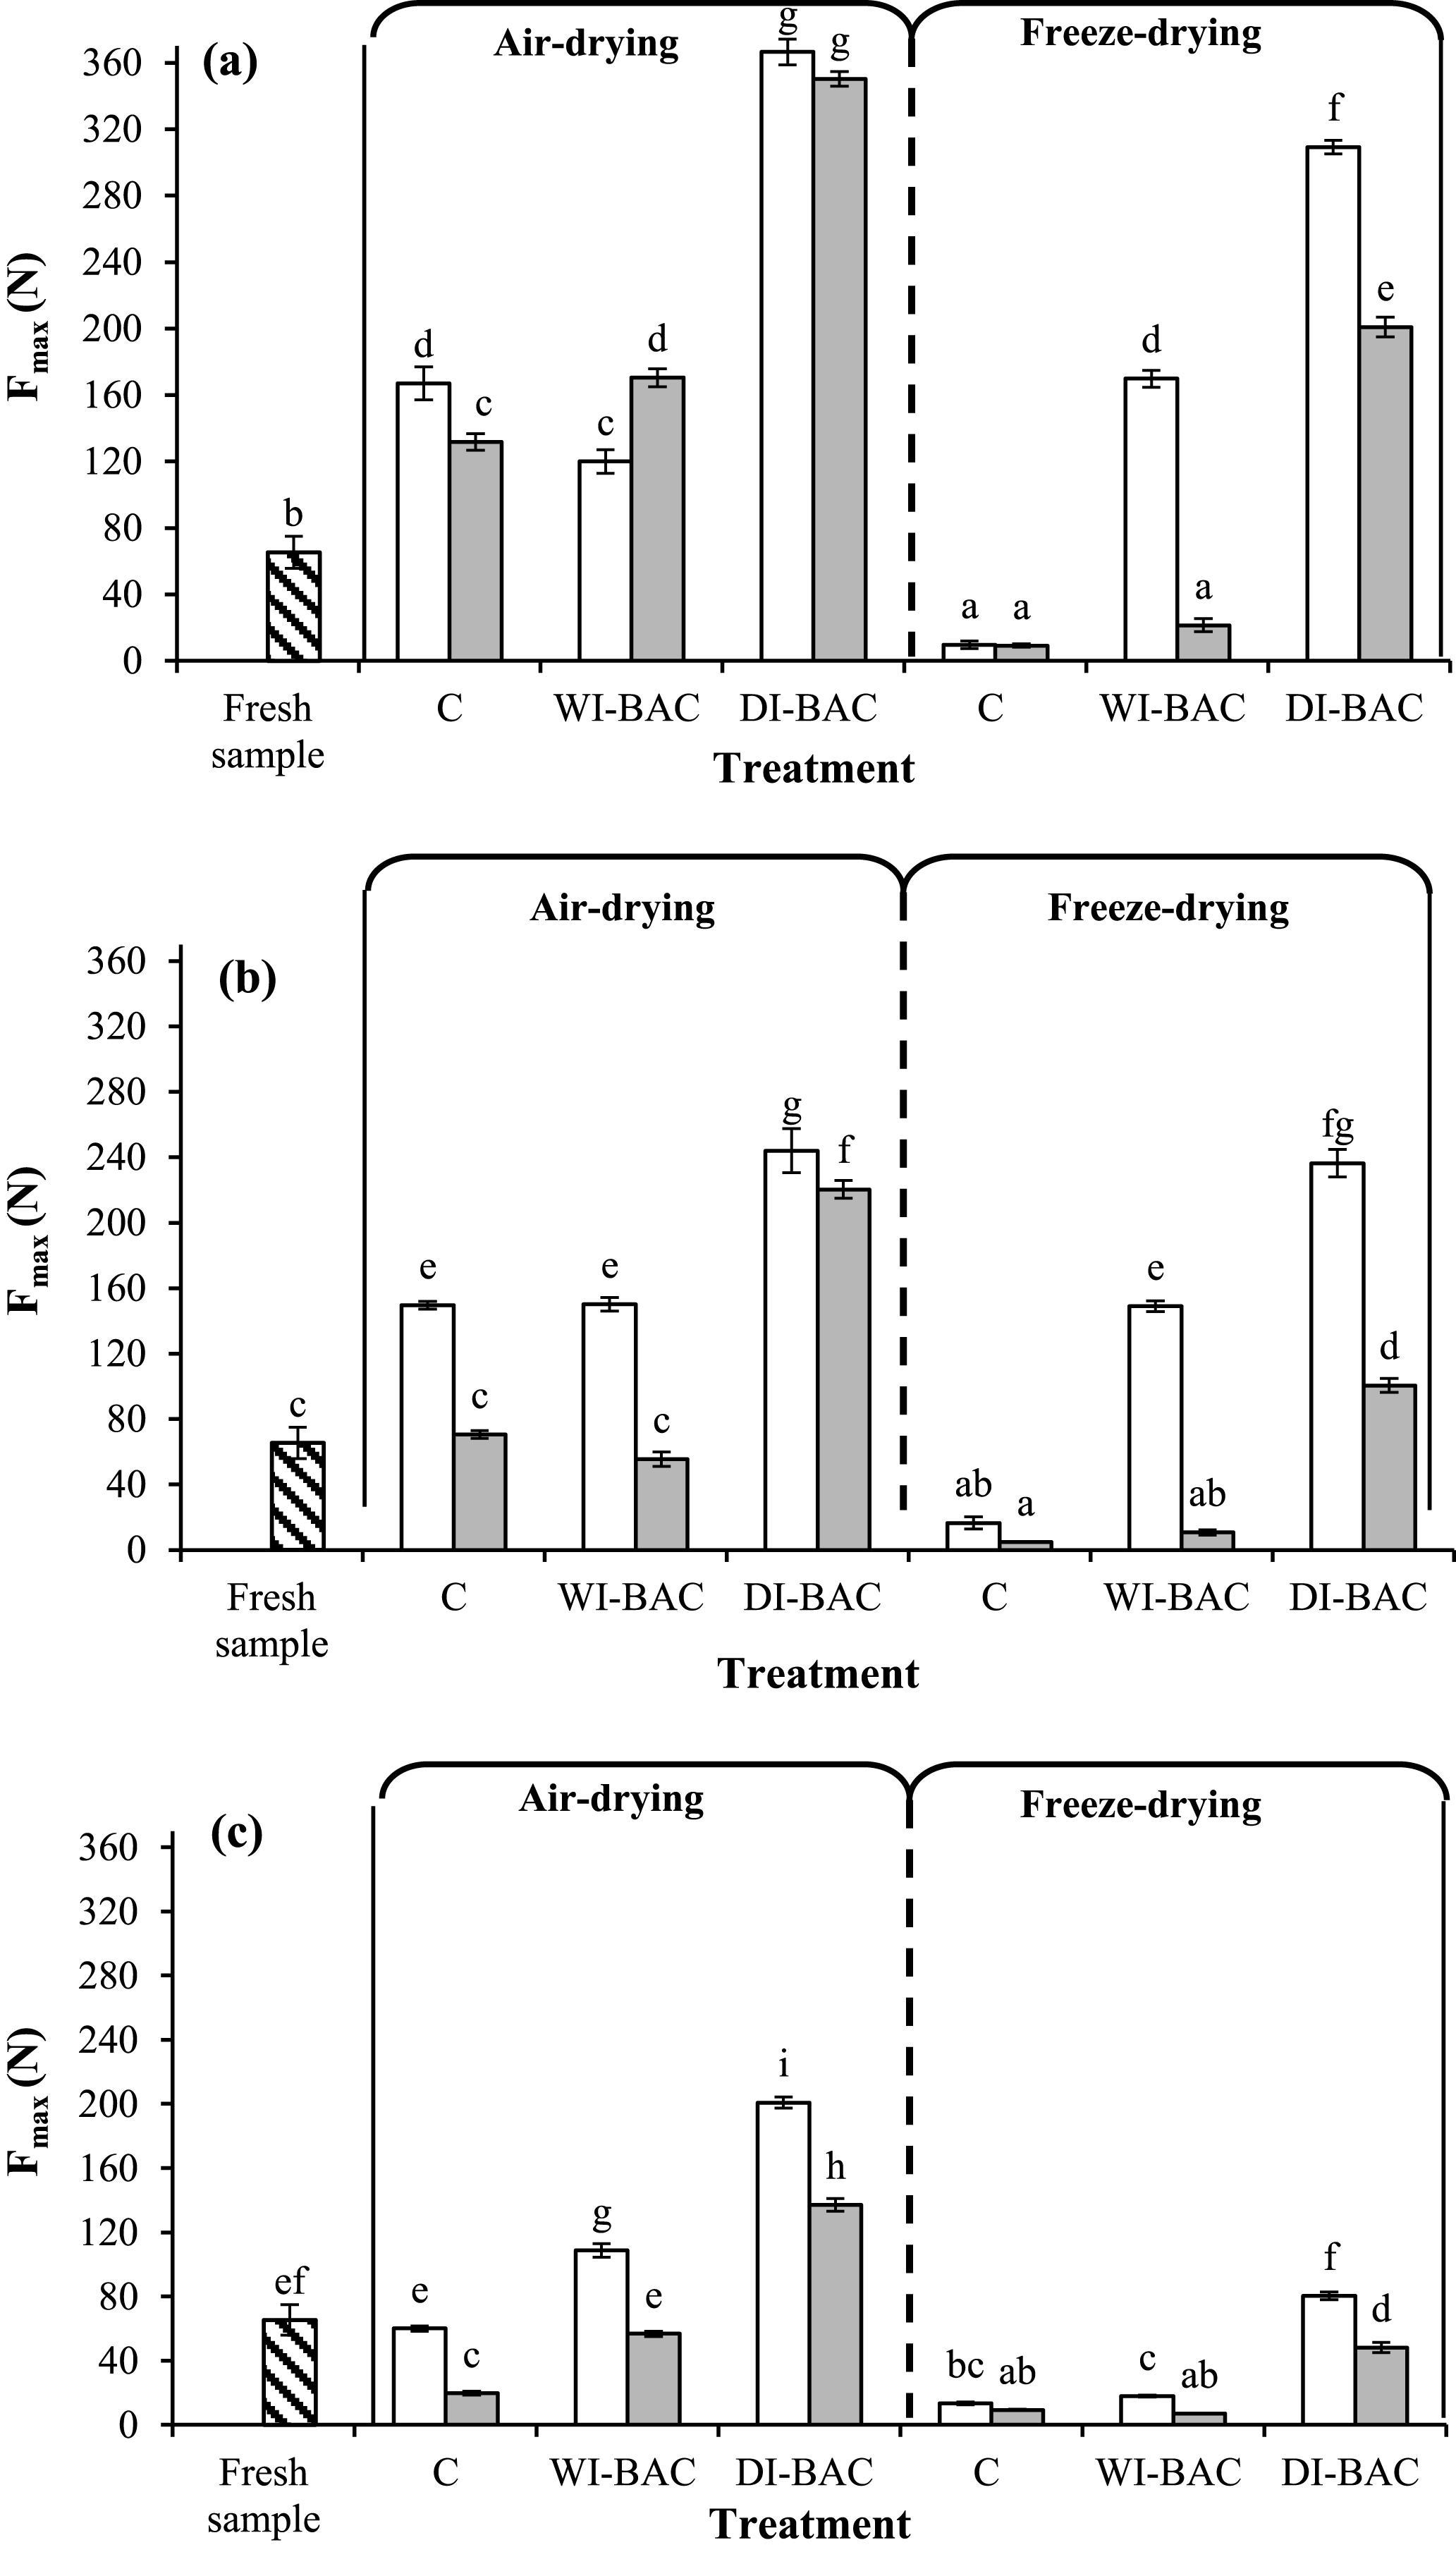
The rehydratability of the pretreated samples was significantly reduced (p < 0.05) compared to their respective control samples due to the combination of different factors affecting the ability of the structure to absorb water (Table 2). Both infusion pretreatments (dry and wet) affected the ability of matrix to retain water to a greater extent in the case of freeze-dried fruits, especially in DI-BAC samples (Table 2). At 25°C these samples recovered only 3% of the total water removed in the successive dehydration processes and 50% of the initial fruit volume (Fig. 2-c), which is indicative of the significant structural changes these samples experimented not only during the infusion process but also during subsequent steps of freezing and freeze-drying. Previous studies showed a lower shrinkage of WI-BAC samples after freeze-drying process compared to DI-BAC [14]. This fact could explain the increased capacity of these samples to recover water and volume upon rehydration. By comparing the mechanical behavior of pretreated samples after rehydration (Fig. 3) it was verified that the use of DI-BAC pretreatments led to higher firmness at the different rehydration temperatures, which could be related to the lower water recovery ability and lower volume recovery (Fig. 2).
The RA values in pretreated samples increased at 40°C, but then decreased at 60°C (Fig. 2-b and c) probably because the ability to hold soluble solids diminished at high temperatures and also because the structural changes become irreversible. According to studies carried out by Maldonado et al. [30] when working with mango fruits, an increase in the rehydration temperature from 25 to 40°C improved the efficiency with minimum solids loss, but above 60°C the rehydration capacity decreased due to cell damage induced by heat. Studies with other fruits such as apple, banana and tomato have shown that an increase in the temperature from 25 to 40°C provoked not only an increase in water absorption but also a loss of tissue solids [31]. Studies carried out with broccoli showed a higher rehydration capacity at low temperatures, for a rehydration temperature range between 20–80°C [32]. These authors related water absorption capacity with the pectic polysaccharides content of tissue cell walls and with the effect of the rehydration temperature on the pectic enzymes activity. The chemical degradation of pectins induced by the heat generated during drying and/or rehydration influences water uptake and retention by the cellular tissue. The improvement observed in pretreated raspberries at 40°C could indicate that the permeability of the cell membranes was recovered and the surface barriers disappeared. However when rehydrating at 60°C the lesser ability of the tissue to recover the water lost during dehydration could indicate a greater degradation of cell walls and membranes by pectic polymers solubilization during sugar infusion and by thermal degradation during drying and/or rehydration with a probable significant solids loss to the rehydration medium (<RA). The results obtained provide evidence of structure damage incurred throughout the three stages of processing: pretreatment, dehydration (air or freeze-drying) and rehydration. According to Khalloufi and Ratti [33], structural and chemical alterations during the rehydration process itself, is one of the main factors that affect the ability of fruits to imbibe and retain water, but its influence is mainly ignored in the literature.
3.3Color and anthocyanin loss evaluation during rehydration
3.3.1Evaluation of anthocyanin degradation
Table 3 shows monomeric anthocyanins content (ACY) of raspberries before and after rehydration at 5 minutes, 20 minutes, and at the end of the rehydration process at different temperatures. In the case of control samples before rehydration, higher anthocyanins levels were observed upon freeze-drying in comparison with air-drying; meanwhile pretreatments caused a severe reduction in ACY values mainly due to migration to the osmotic medium [2]. Rehydration also lead to a decrease in the ACY content, depending mainly on the losses occurred by diffusion, and also on thermal degradation. This ACY decrease was particularly relevant for the rehydrated control samples that only retained between 8 –42%, while ACY retention for rehydrated pretreated samples was between 40 –90%. Osmotic dehydration causes changes in the distribution of raspberry tissue components due to sugar incorporation [13]. The interaction of sucrose molecules with cell walls and membranes, especially in the outer layer of the fruit tissue, where solid concentration occurred during osmosis and further dehydration, could cause a decrease in tissue permeability [34] and this might have contributed to the decrease observed in anthocyanin leaching to the surrounding water. Regarding the effect of rehydration time, gradual ACY losses were observed both in control and pretreated samples at the three studied temperatures.s
Table 3
Anthocyanin content (ACY) of raspberries before (ACY0) and after the rehydration process at 25°C, 40°C and 60°C at 5 min, 20 min and at the end of the rehydration process. Raspberries obtained after the application of air-drying or freeze-drying: control (C) and pretreated (WI-BAC and DI-BAC)
| Rehydration temperature | Samples | ACY (mg Cyd-3-glu/100 g w.b.) | |||
| ACY 0 * | ACY 5min | ACY 20min | ACY final | ||
| 25°C | |||||
| Air-drying | C | 208±11d | 79.07±0.77g | 67.7±1.4hi | 25.6±2.7ef |
| WI-BAC | 20±2a | 15.37±1.24a | 15.04±0.29a | 8.7±0.3a | |
| DI-BAC | 27±3b | 22.2±0.2bc | 19.6±0.5abc | 10.03±1.47ab | |
| Freeze-drying | C | 412±12e | 84.2±0.4gh | 64.9±1.2gh | 45.8±0.7hi |
| WI-BAC | 28±3b | 21.9±1.7bc | 18.4±0.7abc | 8.4±0.4a | |
| DI-BAC | 39.2±0.8c | 31.5±1.7e | 30.19±2.02e | 20.6±0.2de | |
| 40°C | |||||
| Air-drying | C | 208±11d | 80.8±5.5g | 71.9±2.2i | 28.5±3.6fg |
| WI-BAC | 20±2a | 17.2±0.9ab | 15.6±0.5a | 8.13±0.84a | |
| DI-BAC | 27±3b | 25.23±1.09cd | 19.9±2.6bc | 14.5±1.9bc | |
| Freeze-drying | C | 412±12e | 78.3±0.5g | 63.36±2.09gh | 40.6±1.2h |
| WI-BAC | 28±3b | 20.2±0.8abc | 16.6±0.8abc | 12.5±0.5abc | |
| DI-BAC | 39.2±0.8c | 31.04±0.36e | 25.7±1.4de | 20.05±3.04d | |
| 60°C | |||||
| Air-drying | C | 208±11d | 88.6±1.8h | 60.4±1.7g | 27.3±3.2f |
| WI-BAC | 20±2a | 14.9±0.3a | 15.12±0.29a | 11.12±0.89ab | |
| DI-BAC | 27±3b | 24.55±1.04c | 21.22±1.04cd | 10.6±0.5ab | |
| Freeze-drying | C | 412±12e | 57.32±2.03f | 47.2±1.8f | 33.9±1.7g |
| WI-BAC | 28±3b | 17.4±0.6ab | 15.9±0.7ab | 10.6±0.4ab | |
| DI-BAC | 39.2±0.8c | 30.3±0.6de | 24.5±0.3d | 16.99±1.05cd | |
| InteractionI | Drying*infusion | Drying*infusion* | Drying*infusion* | Drying*infusion* | |
| rehydrationt emp. | rehydration temp. | rehydration temp. | |||
In each column means with a different lowercase superscript letter are significantly different (p < 0.05). IInteraction obtained from factorial ANOVA analysis. *Sette et al. 2017.
3.3.2Superficial color
Figure 4 shows the chromatic variables, chroma (Fig. 4-a), hue angle (Fig. 4-b), and luminosity (Fig. 4-c) for the dehydrated raspberry products upon rehydration at 25°C. Superficial color was evaluated at 25°C, 40°C and 60°C, however, no significant effect of temperature was detected, then, only results at 25°C are shown.
Fig.4
Chroma (C*ab) (a), hue angle (hab) (b) and luminosity (L*) (c) of raspberry products rehydrated at 25°C for 5 min (), 20 min () and at the end of rehydration ( ). Raspberries obtained after the application of air drying or freeze-drying: control (C) and pretreated (WI-BAC, DI-BAC). Bars represent standard deviation of the means. Interaction between the three studied factors was significant for the variables C*ab and L*. For hab variable significant interactions were obtained between “rehydration time” and “drying method” (superscript letters) and interaction between “rehydration time” and “type of infusion” (lowercase letters).
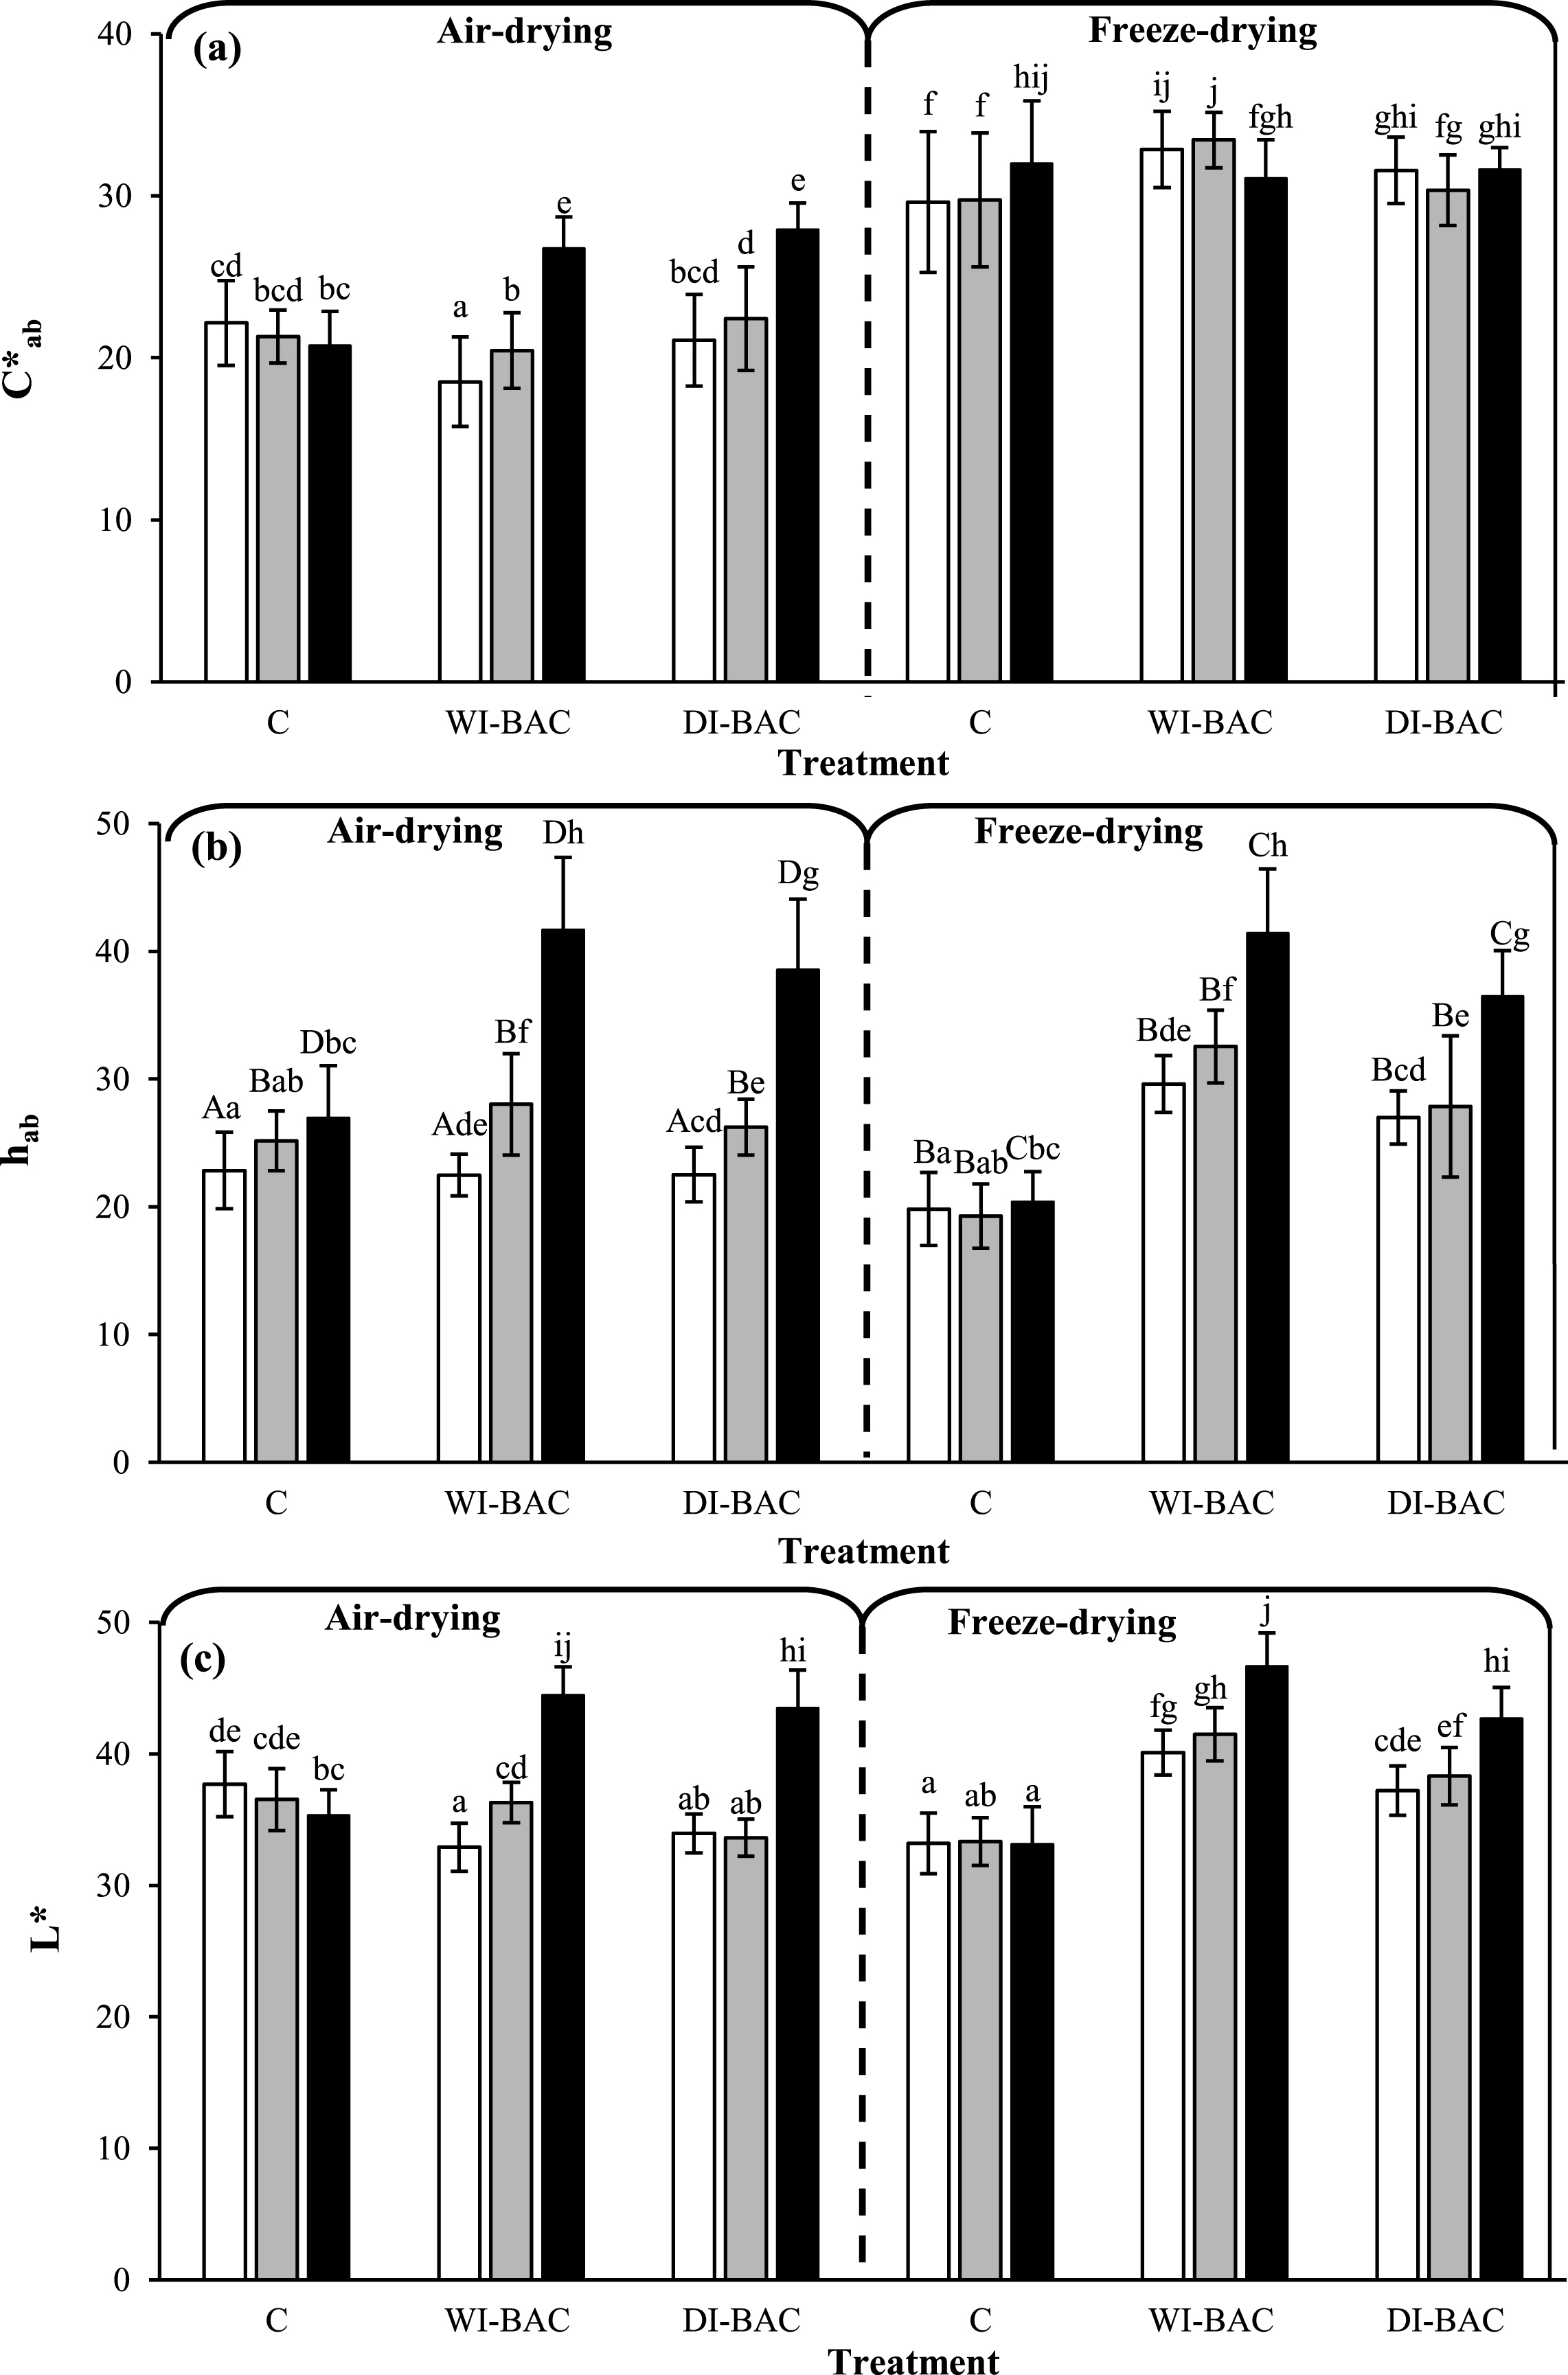
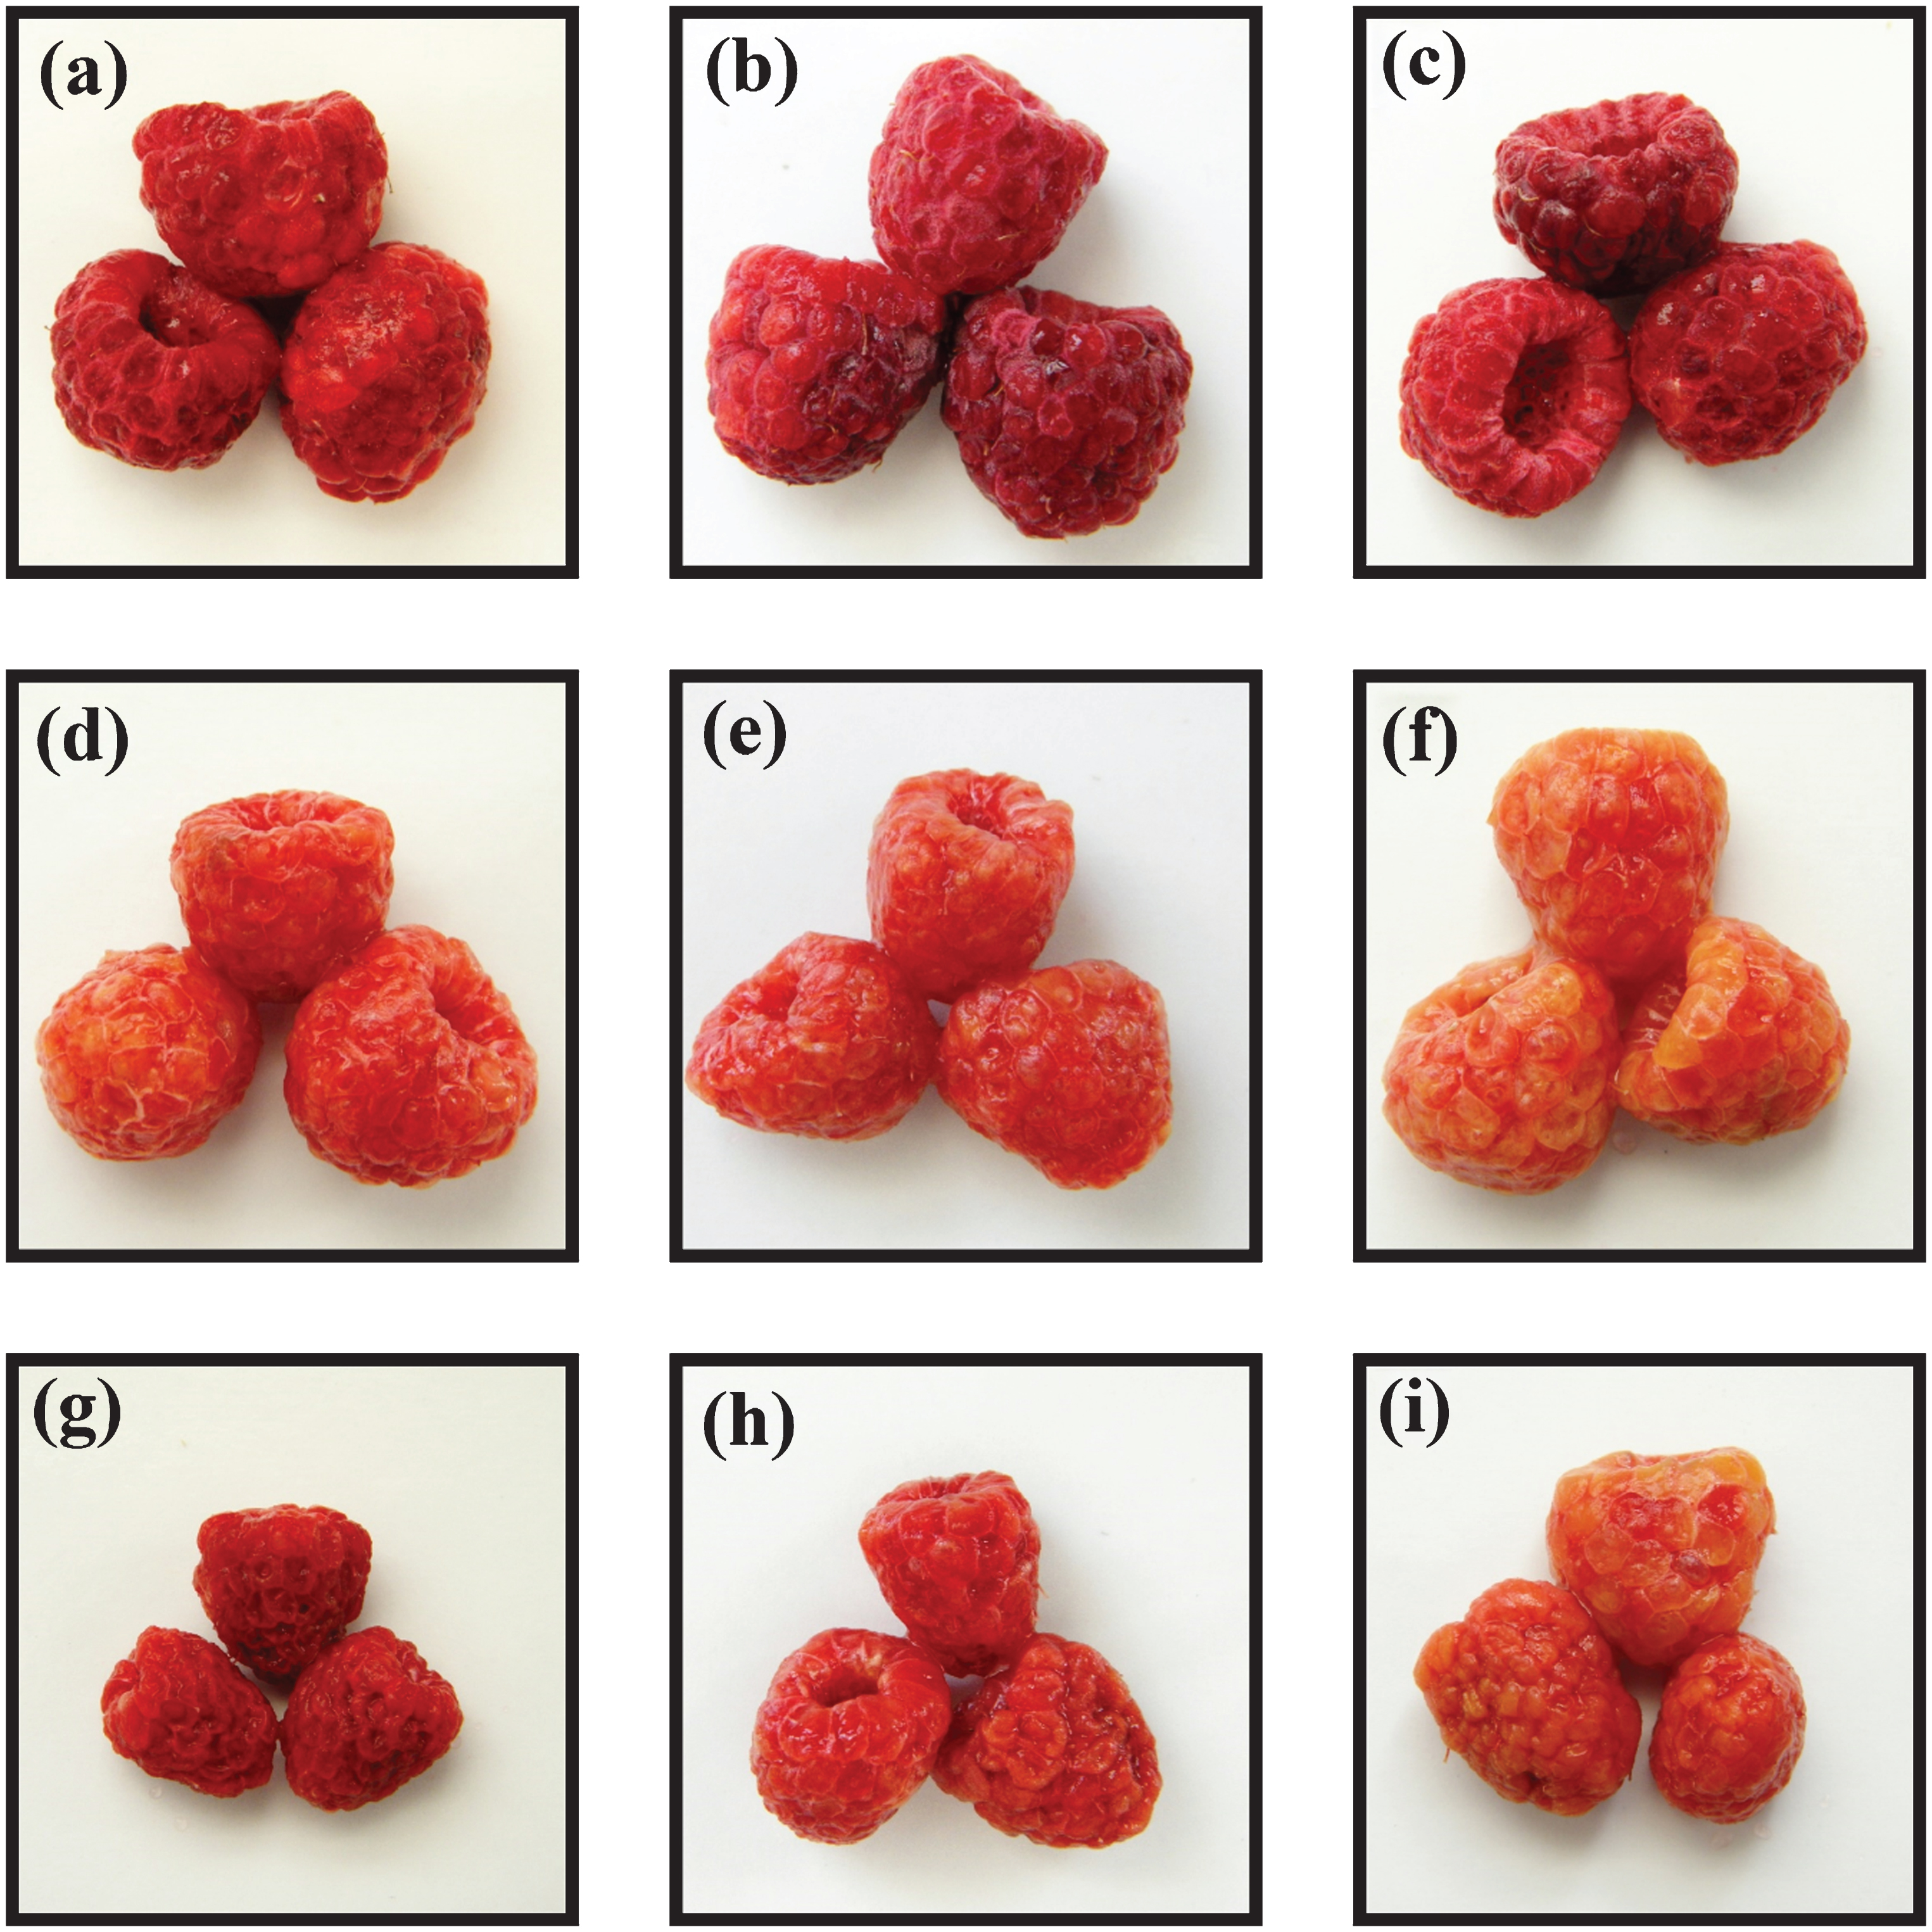
In general, freeze-dried samples showed higher chroma values than air-dried ones. Also, chroma values did not change along rehydration time for all the freeze-dried samples and control air-dried ones. Pretreated samples showed an important increase in hue angle at the final time of rehydration indicating a shift from red to orange hues. In the case of air-dried samples, the hue angle increase was accompanied by a C*ab increase, reaching in all the pretreated samples to similar orange tones. This fact could be related to the damage on the tissue causing the complete loss of soluble contents of some drupelets exposing the yellowish walls, rendering in average an orange hue to the rehydrated fruit. Visual aspects of the rehydrated products can also be appreciated in the images shown in Figs. 5 and 6.
Fig.5
Images obtained after rehydration at 25°C of air-dried raspberries at different values of rehydration time. Control (C): 5 min (a), 20 min (b) and final (c). Wet infusion (WI-BAC): 5 min (d), 20 min (e) and final (f). Dry infusion (DI-BAC): 5 min (g), 20 min (h) and final (i).
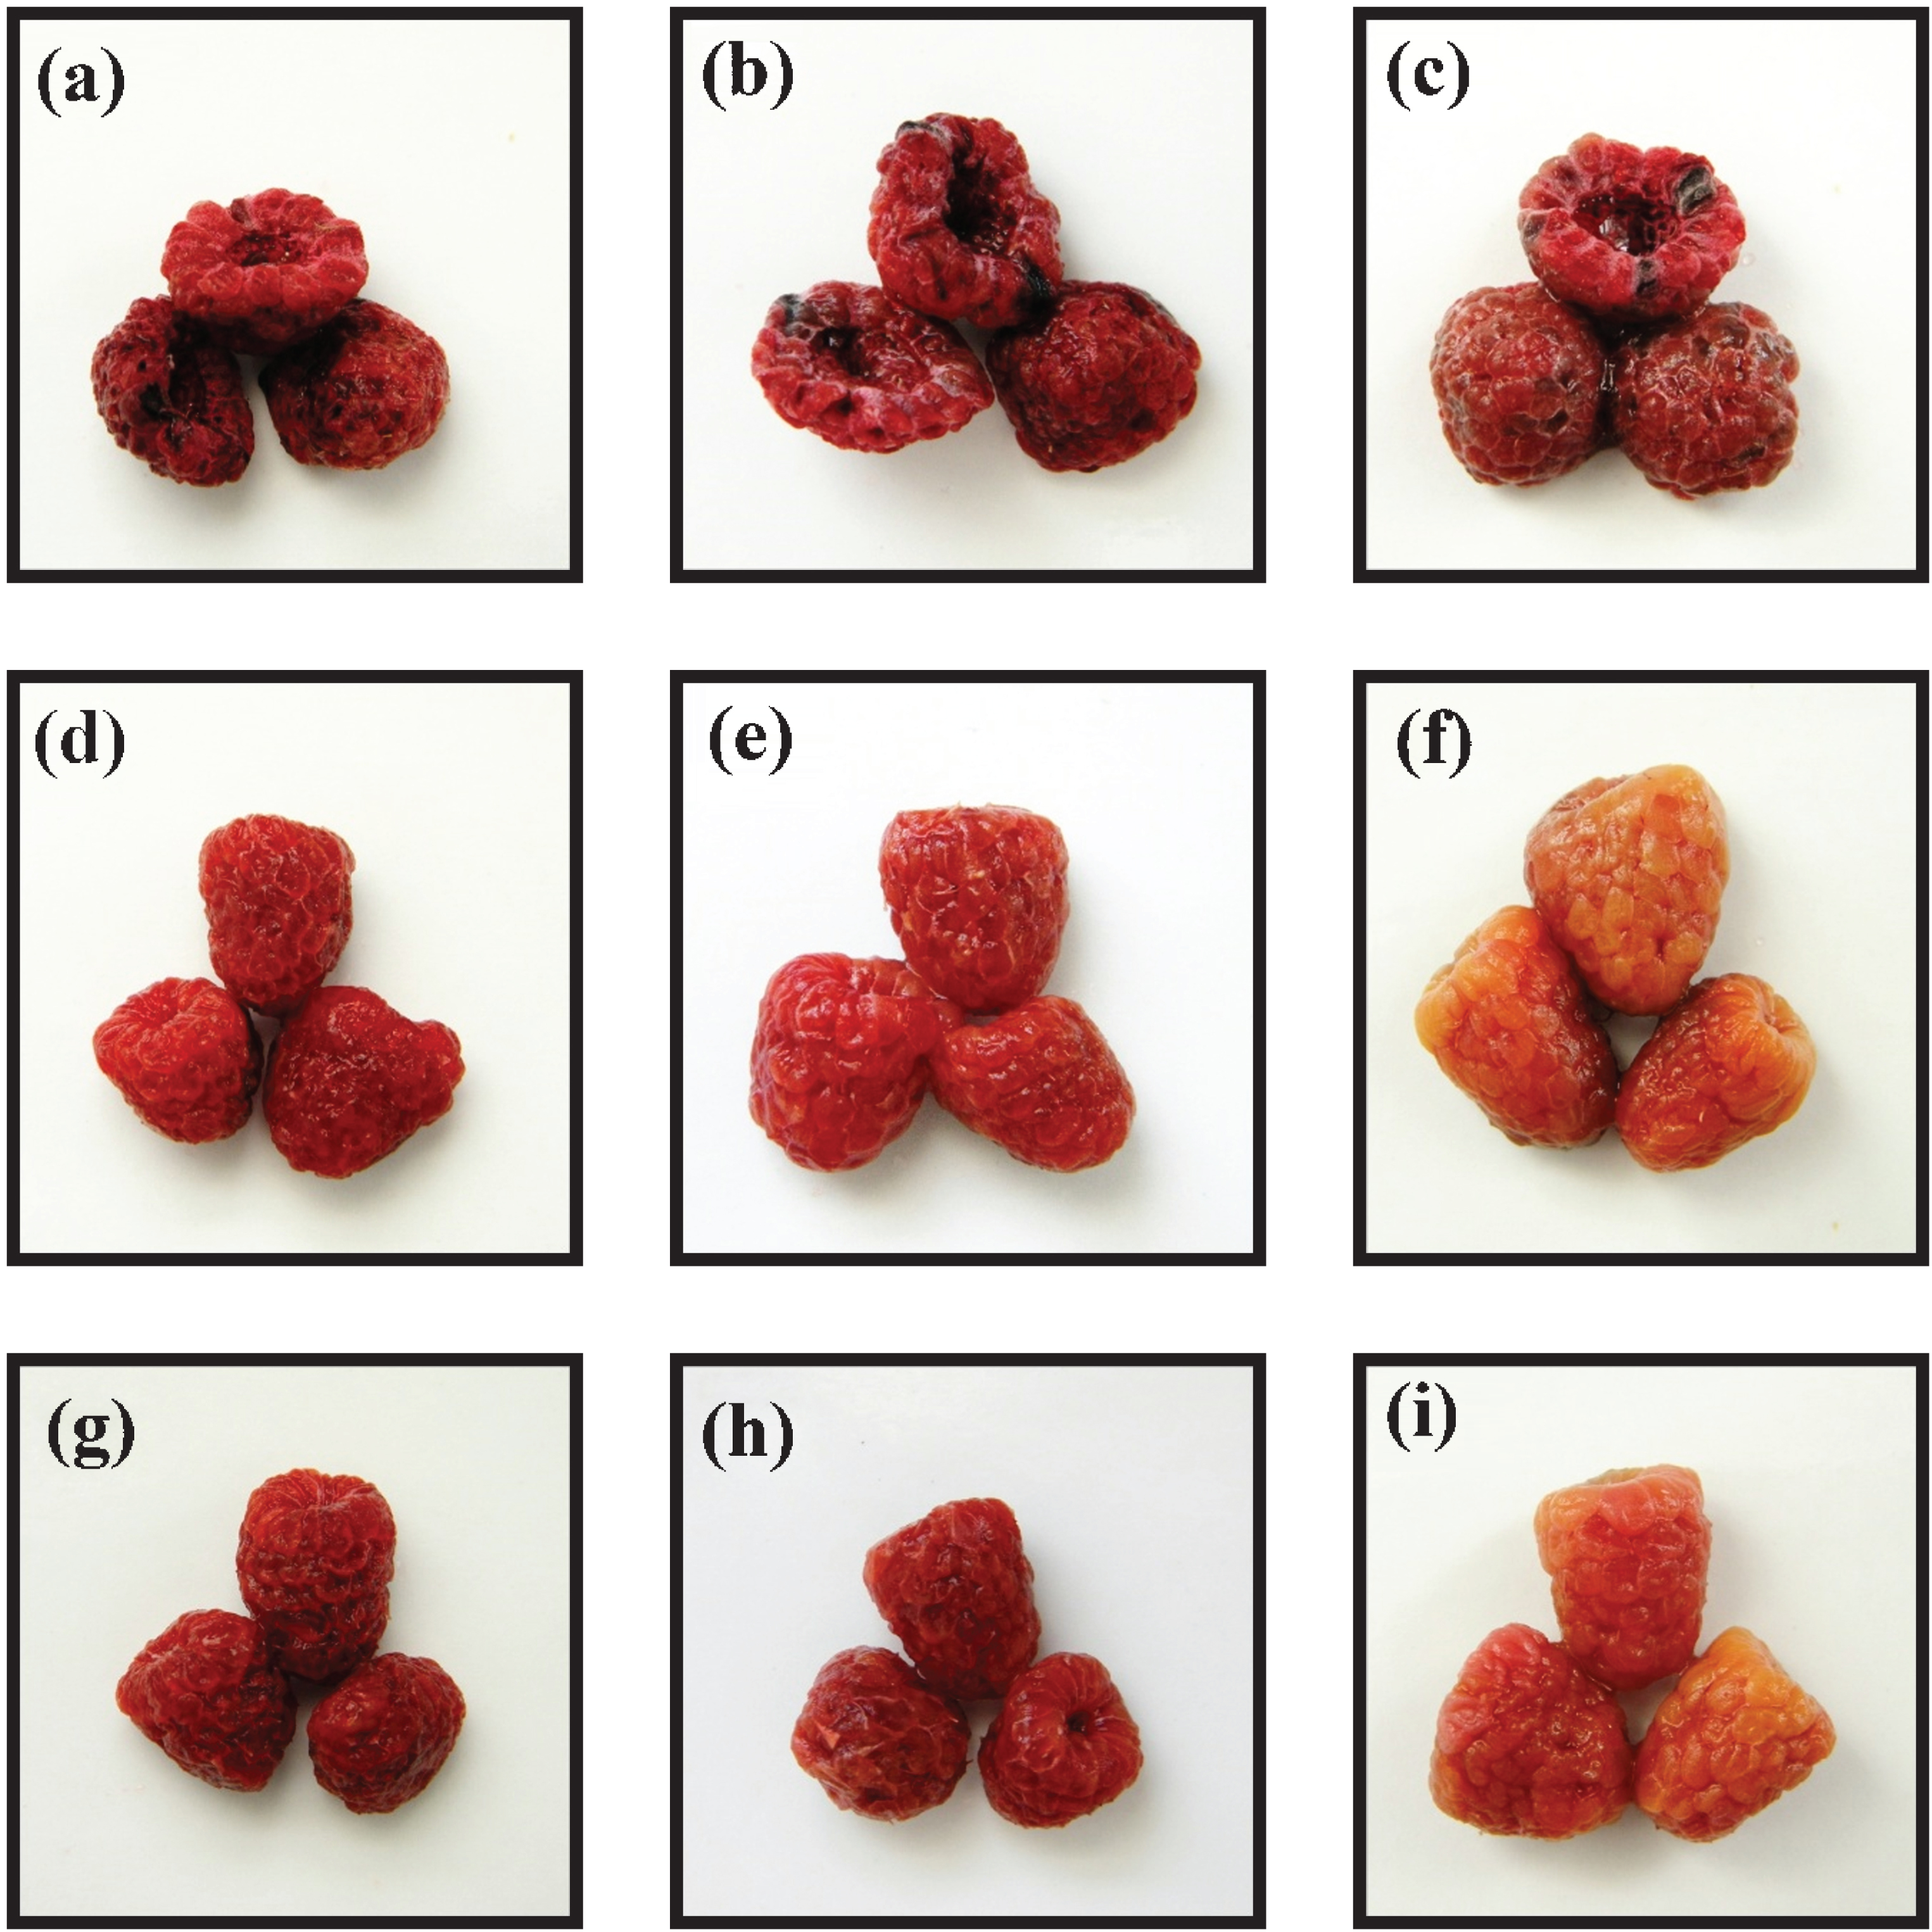
Fig.6
Images obtained after rehydration at 25°C of freeze-dried raspberries at different values of rehydration time. Control (C): 5 min (a), 20 min (b) and final (c). Wet infusion (WI-BAC): 5 min (d), 20 min (e) and final (f). Dry infusion (DI-BAC): 5 min (g), 20 min (h) and final (i).
Regarding luminosity, all the rehydrated samples showed higher L* values than the fresh raspberry (L* = 24.4±2.2). Usually the drying processes promotes an increase in the luminosity values with respect to the original sample because during dehydration the water present in the intra- and intercellular spaces are replaced by air, providing dehydrated matrices with an opaque and pale appearance (>L*). This fact is related to diffusion of light in materials with interfaces of different refractive indices [35]. After the rehydration process, this phenomenon is expected to be reversed; however, due to pigments loss and structure changes occurring during drying and rehydration, the luminosity remains higher than the control fresh sample. Noteworthy, both freeze- and air-dried control samples preserved the red hues and did not show significant changes in L*during rehydration.
4Conclusions
The evaluation of quality parameters after rehydration of raspberries, such as color, anthocyanin loss, mechanical properties and volume changes, as well as the evaluation of rehydration indices appeared to be useful to select the best drying and rehydration conditions.
The statistical indicators used to evaluate the goodness of fit of the two models applied indicated the Weibull function as the most suitable to describe rehydration behavior, which was significantly affected by the drying methods and the use of pretreatments. Although freeze-drying allowed a rapid water uptake when used alone, it was not efficient to restore the lost water, since structural changes induced by the freezing step and rehydration temperature had a great influence on the tissue ability to imbibe water and fully rehydrate. However, in terms of quality, these samples exhibited a higher retention of anthocyanin and color, and a soft texture. In those situations where a high rehydration rate is not desired and raisin-like raspberries are required, fruits with pretreatments should be selected mainly DI-BAC with further air-drying, since these samples better maintained texture characteristics during a short period of consumption (5–20 min); however, the anthocyanin content is lower than that for control samples.
Conflict of interest
The authors have no conflict of interest to report.
Acknowledgments
The authors acknowledge the financial support from University of Comahue, University of Buenos Aires, the National Council for Scientific and Technical Research and the National Agency for the Promotion of Scientific and Technical Research of Argentina.
REFERENCES
[1] | Bobinaite R , Viškelis P , Venskutonis PR . Variation of total phenolics, anthocyanins, ellagic acid and radical scavenging capacity in various raspberry (Rubuss) cultivars. Food Chemistry. (2012) ;132: :1495–501. |
[2] | Sette PA , Franceschinis L , Schebor C , Salvatori D . Fruit snacks from raspberries: Influence of drying parameters on colour degradation and bioactive potential. International Journal of Food Science and Technology. (2017) ;52: :313–28. |
[3] | Lee KT , Farid M , Nguang SK . The mathematical modelling of the rehydration characteristics of fruits. Journal of Food Engineering. (2006) ;72: :16–23. |
[4] | Lewicki PP . Some Remarks on Rehydration of Dried Foods. Journal of Food Engineering. (1998) ;36: :81–7. |
[5] | Meda L , Ratti C . Rehydration of freeze-dried strawberries at varying temperatures. Journal of Food Process Engineering. (2005) ;28: :233–46. |
[6] | Voda A , Homan N , Witek M , Duijster A , Van Dalen G , Van Der Sman R , Nijsse J , Van Vliet L , Van As H , Van Duynhoven J . The impact of freeze-drying on microstructure and rehydration properties of carrot. Food Research International. (2012) ;49: :687–93. |
[7] | Amami E , Fersia A , Khezamia L , Vorobieva E , Kechaou N . Centrifugal osmotic dehydration and rehydration of carrot tissue pre-treated by pulsed electric field. LWT - Food Science and Technology. (2007) ;40: :1156–66. |
[8] | Lenart A . Effect of saccharose on water sorption and rehydration of dried carrot. In Handbook of Drying ’91; Mujumdar A.S. , Filkova I. , Eds.; Elsevier: Amsterdam. (1991) :489–98. |
[9] | Lewicki PP . Effect of pre-drying treatment, drying and rehydration on plant tissue properties: A review. International Journal of FoodProperties. (1998) ;1: :1–22. |
[10] | Aguado Alonso J , Calles MJA , Cañizares P , López Perez B , Santos López A , Serrano Granados DP . Operaciones de conservación de alimentos; Ingeniería de la Industria Alimentaria: Editorial Síntesis. (2002) . |
[11] | Bremman JG , Butters JR , Cowell ND , Lilly AEV , Dehydration in food engineering operations, 3rd Ed, Elsevier Applied Science. (1990) :311–415. |
[12] | Vega-Gálvez A , Notte-Cuello E , Lemus-Mondaca R , Zura L , Miranda M . Mathematical modelling of mass transfer during rehydration process of Aloe vera (Aloe barbadensis Miller). Food and Bioproducts Processing. (2009) ;87: :254–60. |
[13] | Sette PA , Franceschinis L , Schebor C , Salvatori D . Osmotic dehydrated raspberries: Changes in physical aspects and Bioactive Compounds. Drying Technology. (2015) ;33: :659–70. |
[14] | Sette PA , Salvatori D , Schebor C . Physical and mechanical properties of raspberries subjected to osmotic dehydration and further dehydration by air- and freeze-drying. Food and Bioproducts Processing. (2016) ;100: :156–71. |
[15] | Goula AM , Adamopoulos KG . Modeling the rehydration process of dried tomato. Drying Technology. (2009) ;27: :1078–88. |
[16] | Wang J , Chao Y . Effect of 60Co irradiation on drying characteristics of apple. Journal of Food Engineering. (2003) ;56: :347–51. |
[17] | Association of Official Analytical Chemists (AOAC). Official Methods of Analysis 15th ed, Association of Official Analytical Chemists, Inc.: Virginia, (1990) . |
[18] | Nikkhah E , Khayamy M , Heidari R , Jamee R . Effect of Sugar Treatment on Stability of Anthocyanin Pigments in Berries. Journal of Biological Sciences. (2007) ;7: :1412–7. |
[19] | Guisti MM , Wrolstad RE . Anthocyanins. Characterization and measurement with UV-visible spectroscopy. In Handbook of Current protocols in food analytical chemistry; Wrolstad R.E. , Acree T.E. , Decker E.A. , Penner M.H. , Reid D.S. , Schwart S.H. , Eds.; John Wiley and Son, Inc.: New York. (2001) ; Unit F.1.2.1-Unit F.1.2.13. |
[20] | Krüger E , Dietrich H , Schöpplein E , Rasima S , Kürbel P . Cultivar, storage conditions and ripening effects on physical and chemical qualities of red raspberry fruit. Postharvest Biology and Technology. (2011) ;60: :31–7. |
[21] | Marabi A , Livings S , Jacobson M , Saguy IS . Normalized Weibull distribution for modeling rehydration of food particulates. European Food Research and Technology. (2003) ;217: :311–8. |
[22] | García-Pascual P , Sanjuán N , Melis R , Mulet A . Morchella esculenta (morel) rehydration process modelling. Journal of Food Engineering. (2006) ;72: :346–53. |
[23] | Witrowa-Rajchert D , Lewicki PP . Rehydration properties of dried plant tissues. International Journal of Food Science and Technology. (2006) ;41: :1040–6. |
[24] | Harnkarnsujarit N , Kawai K , Watanabe M , Suzuki T . Effects of freezing on microstructure and rehydration properties of freeze-dried soybean curd. Journal of Food Engineering. (2016) ;184: :10–20. |
[25] | Petzold G , Aguilera JM . Ice morphology: Fundamentals and technological applications in foods. Food Biophys. (2009) ;4: :378–96. |
[26] | Falade KO , Abbo ES . Air-drying and rehydration characteristics of date palm (Phoenix dactylifera L.) fruits. Journal of Food Engineering. (2007) ;79: :724–30. |
[27] | Alzamora SM , Castro MA , Nieto AB , Vidales SL , Salvatori DM . The rol of tissue microstructure in the textural characteristics of minimally processed fruits. In Handbook of Minimally processed fruits and vegetables; Alzamora S.M. , Tapia M.S. , López-Malo A. , Eds.; Aspen Publishers Inc.: Maryland. (2000) ;153–71. |
[28] | Marín EB , Lemus RM , Flores VM , Vega AG . La rehidratación de alimentos deshidratados. Revista Chilena de Nutrición. (2006) ;33: (3), 527–38. |
[29] | Prothon F , Ahrne L , Sjoholm I . Mechanisms and prevention of plant tissue collapse during dehydration: A critical review. Critical Reviews in Food Science and Nutrition. (2003) ;43: :447–79. |
[30] | Maldonado S , Arnau E , Bertuzzi MA . Effect of temperature and pretreatment on water diffusion during rehydration of dehydrated mangoes. Journal of Food Engineering. (2010) ;96: :333–41. |
[31] | Krokida MK , Marinos-Kouris D . Rehydration kinetics of dehydrated products. Journal of Food Engineering. (2003) ;57: :1–7. |
[32] | Femenia A , Bestard MJ , Sanjuan N , Rossello C , Mulet A . Effect of rehydration temperature on the cell wall components of broccoli (Brassica oleracea L. Var. italica) plant tissues. Journal of Food Engineering. (2000) ;46: :157–63. |
[33] | Khalloufi S , Ratti C . Quality deterioration of freeze-dried foods as explained by their glass transition temperature and internal structure. Journal of Food Science. (2003) ;68: :892–903. |
[34] | Prothon F , Ahrné LM , Funebo T , Kidman S , Langton M , Sjokhölm I . Effects of combined osmotic and microwave dehydration of apple on texture, microstructure and rehydration characteristics. Lebensm.-Wiss. u.-Technology. (2001) ;34: :95–101. |
[35] | Saarela JMS , Heikkinen SM , Fabritius TEJ , Haapala AT , Myllylä RA . Refractive index matching improves optical object detection in paper. Measurement Science and Technology. (2008) ;19: :1–7. |


