
The impact of moisture sorption properties on the color and bioactives concentrations of black currant-yerba mate instant drinks
Abstract
BACKGROUND: Black currant (BC) and yerba mate (YM) have high contents of polyphenolic antioxidants beneficial for health. Obtaining freeze-dried BC/YM instant drinks can be a means for providing their advantages to consumers. However, their high sugar contents make them very hygroscopic causing undesirable changes in color and bioactives concentration.
OBJECTIVE: To solve this problem it is necessary to determine the powder’s sorption properties and the temperature/relative humidity’s (RH) influence on their color and polyphenol, ascorbic acid and anthocyanins’s concentrations.
METHODS: We analyzed the sorption isotherms of freeze-dried BC/YM/maltodextrin/sugar powder at 10/20/40°C and compared them with those from YM/maltodextrin.
RESULTS: Of all models tested (Caurie, GAB, Halsey, Oswin) GAB was the best. Monolayer moisture values (Wm) were ≤0.1 kg H2O (kg d.m)−1 indicating good stability. Due to its higher sugar content, BC/YM powders were more hygroscopic and with higher exothermic isosteric sorption heat (Qst) than YM powders. Qst and differential entropy decreased exponentially with increasing moisture levels. Within the experimental conditions, isokinetic theory indicated that the whole sorption process was enthalpy controlled. Temperature and RH strongly modified BC/YM’s color and ascorbic acid and monomeric anthocyanins concentrations. At all temperatures, optimum levels of these properties required RH ≤33%. To achieve maximum physicochemical quality and stability the powder’s moisture content must be ≤Wm, in this case, RH dropped to 9% (10°C) and 11.3% (20°C/40°C).
Abbreviations
YM | Yerba mate |
BC | black currant |
MD10 | Maltodextrin Dextrose Equivalent 10 |
d.m. | Dry matter |
aw | Water activity |
RH | Relative humidity |
Wc | Equilibrium moisture content (kg H2O (kg d.m)−1) |
Wm | Equilibrium monolayer moisture content (kg H2O (kg d.m)−1) |
Xs | Security water contents; Caurie model (kg H2O (kg d.m)−1) |
q0 | Net isosteric heat of the first water molecule (kJ mol−1) |
A/B | Halsey and Oswin models constants |
% E | Mean relative deviation modulus |
KGAB/CGAB | GAB model constants |
V | Caurie model constant |
T | Absolute temperature (K) |
Thm | Harmonic mean temperature (K) |
Tβ | Isokinetic temperature (K) |
R | Universal gas constant (0.008314 kJ mol−1 K−1) |
qstn | Net isosteric heat (kJ mol−1) |
Qst | Total heat of sorption (kJ mol−1) |
ΔHvap | Free water’s latent heat of vaporization (kJ mol−1) |
ΔSd | Differential entropy (kJ mol−1 K−1) |
ΔGβ | Free energy (kJ mol−1) at Tβ |
TP | Total phenolic content (mg gallic acid equivalents (g d.m (dry matter))−1) |
MAC | Monomeric anthocyanin content (mg cyanidin-3-glucoside equivalents (g d.m.)−1 |
L*, a*, b* | CIELab color coordinate |
ΔE* | Total color difference |
SI | saturation index |
HA | hue angle |
AA | Ascorbic acid content (mg AA (100 g d.m.)−1) |
1Introduction
Black currant (Ribes nigrum; BC) is an excellent source of antioxidants [1] with a wide range of health benefits including antioxidant, antimicrobial, anti-carcinogenic and neuroprotective activities, vision improvement and induction of apoptosis [2–4]. BC has a particularly high content of phenolic compounds and anthocyanins and is the richest source of vitamin C among all berry fruit species [5].
Yerba mate (Ilex paraguariensis; YM), a native plant from South America, has a high content of polyphenols and flavonoids with antioxidant and hepatoprotective properties [6], as well as the capacity to improve the cardiovascular [7] and central nervous systems [8]. Moreover, its high caffeine content makes it a good ingredient for the preparation of natural energy drinks.
Consumption of yerba mate infusions alone or combined with juices is popular in Argentina, Brasil and Uruguay. Producing a beverage combining mate infusions with black currant juice can be a simple and effective mean for providing their health benefits to many consumers.
Drying is one of the most common methods used for preserving fruit juices; dried juices have several advantages compared to the fresh product, including, reduced transportation and distribution’s costs, extended shelf life at room temperatures and overall convenience. They can be consumed as final products per se or used as ingredients or additives (colorants or flavoring agents) in other foods. In the case of yerba mate infusions, the dried product can also be used as an ingredient in energy drinks.
Black currant is a highly perishable, thermally sensitive seasonal product therefore; a drying technique like freeze-drying can be applied to minimize the loss of its nutritional and sensory properties.
Drying or freeze-drying fruit juices or other products with high sugar content presents technical difficulties, the low glass transition temperature of some components (low molecular weight sugars and organic acids) and their high hygroscopicity causes stickiness, collapse and flow problems during processing and storage [9]. Although the addition of carrier agents like maltodextrin before drying can help to reduce this problem, to obtain powders with optimum quality and stability during storage the moisture sorption properties of the powder must be considered [10].
Moisture sorption isotherms describe the relationship between water activity and equilibrium moisture content of a particular food at specified pressures and temperatures. They are important for calculating the moisture level corresponding to optimum food stability [11] and other thermodynamic functions like the isosteric heat of sorption, the differential entropy and the mechanisms that control the sorption process [10].These properties are used in the design, modeling and optimization of the drying process as well as for predicting the powder’s stability and quality during packaging and storage [12]. Variation of heat of sorption with moisture provides valuable information for energy requirements calculations and knowledge of the extent of the water/solid vs water/water interaction.
Color and color stability are key factors in consumers’ acceptability of berry juices [1]. In addition, Tuorilla and Cardello [13] reported that providing information regarding the health benefits of certain food product may increase its acceptance and facilitate its marketing.
The attractive red color of the black currant juice is mainly due to the presence of anthocyanins; these compounds, as well as ascorbic acid and the polyphenols are the most important antioxidants in this drink and their stability is highly affected by temperature and the powder’s humidity content [14]. Therefore, to obtain a high quality instant drink based on YM and BC juice a thorough analysis of the color, polyphenol, ascorbic acid and anthocyanins relationship with temperature and the moisture sorption capacity of the powders is needed.
The objectives of this study were (a) to determine and model the adsorption isotherms of freeze-dried black currant juice combined with yerba mate extracts at 3 temperatures (10°C, 20°C and 40°C); (b) to calculate the isosteric heat of sorption and the differential entropy, (c) to determine the mechanism that controls the moisture sorption process and (d) to analyze the relationship between moisture sorption capacity, color and total polyphenols, anthocyanins and ascorbic acid contents.
2Materials and methods
2.1Raw materials and beverage preparation
Figure 1 describes the process followed for the beverages preparation. To prepare the freeze-dried yerba mate infusion, 60 g/L of commercial yerba mate leaves (Ilex paraguariensis St Hil; La Unión Suave, Est. Las Marias SAIC, Gob. Virasoro, Argentina) were extracted at 100°C for 15 min, decanted for 15 min at 25°C and filtered. A fraction of the filtrate (3°Brix; pH 5.5) was mixed with 15% w/v Maltodextrin Dextrose Equivalent 10 (MD; Productos de Maíz S.A., Buenos Aires, Argentina) and freeze dried at room temperature with a FIC L1-1-E300-CRT freeze dryer (Buenos Aires, Argentina) operated with a freezing plate at –35°C and a vacuum below 100μm.
The organic ripe black currant berries (Ribes nigrum cv. Silvergieter;) provided by Chacras Cuyen, (El Bolson, Chubut, Argentina) were harvested during January 2012 and stored at –20°C for 270 days. 24 h before the beverage preparation, the fruit was defrosted and processed in an industrial fruit pulper (Filter net pore diameter: 2 mm). The pulp (BC; 40°Brix; pH 3.21) was mixed with the yerba mate filtrate in a 3:1 ratio, MD (15% w/v) and passion fruit aroma (0.01% w/w) and freeze-dried in the same conditions as the YMI. After freeze-drying the powders were homogenized with sugar (4.95%) and a commercial diet sweetener (0.05%; Ciclamate 5700 mg/100 g; Sacarin 2000 mg/Dextrose).
2.2Water sorption isotherms
The adsorption isotherms of the YM and BC/YM freeze-dried powders were determined with the static gravimetric method [15, 16] at 10°C, 20°C and 40°C. The powder samples (in triplicate) were placed in hermetic containers filled with saturated solutions of different salts that provided environments with a constant relative humidity (RH) (LiCl (11.3%); CH3COOK (23.4%); MgCl2 (33%); K2CO3 (43.2%); Mg(N03)2 (54.4%) and NaCl (76%)) and were kept in a temperature-controlled chamber. The samples were weighed every 3 days until reaching equilibrium (difference between 2 consecutive weights < ±0.003 g), the equilibration period lasted 2 to 3 weeks. At this point, the equilibrated sample’s water activity (aw) can be considered equal to the corresponding RH/100 [17].
2.3Water activity and moisture content analysis
The water activity was measured at 25°C in an AquaLab serie 3 (Decagon Device, Pullman, Washington, USA), calibrated with the saline solutions used for the sorption experiments.
The moisture content was analyzed gravimetrically with the AOAC method [18]. The lyophilized samples were dried in a vacuum oven (Sanjor serie SL DB; Buenos Aires, Argentina) at 105±1°C until constant weight. Both assays were done in triplicate.
2.4Mathematical modelling of the water sorption isotherm and statistical comparisons
The relationship between the equilibrium moisture content (Wc) and the aw of the powder drinks was predicted using 2 (Caurie; Halsey and Oswin) and 3 parameters (Guggenheim-Anderson-de Boer (GAB)) models commonly used for food (Table 1; [10]). In these equations, Wc, Wm and Xs represent the equilibrium monolayer and security water contents respectively while C, K, A and B are all dimensionless constants present in the different models [10].
The parameters were estimated using nonlinear regression analysis with the Origin Pro v 8.0 (OriginLab Corp., Northhampton, MA USA) and Systat 12 (Systat Software Inc; San Jose, CA USA) softwares. The selection of the most appropriate model was based on its goodness of fit, evaluated with the mean relative deviation modulus (% E) defined by Equation (5) [17].
(5)
In the case of the GAB equation, Lewicki [19] concluded that for a good description of sigmoidal type isotherms and to assure that the difference between the true and predicted Wm results is less than±15%, the KGAB and CGAB values must comply with: 0.24 < KGAB≤1 and 5.67≤CGAB≤∞.
2.5Thermodynamic properties
The net isosteric heat or differential enthalpy of sorption (qstn; kJ mol−1), the total heat of sorption (Qst, kJ mol−1) and the differential entropy (ΔSd; kJ mol−1 K−1) were calculated from the equilibrium data using the following equations [20].
(6)
(7)
aw | wc represents the predicted water activity value for a specific equilibrium moisture content (Wc); ΔHvap is the free water’s latent heat of vaporization calculated at the average temperature between 283 and 313K (298K; 44.05 kJ mol−1), R the universal gas constant (0.008314 kJ mol−1 K−1) and T the absolute temperature (K).
qstn and ΔSd were calculated from the slope (– qstn/R) and the intercept (ΔSd/R) of the ln(aw) vs 1/T plot (Equation 6) at each Wc.
The relationship between qstn or Qst and the equilibrium moisture content was determined with the empirical equation proposed by Tsami et al. [21] (Equation (8)).
(8)
(9)
2.6Enthalpy-entropy compensation theory
The enthalpy-entropy compensation theory proposes a linear relationship between qstn and ΔSd according to Equation (10) [22].
(10)
Tβ is the isokinetic temperature (K) and represents the temperature at which all reactions proceed at the same rate and ΔGβ is the free energy (kJ mol−1) at Tβ. Both parameters were estimated by fitting Equation 10 to the qstn and ΔSd results calculated previously.
Krug et al. [23] concluded that a linear chemical compensation pattern also requires that Tβ must be different from the harmonic mean temperature (Thm) defined as:
(11)
An approximate (1– α)100% confidence interval for Tβ was calculated using Equations (12), (13) and (14) [24]
(12)
(13)
(14)
2.7Total polyphenols and monomeric anthocyanins contents
The total phenolic content of the extracts (TP; mg GAE (gallic acid equivalents) (g d·m. (dry matter))−1 was assessed with the Folin-Ciocalteau method reported by Schlesier et al. [25], using a UVmini-1240 UV-Vis Spectrophotometer (Shimadzu Scientific Instruments, Japan).
The monomeric anthocyanin (MAC) content of the BC/YM powder was determined with the pH differential method [26]. The monomeric anthocyanins were extracted with ethanol: HCl 0.1N (85:15). After diluting the extracts with buffer to achieve an appropriate concentration range, the absorbancies were read at 520 (λmax) and 700 nm with a spectrophotometer U-1900 (HITACHI, Japan).
(15)
(16)
MAC was expressed as mg CyGE (cyanidin-3-glucoside equivalents) (g d.m.)−1; molecular weight (MW) = 449.2 g mol−1; extinction coefficient (ɛ) = 26900 L cm−1 mol−1; DF = dilution factor [26].
2.8Color analysis
Color was measured on triplicate samples with a Minolta CR-400 Chroma Meter (Minolta, Osaka, Japan), each value was the average of 9 measurements on duplicate samples.
Color was expressed by CIE L* (lightness), a* (redness), b* (yellowness), saturation index (SI) and hue angle (HA) [27]. SI, a measure of color intensity, was computed as:
(17)
HA represents the psychometric hue and was calculated as:
(18)
An increase in HA towards more positive values or a reduction to more negative indicated an enhancement in yellowness or blueness respectively.
The total color difference (ΔE*) with respect to the samples color coordinates before equilibration (
(19)
2.9Ascorbic acid analysis
To analyze moisture sorption’s influence on the ascorbic acid (AA) content,, the equilibrated samples (0.5 g) were extracted with an aqueous solution of metaphosporic acid (HPO3 ; 50 g L−1; Carlo Erba S.A, BCN, España) followed by centrifugation at 2000 rpm (Rolco CM 2036, Buenos Aires, Argentina).
AA concentration was determined by high performance liquid chromatography (Waters, model R-414, Milford, MA, USA). The method consisted of an isocratic elution procedure with UV-Visible detection at 245 nm using AA (Food grade, Parafarm) as external standard. Before injection, the extracts were filtered with a pre-filter and a 0.45μm millipore membrane.
Separations were carried out on a 5 mm RP C18 column of 150 mm –4.6 mm (Symmetry, Waters, Dublin, Ireland) at 25°C. The mobile phase was a mixture of 5 g L−1 HPO3 metaphosporic acid–acetonitrile (93:7) [28] with a flow rate = 1 mL min−1. To prevent the loss of AA, standard solutions and extracted samples were protected from light.
Quantitation was performed by comparing the chromatographic peak area with that of the external standard. The calibration curve was plotted in the concentration range of 0.5–200 mg L–1 and based on a 10-point calibration.
2.10Statistical analysis
The effect of temperature and water activity on the color, TP, ascorbic acid and anthocyanins content was analyzed using the SYSTAT 12 and Infostat (v. 2013) software. Significant differences among means were determined by analysis of variance followed by pairwise comparisons with the Tuckey test. P values < 0.05 were considered statistically significant.
3Results and Discussion
3.1Moisture sorption isotherms
The initial aw and moisture content values of the freeze-dried beverages were 0.089 and 0.0354 kg H2O (kg d.m)−1 for the BC/YM and 0.065 and 0.0216 kg H2O (kg d.m)−1 for the YM. Figures 2(a) and (b) show the aw influence on the BC/YM and YM powder drinks’ equilibrium moisture content (Wc; kg H2O (kg d.m)−1) at 10°C, 20°C and 40°C.
A comparison between the YM and BC/YM isotherms indicated that the incorporation of BC and commercial sucrose significantly increased (P < 0.05) the powder’s hygroscopicity, the effect was particularly strong for aw between 0.54 and 0.76 where the WcBC/YM levels were 35–40% higher. This behavior was expected as sugars are well known humectants [29]; similar results had been reported in high sugar content products like pineapple pulp [12], blueberry [10] and orange juice [30] powders.
In agreement with Al-Muhtaseb et al. [31] temperature increase reduced the equilibrium moisture content in both samples; Ferrari et al. [32] and Mosquera et al. [11] reported similar results working with spray dried blackberry or freeze-dried strawberry powders respectively. Pahlevanzadeh and Yazdani [33] suggested that the temperature rise enhanced the kinetic energy associated with the water molecules resulting in a reduction of the attractive forces H2O/sorbent and consequently in lower hygroscopicity levels.
The parameters obtained from the regression analysis of the different models (GAB; Caurie; Halsey and Oswin), the determination coefficient (R2) and the mean relative deviation modulus (% E) for BC/YM and YM are presented in Table 2. The GAB equation was the only one that satisfied [17] Lomauro et al. (1985) conclusions regarding goodness of fit criteria (E% <10 and highest R2) for the complete aw and temperature ranges. Additionally, the KGAB and CGAB values of the YM and BC/YM also fulfilled Lewicki’s (1997) [19] recommendations (Sec. 2.4), therefore this model was considered the most appropriate for all the thermodynamic properties analysis.
The experimental and predicted results (GAB equation) of the adsorption isotherms at the 3 working temperatures for the a) YM and b) BC/YM powders are presented in Fig. 2(a) and (b).
Monolayer moisture contents are of particular importance as they represent the moisture level corresponding to optimum food stability [11]; Labuza [34] concluded that Wm levels higher than 0.1 kg H2O (kg d·m)−1 may compromise food stability. Results showed that for all temperatures, the predicted Wm values of the YM and BC/YM samples were equal or less than that limit (Table 2) hence, the powders’ stability could be considered good.
Temperature increase reduced the monolayer moisture concentration of both beverages (Table 2), Vega-Gálvez et al. [10] and Perez-Alonso et al. [35] working with blueberries or pure MD, respectively, reported a similar effect, conversely, studies done with vacuum-dried lemon juice [36] or freeze-dried pineapple pulp [37] using 18% MD as a carrier did not show a clear trend.
At 10°C or 20°C, the YM’s Wm values were higher than those from the BC/YM samples, however, this difference was not significant (P > 0.05) in the 40°C isotherms. The BC/YM monolayer moisture content results at 20°C and 40°C were lower than those reported by Perez-Alonso et al. [35], for pure MD10 (0.07–0.073 kg H2O (kg d.m)−1) and by Gabas et al. [12], and Carvalho et al. [38], for vacuum dried persimmon or pineapple with 18% d.m MD10 (0.06–0.069 kg H2O (kg d.m)−1) at the same temperatures
3.2Thermodynamic properties
The net diferential isosteric heat of sorption (qstn), the differential heat of sorption and the differential entropy were estimated with Equations (6–8) and the equilibrium moisture concentrations predicted from the GAB model (Equation 1). In accordance with previous publications [12, 10], we detected a strong reduction in Qst with increasing Wc levels in both samples (Fig. 3) that were satisfactorily fitted with Equation (9) (R2 = 0.998; [21]. For all the Wc range tested, QstBC/YM was more negative than QstYM indicating that water binding in the BC/YM powders was stronger than in the YM. This is probably due to the greater concentration of sugars rich in free hydroxyl groups (capable of forming strong hydrogen bonds) in BC/YM than in the YM powders.
Increasing Wc from 0.059 to 0.1 kg H2O (kg d.m.)−1 reduced the isosteric heat of both samples 4 to 5 times. This was expected since the range corresponded to the monolayers moisture contents of the powders (Table 2) and in these conditions the binding energy between sorbate and sorbent is very high [20]. The predicted Qst results at the estimated Wm values were:
• BC/YM: 93.82 (0.041 kg H2O (kg d.m.)−1), 74.23, (0.056 kg H2O (kg d.m.)−1) and 67.95 kJ mol−1 (0.063 kg H2O (kg d.m.)−1)
• YM: 103.51 (0.039 kg H2O (kg d.m.)−1), 66.12 (0.064 kg H2O (kg d.m.)−1) and 47.52 kJ mol−1 (0.104 kg H2O (kg d.m.)−1)
The values between parentheses corresponded to the BC/YM and YM monolayer moisture levels (Table 2).
A further increase in moisture content (0.1 to 0.15 kg H2O (kg d.m.)−1) diminished the Qst of both samples, although it was still higher than ΔHvap, indicating that the energy sorbate/sorbent is greater than the energy between water molecules therefore new layers of water molecules are formed in the powder’s surface (multilayer sorption).
Results from Fig. 3 showed that at Wc contents between 0.18–0.3 kg H2O (kg d.m.)−1, QstBC/YM reached an asymptotic level similar to ΔHvap therefore it could be considered as the limit of bound water [21, 39] for this sample. In the case of the YM powders, Qst was similar to ΔHvap at 0.15 kg H2O (kg d.m.)−1.
Table 3 presented the net isosteric heat of the first water molecule (q0; kJ mol−1) and the characteristic moisture content of the food material (W0; kg water (kg d.m.)−1).
The differential entropy (ΔSd; kJ mol−1 K−1) was calculated from Equation (6) using the Wc values predicted by the GAB equation (see Section 2.4). The relationship between ΔSd and Wc was satisfactorily modeled (R2 = 0.996) with Equation (15) using the SigmaPlot software (Systat Inc; Fig. 4.)
(20)
The YM and BC/YM “a” and “b” parameters and their respective coefficients of determination (R2) are presented in Table 3.
To test the applicability of the isokinetic theory to the moisture sorption process of the YM and BC/YM powders, Equation (10) (See Section 2.6) was fitted to their respective qstn and ΔSd values (Fig. 5).
Table 3 shows the isokinetic temperature (Tβ), the free energy (ΔGβ) and the determination coefficient (R2) values calculated by regression analysis for both samples.
Validity of the theory requires that Tβ must be significantly different from the harmonic mean temperature (Thm) calculated with Equation 11 [23]. The isokinetic temperatures and their 95% confidence intervals of the YM and BC/YM powders were 329.99±0.70 K and 339.99±0.02 K significantly different (P < 0.05) from the harmonic mean temperature (301.52 K) used in this study. This fact combined with the high degrees of linearity (R2 > 0.999) obtained confirms the existence of qstn/ΔSd compensation; hence the isokinetic theory is a valid mean for describing the water sorption mechanism in both samples within the experimental conditions used.
The YM and BC/YM samples presented only one line of compensation each (Fig. 5), indicating that there is no change of mechanism in the whole moisture and temperature ranges studied. According to Leffler [40] if Tβ > Thm, the process is enthalpy driven where as in the opposite situation (Tβ < Thm) it is entropy controlled. Since our results comply with the former condition the process can be considered to be enthalpy driven i.e. the moisture sorption mechanism is controlled by the energy interactions related to the chemical composition of the YM and BC/YM powders. Beristain et al. [22] reached similar conclusions regarding the sorption process of dried figs, currants, apricots, plums and raisins.
3.3Temperature and relative humidity effects on ascorbic acid, total polyphenols and monomeric anthocyanins concentrations and the color of the BC/YM powders
The water activity, TP, MAC and color of the BC/YM powders before equilibration were:
aw = 0.089 TP = 33.56 mg GAE/g d.m MAC = 354.02 mg CyGE g d.m−1
L* = 52.46; a* = 21.57; b* = –2.83; SI = 21.76; HA = –0.13°
Equilibration diminished TP by 20% –33%. Statistical analysis of the temperature/relative humidity influence on total polyphenol (TP) contents (Table 4) demonstrated that at each temperature, TP was not affected by RH (P > 0.05). In addition, no significant effect (P > 0.05) was detected by increasing the temperature at a given RH value.
Figure 6 showed the MAC relationship with temperature and relative humidity. Results showed that although initially MAC (40°C) values were the highest (P < 0.05), increasing RH beyond 33% had an extremely negative impact on MAC(40°C)’s stability, at RH = 54% and 76%, MAC(40°C) dropped to 54 % and 8.6% of their original values respectively. In contrast, for 11% ≤RH < 54%, no losses (P > 0.05) were detected in the samples kept at 10°C/20°C; nevertheless, the effects of enhancing RH to 76 % were as detrimental as those observed at 40°C
Figure 7 shows the ascorbic acid/RH relationship of the BC/YM powders at 10°C, 20°C and 40°C. In comparison with the fresh pulp, processing and equilibration at the selected temperatures resulted in 80–83% losses in AA content.
Temperature and relative humidity had a significant effect (P > 0.05) on the ascorbic acid concentration (Fig. 7). In accordance with Sablani et al. [41], AA retention diminished with increasing temperatures; for 23% ≤RH≤76%, the ranking was:
AA(10°C) = AA(20°C) > > AA (40°C) (P < 0.05)
At 10°C and 20°C and RH between 11–54%, AA remained stable; on the other hand, at 40°C, increasing RH to 23% caused an AA loss of 37%, additional RH increments up to 54% did not affect AA(40°C) At all temperatures, AA concentration in samples equilibrated to 76% RH, fell to a minimum level of 99.58 mg AA (100 g d.m.)−1.
Figure 8A, B and C show the L*, SI and HA relationship with temperature and relative humidity. For RH ranging from 11% to 43%, the lightness (Fig. 8A) values at 10°C and 20°C were constant (P > 0.05), further increments in RH to 54% enhanced L* by 8% (P < 0.05). In the case of powders kept at40°C, no effect (P > 0.05) was detected for RH between 11% –33%, nevertheless at 43% RH the lightness levels were 7.7% greater. Equilibrating with relative humidity’s between 11% –54% enhanced L* 5.8% to 14.2%, in contrast, using 76% RH was extremely damaging; the lightness dropped 25% –35% compared with the samples before equilibration.
Within each temperature, RH variations between 11% –54% did not influence (P > 0.05) the saturation index (SI) levels (Fig. 8B); additionally, the temperature factor was significant only at 40°C (P < 0.05), SI values at 10°C and 20°C were 7 % higher than those at 40°C indicating a drop in color vividness in the latter temperature. At 76% relative humidity, the saturation indexes at all temperatures fell to 10% of their levels before equilibration.
Humidity increments from 11% to 54% did not modify HA at 10°C or 20°C nevertheless, when the temperature was raised to 40°C, the upper limit of the RH range corresponding to constant HA fell to 33% (Fig. 8C). At 76% RH, HA (10°C) diminished (P < 0.05) from –5.65° to –29.32° indicating a shift towards a greater blue input. HA(20°C) did not change (P > 0.05) and HA (40°C) increased (P < 0.05) from 5.79° to 40.26° which means a higher contribution of yellow. These differences could be explained considering that although for all temperatures b* (76% RH) values indicated an increment in yellowness (P < 0.05; data not shown), in the resulting HAs this effect was overcompensated (10°C) or suppressed (20°C) by their corresponding a* values.
Comparison of Fig. 8A, B, C and Fig. 6 showed that within 285.76–299.94 mg CyGE (g d.m.)−1 at 10°C/20°C and 347.72 –335.25 mg CyGE (g d.m.)−1 at 40°C, L*, SI and HA were independent of RH. Lowering MAC levels down to 30 –60 mg CyGE (g d.m.)−1 resulted in undesirable alterations in the 3 color parameters.
Relative humidity’s influence was also strong in other powder’s properties like caking and agglomeration. Visual observation of the BC/YM samples showed that enhancing RH values to 33% did not produce any noticeable stickiness, collapse or caking formation at at any of the temperatures used in the current study. However at 43.2% RH, slight degrees of stickiness and caking were detected that increased with temperature, in addition, at 76% RH water sorption was so high that the sample behaved like a leather.
In conclusion, to obtain the best results regarding the color, MAC and ascorbic acid contents at the selected temperatures, the BC/YM powders must be kept at relative humidities equal or less than 33%. However several reports [11, 34] recommended the use of Wc = Wm as a condition for obtaining maximum food stability; in this case, the RH values calculated with the GAB model (Equation 1) were: RH(10°C) = 9% and RH(20°C/40°C) = 11.31%.
4Conclusions
Comparison of the goodness of fit of the Caurie; Halsey, Oswin and GAB models indicated that that the latter one was the best for predicting the equilibrium moisture content of the YM and BC/YM samples at all the temperatures and water activities tested. The KGAB and CGAB estimated by regression analysis allowed an appropriate description of the YM and BC/YM isotherms and assured differences between the true and predicted Wm results lower than±15%.
Due to their greater content of sugars, the BC/YM freeze-dried powders were more hygroscopic than the YM, the effect was particularly noticeable at aw ranging 0.54–0.76, where the WcYMBC levels were 35–40% higher. This difference in the formulation also affected the differential isosteric heat of sorption; QstBC/YM was more negative than QstYM indicating that water binding in the BC/YM powders was stronger than in the YM.
The Qst and ΔSd dependence with moisture levels were modeled with empirical exponential equations. Qst reached an asymptotic level similar to ΔHvap at 0.15 kg H2O (kg d.m)−1 and 0.18 –0.3 kg H2O (kg d.m)−1 for the YM and BC/YM samples respectively.
Within the experimental conditions used, the isokinetic theory is a suitable mean for describing the water sorption mechanism in both samples, results suggested that this process occurs by enthalpy controlled mechanisms.
Temperature and water activity had a strong impact in the powders color as well as in their ascorbic acid and monomeric anthocyanins concentrations. To obtain a product with optimum properties at the selected temperatures samples must be exposed to RH≤33%. However, maximum quality and stability of food powders requires that Wc≤Wm which corresponds to relative humidity values of 9% (10°C) and 11.31% (20°C/40°C).
Acknowledgments
Generous financial support was provided by the Argentine National Institute of Yerba Mate (Instituto Nacional de la Yerba Mate, INYM).
We thank Dr Robin Shorthose for assisting with the English translation, Claudio Reyes for the ascorbic acid analysis, Est. Las Marias and Chacras Cuyen for providing the yerba mate and the black currant.
References
[1] | Casati CB , Sánchez V , Baeza R , Magnani N , Evelson P , Zamora MC . Relationships between colour parameters, phenolic content and sensory changes of processed blueberry, elderberry and blackcurrant commercial juices. Int J Food Sci Technol. (2012) ;47: :1728–36. |
[2] | Ramos S . Cancer chemoprevention and chemotherapy: Dietary polyphenols and signaling pathways. Mol Nutr Food Res. (2008) ;52: :507–26. |
[3] | Soobrattee MA , Bahorun T , Aruom OI . Chemopreventive actions of polyphenolic compounds in cancer. Biofactors. (2006) ;27: :19–35. |
[4] | Neto CC . Cranberry and blueberry: Evidence for protective effects against cancer and vascular diseases. Mol Nutr Food Res. (2007) ;51: :652–64. |
[5] | Szajdek A , Borowska EJ . Bioactive Compounds and Health-Promoting Properties of Berry Fruits: A Review Plant Foods Hum Nutr (2008) ;63: :147–56. |
[6] | Filip R , Ferraro GE . Researching on new species of “Mate”: Ilex brevicuspis. Phytochemical and pharmacology study. Eur J Nutr. (2003) ;42: :50–54. |
[7] | Heck C , Gonzalez de Mejía E . Yerba mate tea (Ilex paraguariensis): A comprehensive review on chemistry, health implications and technological considerations. J Food Sci. (2007) ;72: (9):138–51. |
[8] | González A , Vázquez A , Moyna P , Paz EA . Biological screening of Uruguayan medicinal plants. J Ethnopharmacol. (1993) ;39: (3):217–20. |
[9] | Bhandari BR , Howes T , Implication of glass transition for the drying and stability of dried foods. J Food Eng. (1999) ;40: :71–9. |
[10] | Vega-Gálvez A , Lopez J , Miranda M , Di Scala K , Yagnam F , Uribe E . Mathematical modelling of moisture sorption isotherms and determination of isosteric heat of blueberry variety O’Neil. Int J Food Sci Tech. (2009) ;44: :2033–41. |
[11] | Mosquera LH , Moraga G , Martinez-Navarrete N . Critical water activity and critical water content of freeze-dried strawberry powder as affected by maltodextrin and Arabia gum. Food Res Int. (2012) ;47: :201–6. |
[12] | Gabas AL , Telis VRN , Sobral PJA , Telis-Romero J . Effect of maltodextrin and arabic gum in water sorption thermodynamic properties of vacuum dried pineapple pulp powder. J Food Eng. (2007) ;82: :246–52. |
[13] | Tuorilla H , Cardello AV . Consumer responses to an off-flavor in juice in the presence of specific health claims. Food Qual Prefer. (2002) ;13: :561–9. |
[14] | Mazza G , Miniati E . Anthocyanins in Fruits Vegetables and Grains; CRC Press: Boca Raton, FL. (1993) . |
[15] | Rahman MS , Sablani SS Water activity measurement methods of foods. In: Rahman MS, Editors. Food properties handbook. 2nd ed. CRC Press. Boca Raton, USA. (2008) . p. 9–30. |
[16] | Demarchi SWM , Quintero-Ruiz N , Giner SA . Sorptional behaviour of rosehip leather formulations added with sucrose and polydextrose. Byosyst Eng. (2014) ;118: :83–94. |
[17] | Lomauro CJ , Bakshi AS , Labuza TP . Evaluation of food moisture sorption isotherm equations. Part I. Fruit, vegetable and meat products. LWT- Food Sci Technol. (1985) ;18: :111–7. |
[18] | AOAC (Association of Official Analytical Chemists). Official methods of analysis (16th ed.). Gaithersburg, USA. (1998) . |
[19] | Lewicki PP . The applicability of the GAB model for food water isotherms. Int J Food Sci Tech. (1997) ;32: :553–7. |
[20] | Telis-Romero J , Kohayakawa M , Silveira V Jr , Pedro MAM , Gabas AL . Enthalpy-entropy compensation based on isotherms of mango. Food Sci Technol Campinas. (2005) ;25: (2):297–303. |
[21] | Tsami E , Maroulis Z , Marinos-Kouris D , Saravacos G . Heat of sorption of water in dried fruits. Int J Food Sci Tech. (1990) ;5: (3):350–9. |
[22] | Beristain CJ , Garcia HS , Azuara E , Enthalpy-Entropy compensation in food vapor adsorption. J Food Eng. (1996) ;30: :405–15. |
[23] | Krug RR , Hunter WG , Grieger RA . Enthalpy-entropy compensation I. Some fundamental statistical problems associated with the Analysis of Van’t Hoff and Arrhenius data. J Phys Chem-US. (1976) ;80: :2335–41. |
[24] | McMinn WAM , Al-Muhtaseb AH , Magee TRA . Enthalpy-entropy compensation in sorption phenomena of starch materials. Food Res Int. (2005) ;38: :505–10. |
[25] | Schlesier K , Harwat M , Bohm V , Bitsch R . Assessment of antioxidant activity by using different in vitro methods. Free Radical Res. (2002) ;36: :177–87. |
[26] | Giusti M , Wrolstad RE . Characterization and Measurement of Anthocyanins by UV-Visible Spectroscopy. Curr Protoc Food Analyt Chem. (2001) ; F:F1:F1.2. |
[27] | Minolta. Precise color communication. Color control from perception to instrumentation. (1993) . |
[28] | Novakova L , Solich P , Solichova D . HPLC methods for simultaneous determination of ascorbic and dehydroascorbic acids Analyt Chem (2008) ;27: (10):942–58. |
[29] | Mathlouthi M . Water content, water activity, water structure and the stability of foodstuffs. Food Controxl. (2001) ;12: :409–17. |
[30] | Sormoli MN , Langrish TAG . Moisture sorption isotherms and net isosteric heat of sorption for spray-dried pure orange juice powder. LWT- Food Sci Technol. (2015) ;62: :875–82. |
[31] | Al-Muhtaseb AH , McMinn WAM , Magee TRA . Water sorption isotherms of starch powders Part Mathematical description of experimental data. J Food Eng. (2004) ;61: :297–307. |
[32] | Ferrari CC , Pimentel-Marconi S , Germer ID , Alvim F , Zaratini V , de Aguirre JM . Influence of carrier agents on the physicochemical properties of blackberry powder produced by spray drying. Int. J Food Sci Tech. (2012) ;47: (6):1237–45. |
[33] | Pahlevanzadeh H , Yazdani M . Moisture adsorption isotherms and isosteric energy for almond. J Food Eng. (2004) ;28: :331–45. |
[34] | Labuza TP , Ball LN Moisture Sorption: Practical Aspects of Isotherm Measurement and Use, 2nd ed. American Association of Cereal Chemists (MN). (2002) . p. 35–45. |
[35] | Pérez-Alonso C , Beristain CI , Lobato-Calleros C , Rodríguez-Hueso ME , Vernon-Carter EJ . Thermodynamic analysis of the sorption isotherms of pure and blended carbohydrates polymers. J Food Eng. (2006) ;77: :753–60. |
[36] | Martinelli L , Gabas AL , Telis-Romero J . Thermodynamic and quality properties of lemon juice as affected by maltodextrina and arabic gum. Drying Technol. (2007) ;25: :2035–45. |
[37] | Viganó J , Azuara E , Telis VRN , Beristain CI , Jiménez M . Role of enthalpy and entropy in moisture sorption behavior of pineapple pulp powder produced by different drying methods. Thermo Chim. (2012) ;528: :63–71. |
[38] | Carvalho P , Benedetti D , Marques-Pedro M , Telis-Romero J . Nicoletti-Telis VR Influence of encapsulating materials on water sorption isotherms of vacuum-dried persimmon pulp powder. J Food Process Preserv. (2011) ;35: :423–31. |
[39] | Iglesias AS , Chirife J . Isosteric heats of water sorption on dehydrated foods. Part I. Analysis of the differential heat curves. LWT- Food Sci Technol. (1976) ;9: :116–22. |
[40] | Leffler JE . The enthalpy-entropy relationship and its implication in organic chemistry. J Org Chem. (1955) ;20: :1202–31. |
[41] | Sablani SS , Al-Belushi K , Al-Marhubi I , Al-Belushi R . Evaluating stability of vitamin C in fortified formula using water activity and glass transition. Int J Food Pro. (2007) ;10: :61–71. |
Figures and Tables
Fig.1
Process followed for preparing the freeze-dried YM and BC/YM drinks.
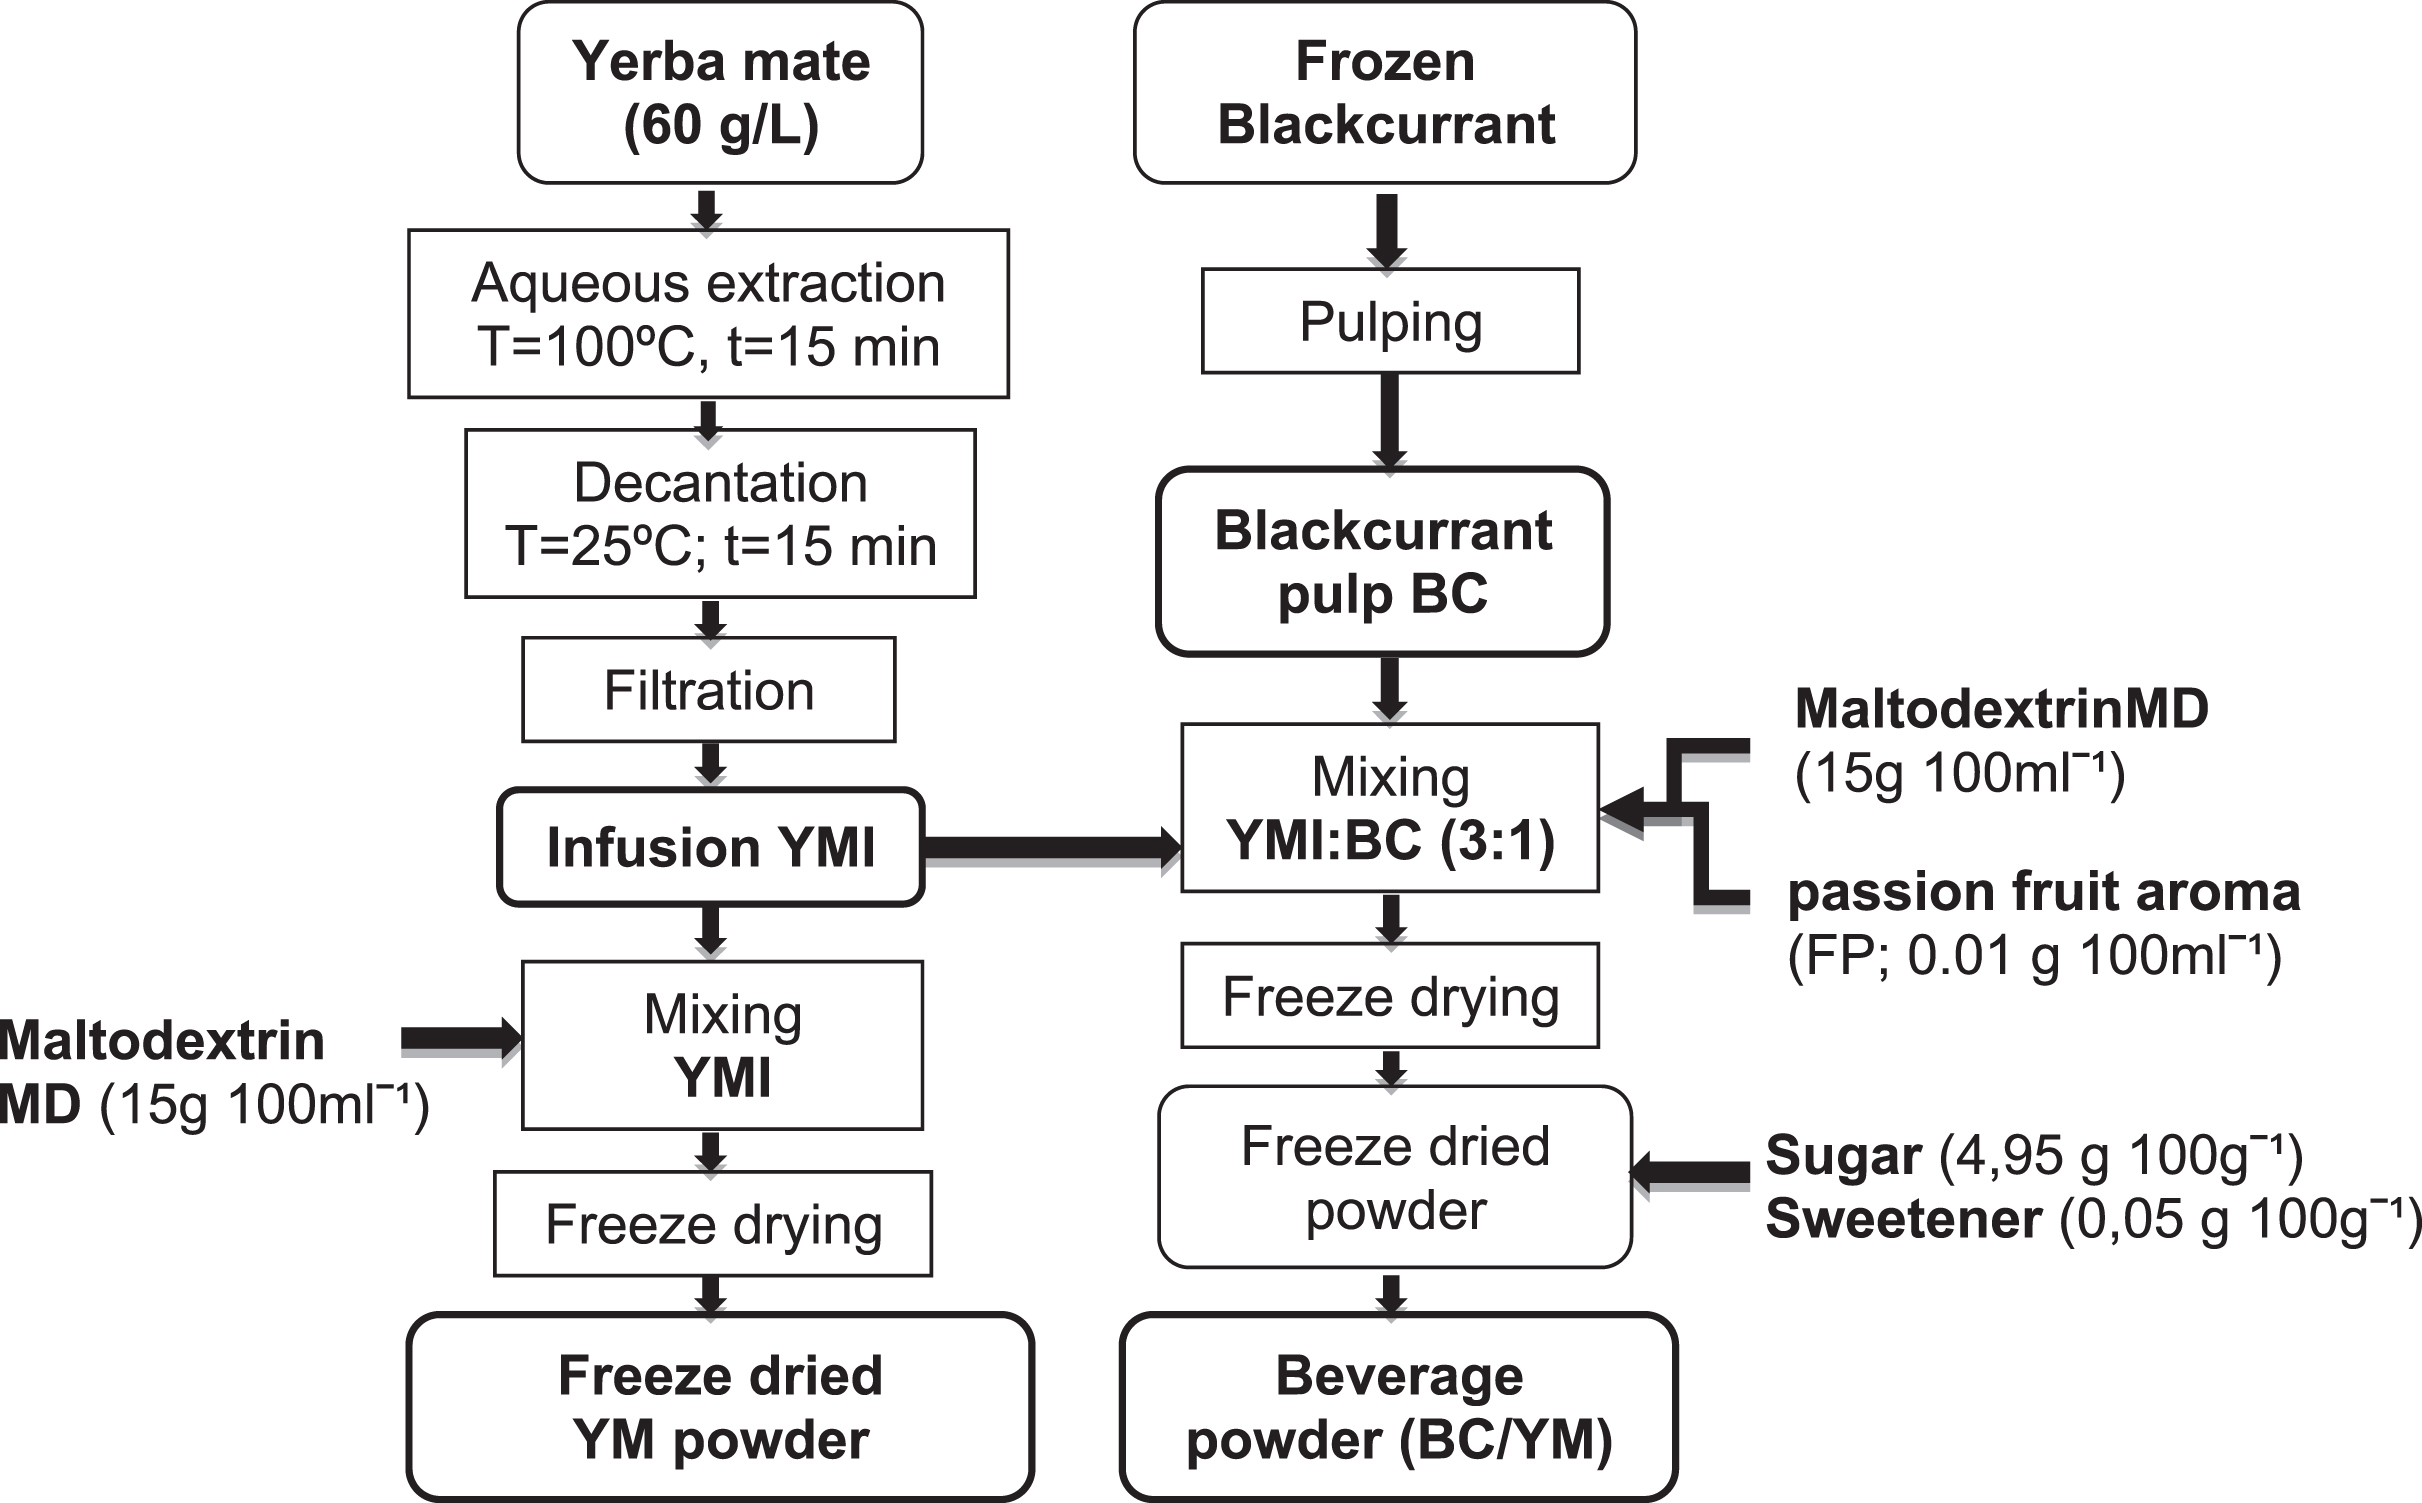
Fig.2
Temperature influence on the sorption isotherms of freeze–dried BC/YM (a) and YM (b) at 10, 20 and 40°C. The lines represent the equilibrium moisture contents predicted by the GAB model.
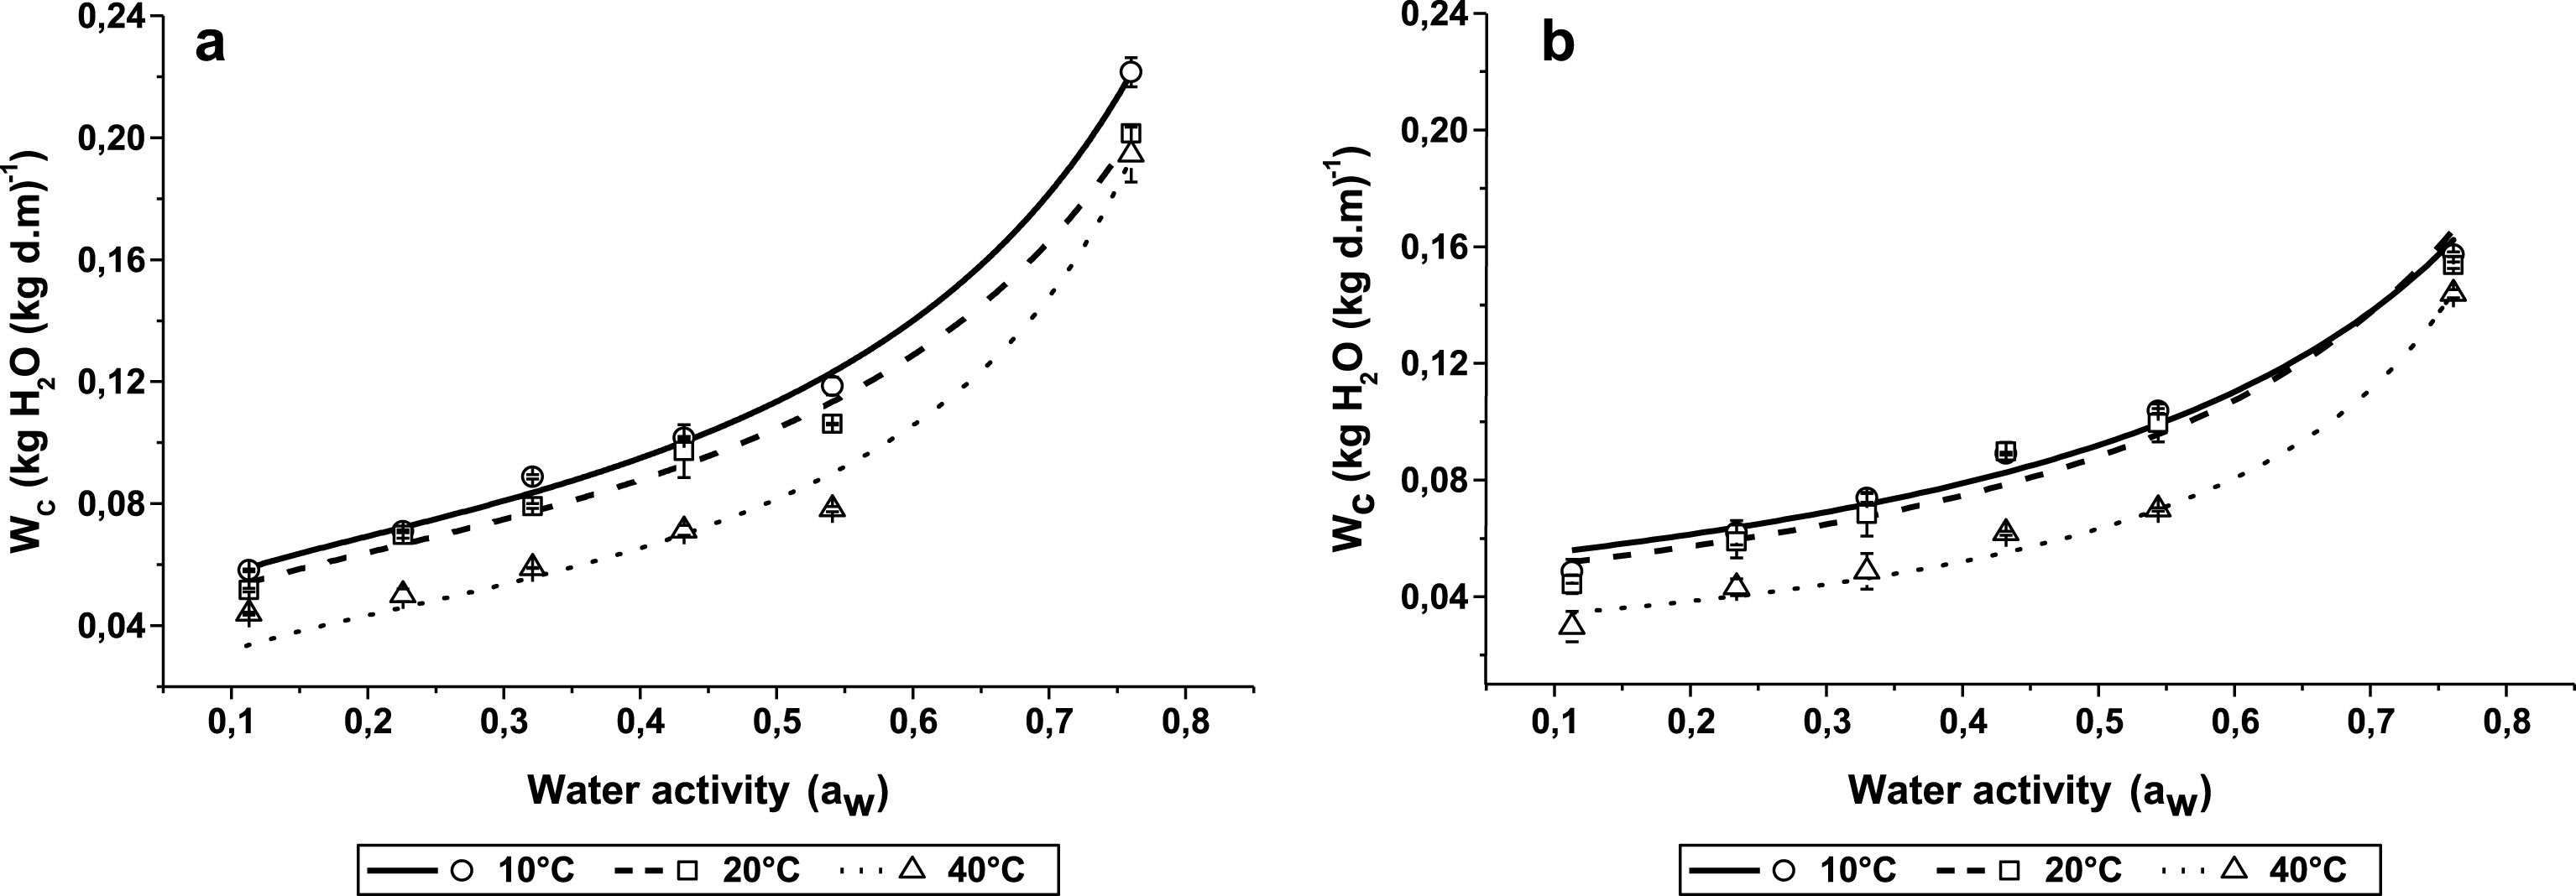
Fig.3
Changes of the BC/YM and YM sorption heat with equilibrium moisture content. The lines represent the sorption heat predicted by Equation (9).
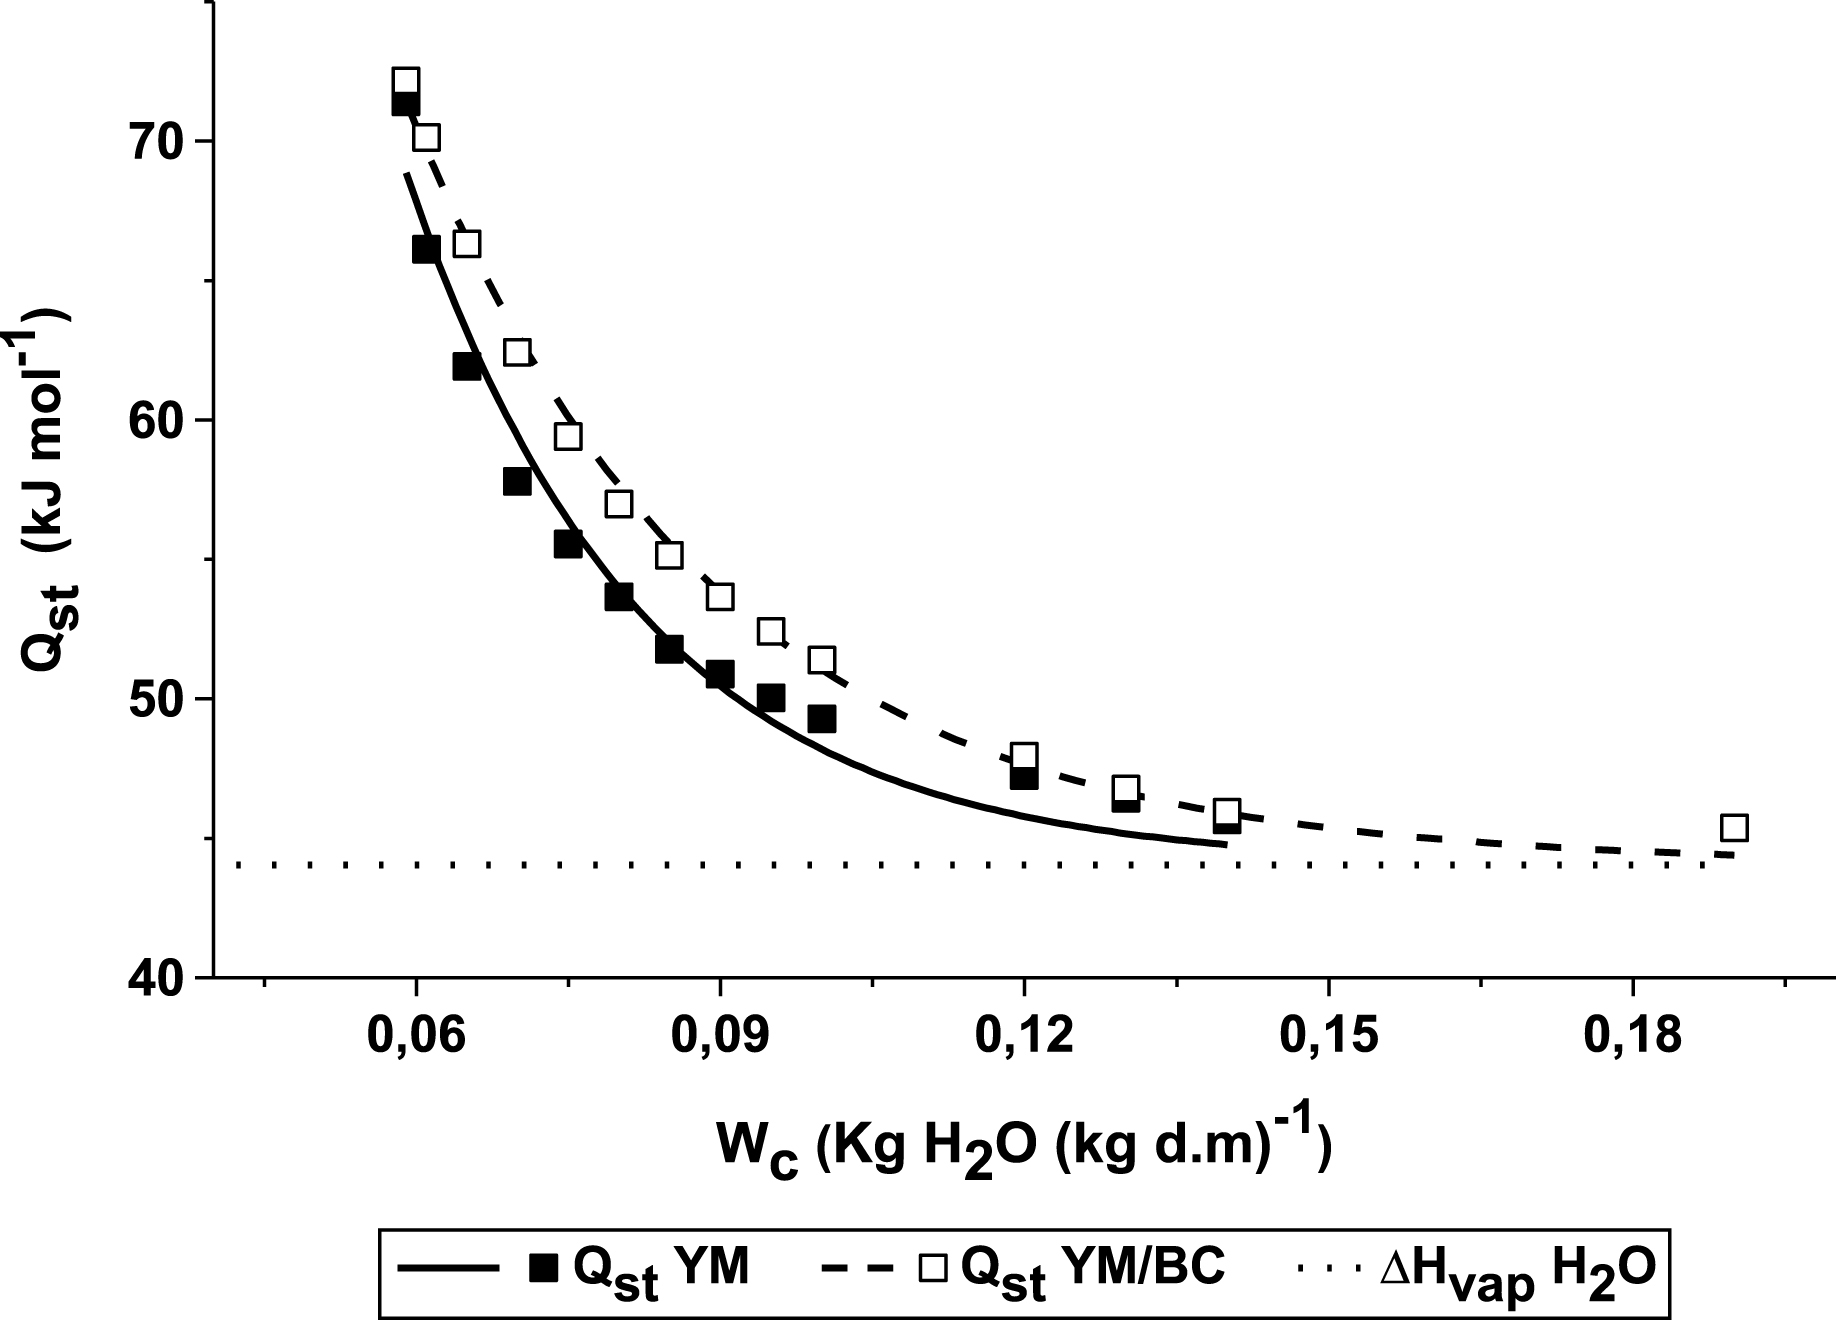
Fig.4
Equilibrium moisture content effect on the differential entropy of the BC/YM and YM freeze dried drinks. The lines represent the differential entropy values predicted by the exponential equation.
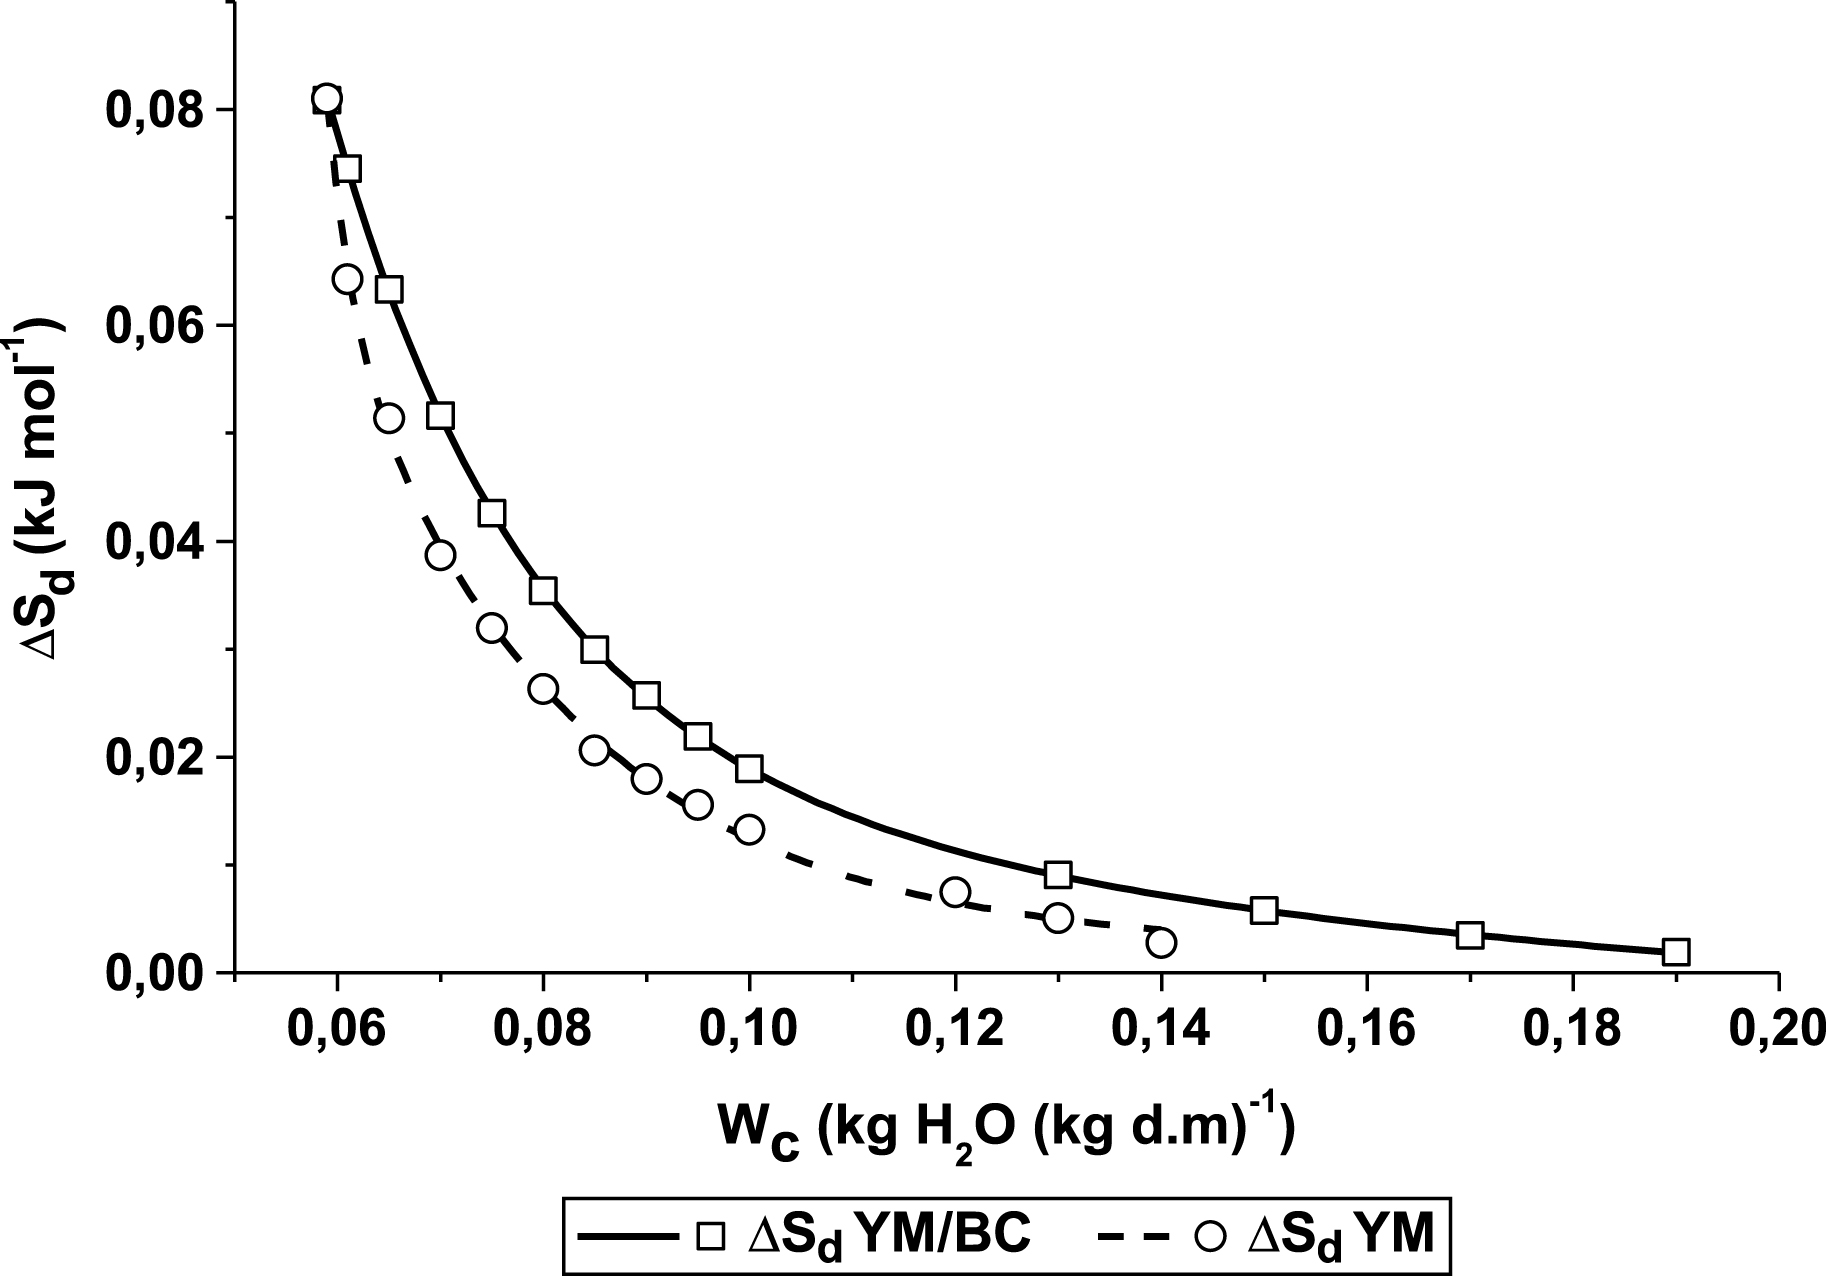
Fig.5
Enthalpy-entropy linear relationship for freeze-dried BC/YM and YM.
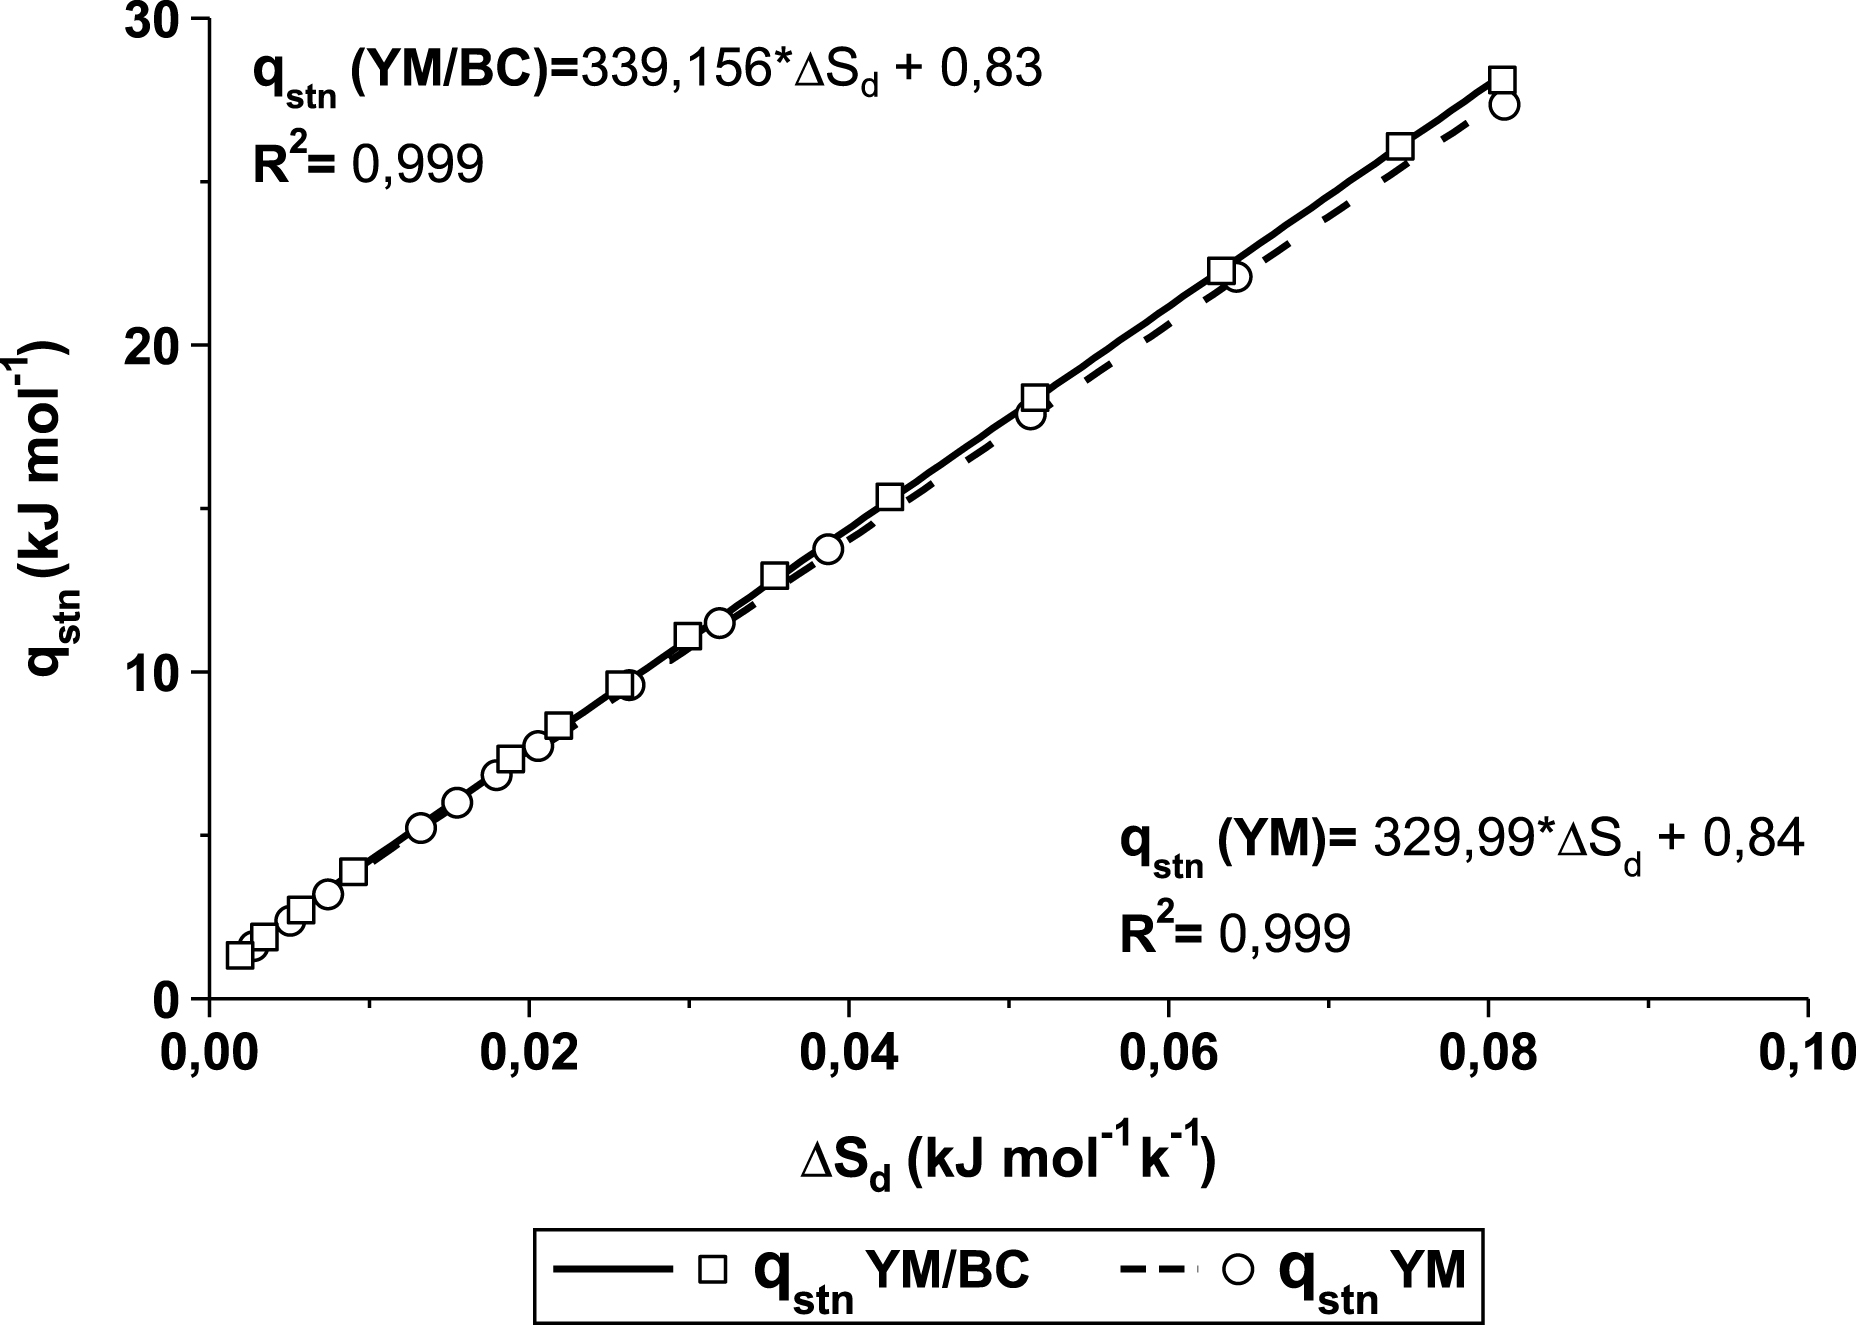
Fig.6
Monomeric anthocyanins concentration (MAC) changes with temperature and relative humidity (%).
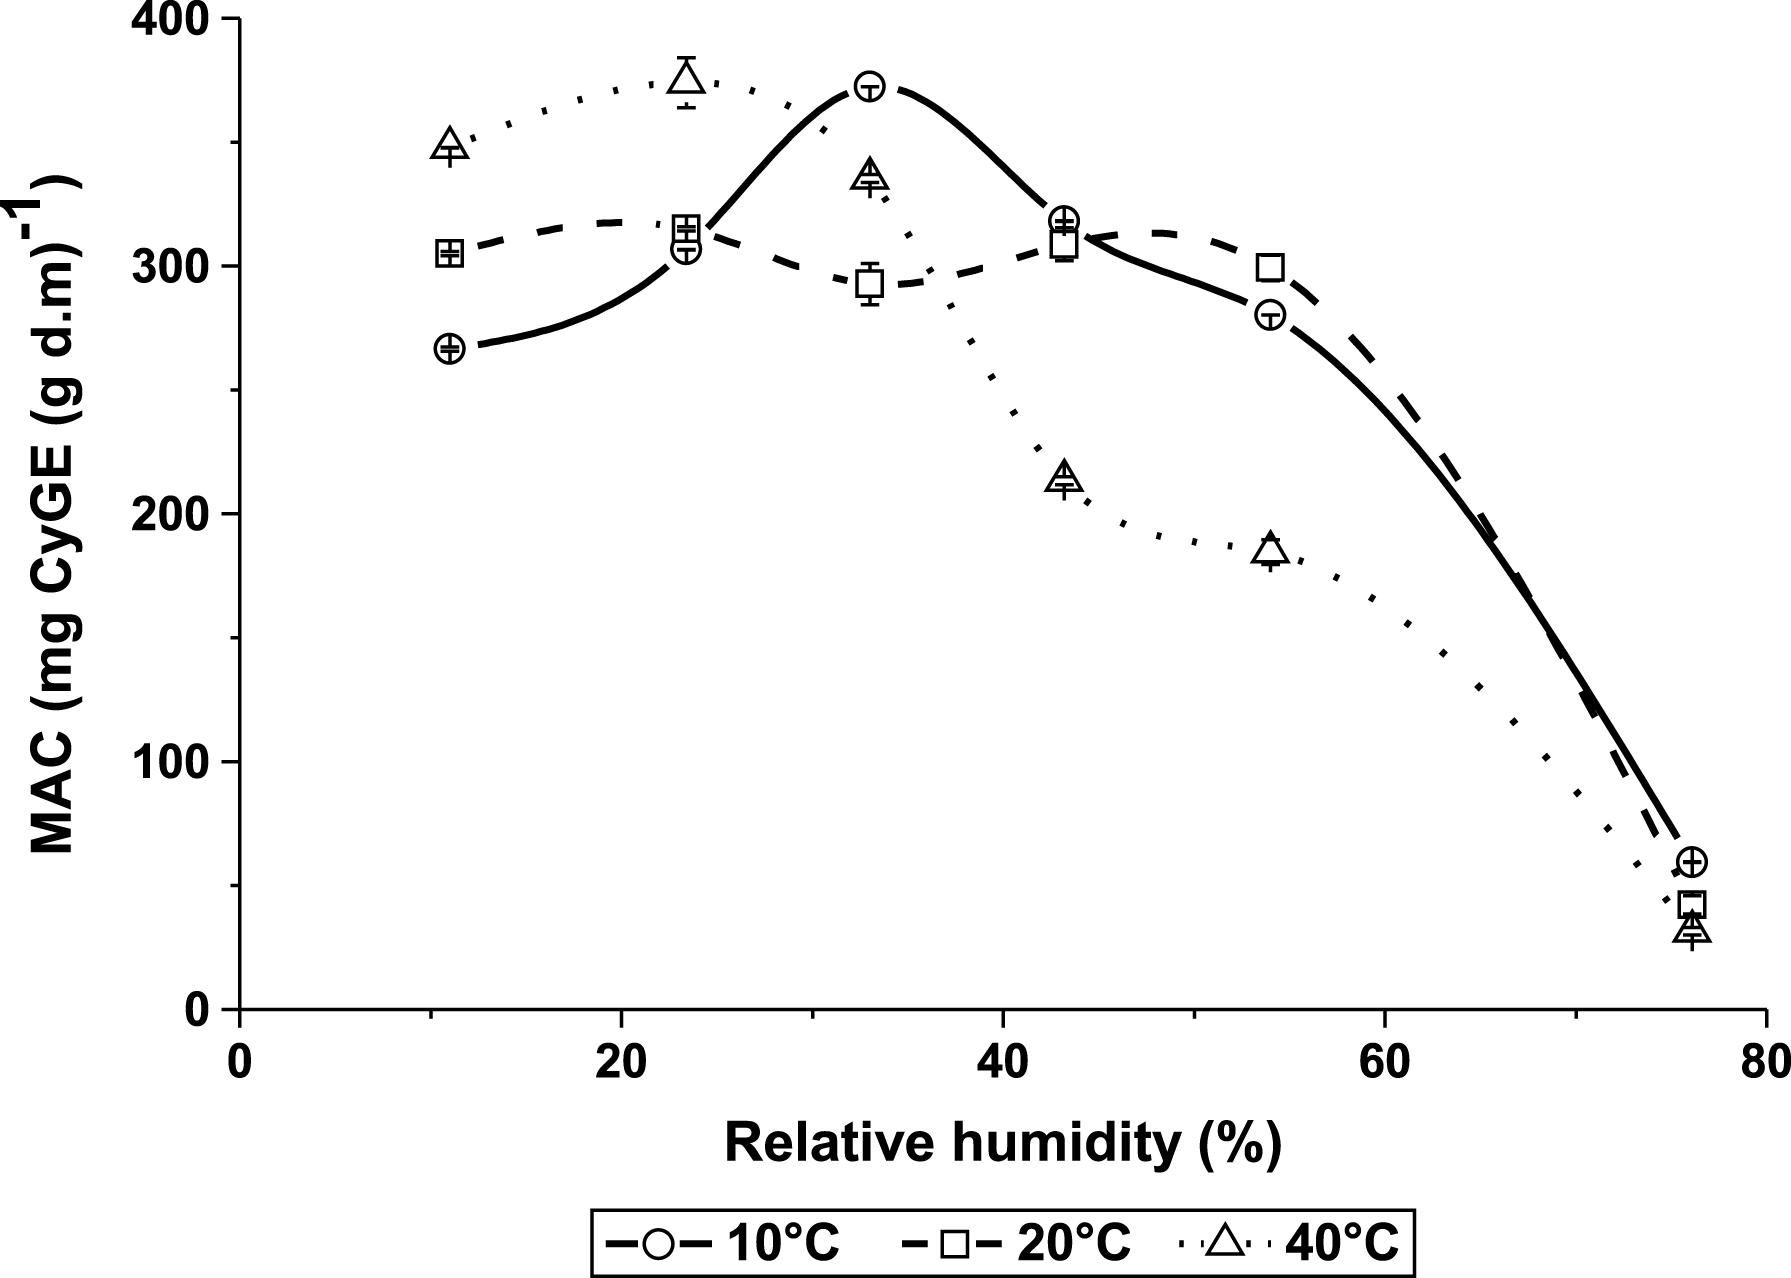
Fig.7
Ascorbic acid (AA) content changes with relative humidity (%) and temperature°C.
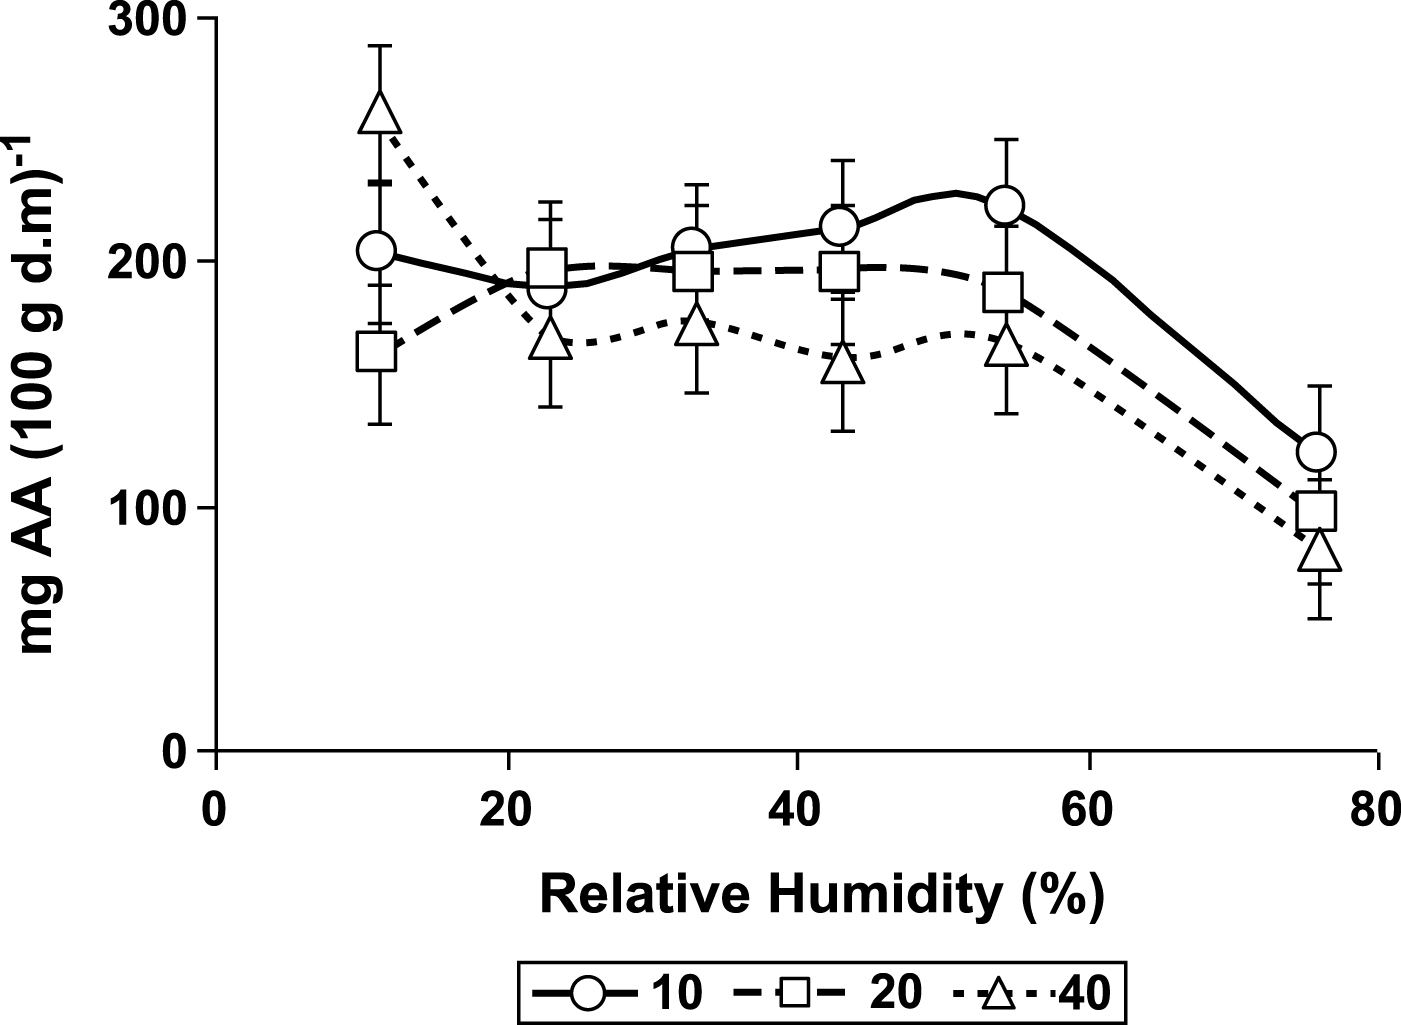
Fig.8
A, B, C. Lightness (L*; A), Saturation Index (SI; B) and Hue Angle (HA, °; C) dependence with temperature and relative humidity (%).
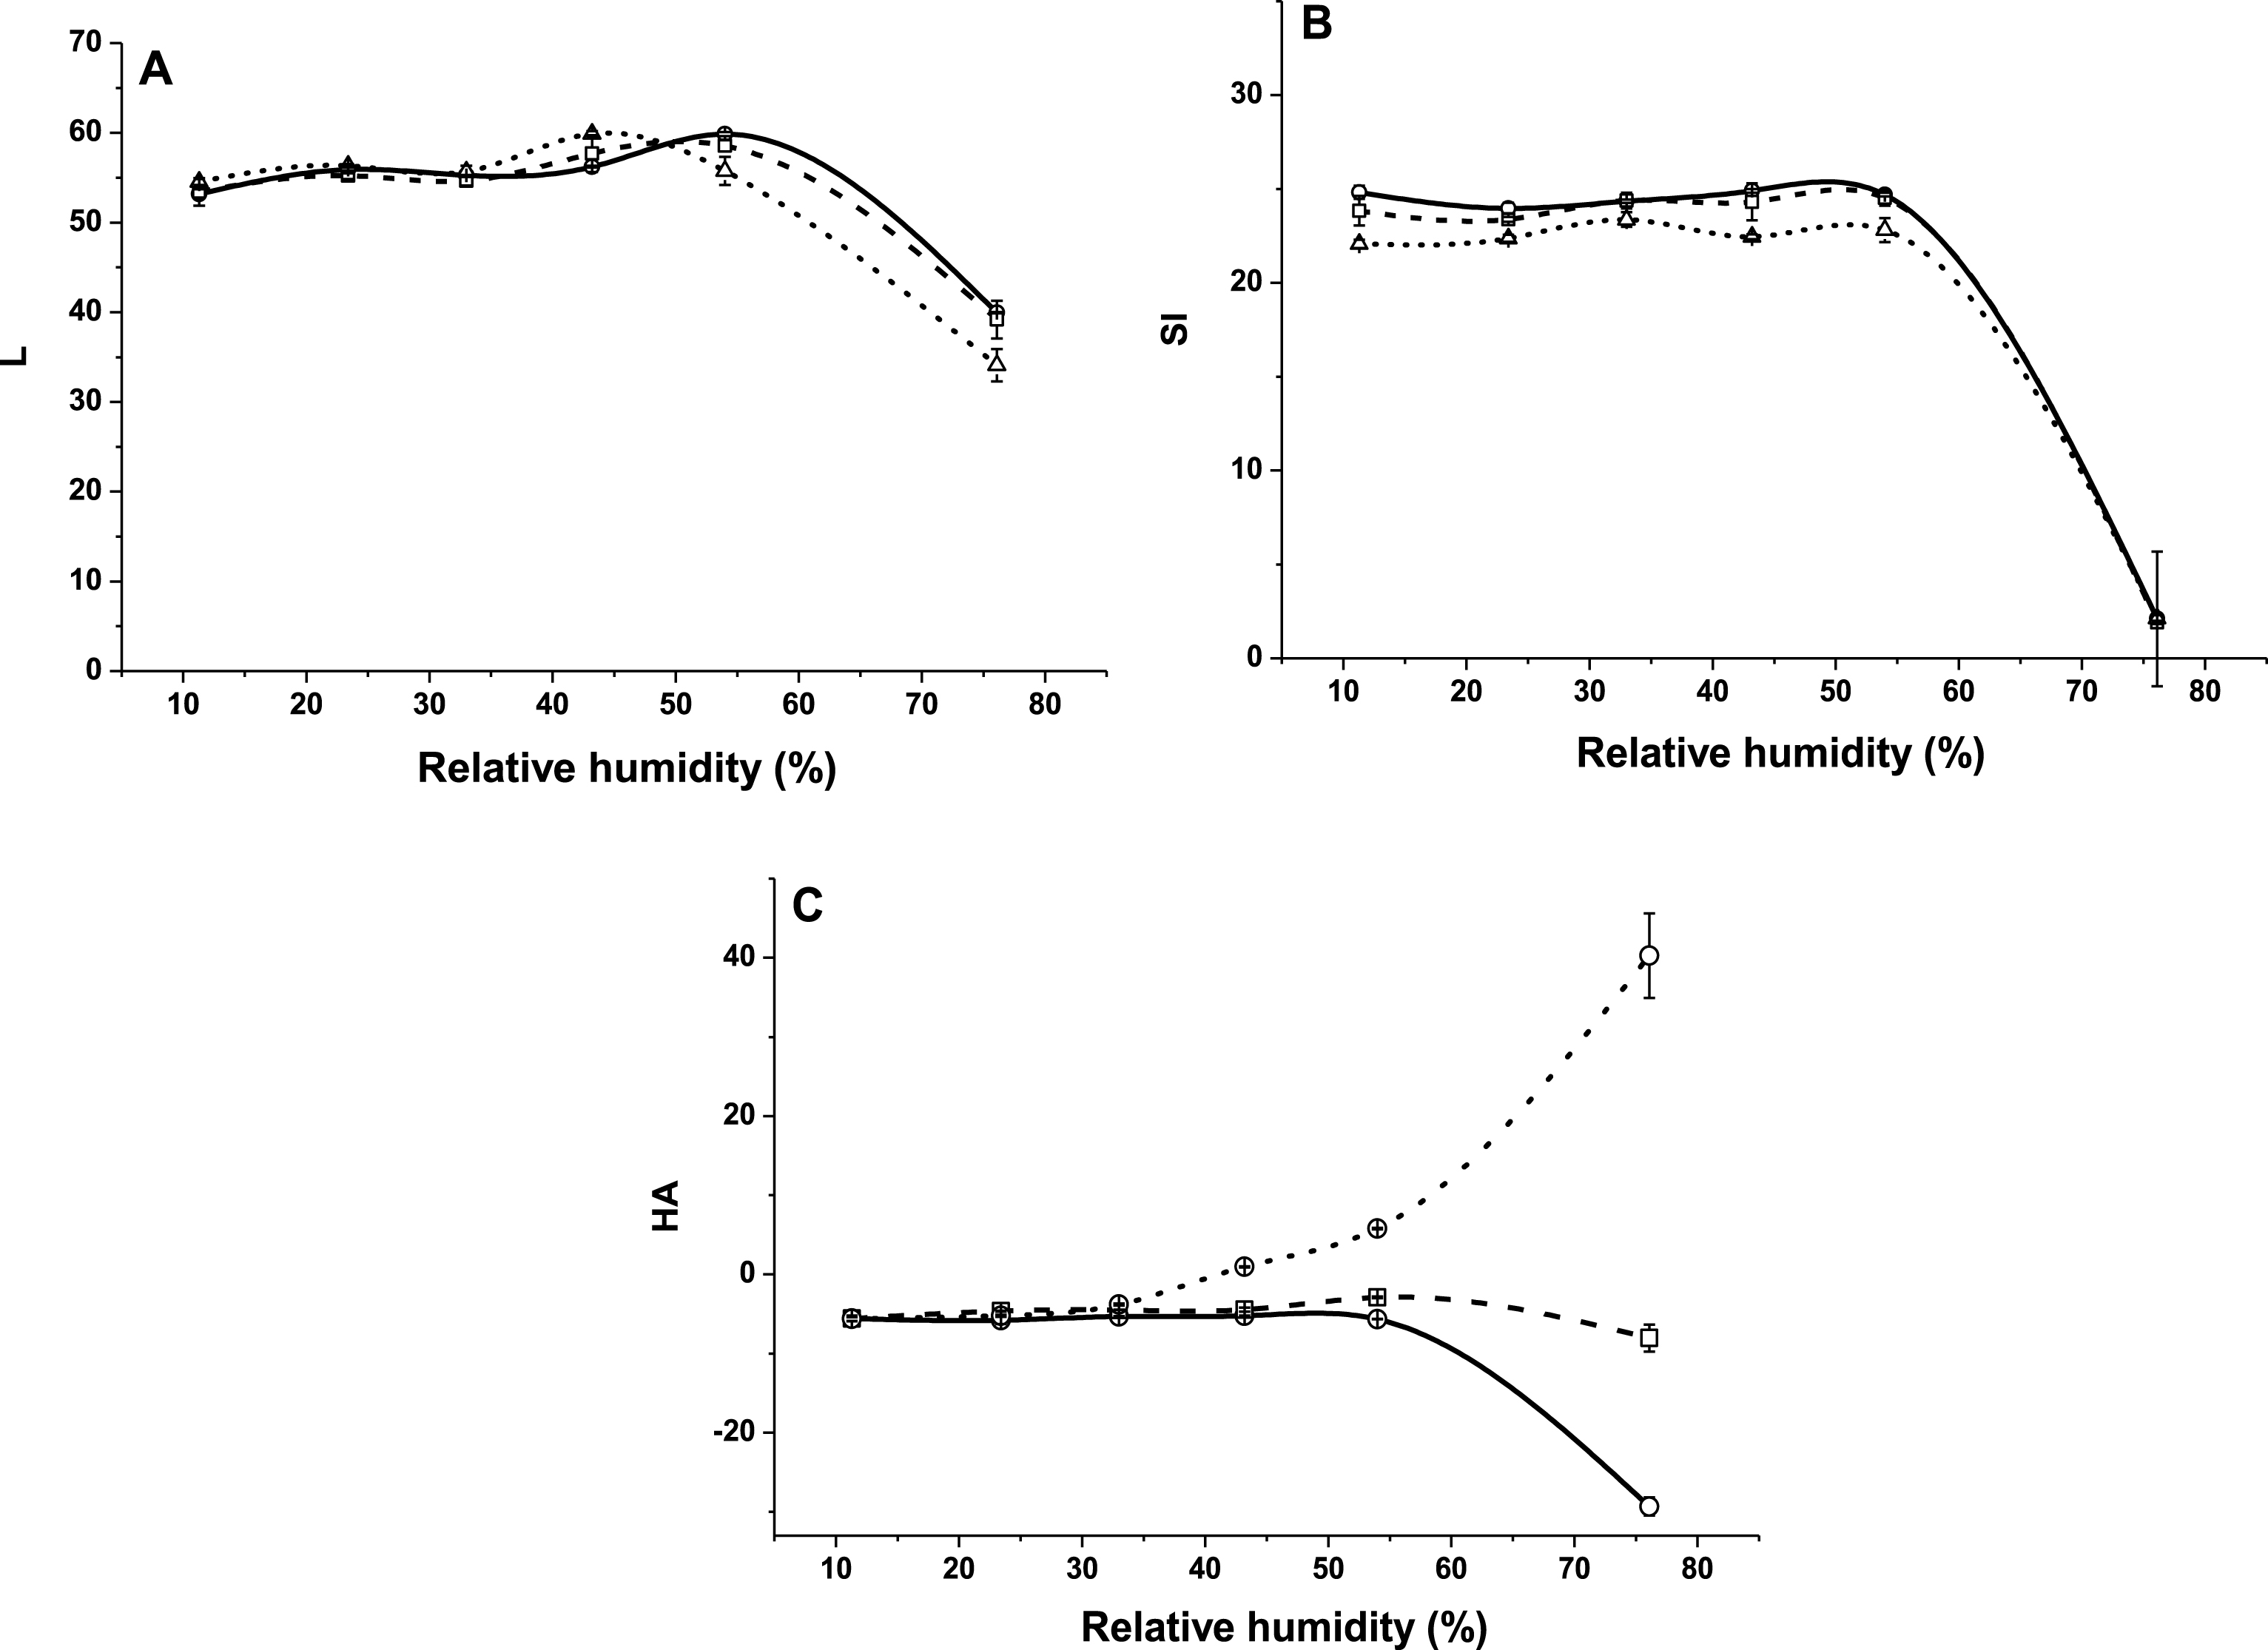
Table 1
Sorption models for predicting moisture sorption isotherms
| Model | Equation | Parameters |
| GAB |
(1) | Wm, monolayer moisture content |
| C: constant related to monolayer sorption heat. | ||
| K: constant related to multilayer sorption heat. | ||
| OSWIN |
(2) | A / B: constants |
| HALSEY |
(3) | |
| CAURIE |
(4) | V: constant |
| XS: Security water content |
Table 2
Regression parameters and statistical tests (R2; % E) of the equations used for modelling the BC/YMand YM sorption isotherms at 10°C, 20°C and 40°C
| Equations | Parameters | 10°C | 20°C | 40°C | |||
| BC/YM | YM | BC/YM | YM | BC/YM | YM | ||
| GAB | Wm | 0.063 | 0.104 | 0.056 | 0.064 | 0.041 | 0.039 |
| K | 0.946 | 0.560 | 0.95 | 0.822 | 1.04 | 0.971 | |
| C | 57.40 | 5.80 | 50.05 | 10.09 | 20 | 10.53 | |
| R2 | 0.9919 | 0.9990 | 0.996 | 0.997 | 0.994 | 0.9957 | |
| E% | 2.64 | 3.96 | 4.42 | 5.69 | 4.22 | 9.12 | |
| Oswin | A | 0.1222 | 0.0991 | 0.112 | 0.0961 | 0.089 | 0.0715 |
| B | 0.488 | 0.425 | 0.477 | 0.457 | 0.637 | 0.587 | |
| R2 | 0.969 | 0.97 | 0.956 | 0.982 | 0.927 | 0.976 | |
| E% | 8.59 | 10.79 | 9.47 | 6.04 | 17.33 | 10.89 | |
| Halsey | A | 0.029 | 0.013 | 0.024 | 0.016 | 0.04 | 0.024 |
| B | 1.48 | 1.70 | 1.50 | 1.578 | 1.16 | 1.246 | |
| R2 | 0.991 | 0.930 | 0.977 | 0.970 | 0.963 | 0.979 | |
| E% | 4.03 | 16.65 | 5.26 | 9.85 | 11.78 | 13.11 | |
| Caurie | V | 9.093 | 6.899 | 8.674 | 7.943 | 17.163 | 14.058 |
| Xs | 0.069 | 0.061 | 0.068 | 0.059 | 0.058 | 0.050 | |
| R2 | 0.977 | 0.948 | 0.961 | 0.972 | 0.937 | 0.969 | |
| E% | 6.99 | 14.82 | 7.89 | 9.04 | 15.61 | 13.53 | |
Table 3
Regression parameters of the Equations (8), (10) and (15) for freeze-dried YM and BC/YM
| Parameters | YM | BC/YM |
| q0 (kJ mol−1) | 326.97 | 195.14 |
| W0 (kg H2O (kg d·m)−1) | 0.023 | 0.03 |
| R2 | 0.973 | 0,991 |
| a | 1.31 | 0.68 |
| b | 48.80 | 36.47 |
| R2 | 0.998 | 0.996 |
| Tβ (K) | 329.99 | 339.16 |
| ΔGβ (kJ mol−1) | 0.84 | 0.83 |
| R2 | 0.999 | 0.999 |
Table 4
Effect of temperature and relative humidity (RH) on the total polypohenol content of the BC/YM powders
| RH (%) | 10°C | 20°C | 40°C |
| 11.3 | 21.78±0.91ab | 22.71±0.20ab | 21.85±3.23ab |
| 23.4 | 22.78±1.52ab | 23.50±0.10ab | 26.85±1.82ab |
| 33.0 | 24.14±5.86ab | 26.14±3.43ab | 28.21±4.95b |
| 43.2 | 26.57±4.04ab | 25.07±2.93ab | 31.00±0.20b |
| 54.4 | 20.78±0.30ab | 25.43±4.24ab | 29.07±0.71b |
| 76.0 | 17.14±0.20ab | 23.21±0.51ab | 24.43±0.20ab |
Results are expressed as mean±standard deviation of at least 2 replicates Means with different superscripts are significantly different (P < 0.05).

