
Towards robots reasoning about group behavior of museum visitors: Leader detection and group tracking
Abstract
The field of human-robot interaction (HRI) is a broad community encompassing robotics, artificial intelligence (AI), human-computer interaction (HCI), psychology and social science. HRI in social robotics explores important issues in designing a robot system that works with people in daily life environments, capable of interacting with, modeling, and learning from humans. Robotic systems should improve their capabilities to not only understand humans but also to convey their intention within their actions. The present work demonstrates this behaviour is achievable through a field study conducted at a science museum. This article introduces a computer vision algorithm which is able to detect and track a leader within a group of people – the science communicator, for this particular case – and distinguish between group members and non-group members as well, all by means of a cognitive and logical behaviour analysis of their interactions on scene. The leader’s direction is also computed as an attention reference for this approach. The computer vision system is supervising people within a group following a guide to prevent accidents and missing persons. This work represents one of a wide range of possible applications and future scenarios where group interactions are a key aspect for robots to understand and effectively participate in social environments.
1.Introduction
As one of the most active research topics in computer vision, visual analysis of human motion attempts to detect, track and recognize people, and more generally, the understanding of human behaviors from image sequences involving humans [9,23,26]. This strong interest is driven by a wide spectrum of promising applications in many areas such as content-based image storage and retrieval, video conferencing, smart surveillance [13], perceptual interfaces, virtual reality and robotics [1], just to name a few.
Tracking groups of people is an important skill for surveillance systems and robots which operate in populated environments. Research has found that up to 70% of pedestrians walk in groups [24]. People are social beings and as such they form groups, interact with each other, merge to larger groups or separate from them. Group dynamics have been widely discussed on earlier works [5,22,27]. The harvest of powerful knowledge about groups, their position, size, motion state and social behavior, can enable systems to gain a deeper understanding of human environments and provide better services to users.
What makes an assemblage of people a group is a highly complex question in general which involves difficult-to-measure social relations among subjects. A concept related to this topic is the proxemics theory introduced by Hall in [14]. It was found from a series of psychological experiments that social relations among people are reliably correlated with physical distance during interaction. Correlation allows to infer group affiliations by means of available body spacing information, an approach widely deployed in this work.
The aim of this research is to track and reason about social grouping with highly defined roles using a simplistic cognitive process, rather than learning a priori social relations. This cognitive development detects the subject holding a leader role within the group and, subsequently, assigns the rest of corresponding roles as either, group members or non-group members. The assignment is based on a behavioral analysis of the group in reference to their selected leader, motion and spacing interactions.
A museum is one of many HRI friendly environments where strong leader-group roles are relevant and quite valuable to maintain people organized and safe, such as schoolchildren walking, therapy groups and guided tours on industrial or commercial facilities.
Large groups of people require heightened attention on the part of the leader guiding them. A robotic companion, acting as an autonomous and independent being that could interact with the crowd and assist the group leader by processing their cohesion information, can alleviate the workload. Rather than relying on a smartphone or tablet platform to provide this data, an activity that could easily distract the leader and break their concentration in many possible ways.
Experiments in this work are a first attempt to prove the feasibility of the proposed approach. The intention is to later demonstrate that a robotic system endowed with computer vision capabilities can track a group of museum visitors following the lead of a science communicator. Hence, further implementation on robots of other HRI areas with a similar behavioural setup would help in their supervision tasks by adding a new technological support.
This paper is organized as follows: After a brief discussion of related work in Section 2, the methodological formulation of the project’s proposal and its early stages are described in Section 3. The main stages of the proposed formulation, that is group categorization and leader tracking, are introduced in the next two sections. Conducted experiments within the framework of our case study are defined and illustrated in Section 6. Section 7 concludes the paper and goes into details about future work.
2.Related work
The ability of robots endowing cameras to keep track of people in their surroundings is a major issue. While tracking individual people is a highly studied problem in target tracking, computer vision and robotics, the problem of tracking groups of people had been barely explored [11]. However, the number of related works has been recently increasing due to activities in the visual surveillance and social computing communities [8,25].
Arras et al. [17 ,18] have been constantly working on their recursive multi-model hypothesis theory for tracking groups of people. This approach seeks to reflect group formation process and gain efficiency in situations where maintaining the state of individual people would be intractable. The theory relies heavily on learning group models and their cohesion probabilities.
State-of-the-art in the group tracking area undoubtedly includes these works, where even an outstanding tracking performance is achieved in real-time using RGB-D data [19]. Nonetheless, research in which a group of observed people is not only detected as a whole, but accurately categorized by means of individual role assigning is non-existent to the authors’ knowledge. It opens up a novel research line featuring valuable in-depth information about the social relationships and interactions within the tracked group.
Since the 1990’s research has explored possible implementations of companion robots as robot museum guides [2,3]. Some studies have been focusing on the human-robot interaction addressing the robot’s ability to create a short-term interaction with visitors at the museum, as well as the robot’s ability to navigate in populated, dynamic and unpredictable places such as the museum environment [30]. Other studies have been looking into creating believable social robots, exploring the robots abilities to create emotional contact with museum visitors through eye contact or engaging dialogues with the robots audiences on the museum tour [12,15,16]. These studies have mainly been conducted with a focus on the technological abilities of the robot in a quest to optimize the robot’s functionalities to become the guide. However not many have questioned to pose the robot as an assistant to a human museum guide. Thus providing support and empowering the human experts in their tasks rather than acting as a replacement [21].
One of these tasks would be to prevent visitors from hiving off the group and inevitably get lost. A recurrent incident, specially for kids, which is the reason why missing persons is a major concern in crowded environments such as a museum. Moreover, a robotic assistant would also keep visitors safe and aware from restricted areas in the museum that could be a source of accidents as well. It is important to have support on this matter, above all when a science communicator deals with large groups of visitors.
3.Methodological approach
To detect a person holding the leadership position within a group of people is an easy task for a human being. For us, it just takes a few seconds after witnessing the interactions between a group, to identify the members and recognize the leader among them. Thus, we should formulate how to approach the problem to convey this natural and cognitive capacity to discern into a machine.
3.1.Analyzing behavior to select and track a leader
Beyond any distinctive piece of cloth, color or equipment, a leader is all about attitude. There are distinctive traits or inferences that could rapidly spot the person in charge. One of them is body language: leaders tend to gesticulate the most within a group, rather because they are expressing an idea or giving directions to other members. Another indicator, surely the most obvious one, is leading translations, like if this person is always ahead of the group or just being followed by most of the members, guiding their way.
These features can be reflected in computer vision algorithms by means of a high variation in position of the bounding boxes obtained with a people detector. Major gesticulation leads to variations in size (width and height) of the bounding box, whereas quick displacements become important translations in x and y directions. Both assertions represent significant changes in the bounding box position that other members of the group certainly would not display throughout the frames of a given scene.
Nevertheless, the ‘bounding box’ approach alone is scarcely effective. People detector algorithms lose stability when it comes to precision of position recall. Even if a person remains in the same place with the same pose from one frame to another, the people detector would likely retrieve a bounding box with a different position and size each time, despite being a true positive. In Section 4.1 it is described how this premise is reinforced with a motion detection strategy which results in a robust group categorization algorithm.
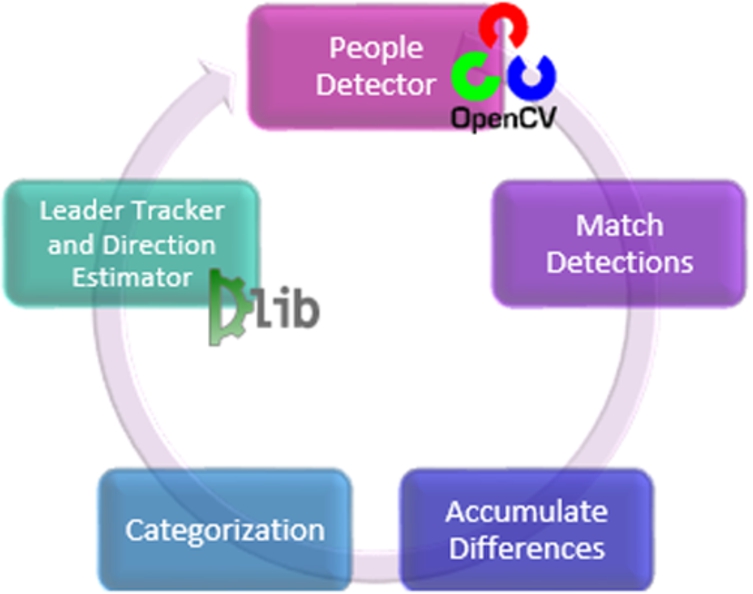
According to the features selected, which strongly relies in building an artificial cognition system based on human motion behavioral analysis, the general methodology for the group-leader tracking is now exposed. Figure 1 shows the structure behind the Group-Leader Tracker algorithm, which detects the leader within a group of observed people and, consequently, classifies subjects on the scene as either, part of the group of not.
Fig. 1.
General scheme for the Group-Leader Tracker algorithm.
3.2.Detections correspondence and filtering
The initial step is to detect all the individuals on the image scene using OpenCV’s People Detector algorithm [6] with a fine tuning of its parameters. In the interest of achieving the best possible performance for the detector, more than 30 training tests were carried out with several different parameter settings in the experimentation phase.
Unfortunately, people detection does not preserve the same appearance order throughout all the analyzed frames. Match Detection makes sure to relate a human detection in the current frame with its corresponding detection on a previous frame. In this stage, the coordinates of each detection box in the current frame are compared with the coordinates of all the detections on the previous frame. The minimum distance between coordinates is assumed to be the same detection in both frames.
Once detections are matched with people in the scene, the areas’ difference between bounding boxes
4.Motion detection and group categorization
In order to categorize people in the video stream, motion and gesture detection algorithms will be employed in a fast and accurate form. From the detected motion, tags will be assigned to the people present in the scene according to the their role into the group.
4.1.Motion detection
The major improvement in the bounding boxes basic treatment for motion detection that was mentioned in Section 3.1 has been achieved implementing a Differential Subtracting algorithm from Collins et al. [4]. The technique allows to erase the ghosting phenomenon which generates bounding boxes around elements in the image that are not humans. Moreover, combining this method with the optimization from Cèdric Verstraeten [31] using standard deviation to neglect false positives offer the prospect of better results.
Robust motion algorithms go as far as tackling outdoors environment problems with ease. The presented data was collected indoors, hence it is not necessary to compromise CPU power on this task. A simple trick to erase false positives is assuming motion only occurs in a sequence of images larger than one.
Another interesting parameter which can be used to neglect false positives is the standard deviation. Standard deviation describes the distribution of the motion. When motion is specific at a single point, like when a human is moving far away from the camera, then motion will be mainly concentrated around a single point or pixel, hence standard deviation will be near to zero. On the other hand, when a lot of motion is detected and is distributed over the entire image, then standard deviation will be very high. A huge distribution mostly indicates no real motion, e.g. indicate aggressive wind or other abrupt changes. Notice that in some scenarios, such as public places, high distributions are very usual and this assumption fails. Instead of working with a rectangle shape as bounding box, a concave hull can be defined. Again, as it is not the case for this problem, keeping things simple is preferable.
Accordingly, processing for motion detection is based on three images from the video stream, which are called previous, current and next. The first step is performed by subtracting the previous and next images (see example in Fig. 2(d)) and then the images current and next (Fig. 2(e)). Logical AND operations take place between both results and the final result is thresholded to make it accurate for larger changes only (Fig. 2(f)).
Fig. 2.
Motion detection example: (a) previous, (b) current and (c) next image frames. The absolute difference between (a) and (c) is shown in (d), whereas the absolute difference between (b) and (c) is depicted in (e). The final result (f) is obtained by performing a bitwise AND operation on (d) and (e) and thresholding its outcome.
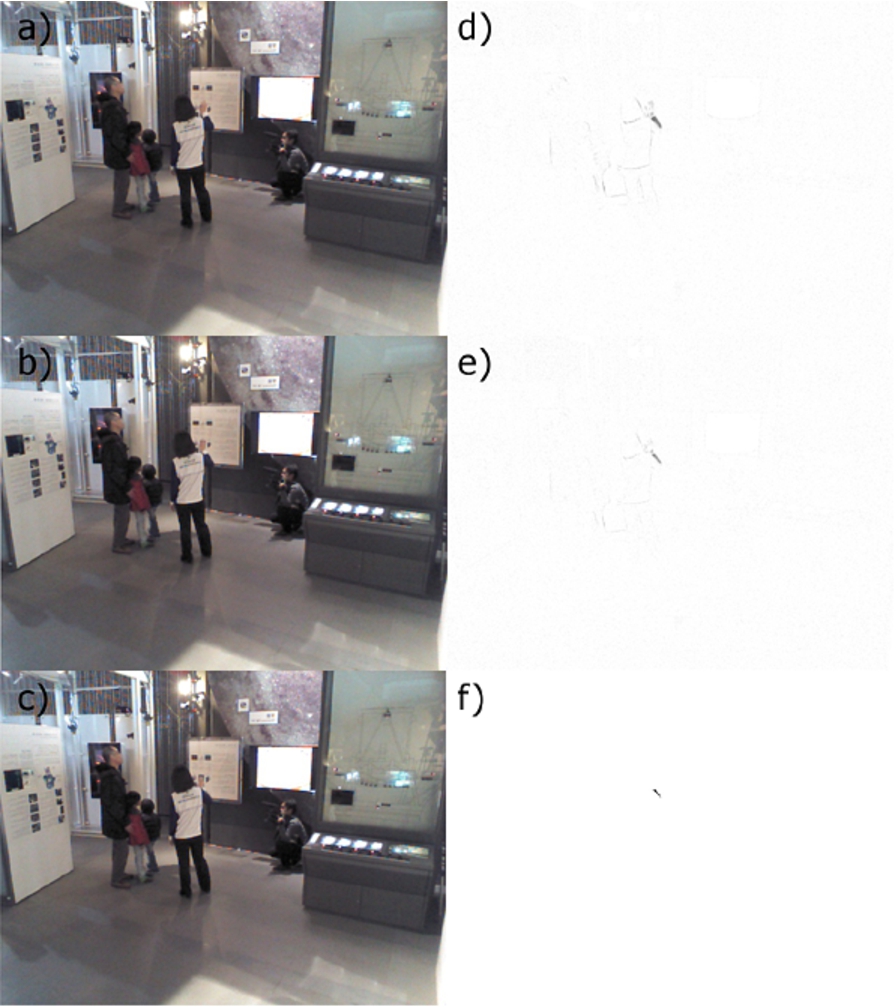
Table 1
Logic behind people detection categorization
| Tag | Type | Role | Transitory state | Stationary state |
| 1 | Permanent | Group Member | Detection box overlapping with motion box or with group members boxes | Potential group member not selected as the leader |
| 2 | Permanent | Non-Group Member | Detection box not overlapping with motion box nor group members boxes | Detection boxes not tagged as potential group members |
| 3 | Permanent | Group Leader | First people detection box to overlap with motion box | Potential group member which first overlaps with motion box |
| 4 | Transient | Potential Group Member | NA | Detection boxes significantly close to each other |
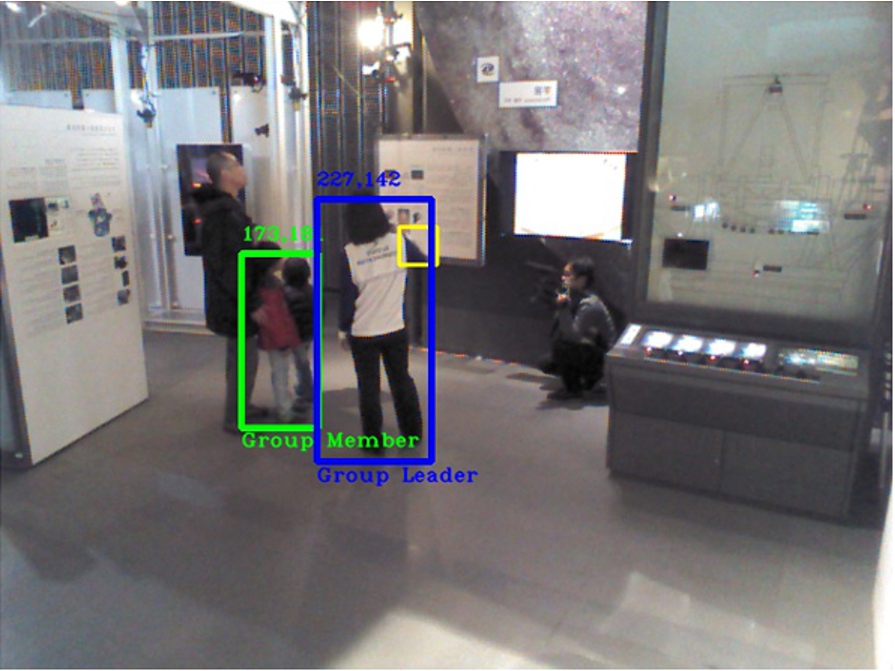
The thresholded result is placed as a window on the current image looking for motion changes, that is for pixels with values equal to 255 which will indicate motion. When motion is detected min and max values are evaluated, which are used to compute a bounding rectangle containing all changed pixels on the scene. If motion is detected, a yellow rectangle is drawn on the resulting image (Fig. 3).
Fig. 3.
A yellow bounding box is computed containing the resultant white pixels (values equal to 255) in Fig. 2(f), which represent the area with the most significant motion in the given scene: the science communicator’s gesturing hand.
Besides the method is hold very simple and fast, it obtains a high performance. Selection of the threshold value is a key point for accurate motion detection. Some algorithms even suggest to pick a dynamic or adaptive threshold. Nevertheless, this feature would delay the overall procedure and it does not completely avoid false positives, hence it is not considered.
4.2.Group categorization
Pursuing to categorize people detected on the scene as part of a group or not, a definition of “group” must be established. Group stands for a set of people having one leader and his/her current followers. It will be assumed that a leader will act as such throughout the entire video sequence while followers conforming the group remain the same in number from start to finish. In other words, no new leadership will arise among the group and no new members will be allowed to join. Despite the hard constraints in this definition, they typically apply to guided tours in museums. Hence, the required focus to monitor and track a group of museum visitors has been established with such restrictions, as they highly relate to the actual environment, the specific circumstances and the case to be studied in this work. Depending on the conditions they meet while in a Transitory or a Stationary state, people detected on the scene earn a permanent or a transient (modifiable, overwritable) tag which identifies and assigns the corresponding roles to each individual (see Table 1).
A Transitory state is initially considered when the video stream starts depicting a leader moving with the followers from one place to another (Fig. 4), whereas a Stationary state is encountered when a video stream starts with the leader already settled on the scene surrounded by the followers (Fig. 5).
Fig. 4.
Example of a video sequence undergoing a Transitory State. Top: Frame 1 of Training2 video. Bottom: Frame 100 of Training2 video.
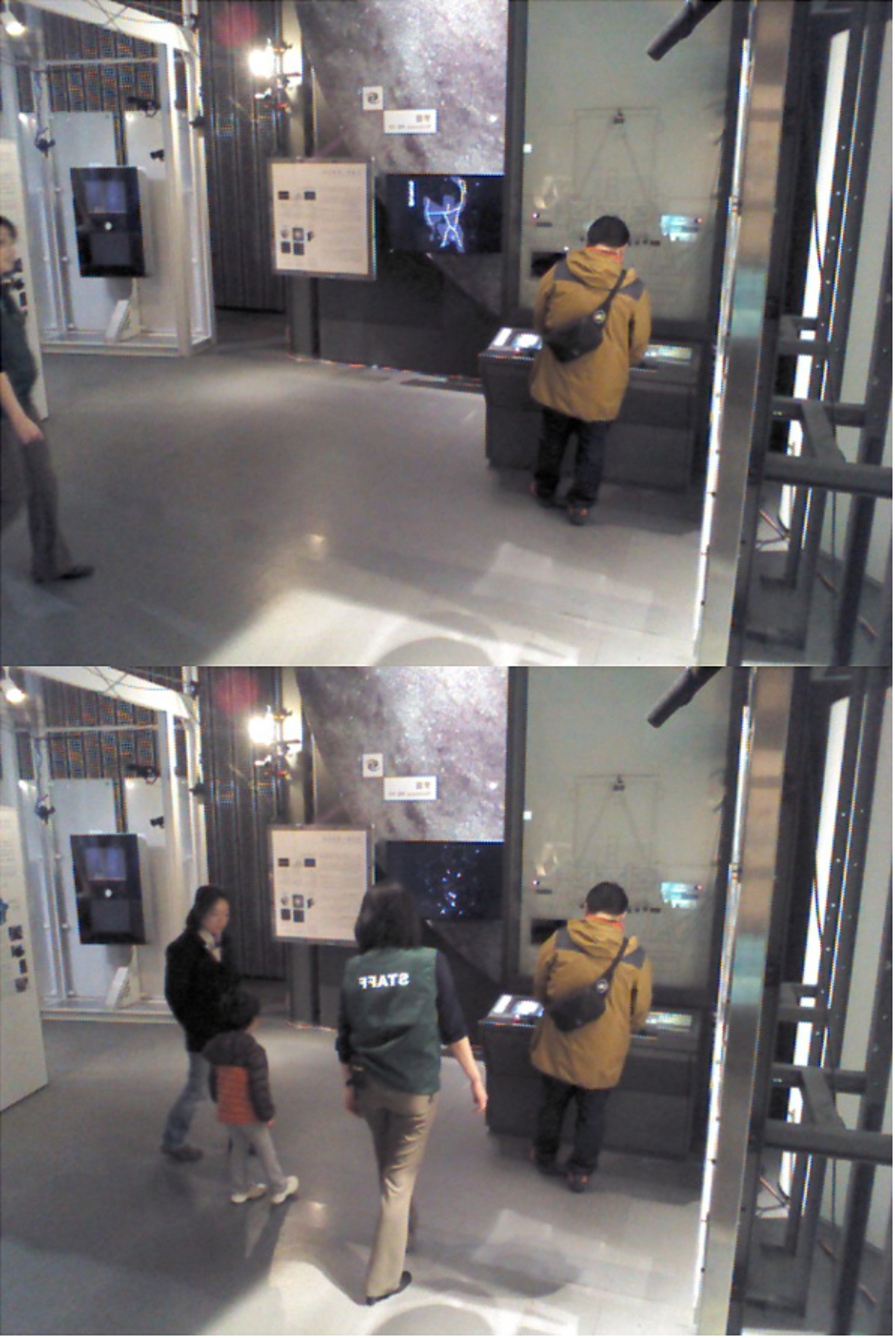
Fig. 5.
Example of a video sequence undergoing a Stationary State. Top: Frame 1 of Training4 video. Bottom: Frame 100 of Training4 video.
In this sense, a leader in a Transitory state is prone to initiate the movement on screen, as is the one guiding the group. Whereas in a Stationary state a leader tends to gesticulate more than anyone else, sometimes excessively, which is clearly justified for science communicators in a museum. This gesturing actions also start displaying a notion of movement over the scene. The logic for both assumptions and their subsequent effects are reflected in Table 1, evaluating to detail the main interactions between a motion rectangle bounding box and the people detections.
The leader is susceptible to be incorrectly detected in the Stationary state, since detecting motion from gesturing is more discrete, it takes a longer period of time to be categorized than in its Transitory counterpart. Hence, when no relevant movement is taking place on the first frames of the image sequence while quite a number of detections are occurring, images are experiencing a Soft case. In the case of being able to detect only one person on several frames of the scene, then these images are going through a Hard case.
A Soft case is easier to overcome than a Hard one, since it is just a matter of time for the leader to make a significant gesture and activate the motion detection algorithm (Fig. 6). A Hard case, in contrast, deals with the difficulty of working through the people detector’s failure due to complex view angles or occlusions with other individuals (Fig. 7).
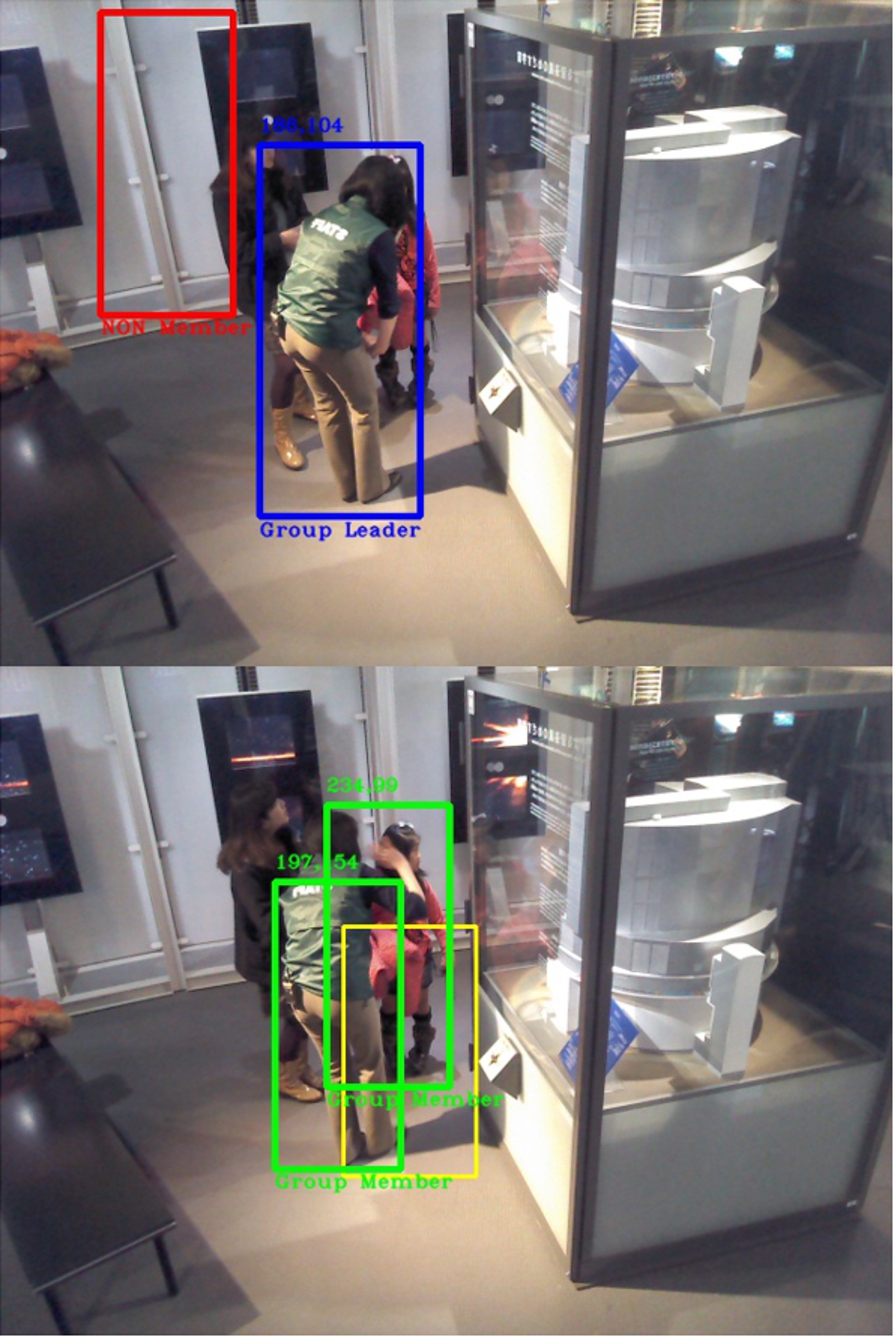
Fig. 6.
Training3 video exemplifying a Soft case. Top: Frame 1, the people detector outputs three human detections on scene. Bottom: Frame 35, the algorithm is able to rapidly categorize all the detections after the group leader has been identified.
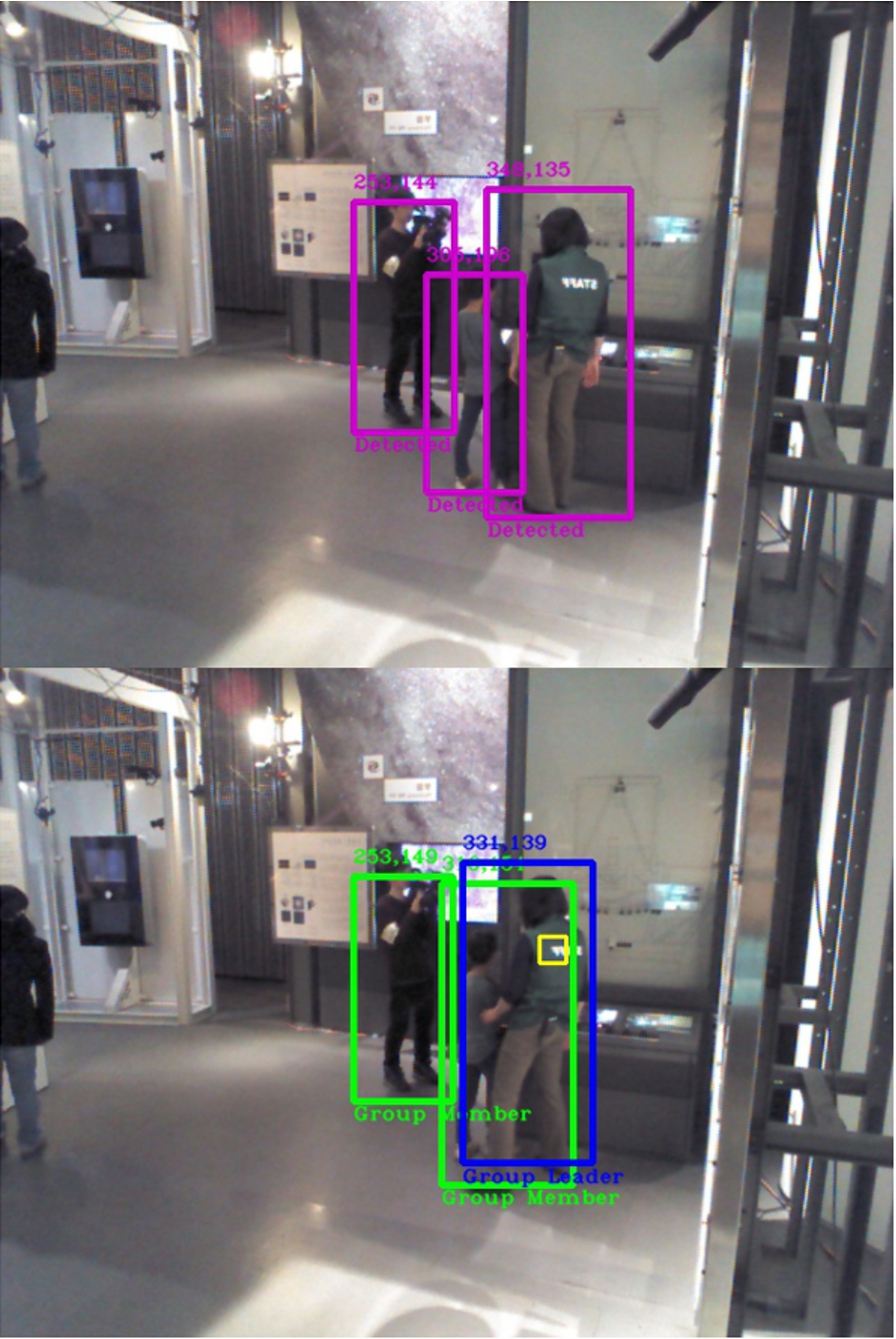
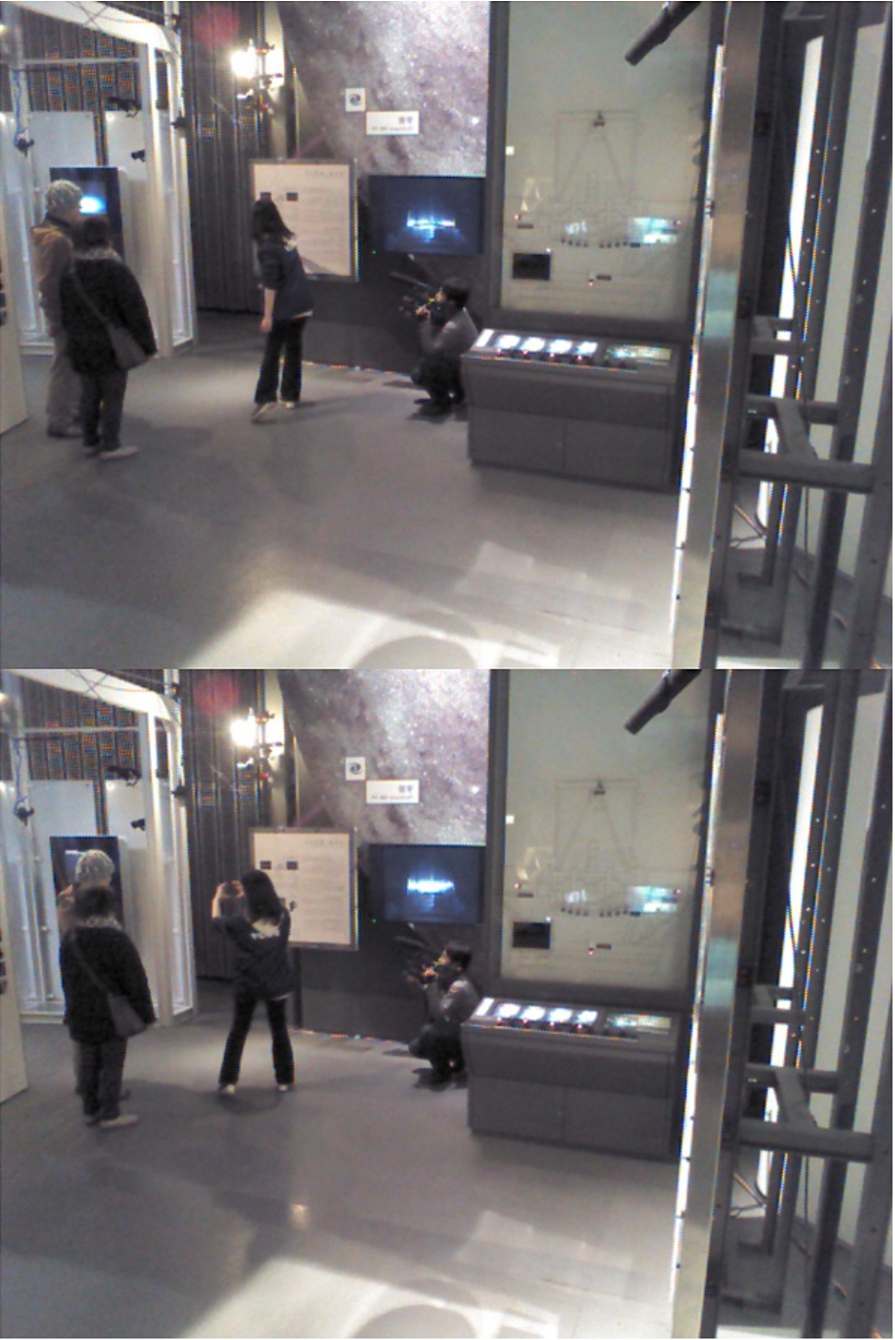
Fig. 7.
Training1 video exemplifying a Hard case. Top: Frame 1, the people detector outputs only one human detection. Middle: Frame 6, leader is categorized with no group members around despite the existence of more humans on the scene. Bottom: Frame 97, one of the group members is detected at last and is automatically categorized by the algorithm.
Group members have a tendency to get close together and maintain a certain distance from the leader figure. In consequence, there exists a high probability that the leader is the only person not occluded and the one successfully identified by the people detector in a Hard Case. However, it is not possible to rely entirely on the previous assumption and assign roles based exclusively on this.
Hence, to properly handle any ambiguous role situation, in conjunction with the Permanent-type tags, a special Transient-type tag associated to the “Potential Group Member” role has been created.
When the video stream starts and no motion is detected yet, the algorithm searches for the people detection boxes which are closer to each other and designate those detections as members of a potential group using the transient tag. Once the leader is spotted, tags become permanent and roles are automatically assigned. This cognitive development is triggered by the process of perceiving which individuals are grouping from the very beginning, monitoring their behaviour and analyzing the scene. In this form, a general solution for categorization in the Stationary state is achieved without isolating Hard and Soft cases.
Evidently, the transient tag is not affecting the Transitory state where motion detection shows up rather fast. Nevertheless, a True Member algorithm is internally serving as a last filter before assigning tags for the Transitory State. Descriptions in Table 1 refer to a set of actions which trigger role selection sequences that finally transform into role assignments. The True Member algorithm is responsible for a second level analysis on this behavioral actions to ensure – as much as possible – a definitive role assignment. True Member evaluates box overlapping with other role-assigned boxes or, failing that, how close they are to these boxes in terms of pixels distance.
Up to this point, there is a clear distinction between who is a group leader and who is a group member. What about the cameraman? Is the cameraman considered a group member or not?
Technically, the cameraman can be treated as a passive group member after he follows the group and keeps track of them from start to finish and at a – sometimes – quite short distance. Nevertheless, given the nature of this research, the choice has been made through the line of reasoning in which the cameraman is not considered a group member since he is not a museum visitor, strictly speaking.
The cameraman and any false-positives are categorized as non-members, together with detections of people wandering on their own in the scene.
A 25 frame rate sampling is applied for detection and elimination of possible false positives, thus minimizing errors for upcoming frames. False positives have their origin in the People Detector’s phase, the first stage in our overall procedure, where algorithms were maintained fast, but maybe inaccurate, for real-time process purpose. When people’s bounding boxes and their category labels have been assigned, computing time is available to evaluate if all registered detections have been active or not.
A detection activeness procedure is applied based on a set of features. The five detection attributes are the areas’ difference between bounding boxes
5.Leader tracker and direction estimator
When the categorization phase has been completed after a few frames in the video stream and roles have been assigned in Stationary State, now is time for the algorithm to continuously track the selected group leader.
5.1.Leader tracker
Dlib’s11 implementation of the winning algorithm from 2014’s Visual Object Tracking Challenge has been selected to handle this stage. Robust scale estimation is a challenging problem in visual object tracking. Most existing methods fail to handle large scale variations in complex image sequences. The proposed approach by Danelljan et al. [7] works by learning discriminative correlation filters based on a scale pyramid representation. They learn separate filters for translation and scale estimation, and demonstrate that this improves the performance compared to an exhaustive scale search. Scale estimation approach is generic as it can be incorporated into any tracking method with no inherent scale estimation. The method is shown to outperform the best existing tracker by 16.6% in median distance precision, while operating at real-time.
The centre coordinates from the leader’s bounding box, obtained from the first frame where the leader has been detected, is the only information fed to the algorithm, which is capable to predict the position of this bounding box throughout all the upcoming frames with high accuracy.
The 25 frame rate sampling in Section 4.2 is also employed in the computation of an averaged optical flow to determine the group leader’s direction. A matter thoroughly discussed in the next section of this paper, which is also a relevant part from the last stage of the algorithm and brings conclusion to the overall methodology of the project.
5.2.Leader’s direction by constrained optical flow
Two simple optical flow algorithms are currently available in OpenCV, Tao’s [29] and Lucas–Kanade methods [20] which can be combined with Shi-Tomasi [28] algorithm to select interest points, as well as two dense flow implementations from Weinzaepfel [32] and Farnebäck [10]. Although Tao’s and Weinzaepfel’s approaches are state-of-the-art procedures, Farnebäck’s is a long-established algorithm that should be tried out first. Tao’s algorithm works well with high-resolution videos – which is not the case – leaving Weinzaepfel’s as an unquestionable candidate for future upgrades.
Therefore, in order to determine and indicate in which direction the leader is facing on a given scene, OpenCV’s implementation of Farnebäck’s optical flow is chosen. The main idea is to constrain the optical flow to be calculated only in the bounding box area of the group leader by defining a ROI (Region Of Interest), rather than running the algorithm over the whole scene. Three options are proposed: (a) to compute the leader’s direction by an average of all the directions the body is manifesting; (b) to calculate the average direction of all the pixels composing the central axis of the bounding box; (c) to obtain the average direction of the body’s centroid pixel. Only averaged approaches are considered in the interest of stabilizing the flow’s behavior and the way to display it, exposing a relevant improvement not only visually but in terms of performance as well.
For the time being, option (c) has been selected, as it is a simple and straightforward strategy. It makes sense to retrieve the centroid pixel direction computed by optical flow: a person’s torso is a stable body part that inevitably describes the motion reality of the individual. In other words, a person turning the head into a certain direction does not necessarily imply she/he is planning to move in this direction, they could be explaining and looking at something next to them or someone could be momentarily catching the person’s attention from that location. While the action of moving the torso does determine the person’s direction intention, as you cannot move around your torso without conducting your whole self, and states genuine focus, since your torso is always standing in front of your primary attention. Therefore, the torso is a more reliable body feature to resolve which direction a human is facing and also, a less complicated position to retrieve when confronting the challenges of inter-individual variance.
6.Case study and experimentation
The National Institute of Informatics (NII) in Tokyo, Japan, performed an experiment at The National Museum of Emerging Science and Innovation (Miraikan), placing four Kinect v1 sensors on different spots across a few rooms. This experiment consisted in gathering color, depth and skeleton information provided by the RGB-D sensors stream from February to March 2014 within several sessions. The collected scenes mostly contained visitors interacting with science communicators from the museum.
Retrieved data was meant to be replicated offline for further analysis in 3D research lines. Unfortunately, posterior data processing was taking more time than expected as essential information was missing. Image frames from the same scene have different angles and, hence, different camera pose estimations for each case scenario. Without any calibration parameters available, camera re-sectioning and 3D-2D mapping for Color-Skeleton streams is futile. A Depth-Color mapping approach was considered, yet, the collected depth frames have two major drawbacks: there is no background subtraction and no timestamp per frame. Only hand-made workarounds could be actually performed, what it is huge amount of work for results with a virtually low precision rate.
At present, computing a 3D–2D mapping to optimize results is almost unreasonable under these conditions. However, it is genuinely interesting to exploit all the 2D possibilities this valuable information is willing to offer, as many robotic platforms and systems run with basic hardware resources due to short budgets or efficiency purposes. Which, in any case, makes high-end, fast and easy-to-use technology affordable for everyone who needs it. Consequently, it has been decided that only color data in the form of pictures and videos is currently being used. Leaving aside, for the moment, the rest of data for a 3D upgrade in the near future.
6.1.Goal of the experiment
The first objective is to use this information for leader detection: to detect and track the leader within a group of people – for this particular case, the science communicator – and determine which direction the leader is facing.
The second objective is group tracking: to identify the leader’s followers on the scene, i.e., the members composing the group guided by the science communicator. In addition to acknowledging other people are not part of the group, classifying their roles by reasoning over their group behavior and interactions.
This understanding of the scene and the individuals comprising it are key elements for an eventual robot to socially interact with the environment and actively participate on it. Role interpretation must be remarkably accurate, since the robotic system has to recognize the entire group and keep track of them to fully supervise the museum visitors, working together on this task with the science communicator.
6.2.Testbed
Five videos comprising more than 3000 frames in total were selected to train, in a supervised fashion, the proposed Group-Leader Tracker algorithm. Four of these videos share the same background as they were obtained from the same Kinect device, although, one of them was recorded prior to fixing the device into a tripod base to gain stability. Hence, color data in this video reflects some angle differences and related illumination changes.
Six videos, different from the five ones used for training, containing a total of 2405 frames were submitted for testing with respect to the ground truth. Video 1 and Video 6 share the same background, yet they have slightly different view angles, as the device apparently slid a bit between sessions. The four remaining videos share a similar fate since all were recorded on the same room, however, Video 2 and Video 3 have the same angle of view, which differs from the view angle found in Video 4 and Video 5. Contrasting these background conditions with the results on Table 2 it is safe to say there is no relation between good outcomes and a certain background, nor the other way around.
6.3.Results
Ground truth and accuracy formulations
A quantitative evaluation of the proposed methodology is imperative so as to measure its actual performance. Ground truth is an objective way to obtain the real accuracy of the algorithm. To create and annotate ground truth data becomes a time consuming process in the absence of available datasets to employ. It is a rather new problem, which implies some manual labelling and scoring when it comes to this matter.
The percentage of accuracy for each test video is depicted on Table 2. Accuracy measurement is based on the number of correct categorizations from the total number of detection boxes, this applies to all the sample frames of every video.
Table 2
Categorization – Accuracy test
| Test name | Total frames | Sampling frame rate | Sample frames | Detection boxes | Leader correct | Leader incorrect | Member correct | Member incorrect | Accuracy (%) |
| Video 1 | 910 | 10 | 91 | 139 | 3 | 33 | 47 | 56 | 36 |
| Video 2 | 450 | 10 | 45 | 100 | 41 | 0 | 57 | 2 | 98 |
| Video 3 | 200 | 10 | 20 | 35 | 0 | 13 | 17 | 5 | 46 |
| Video 4 | 500 | 10 | 50 | 65 | 50 | 0 | 15 | 0 | 100 |
| Video 5 | 230 | 10 | 23 | 48 | 20 | 0 | 27 | 1 | 98 |
| Video 6 | 115 | 5 | 23 | 20 | 3 | 6 | 11 | 0 | 70 |
The first column of Table 2 displays the name of the test video, followed by the total number of frames composing that video and the sampling rate applied. To test a video, a sample is taken every x frames, calling this value Sampling Frame Rate. For this reason, the number of Sample Frames is obtained as a result of dividing the number of Total Frames by the Sampling Frame Rate.
The Detection Boxes column states the total number of detection boxes encountered on the sample frames, whereas the next four columns determine which of those detections were correctly or incorrectly categorized by our algorithm, classifying them as leader or members detections. Accuracy is then computed with the sum of correct categorizations – Leader Correct and Member Correct – over the Detection Boxes value as the 100% goal.
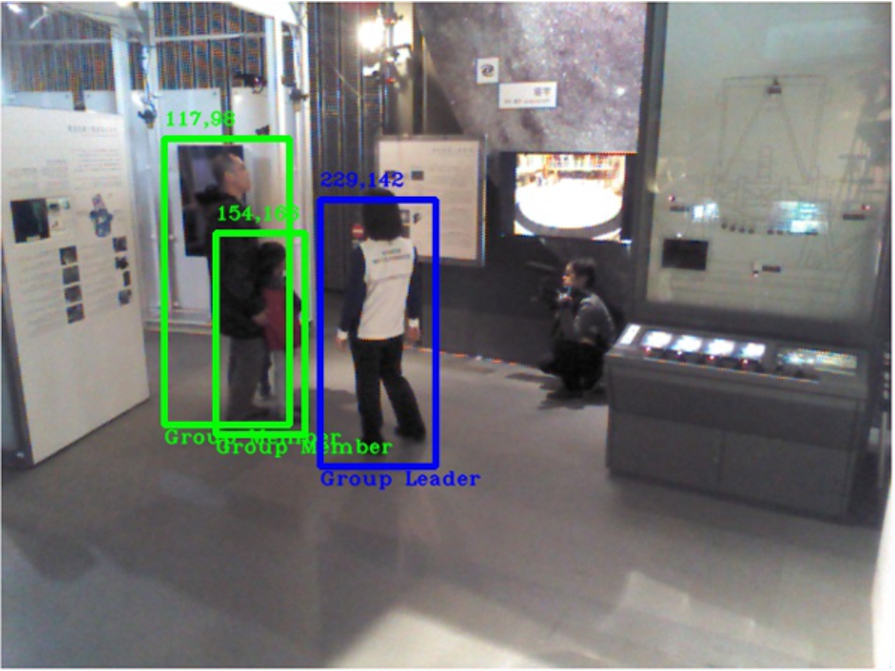
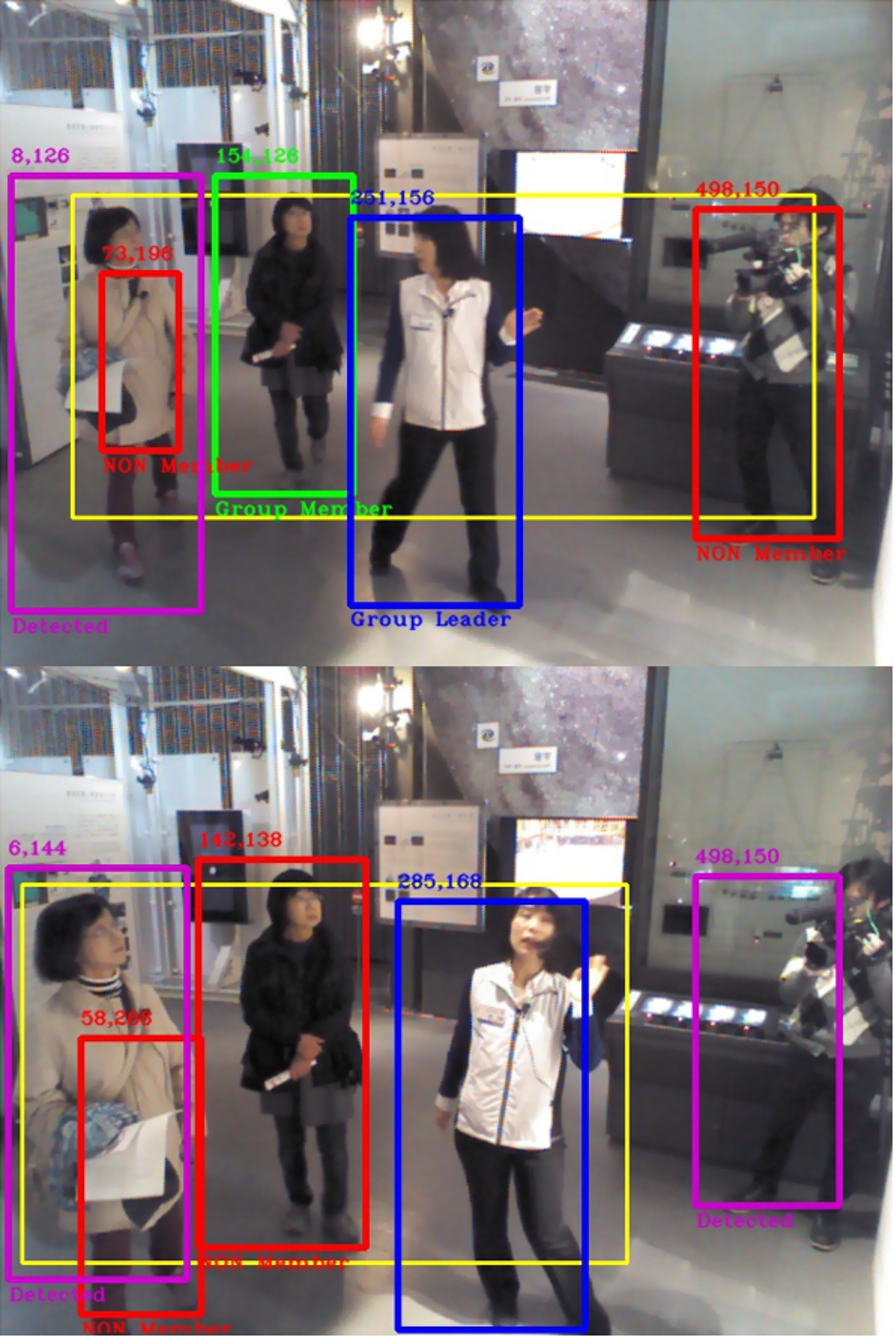
To better understand these formulations take, for instance, the next example. Figure 8 presents the annotated ground truth versus the testing result of sample frame number 38 in Video 2, where four out of five detections are categorized correctly: the group leader, two group members and the cameraman classified as non-member. If any false-positives are encountered, the algorithm should categorize them as non-members until the filter is able to eliminate them. Which means the false positive in this case has been incorrectly categorized as a group member.
Hence, the accuracy test results on sample frame number 38 of Video 2 are allocated in Table 2 as: one correct categorization for the leader (Leader Correct + 1), three correct categorizations for two of the group members and the cameraman (Member Correct + 3) and one incorrect categorization for the false positive (Member Incorrect + 1).
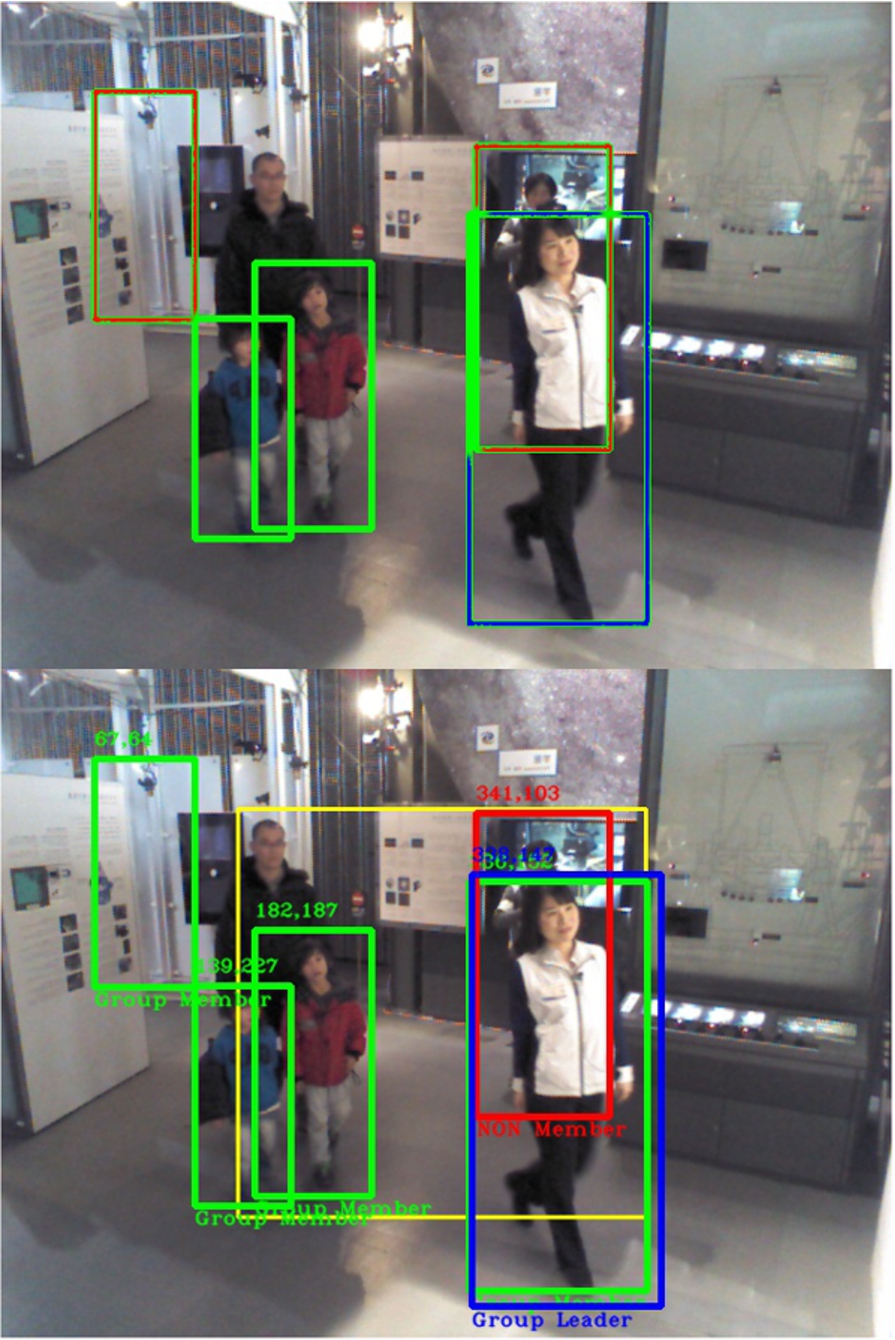
Fig. 8.
Sample frame 38 of Video 2. Top: Ground truth annotation. Bottom: Testing result. A blue box represents the Group Leader, green boxes are for Group Members and red boxes suggest Non-Group Members. A yellow box describes the motion detection area, which is rather large on this scene undergoing a Transitory state.
Accuracy of the categorization
Very promising numbers for the algorithm introduced in this work can be obtained from Table 2. The averaged accuracies from all the videos lead to a general average accuracy of 75%, while the actual average accuracy of the algorithm is about 71% when computed on the total of detection boxes rather than giving the same importance to videos of different length.
Videos 2, 4 and 5 reveal astonishing results as the one presented in Fig. 9, whereas Video 6 does not lag behind with a 70% accuracy rate. These results merit further in-depth analysis just as much as Video 1 and Video 3 demand with a rather poor performance, actively seeking feedback in order to improve. All tests intend to provide relevant information on any found issue, which is thoroughly examined in Section 6.4.
Fig. 9.
Video 2 with 98% of accuracy. Science communicator is displayed as the group leader in a blue bounding box, while museum visitors have been recognized in green-colored boxes as members of this group. Pixel coordinates on the upper-left corner of each box.
Leader’s direction performance
The constrained optical flow approach has manifested exceptional results. For example, Fig. 10 depicts a Transitory state from Video 5 where the science communicator is guiding two museum visitors through another exhibition in the room. Notice that the direction arrow in sample frame 5 (Top) is rather small compared to the arrow shown in sample frame 15 (Bottom).
Although these frames were taken from the same video sequence, both portraying the displacement of the leader and her group throughout the room, observe that the magnitude of the motion has been calculated. The length of the arrow reflects the magnitude of the averaged optical flow from that point in space, which is proportional to the magnitude of the motion on scene.
Fig. 10.
Video 5 with 98% of accuracy. Top: Sample frame 5. A blue arrow with the leader’s torso as origin estimates her direction. Bottom: Sample frame 15. Leader’s direction arrow indicates the direction of movement and also displays its proportional magnitude.
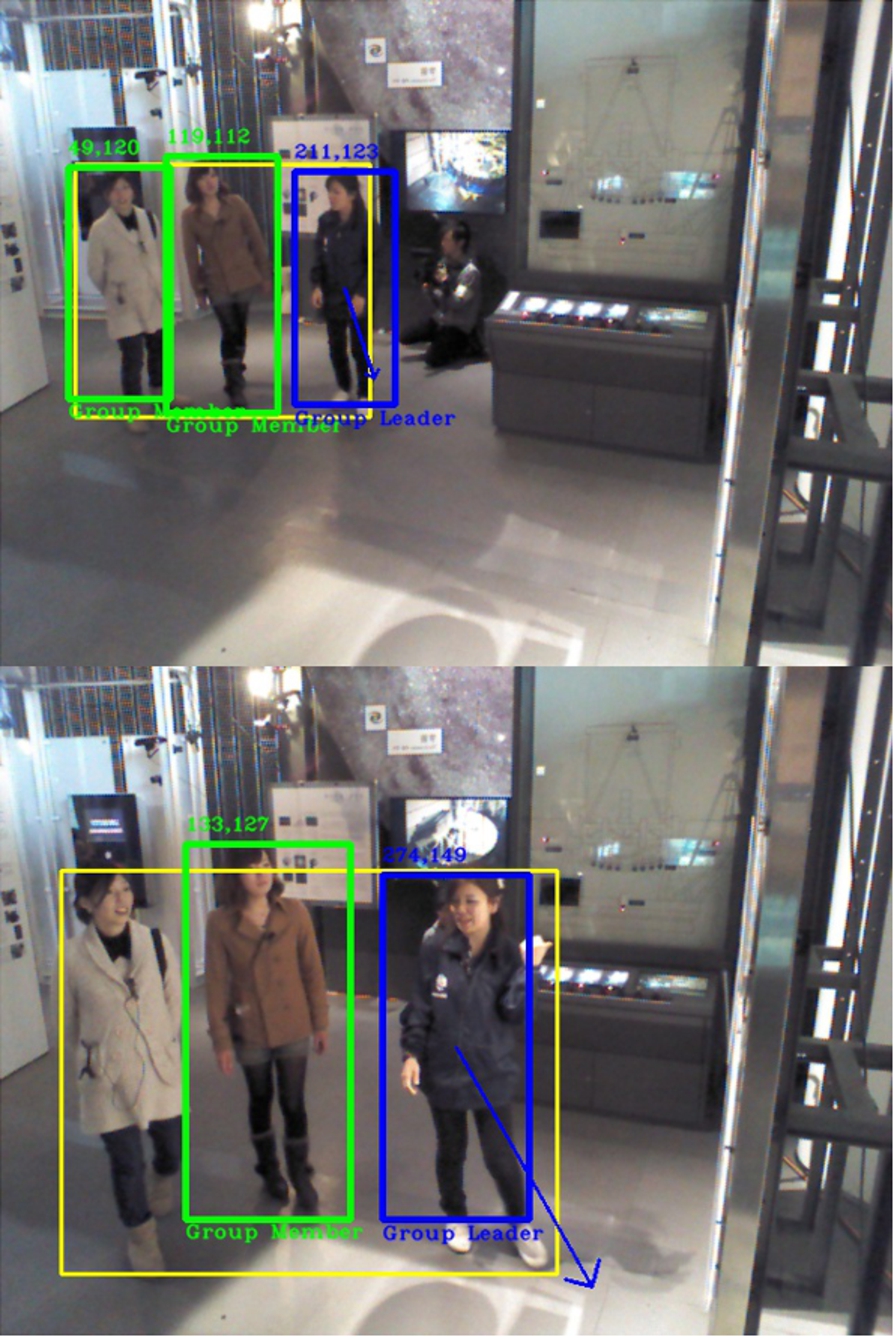
Science communicator in sample frame 5 has recently started moving towards the appointed direction, which is why the arrow’s magnitude is smaller than the one seen in sample frame 15, where the science communicator has reached her final destination. Magnitude also reveals the speed of displacement. Hence, large direction arrows are easily encountered in Transitory state videos, whereas short arrows are common in Stationary state since science communicators do not move from their position while explaining an exhibit (see Fig. 11).
Leader’s direction information can alert a robotic assistant of large or quick displacements from the science communicator. After all, museum visitors under these circumstances are more likely to split from the group accidentally, if they get distracted. A missing persons situation could be prevented monitoring this particular attention reference.
6.4.Found issues
Distance from the camera
A certain distance from the camera is necessary for the people detector to work properly. Occlusion between individuals and their closeness to the camera view makes it difficult for the algorithm to detect all the group members on the scene, which is a recurrent issue (see Fig. 11). In fact, it can quickly escalate into a major one if the people detector is partially detecting members of the group despite these circumstances, as it did in Video 1.
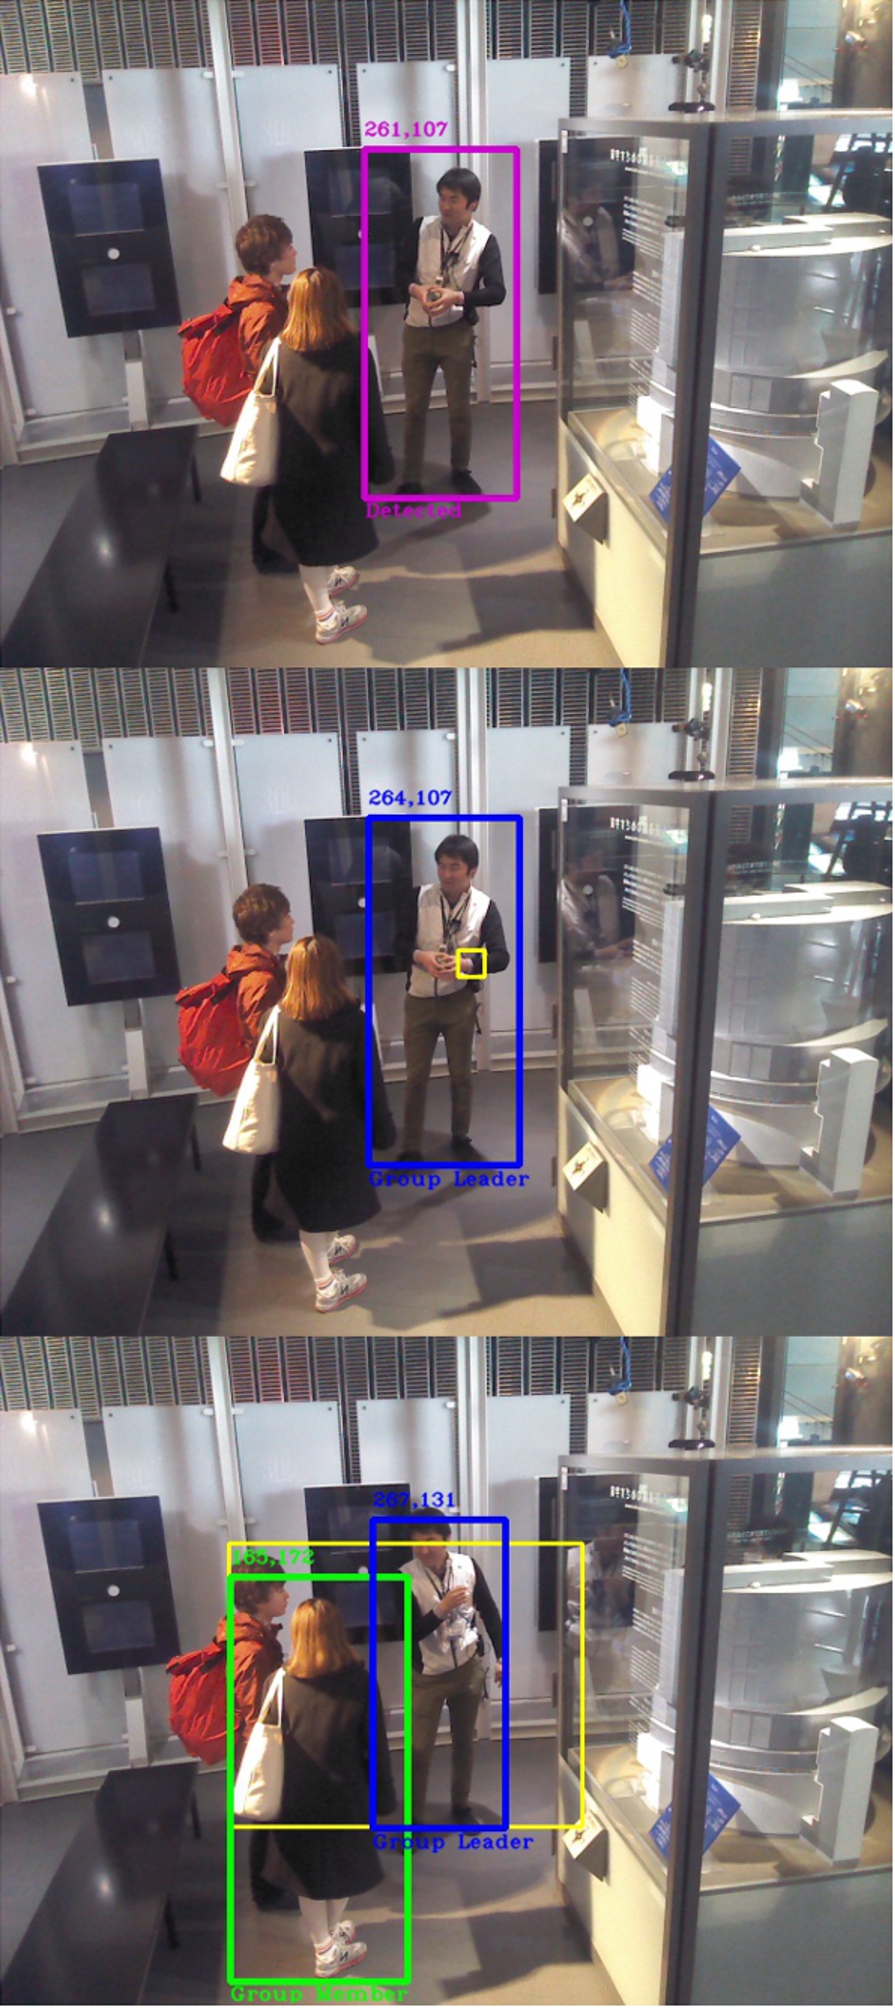
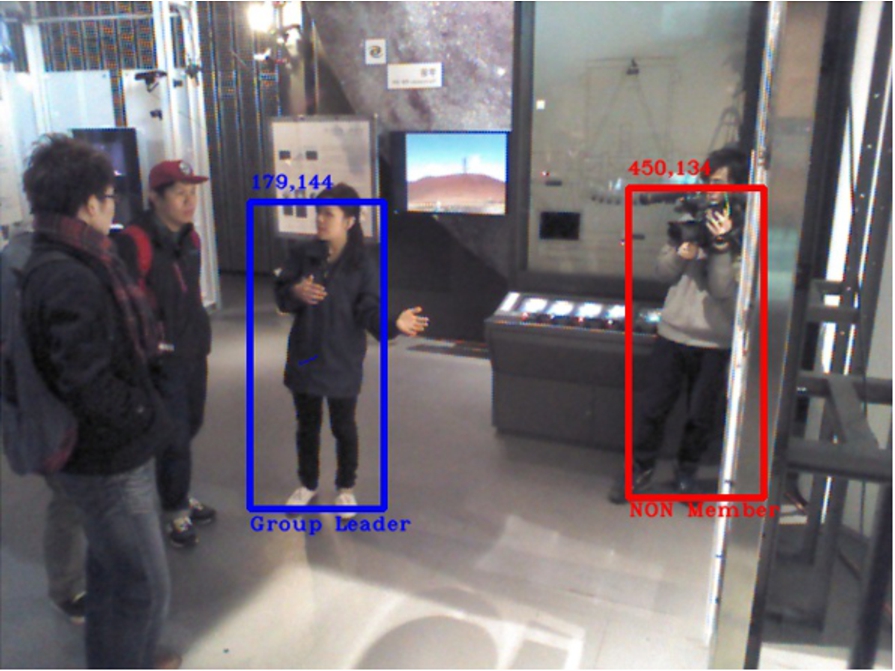
Fig. 11.
Video 4 with 100% of accuracy. A Stationary state scenario where it is hard to detect the museum visitors being assisted by the science communicator. Even so, the cameraman is successfully classified as a non-group member in a red color box.
Failures related to the people detector
Video 1 holds the lowest performance from the tests, owning a 36% of accuracy. The cause behind it is that the first frame where the leader bounding box would collide with the motion box, is the exact same moment where the people detector does not detect the leader.
When the motion box finally makes an appearance as a result from the science communicator’s gesturing, the people detector has made only one detection on scene. Unfortunately, this detection does not correspond to the science communicator but to a museum visitor instead. The algorithm immediately performs the role assignment since the visitor’s over-sized detection box overlaps with the motion rectangle (see Fig. 12). The outcome of this Hard case scenario is a wrong leader selection, an error which propagates through the entire video sequence.
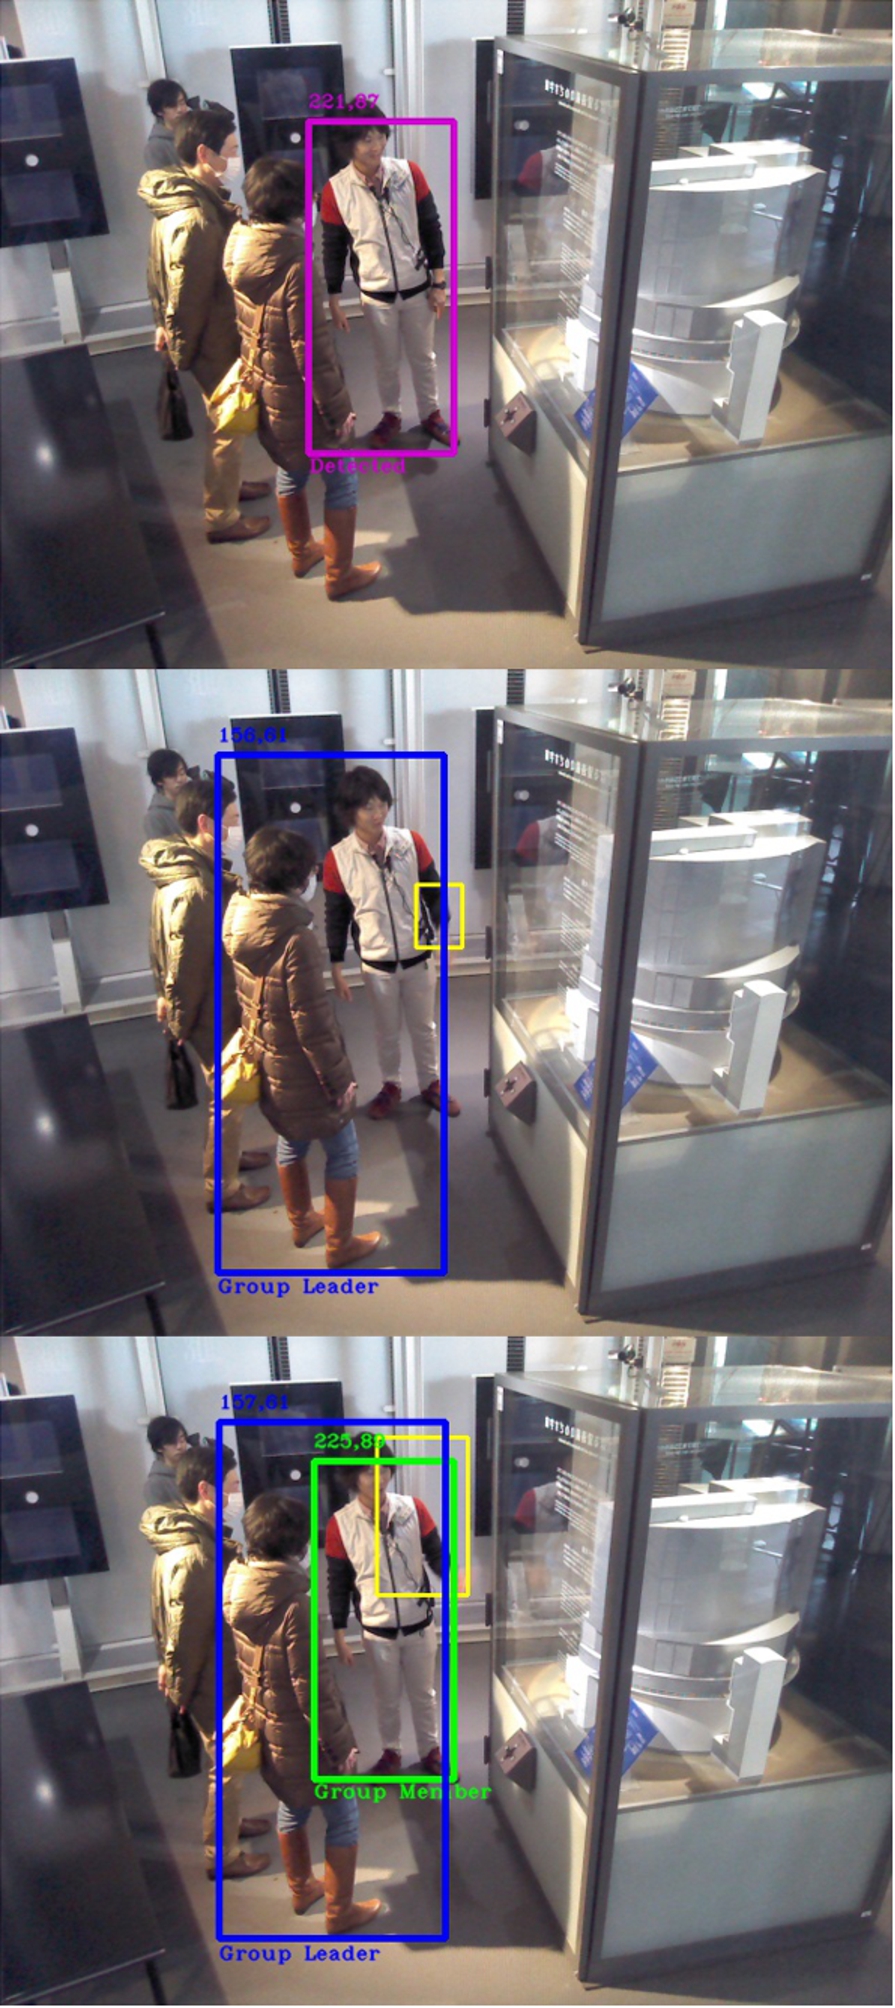
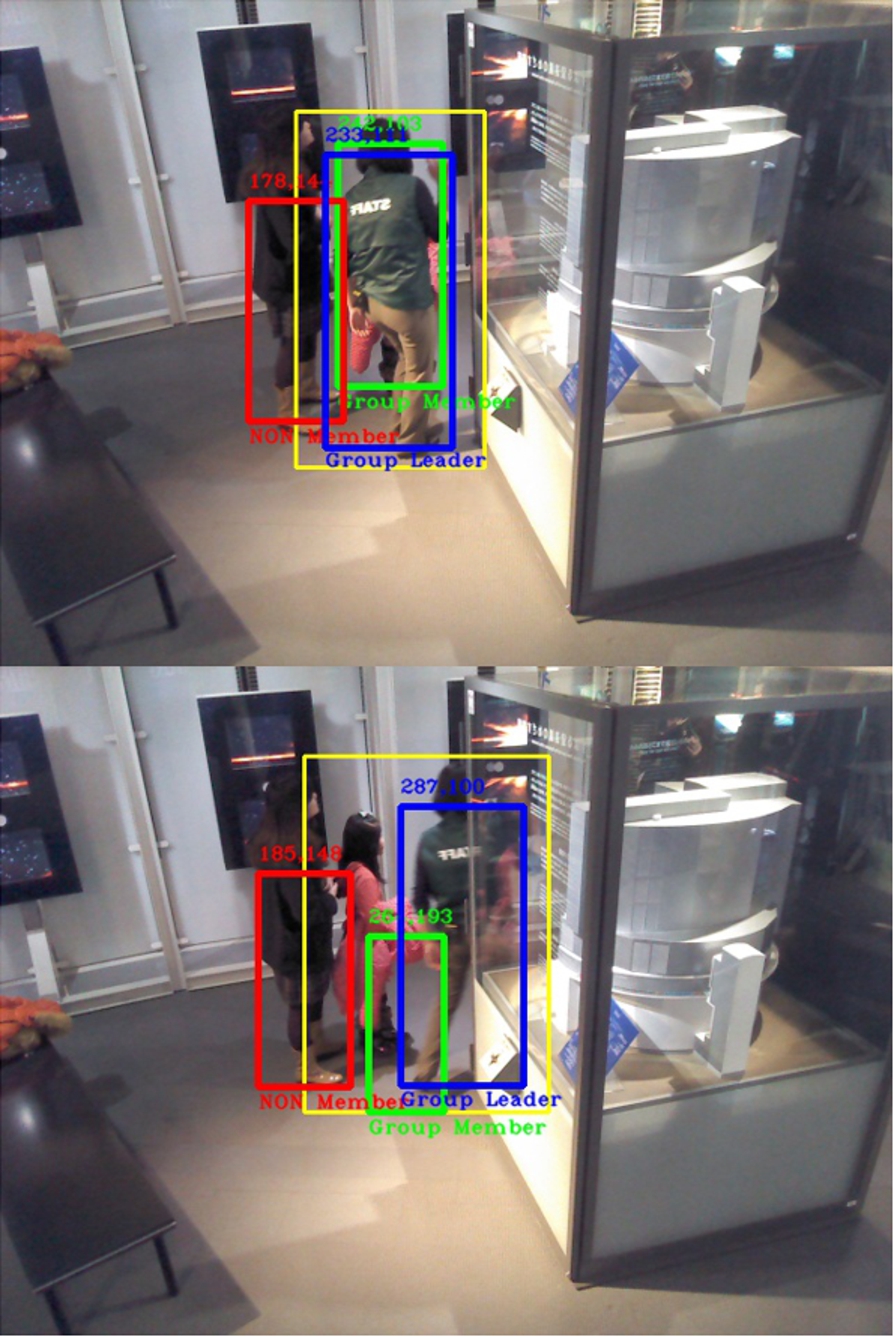
Fig. 12.
Video 1 with 36% of accuracy. Top: Frame 1, science communicator has been detected, no role assigned yet. Middle: Frame 4, science communicator gestures and motion box overlaps with the only detection obtained, selecting a museum visitor as the group leader. Bottom: Frame 6, science communicator is detected after the leader role has been given, appointing him as a group member.
The effect of false-positives
Although false-positives are considered as non-group members within the algorithm’s logic and a periodic filtering function has been set to eliminate them, there is still a considerable amount of object-triggered false-positives drawn by the people detector.
Losing track
An unusual problem was encountered in one of the testing videos: the leader tracker got lost. The tracker algorithm is extremely robust and normally the manifested errors come from people detector’s weaknesses. Hence, it is quite rare to face this issue when it did not occurred in any training sequence before.
Figure 13 shows how the algorithm was performing sufficiently well in Video 6 until the tracker looses the science communicator’s location. Although tracking information is missing, the algorithm’s categorization task remains in force.
Fig. 13.
Video 6 with 70% of accuracy. Top: Science communicator is being tracked as the leader. False positive object detection is classified as non-group member until the algorithm is able to eliminate it. Bottom: Leader tracking is lost in some point around frame 35. Yet, the algorithm still considers the leader as part of the group.
The cameraman controversy
The cameraman case has been a difficult one to overcome, opposing opinions exist on the question as to whether a cameraman should be considered as a group member or not, even among human beings. Then, what can be expected from the reasoning of a machine?
If the cameraman is close enough to the group or moves fast to catch up with them, it is very likely for the cameraman to be confused with a group member.
A situation also exists where the cameraman could be addressed as the group leader if he starts moving earlier than the leader and even faster, as he is trying to avoid a possible collision with the group.
Keeping pace with the leader
Yet, false categorizations for the leader role can occur under a certain course of events. Video 3 portrays an image sequence dealing with a Transitory State where the video starts depicting a science communicator guiding the museum visitors to the next exhibition. Everyone on the scene moves at the same time and as fast as the science communicator leading their way, thus creating a large motion rectangle which overlaps with all the detection boxes (see Fig. 14).
Fig. 14.
Video 3 with 46% of accuracy. Top: All individuals have been detected, no roles assigned yet. Bottom: The cameraman has been addressed as the group leader, whereas the science communicator is not even detected on this frame. A large motion rectangle is displayed containing all the detections on scene.
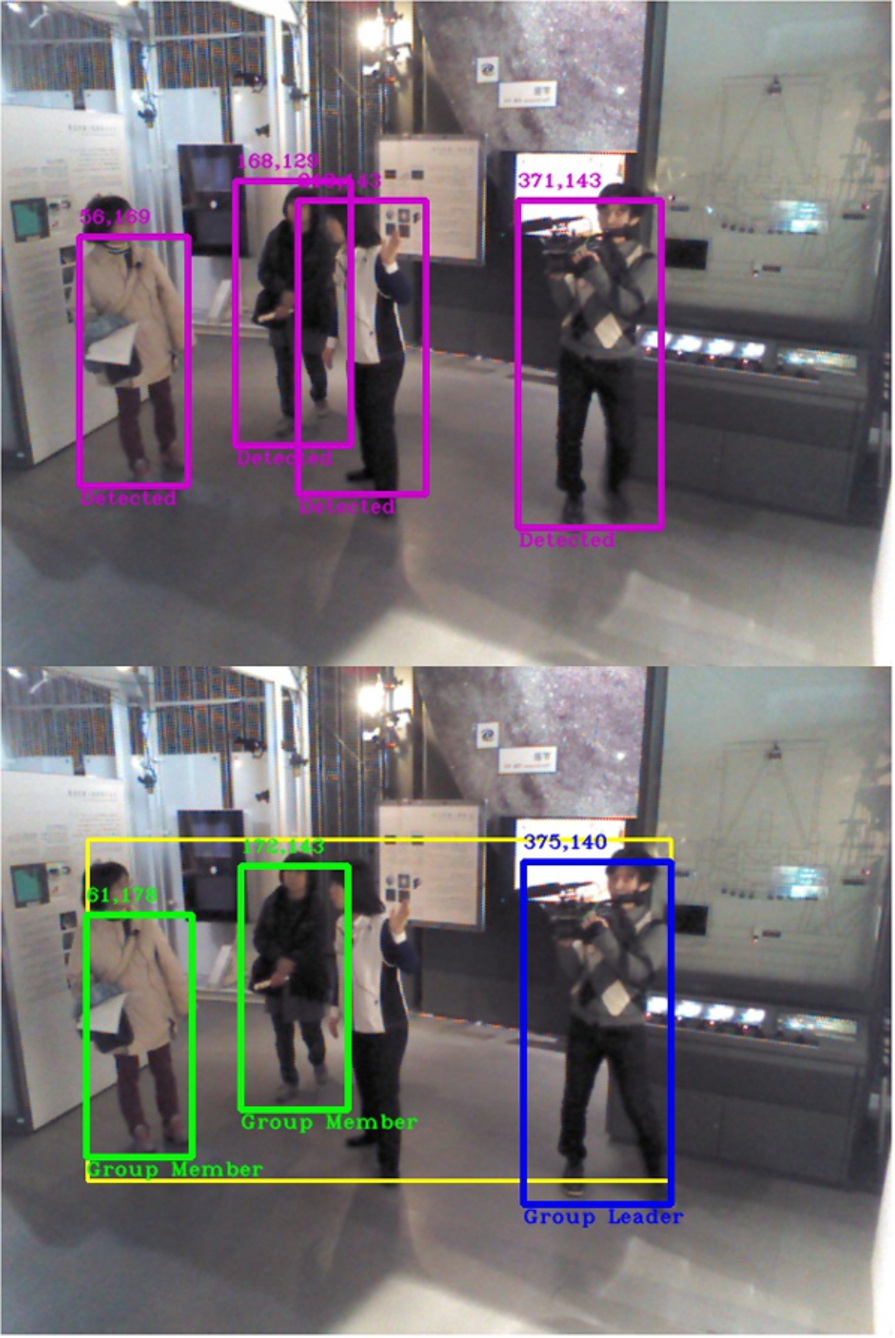
Table 3
Categorization with exponential motion – Accuracy test
| Test name | Total frames | Sampling frame rate | Sample frames | Detection boxes | Leader correct | Leader incorrect | Member correct | Member incorrect | Accuracy (%) |
| Video 1 | 910 | 10 | 91 | 178 | 36 | 46 | 51 | 45 | 48 |
| Video 2 | 450 | 10 | 45 | 100 | 39 | 0 | 50 | 11 | 89 |
| Video 3 | 200 | 10 | 20 | 36 | 8 | 3 | 13 | 12 | 58 |
| Video 4 | 500 | 10 | 50 | 55 | 45 | 0 | 5 | 5 | 91 |
| Video 5 | 230 | 10 | 23 | 57 | 16 | 1 | 35 | 5 | 89 |
| Video 6 | 115 | 5 | 23 | 24 | 9 | 0 | 6 | 9 | 63 |
This unveils a critical predicament for the algorithm’s logic so far. As all the detection boxes are the “first” to overlap with the motion rectangle, the system will choose as group leader the first box that was detected and analyzed by the people detector, which is random.
6.5.Discussion
As mentioned in the previous section, most issues come from the people detector’s performance and while it is true some cases come with a certain complexity, a better people detector should be implemented to mitigate this issue as much as possible.
Errors arising from self occlusions between individuals and difficult view angles are very likely to dissipate once the system is installed on a robotic assistant. The experiments presented on this work contain image sequences from fixed cameras of the Kinect devices recording on the upper part of different rooms. In contrast, a robot would have a better point of view of the scene in general and even the flexibility to move around to get one.
With the purpose of extending the average accuracy of the system and boost the algorithm’s performance to another level, an exponential motion algorithm should be carefully designed for further implementation.
A human cognitive knowledge about roles within an observed group of people is based on their exponential interactions and behavioral attitudes over time. Meaning that, it is sometimes difficult for human beings to immediately categorize a group and classify their roles when the group is extremely homogeneous a priori.
All members behave somehow equally and adopt the same attitude towards each other, regardless of whether there’s a visually distinctive subject or not. As a consequence of this complexity, we need to observe their interactions for a while longer until these members seem to develop self-identities, defining their own group roles (consciously or not).
Once we are satisfied with this development then it looks only natural to deliberately determine who is a leader and who are the followers. Arriving to that conclusion implies we had observed a series of interactions evolving, where the leader’s attitude grew exponentially within a certain time period. To convey this human-like way of reasoning into a machine is the missing piece of the puzzle. Quantifying the motion interactions over time of all the detections, in an exponential fashion, will reinforce the algorithm and improve significantly its overall structure.
6.6.Exponential motion algorithm implementation
A first version of the exponential motion approach has been developed and subsequently tested on all the videos. The exponential analysis is made every 50 frames, where the most targeted role for each detection becomes its definite categorization. At least until the next 50 frames, since the role computations reset to zero and start all over again, eliminating the initial hard constraints and delivering a relatively dynamic role attribution.
Table 3 refers to the accuracy test results obtained after implementing the exponential motion algorithm. In contrast with Table 2, the general averaged accuracy and the actual average accuracy both have dropped by 2%, from 75% to 73% and from 71% to 69%, respectively.
Following this comparison but being more specific, Video 1 and Video 6 have shown fair results as some errors have effectively diminished (see Figs 15 and 16). However, accuracy in Video 1 increased by 12% with the exponential motion implementation, while accuracy on Video 6 decreased 7%.
Fig. 15.
Video 1 results under exponential motion implementation. Top: Frame 51, one group member is correctly categorized and the other is wrongly addressed as the group leader, whereas the true leader is not even detected. Bottom: Frame 419, after several frames of analysis all the detections are correctly categorized on scene.
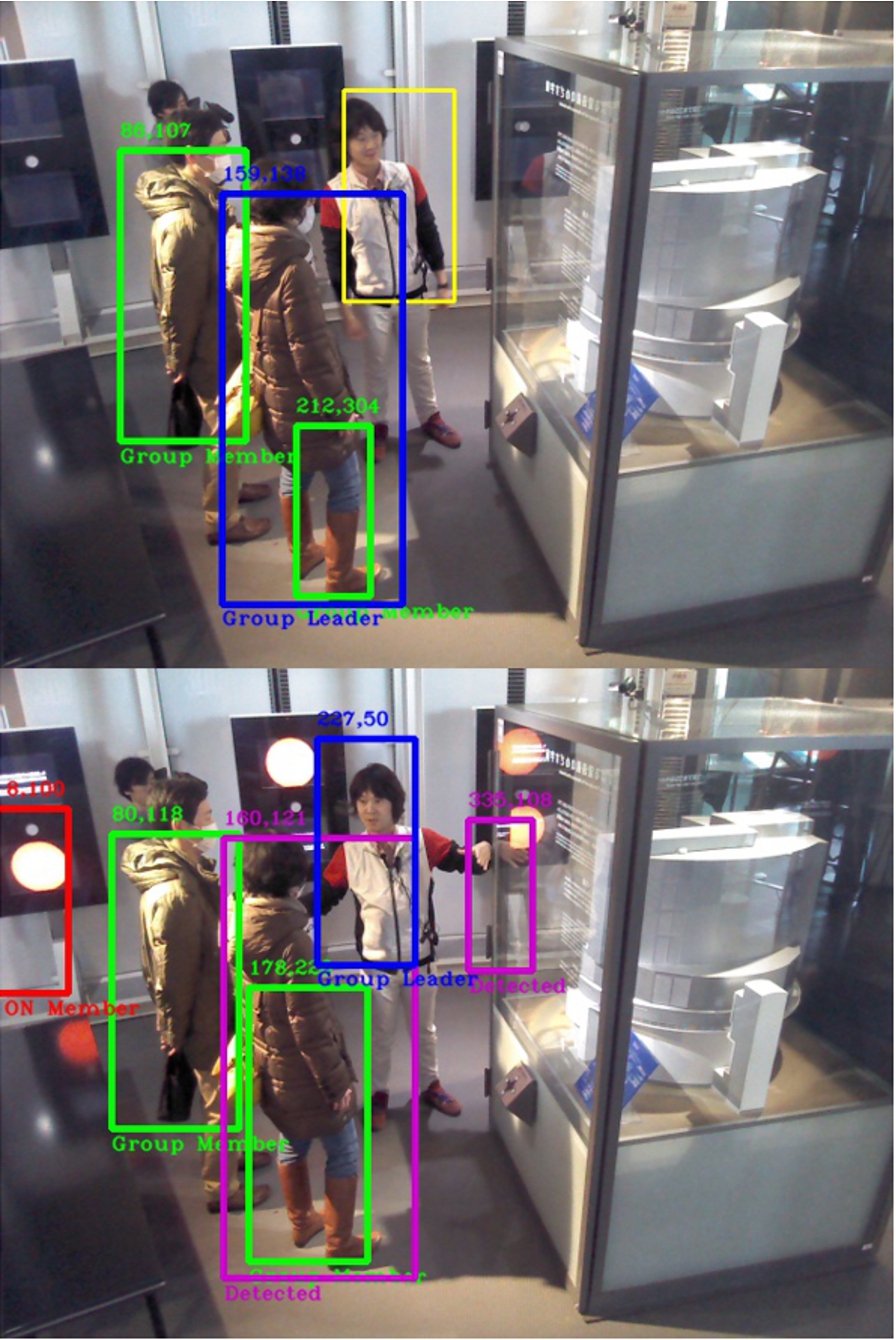
Fig. 16.
Video 6 results under exponential motion implementation. Top: Frame 51, only one false categorization made on a group member and the leader tracking is working properly. Bottom: Frame 70, incorrect categorization on the same group member remains, yet the tracker keeps following the leader almost exiting the scene.
On the other hand, Video 3 rose its accuracy by 12% as well, due to an improvement in correct leader detections (see Table 3), although members categorizations on Video 3 leave much to be desired (Fig. 17). A problem that affects the rest of videos – the ones depicting the best accuracies on the previous set-up – just as much.
Notice that the accuracy on Video 2, Video 4 and Video 5 fell by 9% with respect to the original algorithm. The cause behind these fluctuations can be observed in Table 3, a quite visible and general trade-off between leader and members categorization: Improvement in the correct identification of the leader has affected the membership in a negative way.
It seems that the dynamic role assigning interferes with the proxemics of the original algorithm, a factor that must be considered on a second version of the exponential motion implementation.
On a side note, people detection issues are still backing down the algorithm’s performance, despite the efforts of creating an array with a historical record of detections as an attempt to maintain track and control of all the detections boxes and avoid further duplication or sub-detection (identify the same detection in a smaller bounding box).
Fig. 17.
Video 3 results under exponential motion implementation. Top: Frame 51, although the four people on the scene are moving as significantly as the group leader does, the leader is correctly categorized along with the cameraman and one of the two group members. Bottom: Frame 102, two out of three detections are wrongly categorized. Purple boxes are references to previous detections.
7.Conclusion and future work
In this paper, a new problem has been addressed within the group tracking research area. Detecting the leader of a group and categorize its members attracts a great deal of interest in the study of group interaction and social environments. Role assignment and behavioural analysis by means of a cognitive approach based on motion logic and proxemics theory is a novel methodology which is apparently naive but its simplicity has proven to be quite successful.
The prominent results of this work are considered to be relevant for a wide scope of possible applications, specially for robotic assistants in similar environments. In order to achieve the sufficient accuracy for the algorithm and later impact on more complex environments, a number of improvements are required, besides the ones mentioned in Sections 6.5 and 6.6, after exhaustive analysis of experimental results. Hence, depth data related to the color images obtained from Kinect’s RGB-D sensor should be used to create a more refined detection of the subjects, despite the challenge of restoring faulty information. Another improvement refers to the location of people’s bounding boxes, which could be used as a region of interest over the corresponding depth arrays, which combined with thresholded distances, background subtraction algorithm or a deep learning segmentation method, would provide better results.
It is important to fully exploit the collected 3D data on the field for the sake of future experiments in this research line. However, it is also natural to explore solutions with immediate upgrades.
Kinect v2 uses time-of flight by which the sensor can see just as well in a completely dark room as in a well lit room. The first Kinect also accomplishes this feature using structured light to reconstruct the depth data with approximations for pixels between the projected points. Still, Kinect v2 has far superior performance since each pixel now has a unique depth value. This method is more stable, precise and less prone to interferences. Face recognition and motion tracking have greater accuracy using the newest Kinect model. Kinect v2 has 1080 image resolution (HD), 60% wider field of vision, and can detect and track 20 joints from 6 people’s bodies including thumbs. In comparison, Kinect v1 could only track 20 joints from 2 people.
This RGB-D state-of-the art technology is certainly more powerful and complex than the one embedded in the first generation of Kinect. A significant improvement that comes along in real-time, processing 2 gigabytes of data per second with a faster broadband for data transfer. Therewith, further on-line implementation of background subtraction and coordinate mapping would result in a people detector with higher accuracy and virtually zero false-positives.
Notes
Acknowledgements
We would like to thank Dr. Mamoru Mohri and the Miraikan staff for the data collection. This work was partly supported by the SOKENDAI Interdisciplinary Research Program (FY 2013-2016), The Proposal for Interdisciplinary Research Coordination from SOKENDAI (The Graduate University of Advanced Studies, Japan). Karla Trejo acknowledges the financial aid provided by CONACYT grant and the NII International Internship Program.
References
[1] | C. Angulo, S. Pfeiffer, R. Tellez and G. Alenyà, Evaluating the use of robots to enlarge AAL services, Journal of Ambient Intelligence and Smart Environments 7: (3) ((2015) ), 301–313. doi:10.3233/AIS-150315. |
[2] | W. Burgard, A.B. Cremers, D. Fox, D. Hähnel, G. Lakemeyer, D. Schulz, W. Steiner and S. Thrun, The interactive museum tour-guide robot, in: Proceedings of the Fifteenth National/Tenth Conference on Artificial Intelligence/Innovative Applications of Artificial Intelligence (AAAI’98/IAAI’98), (1998) . |
[3] | W. Burgard, A.B. Cremers, D. Fox, D. Hähnel, G. Lakemeyer, D. Schulz, W. Steiner and S. Thrun, Experiences with an interactive museum tour-guide robot, Artificial Intelligence 114: (1–2) ((1999) ), 3–55. doi:10.1016/S0004-3702(99)00070-3. |
[4] | R.T. Collins, A.J. Lipton, T. Kanade, H. Fujiyoshi, D. Duggins, Y. Tsin, D. Tolliver, N. Enomoto, O. Hasegawa, P. Burt and L. Wixson, A System for Video Surveillance and Monitoring: VSAM Final Report, The Robotics Institute, Carnegie Mellon University, Pittsburgh PA, (2000) . |
[5] | F. Cupillard, F. Brèmond and M. Thonnat, Tracking Groups of People for Video Surveillance, University of Kingston, London, (2001) . |
[6] | N. Dalal and B. Triggs, Histograms of oriented gradients for human detection, in: Proceedings of the 2005 IEEE Computer Society Conference on Computer Vision and Pattern Recognition (CVPR’05), (2005) , pp. 886–893. |
[7] | M. Danelljan, G. Häger, F.S. Khan and M. Felsberg, Accurate scale estimation for robust visual tracking, in: Proceedings of the British Machine Vision Conference, BMVA Press, (2014) . |
[8] | M. Díaz, D. Paillacho, C. Angulo, O. Torres, J. González and J. Albo-Canals, Evaluating group-robot interaction in crowded public spaces: A week-long exploratory study in the wild with a humanoid robot guiding visitors through a science museum, International Journal of Humanoid Robotics 12(4) (2015). |
[9] | S. Escalera, Human behavior analysis from depth maps, in: Articulated Motion and Deformable Objects, (2012) , pp. 282–292. doi:10.1007/978-3-642-31567-1_28. |
[10] | G. Farnebäck, Two-frame motion estimation based on polynomial expansion, in: Proceedings of the 13th Scandinavian Conference on Image Analysis (SCIA’03), J. Bigun and T. Gustavsson, eds, Springer-Verlag, Berlin, Heidelberg, (2003) , pp. 363–370. |
[11] | A. Garrell-Zulueta and A. Sanfeliu, Cooperative social robots to accompany groups of people, The International Journal of Robotics Research 31: (13) ((2012) ), 1675–1701. doi:10.1177/0278364912459278. |
[12] | M. Ghosh and H. Kuzuoka, An ethnomethodological study of a museum guide robot’s attempt at engagement and disengagement, Journal of Robotics (2014). |
[13] | D. Gowsikhaa, S. Abirami and R. Baskaran, Automated human behavior analysis from surveillance videos: A survey, Artificial Intelligence Review 42: (4) ((2014) ), 747–765. doi:10.1007/s10462-012-9341-3. |
[14] | E. Hall, Handbook of Proxemics Research, Society for the Anthropology of Visual Communications, (1974) . |
[15] | Y. Kuno, K. Sadazuka, M. Kawashima, K. Yamazaki, A. Yamazaki and H. Kuzuoka, Museum guide robot based on sociological interaction analysis, in: Proceedings of the SIGCHI Conference on Human Factors in Computing Systems (CHI’07), (2007) . |
[16] | Y. Kuno, H. Sekiguchi, T. Tsubota, S. Moriyama, K. Yamazaki and A. Yamazaki, Museum guide robot with communicative head motion, in: The 15th IEEE International Symposium on Robot and Human Interactive Communication, ROMAN, (2006) . |
[17] | B. Lau, K.O. Arras and W. Burgard, Tracking groups of people with a multi-model hypothesis tracker, in: Proceedings of the 2009 IEEE International Conference on Robotics and Automation (ICRA’09), (2009) , pp. 3487–3492. |
[18] | B. Lau, K.O. Arras and W. Burgard, Multi-model hypothesis group tracking and group size estimation, International Journal on Social Robotics 2: (1) ((2010) ), 19–30. doi:10.1007/s12369-009-0036-0. |
[19] | T. Linder and K.O. Arras, Multi-model hypothesis tracking of groups of people in RGB-D Data, in: IEEE International Conference on Information Fusion (FUSION’14), Salamanca, Spain, (2014) . |
[20] | B.D. Lucas and T. Kanade, An image registration technique with an application to stereo vision, in: Proceedings of Image Understanding Workshop, (1981) , pp. 121–130. |
[21] | F. Martí Carrillo, J. Butchart, S. Knight, A. Scheinberg, L. Wise, L. Sterling and C. McCarthy, Help me help you: A human-assisted social robot in pediatric rehabilitation, in: Proceedings of the Annual Meeting of the Australian Special Interest Group for Computer Human Interaction, ACM, (2016) . |
[22] | S.J. McKenna, S. Jabri, Z. Duric, A. Rosenfeld and H. Wechsler, Tracking groups of people, Computer Vision and Image Understanding 80: (1) ((2000) ), 42–56. doi:10.1006/cviu.2000.0870. |
[23] | T. Moeslund, A. Hilton and V. Krüuger, A survey of advances in vision-based human motion capture and analysis, Computer Vision and Image Understanding 104: (2) ((2006) ), 90–126. doi:10.1016/j.cviu.2006.08.002. |
[24] | M. Moussaïd, N. Perozo, S. Garnier, D. Helbing and G. Theraulaz, The walking behaviour of pedestrian social groups and its impact on crowd dynamics, PLoS ONE 5(4) (2010). |
[25] | D. Paillacho, C. Angulo and M. Díaz, An exploratory study of group-robot social interactions in a cultural center, in: IEEE/RSJ International Conference on Intelligent Robots and Systems. IROS 2015 Workshop on Designing and Evaluating Social Robots for Public Settings, (2015) , pp. 44–48. |
[26] | X. Perez-Sala, S. Escalera, C. Angulo and J. Gonzàlez, A survey on model based approaches for 2D and 3D visual human pose recovery, Sensors 14: (3) ((2014) ), 4189–4210. doi:10.3390/s140304189. |
[27] | S. Saxena, F. Brémond, M. Thonnat and R. Ma, Crowd behavior recognition for video surveillance, in: Proceedings of the 10th International Conference on Advanced Concepts for Intelligent Vision Systems (ACIVS ’08), Springer-Verlag, Berlin, Heidelberg, (2008) , pp. 970–981. doi:10.1007/978-3-540-88458-3_88. |
[28] | J. Shi and C. Tomasi, Good features to track, in: 1994 IEEE Conference on Computer Vision and Pattern Recognition (CVPR’94), (1994) , pp. 593–600. |
[29] | M. Tao, J. Bai, P. Kohli and S. Paris, SimpleFlow: A Non-iterative, Sublinear Optical Flow Algorithm, Computer Graphics Forum (Eurographics 2012), 31: (2) ((2012) ). |
[30] | S. Thrun, M. Beetz, M. Bennewitz, W. Burgard, A.B. Cremers, F. Dellaert et al., Probabilistic algorithms and the interactive museum tour-guide robot minerva, The International Journal of Robotics Research 19: (11) ((2000) ), 972–999. doi:10.1177/02783640022067922. |
[31] | C. Verstraeten, OpenCV Simple Motion Detection, Kerberos.io: Open source video surveillance and motion detection, 2014. |
[32] | P. Weinzaepfel, J. Revaud, Z. Harchaoui and C. Schmid, DeepFlow: Large displacement optical flow with deep matching, in: 2013 IEEE International Conference on Computer Vision (ICCV’13), (2013) , pp. 1385–1392. doi:10.1109/ICCV.2013.175. |


