
Enhancing the park experience by giving visitors control over the park’s soundscape
Abstract
Sound pollution is an ever growing problem in modern society, and especially in urban environments. In this paper, we investigate if and how artificial sounds can improve the experience of visitors of an urban park with a lot of traffic noise. By using a mobile app, park visitors can control the sound playback by selecting the natural sounds they like, such as birds or a waterfall, and setting the volume. This process of adding artificial sounds to the existing sound environment results in an augmented soundscape. Comparison of the environment with and without this sound playback showed that most visitors experience this as an improvement of the park environment and enjoy controlling the sounds. An experiment with 165 users identified various correlations between the visitors’ subjective evaluations of the sound environment and objective measures of their usage behavior with the app, such as the number of interactions and the spent time.
1.Introduction
Freely accessible urban parks have an important ecological and social value. To attract more visitors or make them stay longer, various studies focusing on the design and visual aspects (such as vegetation types and their roles) have been performed [39]. Besides the visual aesthetic quality of a landscape, the soundscape of a park has been identified as an important aspect for defining the quality of visitors’ experiences in the park. Natural soundscapes, defined as “the acoustic environment that would exist in the absence of human-related activity” [15], have a positive effect on the park visitors whereas an intrusion of any unwanted noise is likely to detract from park experiences [22]. In reality however, urban parks often have to contend with these mechanical noise disturbances. Sound pollution, such as road traffic noise, has a direct impact on the health of local inhabitants and can cause sleep disturbance, loss of concentration, annoyance and irritation, hypertension, high blood pressure, cardiovascular problem, restlessness, depression, fatigue and mental stress [21]. Noise urban maps can be used to monitor in real time the noises in public spaces such as bar areas, squares and parks [17].
As a result, soundscape planning or acoustic design, in the planning and management of open space in both urban and non-urban areas becomes an important research topic [9]. This fits into the creation of smart environments, where sensors, computing modules and people interact [33]. Physical spaces, such as city squares, public halls, parks etc, that are enhanced with the use of technology and media are also called responsive environments [3]. In this paper, the focus is on the use of sounds to enhance the experience. Sound has been identified as one of the ways to enable bidirectional communication between ambient intelligent environments and the user [40].
The complexity as well as the potentials of soundscape research and practice have been demonstrated over the last decade. In early research, the focus was purely on reducing noise levels, whereas in more recent studies a tendency to overall soundscape design can be witnessed [25]. The user’s perception of the acoustic environment can be improved, among others, by simulating (natural) sounds [23]. The process of adding sounds to a real physical location, results in so called “augmented soundscapes” [24].
Over the years, many studies have been focusing on the acoustic comfort evaluation or acceptability of the sound environment of a targeted urban park. Besides visual comfort evaluation of the landscape, the acoustic quality has proven to play an important role on users’ acceptability of the urban park environment [41]. This acoustic evaluation is often based on interview surveys since acoustic comfort evaluation is a subjective measure. In the evaluation process, users’ overall opinion of the soundscape quality is affected by how sensitive they are to specific sounds in the place and their preferences for these sounds [30].
However, in most studies, users are exposed to some existing or predefined soundscapes in the urban park. These (augmented) soundscapes are proposed by the researchers and are static for the duration of the experiment. In contrast, our experiment offered users the possibility to compose their own soundscape by using their smartphone. With a mobile application, they could combine different natural sounds and configure the volume of each, in order to obtain their own preferred soundscape. Whereas in traditional cases the park visitors are consumers of predefined soundscapes, in our study the visitors were also a producer of new soundscapes that reflect their own personal sound preferences.
According to our knowledge, this paper is the first to evaluate soundscapes in an urban park that are created by the visitors of the park. By giving users more control over the playback service and the sound content, they might be interested to try the soundscape creation process, and experience the soundscape playback more consciously. Also in other digital application domains, the introduction of interactivity and user control has shown a positive impact on the service usage [13,14].
In this paper, we answer the following Research Questions (RQ).
– RQ1: Which sounds are chosen by the user and at which volume are they played? (Section 4.1.1 and 4.2)
– RQ2: How much time do users spend on creating a soundscape for the park environment? (Section 4.1.2)
– RQ3: How is the sound environment experienced by the user without and with an augmented soundscape? (Section 4.3)
– RQ4: How do users think about the app for creating a soundscape? (Section 4.4)
– RQ5: How are objective measures, such as the volume, the number of interactions and the time spent with the app, correlated with each other and with the subjective experience of the user? This can indicate whether users behave differently with the app depending on their appreciation for the app. (Section 4.5 and 4.6)
– RQ6: Are user demographics (gender and age) correlated with the user’s behavior and appreciation for the app? (Section 4.7)
– RQ7: How to estimate the time that users need to create a soundscape? (Section 4.8)
The remainder of this paper is organized as follows. Section 2 discusses related work in the domain of soundscapes and the subjective evaluation. Section 3 describes the setup of our experiment with details about the location in Section 3.1. Section 3.2 provides more information about the users who participated. In Section 3.3, we describe the mobile app that was used in the experiment for creating soundscapes. Next, Section 4 discusses the obtained results. Section 4.1 discusses the usage of the app during the experiment: which sounds and volumes are selected (Section 4.1.1), and how much time users have spent on the different parts of the experiment (Section 4.1.2). Section 4.2 investigates more in detail which sounds are combined by the users in the soundscape creation process. In Section 4.3, we discuss the different subjective measures, and how they correlate. Section 4.4 gives more details about the qualitative feedback obtained from the users. Section 4.5 elaborates on the objective measures and their correlations. Section 4.6 reports on how the subjective evaluations are related to the user’s usage of the app. For this, the correlations between the subjective and objective measures are investigated and interpreted. Section 4.7 investigates a possible relation between user demographics (gender and age) and the usage and evaluation of the soundscape creation process. Section 4.8 proposes a model for the time that users spend on the creation of a soundscape. In Section 5, we discuss our findings about the experiment and the reactions of the participants. Finally, Section 6 draws conclusions.
2.Related work
This paper is the result of a long-term study regarding the soundscape creation process, the acoustics characteristics of the sounds, and the users’ behavior in relation to the mobile application as well as their experience with the soundscapes in the urban park.
In a recent publication [44], the acoustic characteristics of the sound samples, and the preferences of the users for the individual sounds and composed soundscapes are discussed. One of the main conclusions was that most people liked a balanced combination of various types of natural sounds, with a clear preference for bird sounds. A clear trend in the sound selections of the user for sounds in the frequency range between 2.5 kHz and 8 kHz was observed. People seem to consistently maximize the signal-to-noise ratio relative to the background noise. The augmented soundscapes were found to strongly mask the dominant road traffic noise in the park, while the general appreciation of the park’s sound environment improved [44].
In our study, we investigated the users’ soundscape configurations, their behavior with the app, and the “user experience” with the soundscapes users are exposed to and with the soundscape creation process. This study provides insights into the interrelationship of park visitors’ everyday lives and the mobile technology that allows the creation and playback of soundscapes in this public environment.
Augmented soundscapes are one way to improve the experience of users, or to provide information based on sounds. Related to this, movement-to-sound interaction is attracting growing research attention in HCI (Human-Computer Interaction). An example is the usage of wearable sounds kits, a movement-to-sound interaction accessory [35].
Augmented soundscapes are a key ingredient for the development of smart environments, such as smart cities, whereby everyday life objects are augmented with multimedia content and computational and wireless communication capabilities. In the smart home, scheduling the playback of sounds or setting appropriately the multimedia devices configuration according to the users’ preferences can assist the user in daily activities [19].
Creating augmented soundscapes, or adding sounds to public spaces, has been the core activity of many researchers, sound artists, and city authorities over the past decade [5,27]. A good example is the soundscape of the “Nauener Platz” in Berlin [36]. Audio islands, as they called it, were playing the sound people like to live with in that area. Another study investigated the effects of landscape on soundscape perception in five city parks in China [29]. The results showed that the percentage of buildings, vegetation and sky in panoramic views were effective landscape elements influencing soundscape perception. An other initiative investigated the opportunity to change the soundscape in public squares in China [11]. Using an app, surveys were conducted to have an appraisal of the situation. However it was not possible to intervene in the playback of the soundscape with this app. Whereas in existing research, it is typically the expert (researcher, artist, system designer) who creates and configures the soundscape, in our research the end user who is exposed to the soundscape is also in control of the sounds and volumes.
The usage of augmented soundscapes in a park environment is also related to research in the domain of attention restoration theory [6]. Spending time in nature, by watching a sunset, gazing at the ocean or mountains, or sitting in a park, provides people with the opportunity to rest, reflect, and restore them selves. Kaplan’s attention restoration theory states that nature improves people’s state of mind [26]. It contributes to overcoming mental fatigue and improves people’s ability to focus and direct their attention effectively. Recent studies proved that visiting nature more than once a week is positively associated with general health and household pro-environmental behaviours [31]. Moreover natural, social, and health sciences agree on the impacts of nature experience on cognitive functioning, emotional well-being, and other dimensions of mental health [7].
Cities can be associated with decreased access to nature, especially for individuals living within economically deprived urban areas [38]. This emphasizes the importance of citizens proximity to green space, street trees, private gardens, or urban parks [34]. However, these green oases in the city are often characterized by typical city sounds and visual elements of the urban environment. In these urban environments, virtual elements combined with nature elements or virtual reality nature can have a positive influence on people’s physiological status and stress recovery [4]. Indeed, controlled laboratory studies have demonstrated beneficial psychological and stress/physiological impacts of nature images and sounds [42]. Examples of virtual settings are a 360-degree virtual reality nature video, which is recorded at the outdoor nature [10], and a virtual reality forest including nature sounds [4]. Moreover, this study with the virtual forest concluded that stress recovery can be facilitated by the addition of sounds of nature to a virtual green environment in a laboratory setting [4]. Building on this potential impact of nature sounds, our research investigates the impact of an artificial soundscape on the user’s experience in an urban park.
Soundscapes are typically evaluated in a subjective manner by users. Subjective measures, such as the user experience, better reflect the perceived quality of a service than traditional Quality of Service (QoS) parameters, since they take into account user aspects or non-technical service aspects and as a result they are often considered as the final goal in service development. In this respect, the term Quality of Experience (QoE) has been adopted from the domain of communication networks where it has been defined as “a perceivable, recognized, and nameable characteristic of the individual’s experience of a service which contributes to its quality” [28]. Also for mobile apps, the user experience is an important goal because of the direct relationships between QoE metrics, customer satisfaction, and business objectives [2].
It has been argued that QoE measurement should also include objective measures of the process and usage outcomes, besides the subjective measures [8]. Subjective measures represent the opinion of test participants and are typically obtained by asking to rate the quality of a service or by asking to detect a change in quality. However, subjective measures have some disadvantages. They can be biased by various factors. They do not measure user behavior and interactions that result from usage after perception. Changes to the service may be small enough to be unconsciously perceived but still affect behavior. Objective measures can and should be collected from user tests because these measures enable to draw conclusions beyond user perception to user experience [8]. Therefore, an accepted good practice consists of measuring objective behaviors, and complement these with subjective measures of user opinion [41]. This approach was also followed for a similar study of soundscapes in four parks in Hong Kong [41], concluding that the acoustic comfort plays an important role on users’ acceptability of the urban park. Natural sounds, such as a breeze, strengthen this acoustic comfort, whereas the sounds from heavy vehicles or bikes significantly reduce the comfort level. Our experiment goes further by putting the park visitors in control of the augmented soundscapes and enable them to compose their own soundscape.
In our experiment, different subjective evaluations were performed. Firstly, users were asked to evaluate the various aspects of the sound environment with and without augmented soundscape. This subjective evaluation of the sound environment assesses how users experience the acoustic quality and to what extent unnatural sounds are audible and annoying. The comparison with the augmented soundscape allows to measure to what extent users experienced the added sounds as an improvement of the acoustic quality. In addition, this paper further investigates the correlations between these subjective evaluations and objectively measured parameters of the soundscape configuration or user’s app usage statistics (such as timings).
Secondly, the user experience with the app for the soundscape configuration was assessed by a survey about the users’ “enjoyment” with the usage of the app. Whereas the evaluation of the sound environment is strongly influenced by the subjective user preferences for the sound content that was available for configuring the soundscapes, the evaluation of the enjoyment with the app assesses for the user’s pleasure and interest in configuring soundscapes independently of the content of the soundscape.
In many studies, the subjective user evaluations are collected in a controlled laboratory environment, based on experiments with standardized methods and characterized by a high level of control. In contrast, living lab experiments are less predefined but aim to provide more natural settings for studying QoE by assessing the test users in their usually usage context [12]. Living labs are defined by [16] as “environments for innovation and development where users are exposed to new ICT solutions in (semi-)realistic contexts, as part of medium- or long-term studies targeting evaluation of new ICT solutions and discovery of innovation opportunities”. These realistic contexts are especially important for soundscape assessments, since living lab experiments allow the interplay with dynamic user-related and contextual variables of the park and surrounding environment. In addition, as living labs ‘bring the lab to the people’ and draw on ‘real’ experiences from ‘real’ users, QoE research in such settings will likely yield more trustworthy results and have a higher validity than research in controlled environments [37]. Because of these advantages, the experiment presented in this paper has been carried out in a living lab.
3.Method
3.1.Location
The experiments of this paper were performed in the urban park called “Koning Albertpark”, known colloquially as “Zuidpark” [18]. This is a park located in the city center of Ghent in Belgium, that has the shape of a narrow rectangle. The park is surrounded by busy roads and at most locations within the park, traffic is visible. Adjacent to the park is an underground parking and tram tracks; the passing cars, buses and trams are a source of traffic noise that is clearly hearable from within the park. Many benches are available in the park on which visitors can rest.
Figure 1 shows a picture of the park in which the setup of our experiment is indicated. Behind one of the benches, a loudspeaker box (1 speaker) and amplifier were installed for playback of the augmented soundscape. These devices were attached to the wall of a small building that serves for the maintenance of the park. For the control of the soundscape playback, a Raspberry Pi 3 Model B, running Linux and a bunch of Python scripts, was used. This single-board computer served as WiFi access point for the experiment as well. In order not to overload this access point, no other internet traffic was allowed. Shrubs and trees ensured that this equipment was not visible from the location of the experiment.
Next to the bench, an info panel was placed to inform the users about our app that was available for playing soundscapes in the park. As indicated in the picture, nearby traffic was visible from the location of the experiment within the park. For more details about the park architecture and the measurements of the sound levels, we refer to our recent publication [44]. These measurements showed that the park can be classified as a low-quality park in terms of sound exposure [32]. As a result, it can be expected that unnatural sounds, such as traffic noise, that are clearly hearable may have a negative impact on the users’ experience in the park.
Fig. 1.
Photo of the urban park where the experiment was performed. Nearby traffic was visible and audible from the park.
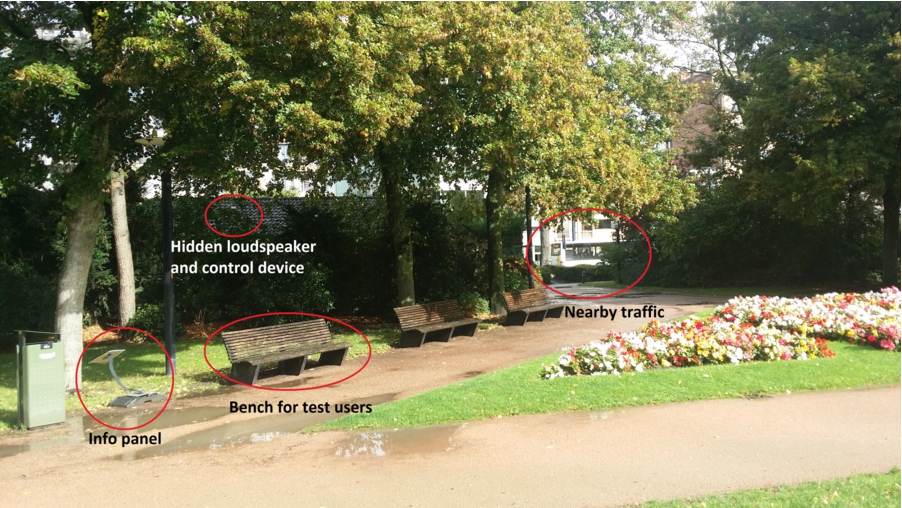
Table 1
Questions of the survey of the mobile app
| Phase(s) | Reference | Question | Answer range |
| (1) Current sound environment (2) Random augmented soundscape | SQ1: Overall Evaluation | Overall, how would you describe the present surrounding sound environment you just experienced? | (1) Very bad (2) Bad (3) Neither good nor bad (4) Good (5) Very good |
| SQ2: Attention Drawing | How much did the sound draw your attention during the last minutes? | (1) Not at all (2) Slightly (3) Moderately (4) Highly (5) Extremely | |
| SQ3: Disruptiveness | Would the sound environment you just experienced prevent you from doing the things you usually do or would like to do in this park? | ||
| SQ4a: Hearing Traffic Noise | To what extent did you hear traffic noise (cars, buses, trucks, trams, etc.) | (1) Not at all (2) A little (3) Moderately (4) A lot (5) Dominates completely | |
| SQ4b: Hearing Humans | To what extent did you hear sounds from human beings (conversations, children at play, footsteps, laughter, …) | ||
| SQ4c: Natural Sounds | To what extent did you hear natural sounds (birds, water related sources, wind in vegetation, …) | ||
| SQ4d: Other Sounds | To what extent did you hear other noise sources (sirens, construction, delivery, …) | ||
| (3) Soundscape design | DQ: Age-Gender | Tell us a little about yourself. What is your age and gender? | Integer number Male/Female |
| Eq. 1: Enjoyed Design | I very much enjoyed designing a soundscape. | (1) Disagree completely (2) Disagree (3) Neutral (4) Agree (5) Agree completely | |
| Eq. 2: Fun Design | Designing a soundscape was fun to do. | ||
| Eq. 3: Boring | I thought this was a boring activity. | ||
| Eq. 4: No Attention | This app did not hold my attention at all. | ||
| Eq. 5: Interesting | I would describe the soundscape app as very interesting. | ||
| Eq. 6: Designing Enjoyable | I thought designing a soundscape was quite enjoyable. | ||
| Eq. 7: Designing Enjoyed | While I was designing the soundscape, I was thinking about how much I enjoyed it. |
3.2.Participants
Casual visitors of the park have been asked to participate in the experiment during their park visit, using their own mobile phone. As a backup scenario in case of technical incompatibilities, participants could use a mobile phone of the researchers for the experiment (e.g. if the participant had a phone that is not able to run the Android app of the experiment).
All visitors of the park were invited to participate in the experiment by the info panel next to the bench at the site. This provided all the required instructions regarding the installation of the mobile app. So, no human guidance was needed for the experiment. However, to obtain a large number of participants in a period of around three weeks, a recruiter was addressing the visitors in the park and invited them to participate in the experiment. During the experiment, this recruiter did not interact with the participant in order not to interfere with the experiment. Each participant who successfully completed the experiment received an anonymized lottery ticket giving them the chance to win a smartphone. Participants could walk in the neighborhood of the bench, but they had to stay within the range of the WiFi network of our test setup.
This experiment and the coupled data analysis was approved by the ethics committee of the Faculty of Political and Social Sciences of Ghent University, Belgium, with registration number EC29. For more details regarding the recruitment, we refer to our recent publication [44].
Participants who did not completely finish the experiment (e.g., because of time constraints) were excluded from the analysis. Also participants who failed the consistency test of the questionnaire (Table 1) were excluded. This resulted in 165 valid sessions of different participants. All participant were casual visitors of the park: 53% female, 47% male, with median age of 27 years.
3.3.Procedure
For this experiment, an Android app called “Zuidpark Soundscape App” was developed and published in the Google Play Store. Park visitors could freely download this app on their smartphone. However, this app could only be used within the Zuidpark it was designed for. This requirement was imposed during design because it makes no sense to give the command to play a soundscape in the park if the user is not in the park, but in a different location (e.g. at home). This would confuse other visitors of the park. The app verified the location of the user by checking if the smartphone was within the range of a local WiFi network that was used for the experiment. So, only users within the range of the Wifi network of the experimental setup could use the app to design and play a soundscape. We opted not to use the smartphone’s GPS location because of privacy reasons, and because some users might disable their GPS to save battery.
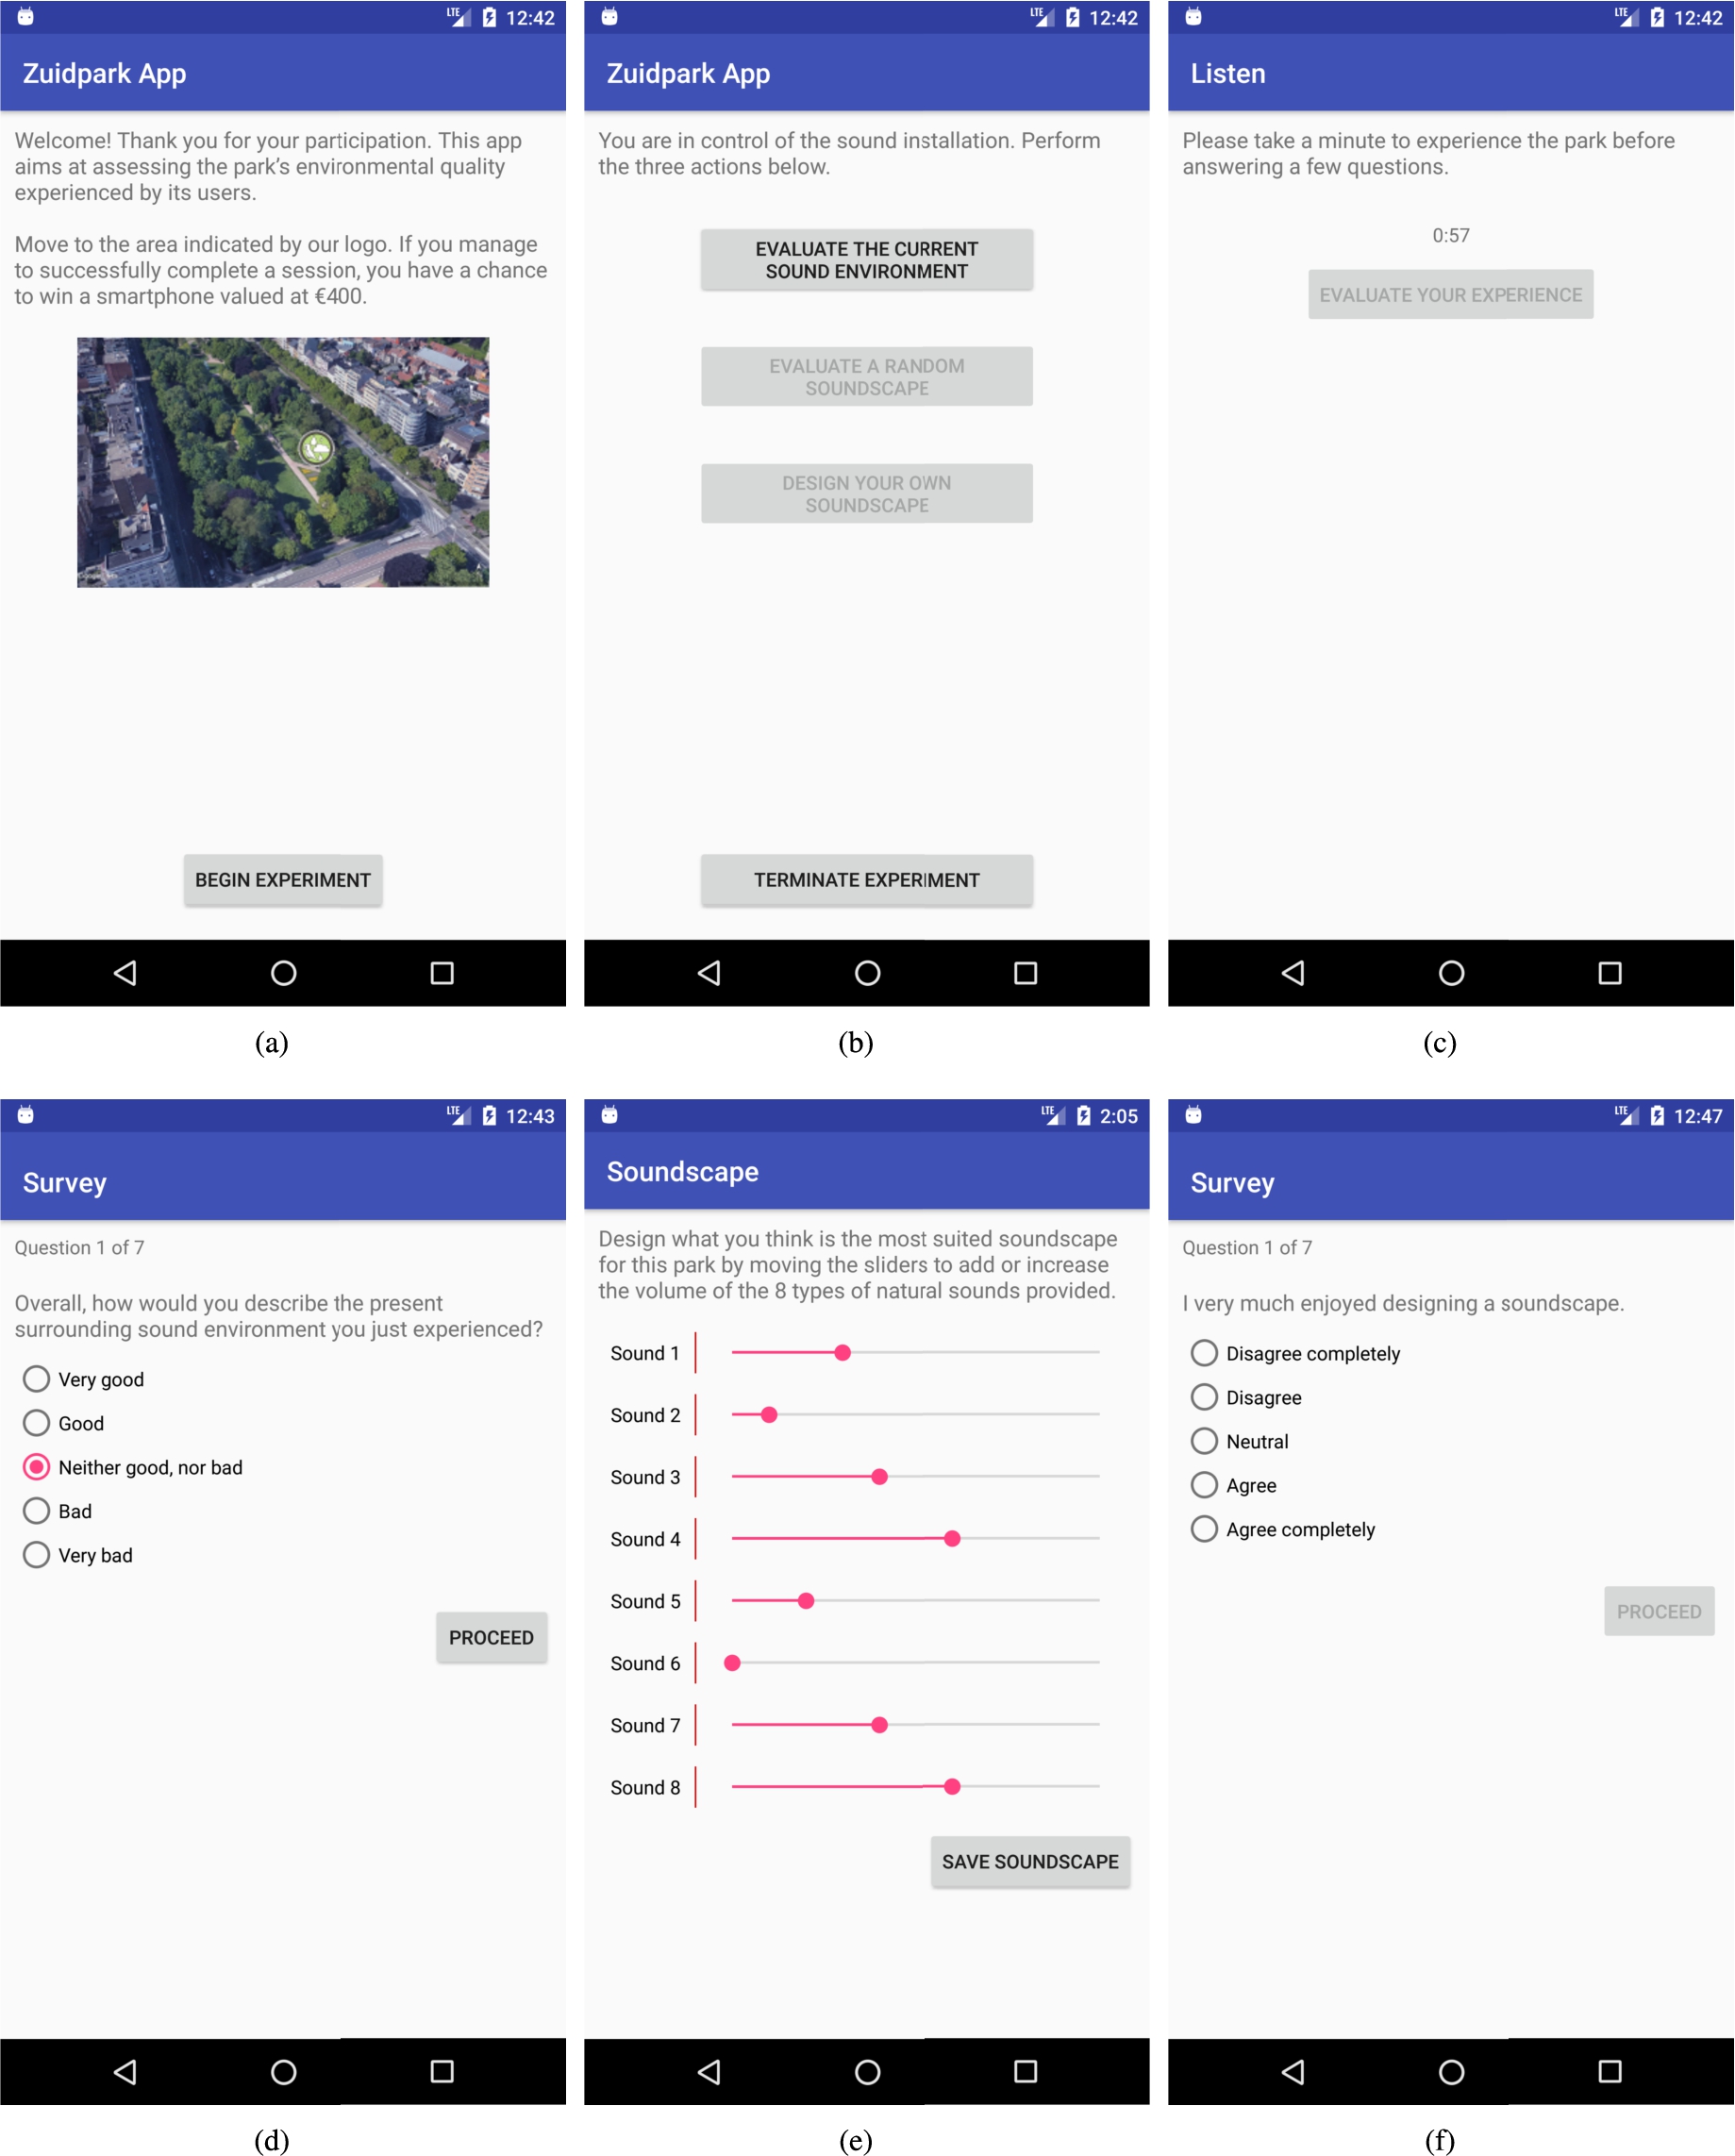
The usage of the app is straightforward. Figure 2 shows some screenshots of the app. In Fig. 2(a), a welcome screen is visible that explains the purpose of the app and instructs the user to move to the location of the experiment, near the bench. In addition, it explains that all participants had the chance to win a smartphone worth € 400.
As visible in Fig. 2(b), the app guides the user through three subsequent phases: 1) Listening to the current sound environment (without augmented soundscape) and evaluate this. 2) Evaluate a randomly-selected augmented soundscape designed by another visitor. 3) Design a new soundscape according to the user’s your own preferences and evaluate the experience with the app.
In phase 1, the user was asked to listen to the current sound environment of the park for at least one minute. This was the situation of the sound environment without an augmented soundscape, also called the “before” case in this paper. As visible in Fig. 2(c), a timer indicated how long the user was listening and after one minute, the button that said “evaluate your experience” became active. Next, the user was asked to evaluate the sound environment by answering the questions in Table 1 for phase 1. The visualization of this questionnaire in the app is illustrated in Fig. 2(d). After the evaluation of the sound environment without augmented soundscape, the users could proceed to phase 2.
In phase 2, a soundscape was played in the park and users were asked to listen to this soundscape and evaluate it. This was one of the augmented soundscapes that were available in the system. These augmented soundscapes were created by previous visitors to the park, and one of these was selected at random for playback. Again, users were asked to listen for at least one minute; but users could listen longer to the currently playing soundscape if desired. Subsequently, users were asked to answer the questions of Table 1 for phase 2, which are the same as in phase 1. These questions regarding their experience with the sound environment evaluated the situation of the sound environment with an augmented soundscape, also called the “after” case in this paper.
In phase 3, users were asked to create their own soundscape using the app. As visible in Fig. 2(e), users could compose a soundscape based on eight different natural sounds. In order not to influence the user’s selection and experience with the sounds, the different sound samples received the neutral label: “sound X”, with X the index of the sound. The different sounds were randomly ordered for each participant in order to avoid any bias regarding their position in the list. The following sounds were used: a bee, sea gulls, sparrow, raindrops, leaves (moved by the wind), songbirds, waterfall, and water stream. For more details and the spectrogram of these samples, we refer to our recent publication [44]. Each sound could be muted, or a volume setting ranging from 1 to 10 could be chosen. While users were changing the volumes, they heard the current soundscape composition playing and they perceived the impact of their changes in real time. The WiFi connection with the Raspberry Pi device enabled the control of the loudspeaker box using the app. After the soundscape creation process, users got a short questionnaire to gauge their experience with the soundscape design process. Figure 2(f) shows a screenshot of the app displaying one of these questions. Table 1 lists the questions for phase 3, which include a few consistency tests to check if participants were truthfully answering the questions.
During the experiment, all user interactions were logged. The users’ answers to the questionnaires of phase 1, 2 and 3 were saved in JSON files. For the soundscape creation process in phase 3, all volume changes with timestamps were logged in the app for analysis. This allows to study how much and in which way the configuration panel of Fig. 2(e) was used. Additional timestamps registered how much time users spent on each phase. These data were synchronized with a server using the Firebase solution [20], in order to aggregate the data of all participants.
Fig. 2.
Screenshots of the smartphone app: (a) Introduction screen explaining the app. (b) The features of the app: evaluating the sound environment, evaluating an existing soundscape, or designing your own soundscape. (c) Before evaluation, the user was asked to listen to the sound environment for one minute; a timer counted down. (d) Survey about the sound environment. (e) The soundscape creation panel. (f) Survey about the user’s enjoyment with the soundscape creation process.
4.Results
4.1.App usage
4.1.1.Volume and sound selection
In this section, we discuss the selection of specific sounds for creating the soundscape and the volume levels assigned by the users. Figure 3 shows the popularity of each sound, measured by the number of users who selected that sound (
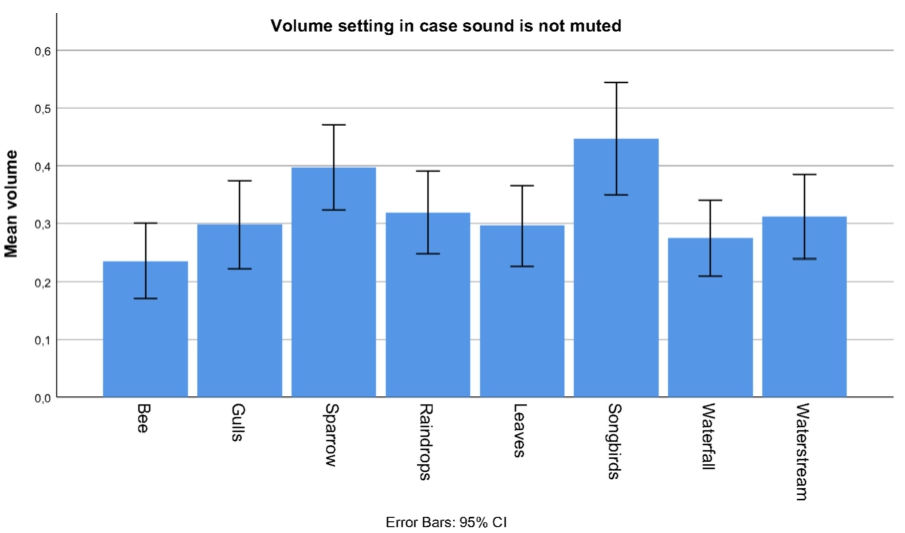
Figure 4 shows the volumes for all sounds, averaged over all created soundscapes in the experiment, together with the
An interesting correlation of 0.87 between the number of users who selected a sound (Fig. 3), and the mean volume assigned to that sound (Fig. 4) can be identified. So, if users selected a sound more often, they typically configured a higher volume for that sound. Sounds such as “Songbirds” and “Sparrow” are very popular for the soundscape configuration but also have a higher mean volume than the other sounds. We can conclude that these bird sounds are very popular with users and are very appropriate for the context of a park. This was also confirmed by the spontaneous reactions of users during the experiment. These results are in accordance with other studies that concluded that bird sounds are the most preferred among natural sounds [23]. In contrast, sounds such as “Bee” were often considered as annoying, and were therefore less popular and received a lower mean volume. This answers RQ1: “Which sounds are chosen by the user and at which volume are they played?”. More details of the types of sounds used and their volume settings are published in our recent article [44].
Fig. 3.
The popularity of the sounds, expressed by the number of users who selected the sound for their soundscape.
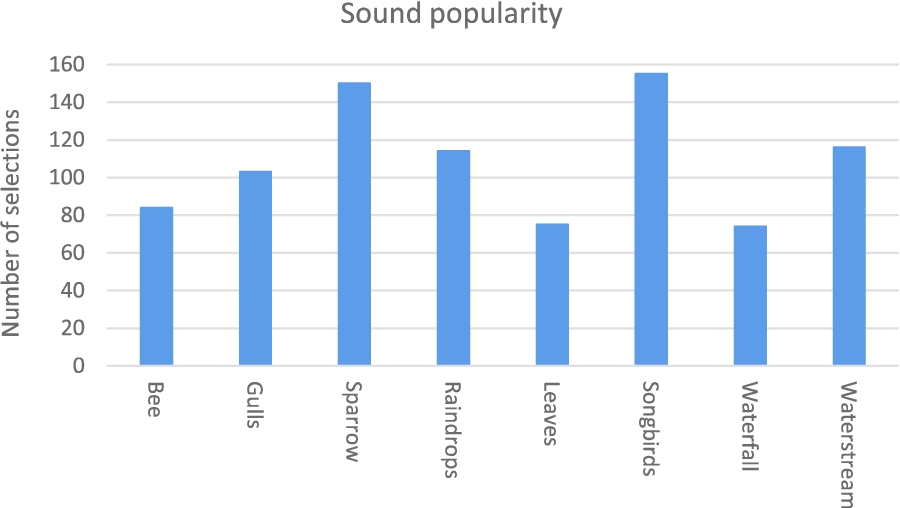
Fig. 4.
The mean sound volume settings (for non-muted sounds) as configured by the users in the experiment.
4.1.2.Time allocation
In this section, we discuss how much time users have spent on the different aspects of the experiment. In the following order, users had to listen to the sound environment without augmented soundscape (“EnvironmentListening”), fill in a survey about the sound environment (“EnvironmentSurvey”), listen to an available soundscape of 1 minute that was played in the park (“SoundScapeListening”), fill in a survey about the soundscape they heard (“SoundScapeSurvey”), creating their own sound scape (“SoundScapeCreation”), and fill in a survey that assesses how much they enjoyed the whole experiment (“EnjoymentSurvey”).
Figure 5 shows the mean time that users have spent on these different phases of the experiment together with the
Fig. 5.
The time spent by users on the different phases of the experiment.
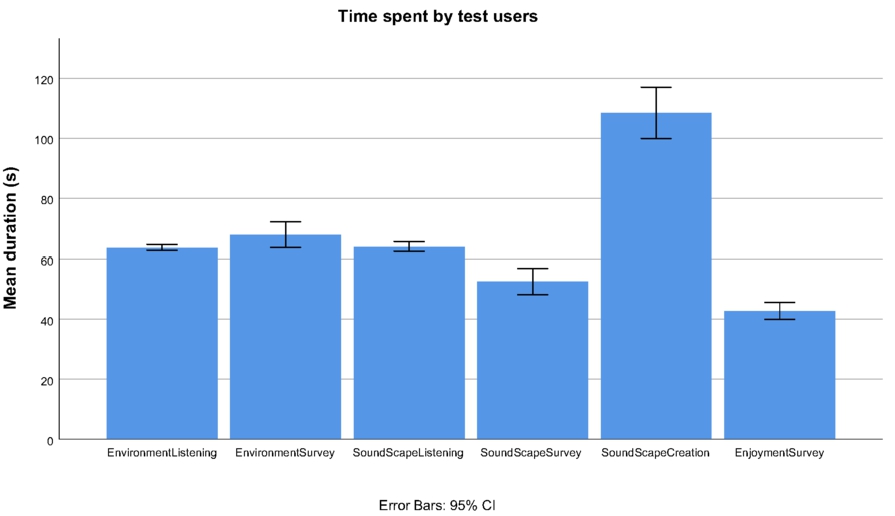
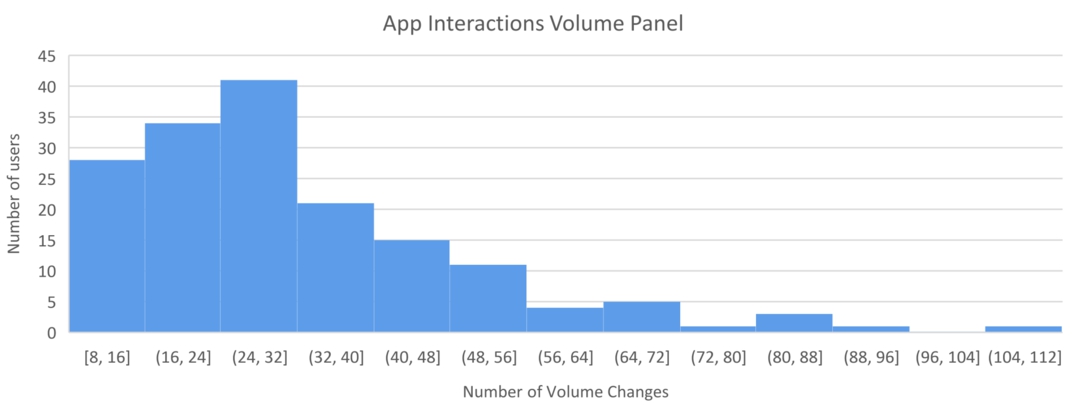
During the soundscape creation phase, users had to configure their own soundscape by setting the volume levels of eight different sounds. Figure 6 shows the number of interactions with the app to change the volume, which were needed to create the soundscape. To be able to make an informed decision during the soundscape creation process, all users had to listen to each sound at least once, or they were excluded otherwise. So, the minimum number of volume changes is 8. For most users, the number of interactions was between 8 and 50. But for some very active users, up to 112 volume changes were registered. This shows that finding a balance in the volumes of the different sounds in order to get a pleasant soundscape can be a rather complex and time consuming task. In this experiment, the number of available sounds was limited to eight, but increasing the number of sounds will further increase the complexity of the soundscape creation process. On the other hand, the high number of interactions also indicates that users took their time to create a soundscape, because they considered it interesting, or they enjoyed the configuration. Regarding RQ2, we can add to the answer that the soundscape creation phase took most of the time, because of the configuration of the volume levels.
Fig. 6.
Histogram of the number of changes of the volume levels made by the user during the experiment. This is measured by the number of interactions with the volume panel of the app.
4.2.Soundscape creation analysis
In this section, we analyze how users have composed their soundscape. Table 2 shows the correlation between the usage of different sounds when users created their preferred soundscape. Values with one asterix indicate a significant correlation at the level of 0.05, while two asterices denote a significant correlation at the level of 0.01. The table shows some striking positive correlations, such as between the “Raindrops” and “Waterfall” sounds (0.629) as well as between the “Bee” and “Leaves” sounds (0.595). One might argue that sounds like Raindrops and Waterfall are similar and therefore often combined by users.
In contrast, some sounds are rarely combined and have a correlation around zero, such as “Gulls” and “Songbirds” (0.088), “Sparrow” and “Leaves” (0.005), as well as “Leaves” and “Songbirds” (0.022). A possible reason is that the bird sounds are very noticeable and might dominate the soundscape, and are therefore not combined with other dominating sounds. Regarding RQ1, we can state that a good combination of sounds is important in the configuration of the soundscape.
Table 2
Correlation between the usage of different sounds when creating a soundscape.
| Bee | Gulls | Sparrow | Raindrops | Leaves | Songbirds | Waterfall | Waterstream | |
| Bee | 1 | 0.489∗∗ | 0.143 | 0.441∗∗ | 0.595∗∗ | 0.186∗ | 0.562∗∗ | 0.451∗∗ |
| Gulls | 0.489∗∗ | 1 | 0.177∗ | 0.340∗∗ | 0.458∗∗ | 0.088 | 0.492∗∗ | 0.325∗∗ |
| Sparrow | 0.143 | 0.177∗ | 1 | 0.311∗∗ | 0.005 | 0.371∗∗ | 0.238∗∗ | 0.396∗∗ |
| Raindrops | 0.441∗∗ | 0.340∗∗ | 0.311∗∗ | 1 | 0.569∗∗ | 0.110 | 0.629∗∗ | 0.461∗∗ |
| Leaves | 0.595∗∗ | 0.458∗∗ | 0.005 | 0.569∗∗ | 1 | 0.022 | 0.588∗∗ | 0.394∗∗ |
| Songbirds | 0.186∗ | 0.088 | 0.371∗∗ | 0.110 | 0.022 | 1 | 0.220∗∗ | 0.268∗∗ |
| Waterfall | 0.562∗∗ | 0.492∗∗ | 0.238∗∗ | 0.629∗∗ | 0.588∗∗ | 0.220∗∗ | 1 | 0.497∗∗ |
| Waterstream | 0.451∗∗ | 0.325∗∗ | 0.396∗∗ | 0.461∗∗ | 0.394∗∗ | 0.268∗∗ | 0.497∗∗ | 1 |
4.3.Subjective evaluation of the sound environment
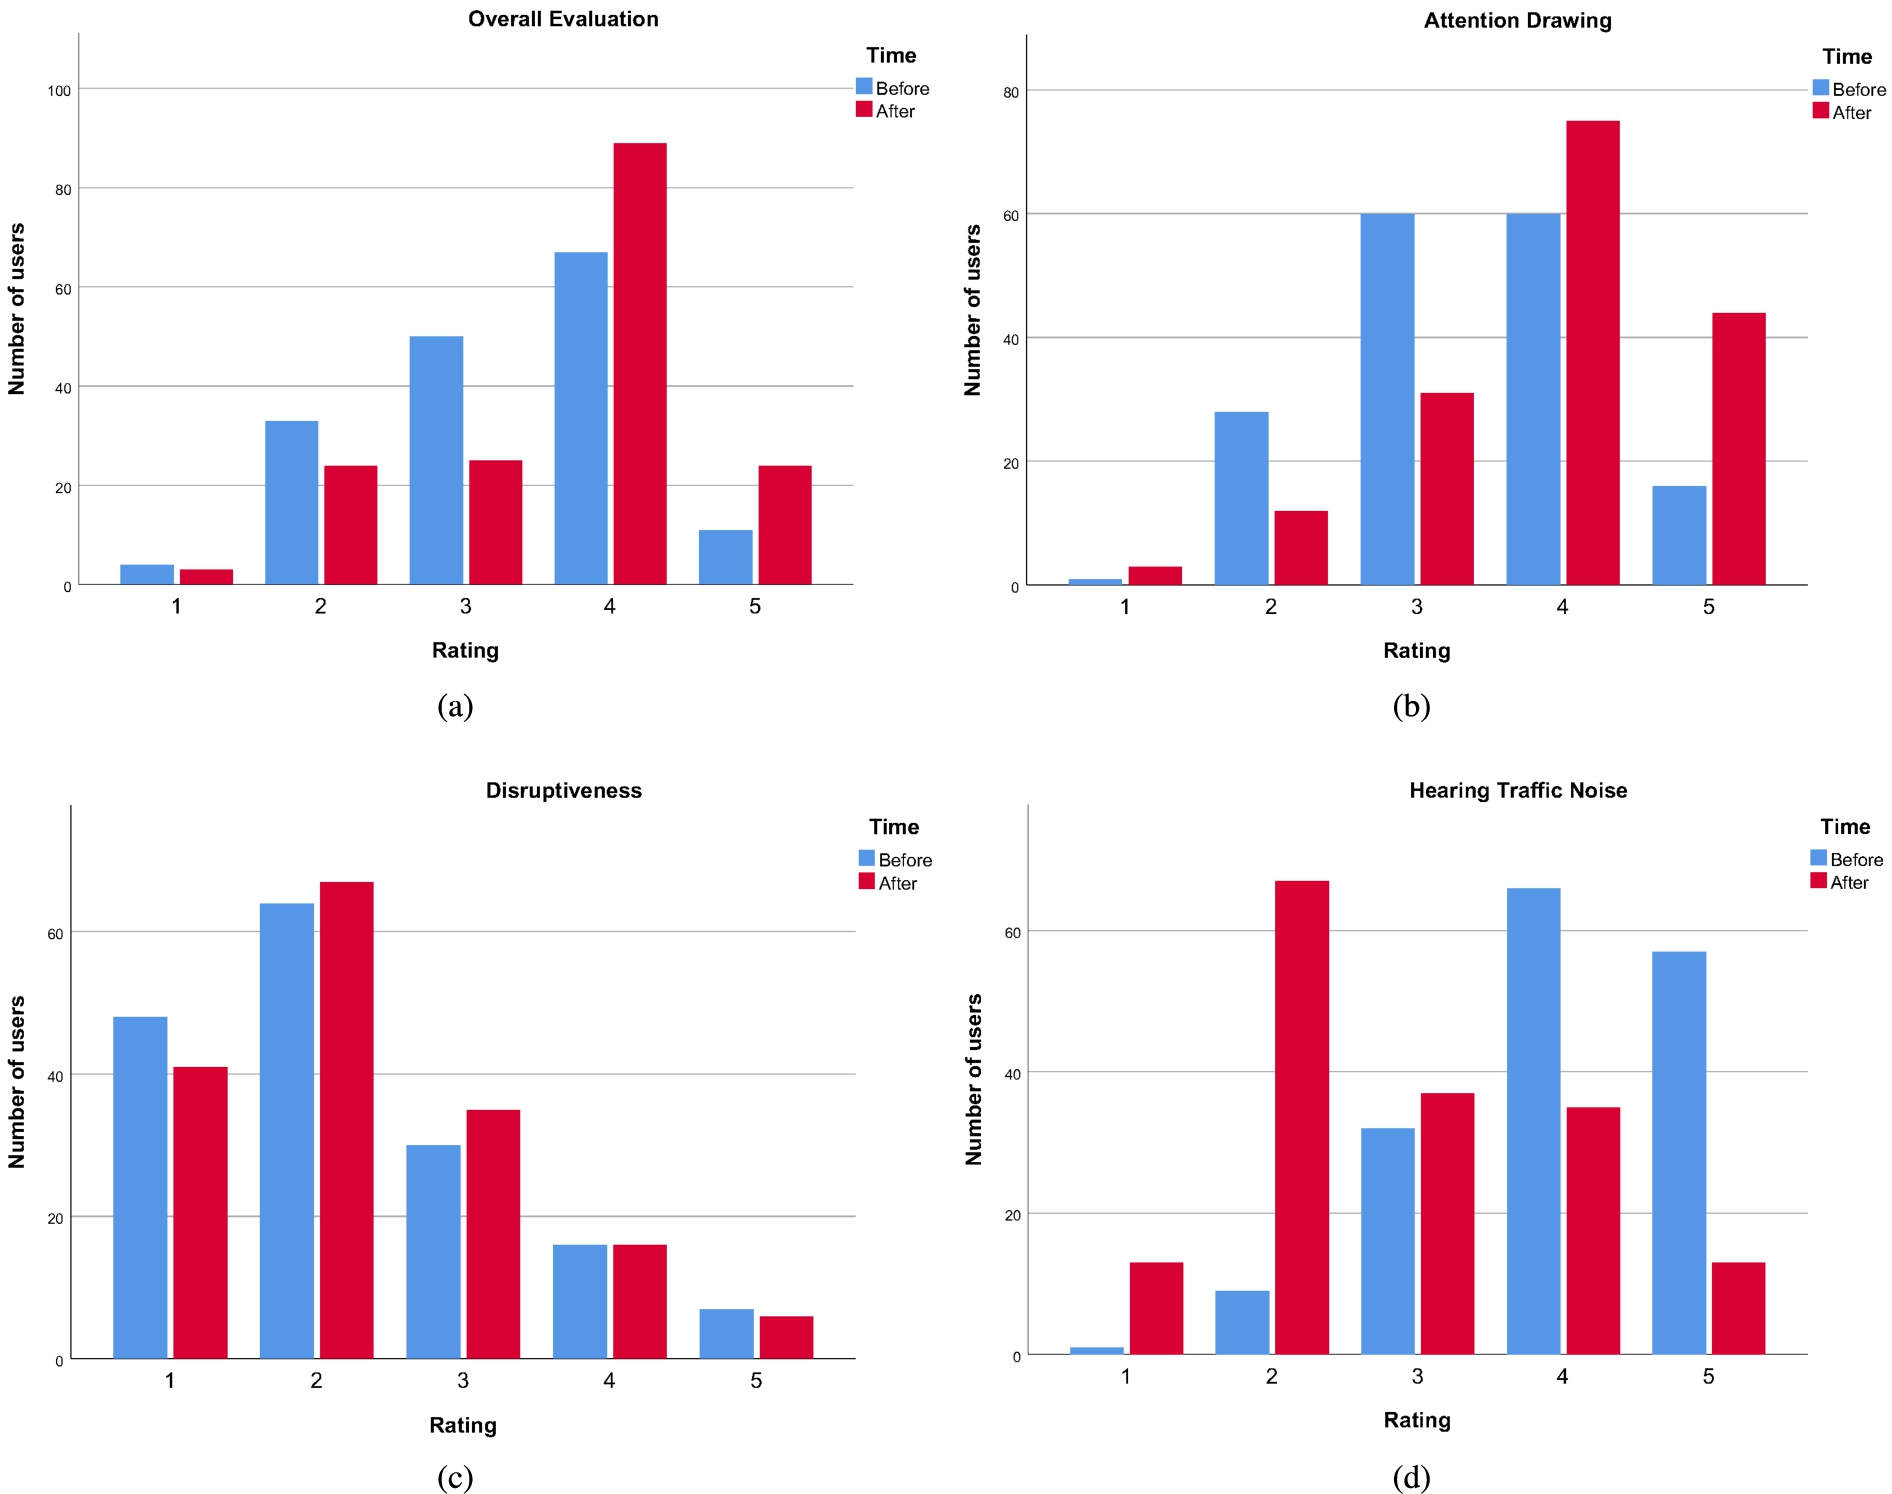
Figure 7 shows the histograms of the answers of the users on sound questions SQ1, SQ2, SQ3, and SQ4a for the situation “with” and “without” the soundscape. So, the sound environment was evaluated by the users in two situations to investigate the influence of the augmented soundscape. “Before” represents the sound environment as it is, without any sounds created by the setup of the experiment, so only environmental sounds (traffic, other persons, natural sounds, etc.) are audible. “After” represents the sound environment in which an augmented soundscape is added (i.e. the soundscape is played in the park close to the user).
Figure 7(a) shows the users’ overall appreciation of the sound environment (SQ1). More users gave a rating of 4 or 5 in case the soundscape is playing. The number of low ratings (1, 2 or 3) is reduced with the soundscape.
Figure 7(b) shows how much the sound drew the attention of the user (SQ2). A soundscape playing in the park is clearly an attention grabber. Users witnessed the different sounds of the soundscape.
Figure 7(c) indicates how disruptive the sound environment is, and to what extent it prevented the users from doing activities they usually do in the park (SQ3). For this questions, there is no clear difference between the situation “Before” and “After”. In other words, the soundscape has no significant influence on the disruptiveness, according to the users.
Figure 7(d) shows to what extent the users heard traffic noise in the park (SQ4a). A significant difference between the situation “Before” and “After” can be witnessed. In the “Before” situation, the majority of the users said that they hear traffic noise a lot (rating 4) or that it dominates completely (rating 5). In contrast in the “After” situation, the majority of the users said that they hear traffic noise a little (rating 2). As traffic noise is generally considered as annoying and disturbing for an environment such as a park, the soundscape does a good job in masking these kind of traffic sounds, as discussed in previous research [44]. This answers RQ3: “How is the sound environment experienced by the user without and with an augmented soundscape?”.
Fig. 7.
Histograms of the subjective evaluations of the users: (a) overall evaluation of the sound environment, (b) attention drawing of the sound environment, (c) disruptiveness of the sound environment, (d) noticeability of traffic noise.
To investigate this in more detail, the answers to the questions were studied per user. Therefore, we define “Delta appreciation” as the difference in the user’s overall appreciation of the sound environment “after” the addition of the soundscape, and “before”. For this subjective evaluation, we used an existing soundscape, different from the one created by the user. Likewise, “Delta attention” is the difference in attention drawing of the sound environment with (“after”) and without (“before”) the soundscape. “Delta disruption” represents the difference in disruptiveness of the sound environment “after” and “before” the addition of the soundscape.
Table 3 shows the correlation between these subjective measures. The positive correlation (0.317) between “Delta disruption” and “Delta attention” indicates that after the addition of the soundscape to the sound environment, users paid more attention to the sounds, and sounds may disrupt their activities in the park. The negative correlation (
Table 3
Correlation between the subjective measures.
| Delta appreciation | Delta attention | Delta disruption | |
| Delta appreciation | 1 | −0.226∗∗ | −0.559∗∗ |
| Delta attention | −0.226∗∗ | 1 | 0.317∗∗ |
| Delta disruption | −0.559∗∗ | 0.317∗∗ | 1 |
4.4.Qualitative feedback on the app
During the experiment, the recruiter documented the noteworthy reactions of the participants as well as their visibly expressed emotions. The participants were not interviewed, but the recruiter noted down everything he overheard. The following are the most interesting findings regarding phase 1: listening to the current sound environment.
Many participants were used to the sounds originating from traffic in the park environment. Many of them were familiar with the park and did not pay that much attention to unnatural sounds. But by asking people to listen to the environment, they became aware of the many unnatural environmental noises in the park. E.g., after listening to the sound environment, one participant stated: “Because of the experiment, I will pay more attention to these sounds during future visits”. Other participants said: “It is striking that there are so many cars” or “At some locations, you can hear more traffic noise than on other locations in the park” or “It depends on whether you are from the city or not”. Also this reaction was obtained: “If you look around, the traffic is less disturbing than if you close your eyes”. One participant stated: “In winter, there is even more traffic noise because the trees reduce the noise less” [43]. To conclude, participants clearly witnessed the traffic sounds in the park; most of them considered this as a disturbing noise.
The participants had the following spontaneous reactions during phase 2: listening to an augmented soundscape in the park. Multiple people were smiling or started laughing at the moment the soundscape started playing. Noteworthy is that groups of two or more people typically laughed more than individual participants with the augmented soundscape. One participant was a little bit confused, because he did not know where the sound was coming from.
Many participants made the comparison between the original sound environment (case before), and the environment with augmented soundscape (case after) and expressed their opinion. But not all participants said that the augmented soundscape was an improvement. One participant stated: “The traffic sounds are really annoying. But masking these sounds with loud natural sounds is not appreciated as well”. A similar reaction was: “Car noise will disturb you if you pay attention; I don’t know if that extra sound works”. Another participant said: “The car sounds are still too loud”.
The augmented soundscape was also described as “unnecessary”. Another participant said that he is used to the traffic sounds in the park, and made the following comment: “I expect these traffic sounds, but not that much natural sounds in the urban park”. The augmented soundscape is also described as “fake”. One participant even calls the loudspeakers “a perverse invasion of the natural landscape”. Another participant stated that “the noisy sound environment is part of the city environment”, and that he is “not convinced of the added value of augmented soundscapes”. In addition, for multiple participants the augmented soundscape was experienced as unexpected or too loud.
But most participants had the opposite reaction. One participant stated: “I would love a continuous playback of the soundscape with birds, since the real birds are not audible in the park.” According to another participant, “listening to the augmented soundscape is chill”. Another participant stated that “it helps to keep your attention away from traffic sounds”. And some general positive reactions are received: “This is cool, I think many others will also like it.”
Most interaction between the participants and the system was in phase 3: creating your own soundscape. Many people said aloud that they really like the possibility to control the soundscape playback. The soundscape creation process is often commented on as “cool”, “fun”, “really nice”, or “interesting”. One participant described the experiment as “a very enriching experience, I did not expect it to have such an impact on me”. One person argued that the configuration of the soundscape using a smartphone was “interfering with the park experience”. According to him: “a more passive approach would be better”.
Regarding the sound types, the following remarks were obtained. Some participants commented that they would prefer “a rather quite soundscape, limited to some birds and water sounds”. The bird sounds are described as “fun”, “nice”, or “pleasant” by some participants. But one participant was wondering if “these artificial bird sounds are not disturbing the real birds”. In contrast, some participants stated that the bee sounds are “a horrible sound” or that the sea gulls are “terrifying”. Also the water sounds were “not suitable for the park”, according to a participant. One participant would like to have a sound for thunder in the configuration panel as well. During the soundscape configuration, another participant’s opinion was that: “the ideal soundscape depends on the purpose of your park visit”. These spontaneous reactions give an answer to RQ4: “How do users think about the app for creating a soundscape?”.
4.5.Objective evaluation of the app usage
Table 4 lists the correlations between the objective measures, i.e. values that are measured during the experiment without the user being aware of this. The “Total duration” represents the total time that a user needed to complete the experiment and performing the different tasks: listening to the background sound, fill in the survey about background sounds, listening to an existing soundscape, fill in the survey to evaluate that soundscape, configuring their own soundscape, and fill in the survey about their enjoyment with the app. The average “Total duration” is 399 seconds with a standard deviation of 106 seconds. The time that the user needed to create a soundscape is called “Time soundscape creation” with an average of 109 seconds and a standard deviation of 55 seconds. The number of interactions with the soundpanel that the user needed to create the preferred soundscape is indicated as “Number of volume interactions” and has an average of 32 and a standard deviation of 18. “Total duration” and “Time soundscape creation” are strongly positively correlated with “The number of volume interactions” at the significance level of 0.01. This answers the first part of RQ5: “How are objective measures, such as the number of interactions and the time spent with the app, correlated with each other”.
Table 4
Correlation between of the objective measures.
| Number of volume interactions | |
| Total duration | |
| Time soundscape creation |
4.6.Correlating subjective and objective measures
In this section, we analyze how the objective measures correlate with the subjective evaluations of the user. In other words, we investigate to what extend the users’ actions are reflected in their subjective experiences with the app.
To analyze the subjective evaluations, the “Average enjoyment” score was calculated as the average of the subjective evaluations for the enjoyment questions:
In addition, the following objective measures were investigated. “Volume sum” is defined as the sum of the volumes for the different sounds as configured by the user. The mean value of the “Volume sum” is 1.7 and the standard deviation is 1.05.
Table 5 lists the correlations between the objective measures (Volume sum, Total duration, and Number of volume interations), the difference in appreciation level (“Delta appreciation”) and the subjective measure of enjoyment (“Average enjoyment”). The positive correlations indicate that users who enjoyed the soundscape creation process typically chose for a higher volume (“Volume sum”), spent more time on the app for the creation of the soundscape (“Total duration”), and interacted more with the configuration panel (“Number of volume interactions”). Next, Table 5 shows also the correlation between user enjoyment (“Average enjoyment”), and the user’s subjective evaluation of the changes in the sound environment (“Delta appreciation”). The positive correlation indicates that users who believed that the soundscape is an improvement for the environment, mostly enjoyed the process of creating the soundscape.
Table 5
Correlation between the objective measures, the difference in appreciation level, and the average enjoyment.
| Average enjoyment | |
| Volume sum | 0.206∗∗ |
| Total duration | 0.247∗∗ |
| Number of volume interactions | 0.195∗ |
| Delta appreciation | 0.161∗ |
In addition, some other significant correlations between subjective and objective measures were obtained and visualized in Table 6). A significant positive correlation was measured between the users’ assessment of the disruptiveness of the sound environment (SQ3 without soundscape), and the “Volume sum”. So, if users experienced the environment sounds as disruptive, they typically chose for a higher volume of the soundscape they created. Users might try to mask the disruptive sounds with the creation of a louder soundscape. The positive correlation between “Delta appreciation” and “Volume sum” indicates that for louder soundscapes a higher appreciation rating is obtained.
Table 6
Correlation between the chosen volume and the subjective evaluations.
| Volume sum | |
| Disruptiveness before | |
| Delta appreciation |
Also the number of sounds selected for the creation of the soundscape is correlated with some of the subjective evaluations of the experiment. On average, users selected 5.3 sounds for their soundscape (median value of 5), and the standard deviation is 2.1. Table 7 shows a significant positive correlation between the “Number of selected sounds” and “Delta appreciation”. This can be interpreted as follows. Users believed that the sound environment improves if they added more artificial sounds to their created soundscape. A negative correlation is obtained between the “Number of selected sounds” for the soundscape and “Delta disrupt”. So, if the soundscape contains more different sounds, it may disrupt the user from normal activities in the park.
Table 7
Correlation between the number of selected sounds and the subjective evaluations.
| Number of selected sounds | |
| Delta appreciation | 0.166∗ |
| Delta disrupt | −0.161∗ |
Although one might expect a correlation, the following measures were not significantly correlated. We witnessed no significant correlation between the average enjoyment and the number of selected sounds. So, users who enjoyed the experiment did not select more sounds for creating their soundscape than users who disliked it.
Also no significant correlation was measured between the users’ overall appreciation for the sound environment with soundscape (SQ1 with soundscape) and the time they spent on listening to that soundscape. This might be due to the experimental setup in which users were instructed to performed the different tasks sequentially. This might have influenced them to stop the listening process to proceed to the next evaluation phase.
This answers the second part of RQ5: “How are objective measures, such as the volume, the number of interactions and the time spent with the app, correlated with the subjective experience of the user?”. This is import in view of differences in behavior of users that like the app and users that do not like the app.
4.7.Influence of user demographics
In this section, the correlation of user demographics (gender and age) with the usage of the app and the creation of soundscapes is investigated. In literature, analysis of users’ demographical factors, such as age, has shown to have significant effects on the soundscape experience [30]. As a result, these demographical factors might have an influence on the soundscape creation process.
Table 8 shows the mean values of the objective measures for the male and female participants of the study. The results show that, on average, the men set the volume higher, spent more time on the app, and interacted more with the volume panel than the women. Although these three objective measurements all indicate a higher value for men, the differences are not statistically significant. In contrast to these objective measures, the subjective evaluation showed that according to the women the impact of the soundscape is bigger (+0.44 on a scale from 1 to 5) than according to the men (+0.27 on a scale from 1 to 5).
Table 8
Comparison of the app usage between male and female test subjects
| Male | Female | |
| # Test subjects | 78 | 87 |
| Avg. volume sum | 1.794 | 1.560 |
| Avg. total duration | 412 s | 388 s |
| Avg. number of volume interactions | 34 | 31 |
| Avg. delta appreciation | 0.27 | 0.44 |
Table 9
Correlation between user’s age and objective measures.
| Age | |
| Appreciation before (SQ1 without soundscape) | −0.202∗∗ |
| Delta appreciation (SQ1 with/without soundscape) | 0.170∗ |
| Volume sum | 0.178∗ |
| Time soundscape creation | 0.232∗∗ |
| Time environment survey | 0.291∗∗ |
| Time soundscape survey | 0.170∗ |
| Time enjoyment survey | 0.304∗∗ |
| Total duration | 0.292∗∗ |
| Number of volume int. | 0.068 |
Table 9 shows the correlation between the test users’ age and the objective measures of users’ usage of the app. The table shows that older people typically assigned a lower appreciation value to the sound environment without soundscape (SQ1 without Soundscape) than younger people. A possible explanation is that older people might be more annoyed by the traffic noise of the adjacent streets of the park than younger people. This is consistent with the correlation between the age and the difference in appreciation value between the sound environment with and without scoundscape (“Delta appreciation”). So, older people appreciated the addition of an augmented soundscape to the environment more than younger people. In addition, a positive correlation between the user’s age and the total volume of the created soundscape (“Volume sum”) is obtained. This might be related to the correlation between age and appreciation of the sound environment without soundscape. If users do not like the existing sound environment, they might want to mask the background sounds with a higher volume of the soundscape.
Moreover, a significant positive correlation is noticed between the user’s age and the time spent on performing the following tasks of experiment: the creation of the soundscape, and fill in the three surveys (about the sound environment, about the soundscape, and about the user’s enjoyment with the app). Whereas older people need more time to create the soundscape, they do not interact significantly more with the volume panel (“Number of volume interactions”). So they spent more time in the app to perform the same number of interactions with the soundscape creation panel.
In conclusion, older people needed more time (“Total duration”) to perform the experiment than younger people. This might be explained by young people’s familiarity with mobile devices, such as the smartphones that were used for this experiment. This answers RQ6: “Are user demographics (gender and age) correlated with the user’s behavior and appreciation for the app?”.
4.8.Time spent on creating a soundscape
An important aspect for the creation of soundscapes by users is the time they have to spend on the configuration of the soundscape. This can be considered as a trade-off between offering users more configuration options (e.g., more different sounds, more volume levels), and keeping the configuration easy and simple. More configuration options will give users more freedom and allow more potential soundscapes, but will also make the decision making process harder and will require more time for finding the soundscape that the user prefers. To study this trade-off, we investigated the influence of the number of interactions with the configuration panel of the app, on the time required for creating a soundscape. In our app, the configuration panel allows to change the volume of each of the eight sounds. For each sound, eleven different volumes settings are possible. The lowest volume level, 0.0, means turning off the sound. So, ten different audibly volume levels were available for the users, ranging from 0.1 to 1.0.
Fig. 8.
Scatter plot with fit line of soundscape creation time by number of volume changes.
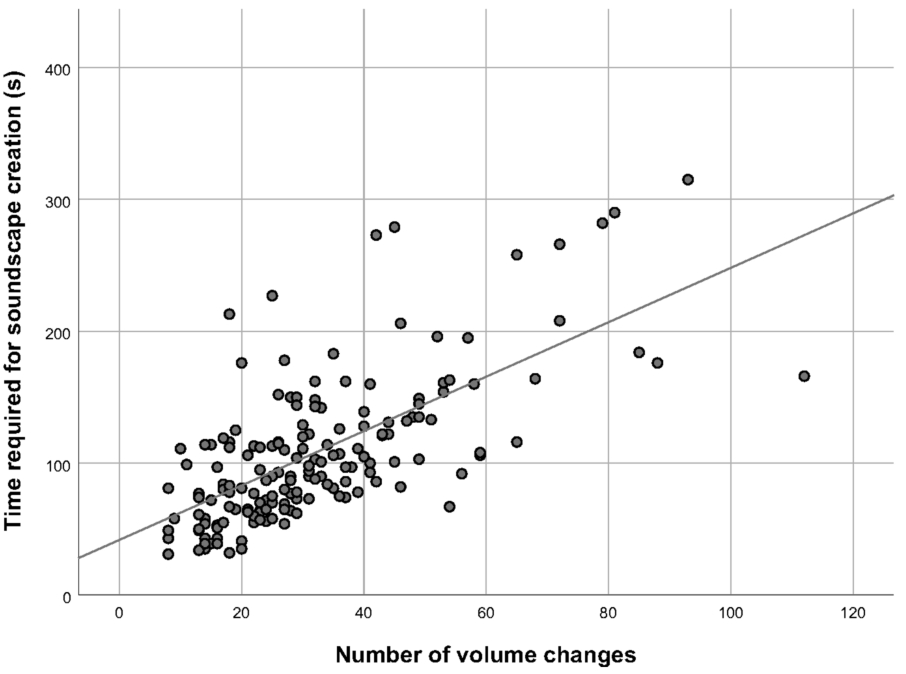
Figure 8 shows a scatter plot with fit line of the soundscape (SC) creation time by the number of volume changes (Number of volume int.). A regression model can be created to express the time required for creating a soundscape in terms of the number of interactions to change the volume of one of the sounds (Equation (1)).
This model is based on the eight available sounds and ten different (non-mute) volume levels in our experiment. It can be used to estimate the additional time that is required for the soundscape creation if more sounds and volume options are available.
5.Discussion
In this section, we discuss our findings about the experiment and the reactions of the participants.
In a public space, such as an urban park environment, an augmented soundscape is offered to the user as a shared experience. Although most participant did the experiment alone, we witnessed a different behavior in case the participants did the test in groups of two or more people. In group people expressed their appreciation or frustration more than alone. Since all group member are exposed to the same soundscape, sometimes a compromise has to be found. People did not always agree on the selection of the sounds for creating the soundscape. One solution would be to use (noise canceling) headphones in order to personalize the soundscape for every park visitor. There definitely exist scenarios in which a shared sound environment is not ideal. People visit the park with different intentions (e.g. to relax, to get inspired, or even to work). For these different intentions, different soundscapes are appropriate. Headphones can also be used by park visitors to isolate themselves from the soundscape [1]. The use of headphones and automatic personalization of the soundscapes is an interesting path for future research.
With respect to the sounds that were chosen, we can conclude that users prefer nature sounds that are matching the real physical environment. The sounds should complement the sounds in the physical environment. Sounds that one might expect in the park are often selected to be part of the augmented soundscape. Examples are songbirds, a sparrow, but also a water stream. Sounds that people do not expect, are less suitable according to the participants. The sound of seagulls for example was assessed as annoying and not matching the urban park environment. Also the complementarity of sounds is important in the composition of a soundscape. Two sounds that are very emphatically present or conspicuous are often not suitable to combine in one soundscape. Other more neutral sounds, such as a waterstream, are a good fit for a range of other sounds.
The urban park suffers from sound pollution because of nearby traffic of bars, buses and trams and a public parking spot. Multiple participants described these sounds as annoying. Most participant consider the augmented soundscape that masks the traffic sounds as an improvement of the park experience. However some participants also stated that they would prefer silence in order to relax.
Indeed, different visiting intentions may require different soundscapes. A soundscape that helps to relax on your own might be completely different than a soundscape that has the purpose to inspire people visiting the park in group. Taking into account the purpose of the visitor and the role of the (shared) social context is an interesting track for future research.
6.Conclusion
In this paper, we investigated the impact of augmented soundscapes in an urban park environment immersed in road traffic noise. The study showed that most park visitors appreciated the augmented soundscape, especially bird sounds. Besides listening to the augmented soundscape, park visitors could also configure the soundscape with a mobile app, which was experienced as a very interesting and fun aspects by many participants. Significant positive correlations between the users’ enjoyment and their interactions with the app were discovered. The volume selected by the users showed to be correlated with some of their subjective evaluations of the sound environment without augmented soundscape. If users experience the environment sounds (such as traffic) as disruptive, they typically increase the volume of the augmented soundscape. Overall, subjective evaluations of the sound environment showed that the augmented soundscape improved the overall sound quality and successfully masked the traffic sounds.
Conflict of interest
The authors have no conflict of interest to report.
References
[1] | V. Acun and S. Yilmazer, A grounded theory approach to investigate the perceived soundscape of open-plan offices, Applied Acoustics 131: ((2018) ), 28–37. doi:10.1016/j.apacoust.2017.09.018. |
[2] | V. Aggarwal, E. Halepovic, J. Pang, S. Venkataraman and H. Yan, Prometheus: Toward quality-of-experience estimation for mobile apps from passive network measurements, in: Proceedings of the 15th Workshop on Mobile Computing Systems and Applications, HotMobile ’14, ACM, New York, NY, USA, (2014) , pp. 18:1–18:6. ISBN 978-1-4503-2742-8. doi:10.1145/2565585.2565600. |
[3] | J. Alves Lino, B. Salem and M. Rauterberg, Responsive environments: User experiences for ambient intelligence, Journal of Ambient Intelligence and Smart Environments 2: (4) ((2010) ), 347–367. doi:10.3233/AIS-2010-0080. |
[4] | M. Annerstedt, P. Jönsson, M. Wallergård, G. Johansson, B. Karlson, P. Grahn, Å.M. Hansen and P. Währborg, Inducing physiological stress recovery with sounds of nature in a virtual reality forest—Results from a pilot study, Physiology & Behavior 118: ((2013) ), 240–250. doi:10.1016/j.physbeh.2013.05.023. |
[5] | L. Barclay, Augmenting urban space with environmental soundscapes and mobile technologies, Soundscape. Sounds Emergent: Diverse Ecologies Part II 16: ((2017) ), 20–34. |
[6] | A. Basu, J. Duvall and R. Kaplan, Attention restoration theory: Exploring the role of soft fascination and mental bandwidth, Environment and Behavior 51: (9–10) ((2019) ), 1055–1081. doi:10.1177/0013916518774400. |
[7] | G.N. Bratman, C.B. Anderson, M.G. Berman, B. Cochran, S. De Vries, J. Flanders, C. Folke, H. Frumkin, J.J. Gross, T. Hartig et al., Nature and mental health: An ecosystem service perspective, Science Advances 5: (7) ((2019) ), eaax0903. doi:10.1126/sciadv.aax0903. |
[8] | P. Brooks and B. Hestnes, User measures of quality of experience: Why being objective and quantitative is important, IEEE Network 24: (2) ((2010) ), 8–13. doi:10.1109/MNET.2010.5430138. |
[9] | A. Brown and A. Muhar, An approach to the acoustic design of outdoor space, Journal of Environmental Planning and Management 47: (6) ((2004) ), 827–842. doi:10.1080/0964056042000284857. |
[10] | M.H. Browning, K.J. Mimnaugh, C.J. van Riper, H.K. Laurent and S.M. LaValle, Can simulated nature support mental health? Comparing short, single-doses of 360-degree nature videos in virtual reality with the outdoors, Frontiers in Psychology 10: ((2020) ), 2667. doi:10.3389/fpsyg.2019.02667. |
[11] | A. Chung and W. To, e-Appraisal of soundscape for public squares in China, The Journal of the Acoustical Society of America 142: (4) ((2017) ), 2672. doi:10.1121/1.5014736. |
[12] | K. De Moor, I. Ketykó, W. Joseph, T. Deryckere, L. De Marez, L. Martens and G. Verleye, Proposed framework for evaluating quality of experience in a mobile, testbed-oriented living lab setting, Mobile Networks and Applications 15: ((2010) ), 378–391. doi:10.1007/s11036-010-0223-0. |
[13] | S. Dooms, T. De Pessemier and L. Martens, An online evaluation of explicit feedback mechanisms for recommender systems, in: 7th International Conference on Web Information Systems and Technologies (WEBIST-2011), Department of Information Technology, Ghent University, (2011) , pp. 391–394. |
[14] | S. Dooms, T. De Pessemier and L. Martens, Improving IMDb movie recommendations with interactive settings and filters, in: 8th ACM Conference on Recommender Systems (Poster-RecSys 2014), Vol. 1247: , (2014) . |
[15] | J.M. Downing and E. Stusnick, Measurement of the natural soundscape in national parks, The Journal of the Acoustical Society of America 108: (5) ((2000) ), 2497. doi:10.1121/1.4743220. |
[16] | A. Følstad, Living labs for innovation and development of information and communication technology: A literature review, Electronic Journal of Organizational Virtualness 10: ((2008) ), 99–131. |
[17] | M. Gams, I.Y.-H. Gu, A. Härmä, A. Muñoz and V. Tam, Artificial intelligence and ambient intelligence, Journal of Ambient Intelligence and Smart Environments 11: (1) ((2019) ), 71–86. doi:10.3233/AIS-180508. |
[18] | V. Gent, City of Ghent, Koning Albertpark, Zuidpark., 2020, https://visit.gent.be/en/see-do/koning-albertpark-zuidpark. |
[19] | C. Gomez, S. Chessa, A. Fleury, G. Roussos and D. Preuveneers, Internet of Things for enabling smart environments: A technology-centric perspective, Journal of Ambient Intelligence and Smart Environments 11: (1) ((2019) ), 23–43. doi:10.3233/AIS-180509. |
[20] | Google, Firebase, 2020, https://firebase.google.com/. |
[21] | S. Goswami, Soundscape of Bhadrak Town, India: An analysis from road traffic noise perspective, Asian Journal of Water, Environment and Pollution 8: (4) ((2011) ), 85–91. |
[22] | D.J. Gramann et al., The effect of mechanical noise and natural sound on visitor experiences in units of the national park system, US Government Documents (Utah Regional Depository) (1999), 428. |
[23] | J.Y. Hong and J.Y. Jeon, Designing sound and visual components for enhancement of urban soundscapes, The Journal of the Acoustical Society of America 134: (3) ((2013) ), 2026–2036. doi:10.1121/1.4817924. |
[24] | J. Janer, G. Roma and S. Kersten, Authoring augmented soundscapes with user-contributed content, in: ISMAR Workshop on Authoring Solutions for Augmented Reality, (2011) . |
[25] | J. Kang, From understanding to designing soundscapes, Frontiers of Architecture and Civil Engineering in China 4: (4) ((2010) ), 403–417. doi:10.1007/s11709-010-0091-5. |
[26] | R. Kaplan and S. Kaplan, The Experience of Nature: A Psychological Perspective, Cambridge Uuniversity Press, (1989) . |
[27] | L. Lavia, M. Dixon, H.J. Witchel and M. Goldsmith, Applied soundscape practices, Behaviour 10: (1) ((2013) ), 7. |
[28] | P. Le Callet, S. Möller and A. Perkis (eds), Qualinet white paper on definitions of quality of experience, Technical report, European Network on Quality of Experience in Multimedia Systems and Services (COST Action IC 1003), Lausanne, Switzerland, 2012, Version 1.1. |
[29] | J. Liu, J. Kang, H. Behm and T. Luo, Effects of landscape on soundscape perception: Soundwalks in city parks, Landscape and Urban Planning 123: ((2014) ), 30–40. doi:10.1016/j.landurbplan.2013.12.003. |
[30] | J. Liu, J. Kang, T. Luo and H. Behm, Landscape effects on soundscape experience in city parks, Science of the Total Environment 454: ((2013) ), 474–481. doi:10.1016/j.scitotenv.2013.03.038. |
[31] | L. Martin, M.P. White, A. Hunt, M. Richardson, S. Pahl and J. Burt, Nature contact, nature connectedness and associations with health, wellbeing and pro-environmental behaviours, Journal of Environmental Psychology 68: ((2020) ), 101389. doi:10.1016/j.jenvp.2020.101389. |
[32] | M.E. Nilsson and B. Berglund, Soundscape quality in suburban green areas and city parks, Acta Acustica United with Acustica 92: (6) ((2006) ), 903–911. |
[33] | M. Pohling, C. Leichsenring and T. Hermann, Base Cube One: A location-addressable service-oriented smart environment framework, Journal of Ambient Intelligence and Smart Environments 11: (5) ((2019) ), 373–401. doi:10.3233/AIS-190533. |
[34] | J.J. Roe, C.W. Thompson, P.A. Aspinall, M.J. Brewer, E.I. Duff, D. Miller, R. Mitchell and A. Clow, Green space and stress: Evidence from cortisol measures in deprived urban communities, International Journal of Environmental Research and Public Health 10: (9) ((2013) ), 4086–4103. doi:10.3390/ijerph10094086. |
[35] | A. Rosales, S. Sayago, J.P. Carrascal and J. Blat, On the evocative power and play value of a wearable movement-to-sound interaction accessory in the free-play of schoolchildren, Journal of Ambient Intelligence and Smart Environments 6: (3) ((2014) ), 313–330. doi:10.3233/AIS-140260. |
[36] | B. Schulte-Fortkamp, The daily rhythm of the soundscape “Nauener Platz” in Berlin, The Journal of the Acoustical Society of America 127: (3) ((2010) ), 1774. doi:10.1121/1.3383871. |
[37] | J. Schumacher and V.-P. Niitamo (eds), European Living Labs – A New Approach for Human Centric Regional Innovation, Wissenschaftlicher Verlag, Berlin, (2008) . |
[38] | K. Schwarz, M. Fragkias, C.G. Boone, W. Zhou, M. McHale, J.M. Grove, J. O’Neil-Dunne, J.P. McFadden, G.L. Buckley, D. Childers et al., Trees grow on money: Urban tree canopy cover and environmental justice, PloS one 10: (4) ((2015) ), e0122051. doi:10.1371/journal.pone.0122051. |
[39] | R.C. Smardon, Perception and aesthetics of the urban environment: Review of the role of vegetation, Landscape and Urban Planning 15: (1–2) ((1988) ), 85–106. doi:10.1016/0169-2046(88)90018-7. |
[40] | N. Streitz, D. Charitos, M. Kaptein and M. Böhlen, Grand challenges for ambient intelligence and implications for design contexts and smart societies, Journal of Ambient Intelligence and Smart Environments 11: (1) ((2019) ), 87–107. doi:10.3233/AIS-180507. |
[41] | M.S. Tse, C.K. Chau, Y.S. Choy, W.K. Tsui, C.N. Chan and S.K. Tang, Perception of urban park soundscape, The Journal of the Acoustical Society of America 131: (4) ((2012) ), 2762–2771. doi:10.1121/1.3693644. |
[42] | R.S. Ulrich, R.F. Simons, B.D. Losito, E. Fiorito, M.A. Miles and M. Zelson, Stress recovery during exposure to natural and urban environments, Journal of Environmental Psychology 11: (3) ((1991) ), 201–230. doi:10.1016/S0272-4944(05)80184-7. |
[43] | T. Van Renterghem, Towards explaining the positive effect of vegetation on the perception of environmental noise, Urban Forestry & Urban Greening 40: ((2019) ), 133–144. doi:10.1016/j.ufug.2018.03.007. |
[44] | T. Van Renterghem, K. Vanhecke, K. Filipan, K. Sun, T. De Pessemier, B. De Coensel, W. Joseph and D. Botteldooren, Interactive soundscape augmentation by natural sounds in a noise polluted urban park, Landscape and Urban Planning 149: (103705) ((2020) ), 1–13. |


