
An IoT-based smart healthcare system using location-based mesh network and big data analytics
Abstract
Elderly people requiring care the entire day usually depend on the availability of their family members to give assistance. However, the family members might not provide appropriate help especially in an emergent situation. The application of Internet of Things (IoT) technology with a variety of interconnected devices provides the solution. We propose an IoT-based smart healthcare system comprising wearable devices, which integrates a variety of contact sensors with location-based mesh networks (LBMN) such as Wi-Fi and Bluetooth Low Energy (BLE) connections to continuously sense various parameters of aging people. The BLE-connected devices such as wearable sensors, fixed sensors, seat cushions, pedal mats, magnetic reed switches, and mobile devices are all involved in collecting, processing, and transmitting physiological data and their locations to the cloud. Through the utilization of convenient interfaces such as software applications on smartphones and web pages on computers, it provides real time monitoring of the elderly in terms of localization, activity pattern, and health status. Thus the system enables early detection of health risks to the elderly. We used Platform as a service (PaaS) to receive and store the health data generated from the interconnected devices and to perform analysis. The essential feature of this LBMN is to generate a complete 6W(Who, What,When,Where,Why and How)big data for policy, feed it to the PaaS analysis to easily and quickly obtain more accurate data, and then develop possible health strategy or preventive measures. The proposed healthcare system detected that, out of the 20 participants recruited, 2 persons (10%) were often restless. It was also able to detect abnormal daily activity patterns with more tag positioning and the historical data from the devices. More importantly, it can help to prevent potential physical and neuropsychiatric disorders based on the real-time monitoring information and analyzed historical data for the aging people.
1.Introduction
A tremendous increasing aging population have given a big pressure to the global healthcare system [17]. This rapid increase in the elderly population had led to some healthcare-related challenges such as inadequate healthcare workforce and the unavailability for their family members with a job. Therefore, healthcare providers and their families have to think about that how the appropriate care can be given to the elderly. The quality of healthcare for the elderly has always been an important and realistic issue. The elderly usually have multiple comorbidities and need more effort for comprehensive care to maintain their health. In recent years, as information technology has become increasingly advanced with time, the ways of healthcare technology have been changing a lot gradually. Internet of Things (IoT) is a technology with many kinds of applications utilized in different fields including healthcare system. The IoT is a system that using a variety of sensing devices that collect a lot of information and transmit them through a network [3,4,6,10].
IoT technologies can be incorporated into the elderly healthcare system. Thermometers, heartbeat sensors, magnetic reed switches, seat cushion sensors, pedal mat sensors can all be connected to allow caregivers or doctors monitor the health status of elderly patients. Falls are the main cause of injury that results in the need for hospital admissions among aging people. Wearable IoT-based technologies can automatically send an alert in the event of a fall, thus decrease the chance of hospital admissions. Alzheimer’s disease is an increasing health problem all over the world [13,18]. The patients of Alzheimer’s disease often have memory loss that disrupts the daily life. They develop confusion with time or place and might get lost. IoT-connected devices are very helpful in the care of patients who suffer from Alzheimer’s diseases. The monitoring system can trace their locations and send it to the cloud. Then, the data can be viewed from an app on a smartphone or from a web page on a computer. It can allow care providers or their families to locate the patients if they wander away from home, and it is very helpful in cases of emergencies. IoT-based system with wearable devices can continuously monitor and send the health parameters of the elderly to their caregivers via the internet, which can then be viewed on a computer or smartphone. Then the caregivers can take the necessary steps to minimize any possible risk. Real-time monitoring of the patient’s status can prevent the occurrence of adverse events, and future development of various diseases.
There are some methods proposed to solve indoor positioning problems, such as long range (LoRa), Zigbee, Wi-Fi, Bluetooth low energy (BLE), and near field communication (NFC). Compared to the BLE, Wi-Fi cannot achieve communication by broadcasting. Moreover, Wi-Fi has higher cost and higher power consumption than the BLE. In the field of smart healthcare, the previous method of transmitting information from wearable devices used radio frequency identification (RFID) technology [8,19]. The BLE has a longer transmission range, faster transmission speed, and larger message transmission packet than that of the RFID [9]. To solve the problems in the healthcare fields, our research focused on providing services at smart homes and in nursing care centers, by using the data collected from a variety of interconnected sensors to perform a series of verification, processing, classification, storage, statistical analysis, and visualization of the data. We developed, based on IoT, a set of indoor positioning systems with BLE technology, and then connected to the BLE devices via mobile phones. A Bluetooth communication node and various types of sensors can be effectively connected to form a location-based mesh network (LBMN). When integrated with tag computing, edge computing, and cloud computing, wearable devices embedded with inertial motion unit (IMU) sensors can be used to determine the behavior mode of the elderly including sitting, standing, lying down, walking, wandering, and falling. The pieces of information thus obtained assist with the positioning of fixed sensors to monitor the activity pattern and life style of the elderly. It can also trace their location and behavioral pattern through the computer or smartphone.
Big data means that a large amount of data that can be analyzed to show the trends, for example, the behavioral pattern of those who need care. And also the health data collected from wearable devices that can monitor the behavior mode of the elderly online. To maximize the data collected from the interconnected devices, it is crucial to have a platform to receive, store, and analyze these data. In response to this need, Google, Amazon, Microsoft, and IBM have proposed SaaS (Software as a Service), PaaS (Platform as a Service), and IaaS (Infrastructure as a Service) respectively.
In our research, a wearable device name card-type IMU placed in the chest pocket which connects with indoor positioning systems and various interactive devices. It allows accurately determining the behavior mode of the elderly by the sensing information collected from a series of integrated sensors. When the users sit on a Bluetooth pressure sensing seat cushion, whether the sitting posture is normal or poor can be determined. In addition, the pressure sensing pedal mat can record the total duration of some activities of the users such as urination in the front of the urinal and washing hand before the washbasin. A magnetic reed switch installed on a drawer, door or window can record the number of opening by whom. An LBMN with Bluetooth nodes can upload the collected data and send to the cloud. Therefore, the families or doctor are able to monitor statistical behavioral pattern online in real time. The advantage of analysis of the long-term behavioral pattern is that we can know the bad life habits and life styles in advance that increase the risk of developing certain diseases in the future. We use a platform (PaaS) among them and establish a service-oriented cloud computing architecture and provide the users with SaaS. The users can utilize our system services through simple settings.
The defined aim of our system development is fourfold: (1) We can detect the health status from the changes in their daily life habits. Life habits can be detected from their behavioral pattern in daily life. (2) We can accurately determine the behavior mode of the elderly by the sensing information from a series of sensors. (3) In addition, falls are not an uncommon injury for the elderly. With the name card-type IMU placed in the chest pocket, we can effectively detect fall events for the elderly, as well as their behavior mode such standing, sitting, urinating and walking. Coupled with the application of the pressure-sensing seat cushion, if a stress state is sensed, it represents that the user is seated. If the seat cushion changes from a stress state to an unstressed state, it can determine that the user is changing from a sitting position to a standing position. (4) We can also detect the standing balance of the user, which can predict the risk of falling
2.Related work
The diversity of smart healthcare sensors and IoT devices that have influence the way healthcare is given a lot. The combination of cloud and IoT could make smart healthcare system to support real-time application when analyzing a great quantity of data from wearable sensor networks.
Priyadharsan et al. designed a system to monitor the health conditions of the persons using machine learning algorithm. The system collects information of pulse rate, body temperature and blood pressure of the persons to evaluate any abnormalities in the health condition. But the computation is expensive for a great quantity of collected data [7].
Donati et al. proposed a telemedicine hardware and software platform for the healthcare. They aim to remotely monitor vital signs of patients with chronic diseases, especially for cardiovascular disorder [2].
Sayeed et al. developed a system for remote monitoring of the patient based on BLE technology. In the system, they combine the sensors of pulse rate and body temperature to sense the vital sign of patients. The system mainly focus on caring the patients living on the rural area from a distant place [15].
Ruman et al. designed a monitoring system for the patient health by using IoT. This system is able to monitor health parameters form the sensors on the patients. But it lacks the solution to efficiently manage an emergent condition [14].
Athira et al. proposed an IOT based system which collecting four health parameter such as respiratory rate, heart rate and blood oxygen saturation temperature. The system will send an email to patient’s families or their care provider in case of emergency. But the system is lacking of webpage or mobile app to view the physiological data and analyze their trend [1].
Pirbhulal et al. developed an energy efficient algorithm for health data transmission between information collecting source and destination nodes in the healthcare system. They only develop an energy saving algorithm and have no discussing any prototype development [12].
Chen et al. designed an Edge-Cognitive-Computing-based (ECC) healthcare system. The system can monitor and analyze the patient health using cognitive computing. But the research simply discusses the proficiency of the ECC health system, no prototype development was discussed likewise [11].
We develop a prototype of smart healthcare system which can determine the health status, activity recognition, fall event and behavior pattern of the elderly through an indoor positioning method and a variety of wearable and fixed sensors. Physiological information is collected from the interconnected IoT-based devices and transmitted to a cloud database for analysis of the trend of long-term behavior pattern and life habits of the elderly. The care provider or family members can view the health status via webpage of the computer or an app of mobile device. The analyzed information can provide to doctors to avoid developing long-term adverse consequences. In [14], they is lacking of the solution to efficiently manage an emergent condition such as fall event. In [1], the system cannot real-time view the physiological data from webpage or mobile app to and analyze the health trend. In [12] and [11], their proposed healthcare system do not included the development of the prototype.
Our main contributions are as follows: (1) We established the first built-in latitude and longitude data on the Bluetooth fixed tag, fixed node, and router, through the Bluetooth broadcasting to achieve efficient Bluetooth MESH. (2) Each communication node in MESH has built-in absolute latitude and longitude. Therefore the three-point positioning service can be directly provided through broadcasting without requiring extra hard hardware such UWB. (3) The absolute indoor position of the users (including personnel, pets or robots) wearing mobile tags can updated at any time. Therefore, the location-based service can be provided as long as it is integrated with the electronic map on the cloud. For example, if an aging people falls, the absolute position of his fall can be shown on the cloud. Thus the rescue people can directly and quickly arrive at the position of his falling to provide an instantaneous help. (4) A variety of touch sensors (fixed tags) integrated with Bluetooth MESH can increase the positioning accuracy of user and identify behavior mode of the user at the same time. (5) Although UWB can provide accurate positioning, it is impossible to accurately determine the behaviors of such as standing, sitting, opening doors, opening drawers, and opening refrigerators
3.System architecture and methods
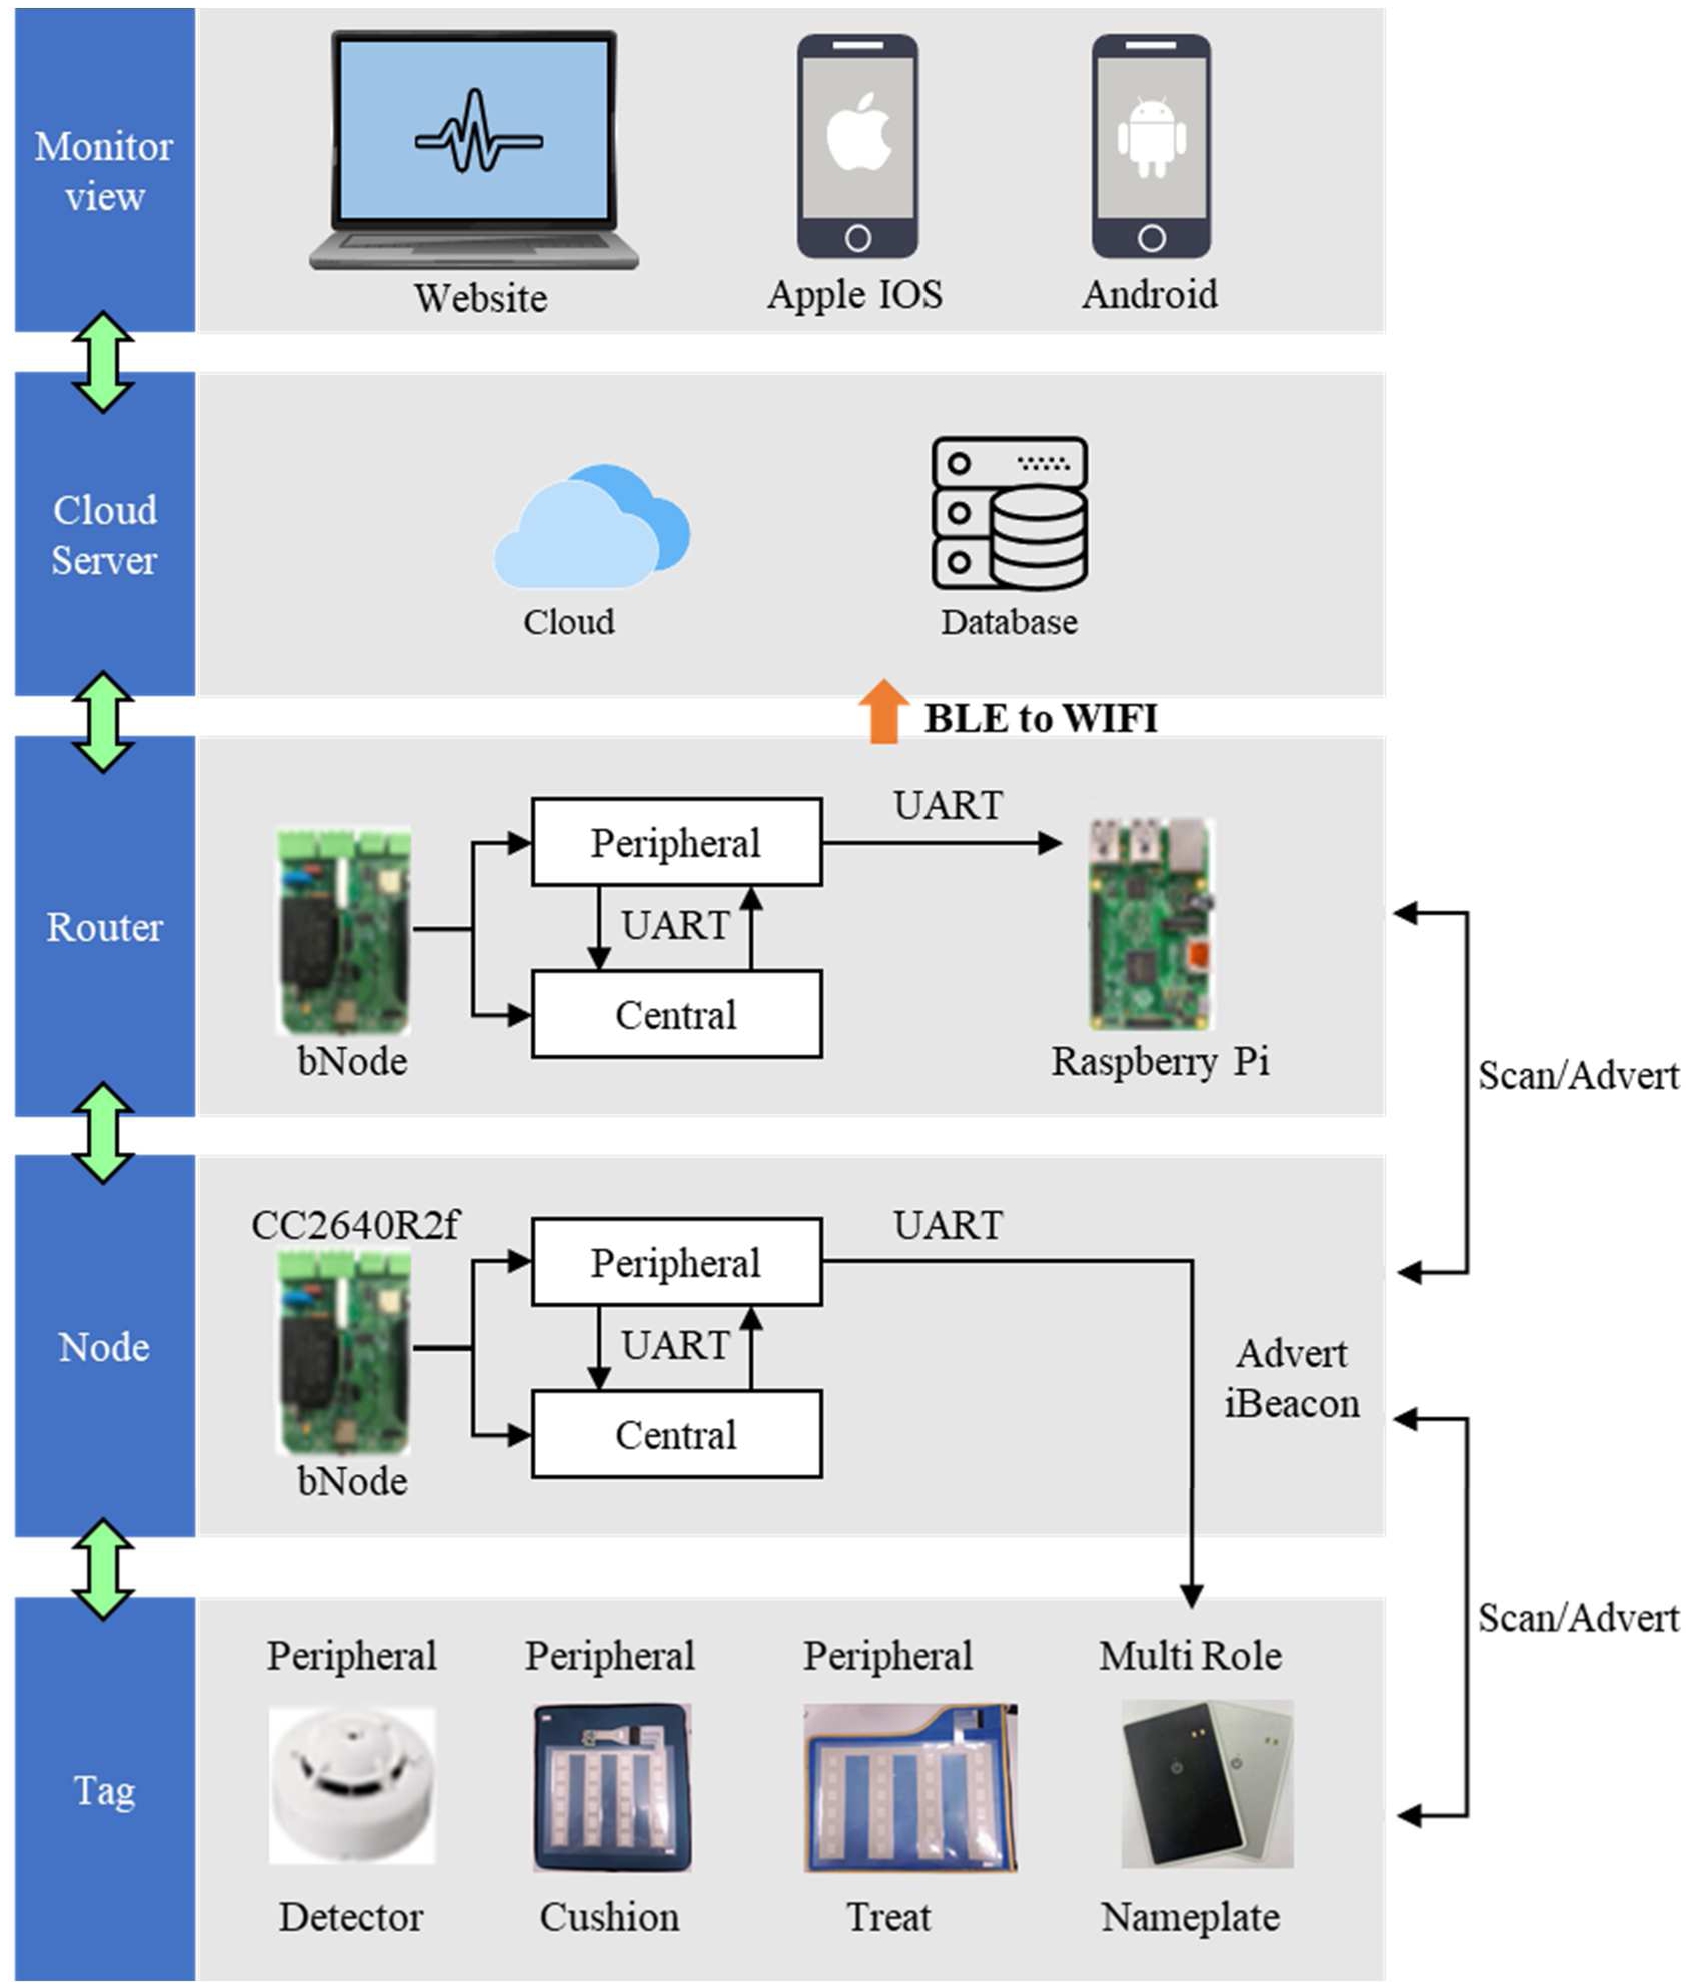
The architecture of the IoT system is shown in Fig. 1, which is mainly composed of four subsystems: the Bluetooth device, the setting terminal, IoT edge computing device, and the cloud server. The Bluetooth devices consist of bNode (Bluetooth Node), bwRouter (Bluetooth-to-Wi-Fi Router), wearable devices, and fixed devices. We designate the Bluetooth light source device BLE Node as bNode, and the bwRouter as a bNode combined with a Wi-Fi module.
Fig. 1.
The architecture of IoT healthcare system.
3.1.Bluetooth location-based mesh network (LBMN)
The Bluetooth LBMN is constructed with many bNodes and at least a bwRouter. The bNode has two Bluetooth modules: central (master) and peripheral (slave). The former will scan the broadcast channel at 20 ms intervals, and only receive our proprietary protocol called PetaCom (patent no. US2015358773(A1)2015-12-10). PetaCom is the location-based network system includes a plurality of communication nodes to transmit a data packet based on the location of each node and a distance between each node and a destination node. The principle has been explained in Fig. 2. For more related instructions, please refer to “Location-based network system and location-based communication method,” US10887817B2, 2021/01/05, EP3152875B1, CN106797343B. With the development of network communication, sensing and electronic technology, a network system usually have multiple terminal devices (i.e. different types of sensors). Multiple transmission nodes have been widely used in a number of fields such as traffic control, environment monitoring, property management, and healthcare. Generally, the terminal devices and the transmission nodes are limited in computing power, transmission capacity, and storage space. Therefore, the packet transmitted in the network or between the networks may be easily lost, and the amount of information carried by the packet is smaller. The aforementioned network architecture is also known as low-power and lossy networks (LLNs). Additionally, a mesh network with routing propagates the data packets along a path by hopping from node to node until the packets reach the destination, thus increasing the deliverability rate of the at a packets. To ensure all path availability, the mesh network allows for continuous connections and reconfigures itself around broken paths by using self-healing algorithm.
A location-based network system include at least a first communication node operating in one of a master mode and a slave mode and comprising at least one communication module and a processor; at least a second communication node operating in one of a master mode and a slave mode and comprising at least one communication module and a processor; wherein the first communication node is configured to: operate in the master mode to monitor the second communication node that operates in the slave mode in order to receive a data packet broadcasted by the second communication node; recognize a destination node of the data packet after receiving the data packet broadcasted by the second communication node that operates in the slave mode; determine whether a first distance between the first communication node and the destination node is shorter than a second distance between the second communication node and the destination node according to the latitude, longitude, and altitude of each of the first communication node, the second communication node and the destination node; switch to the slave node and broadcast the data packet received from the second communication node if the first distance is shorter than the second distance; and switch to the master mode after broadcasting the data packet received from the second communication node.
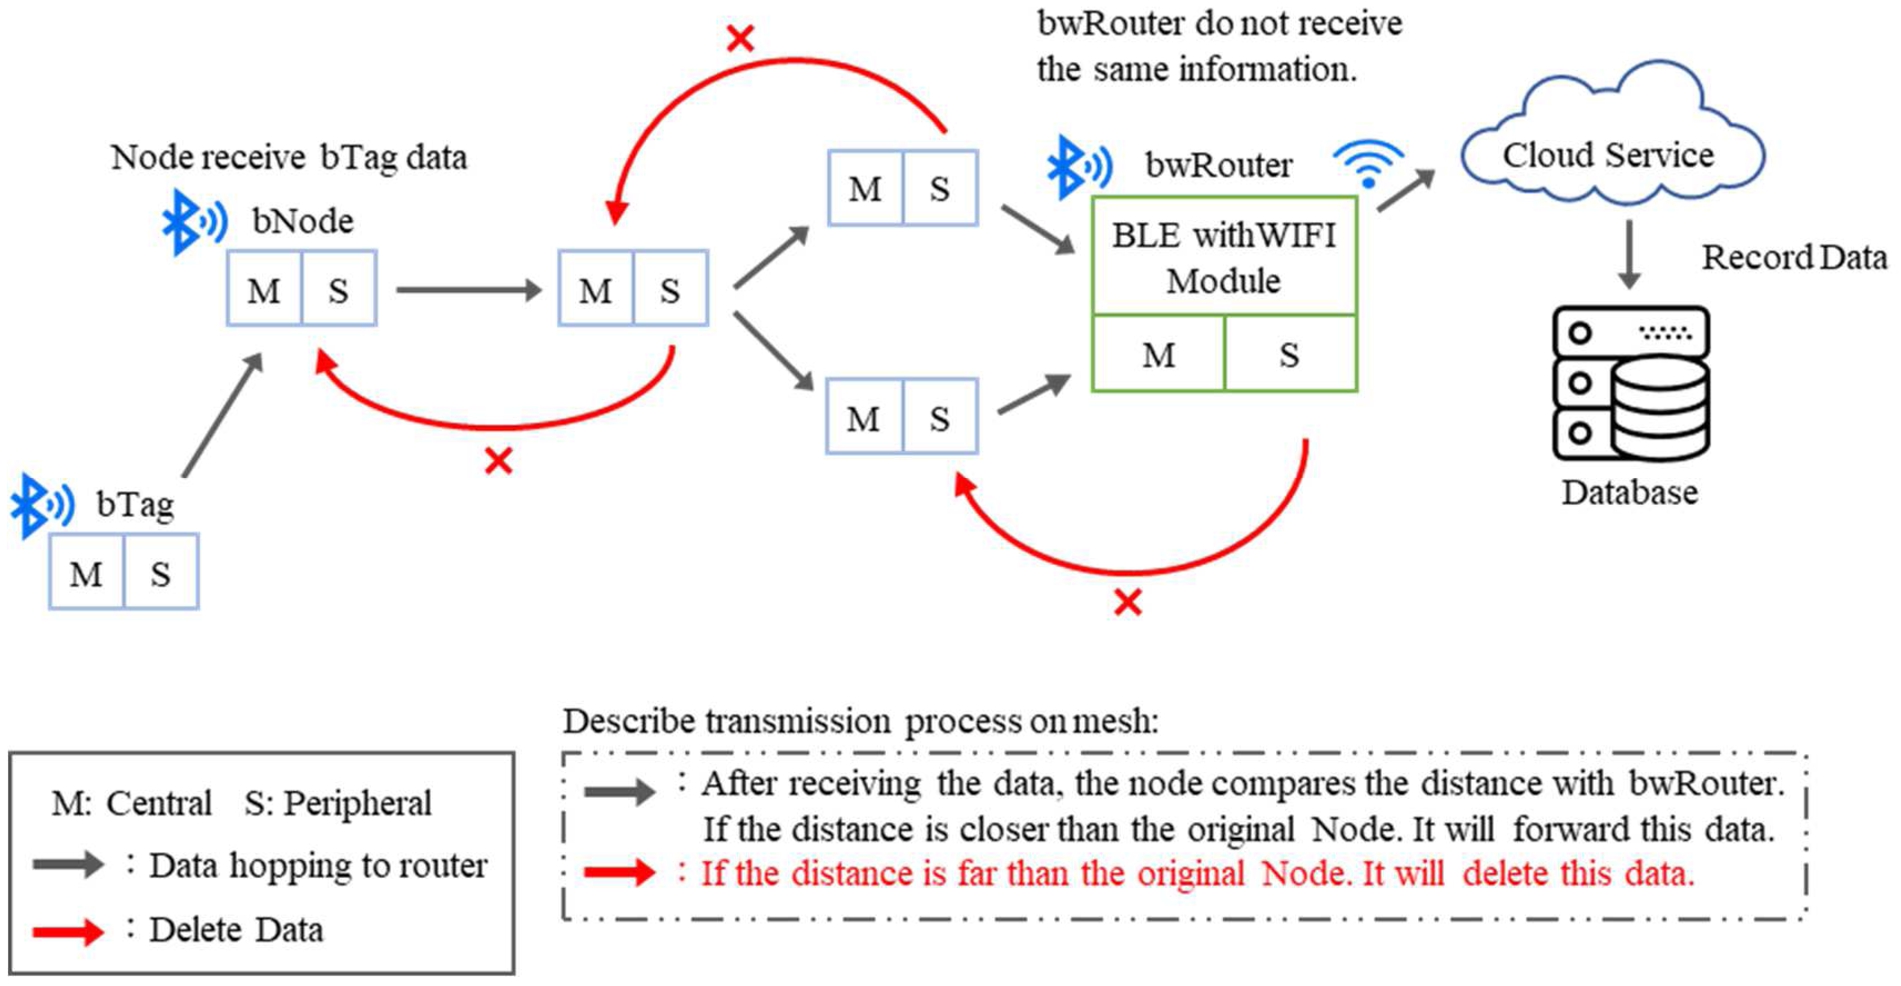
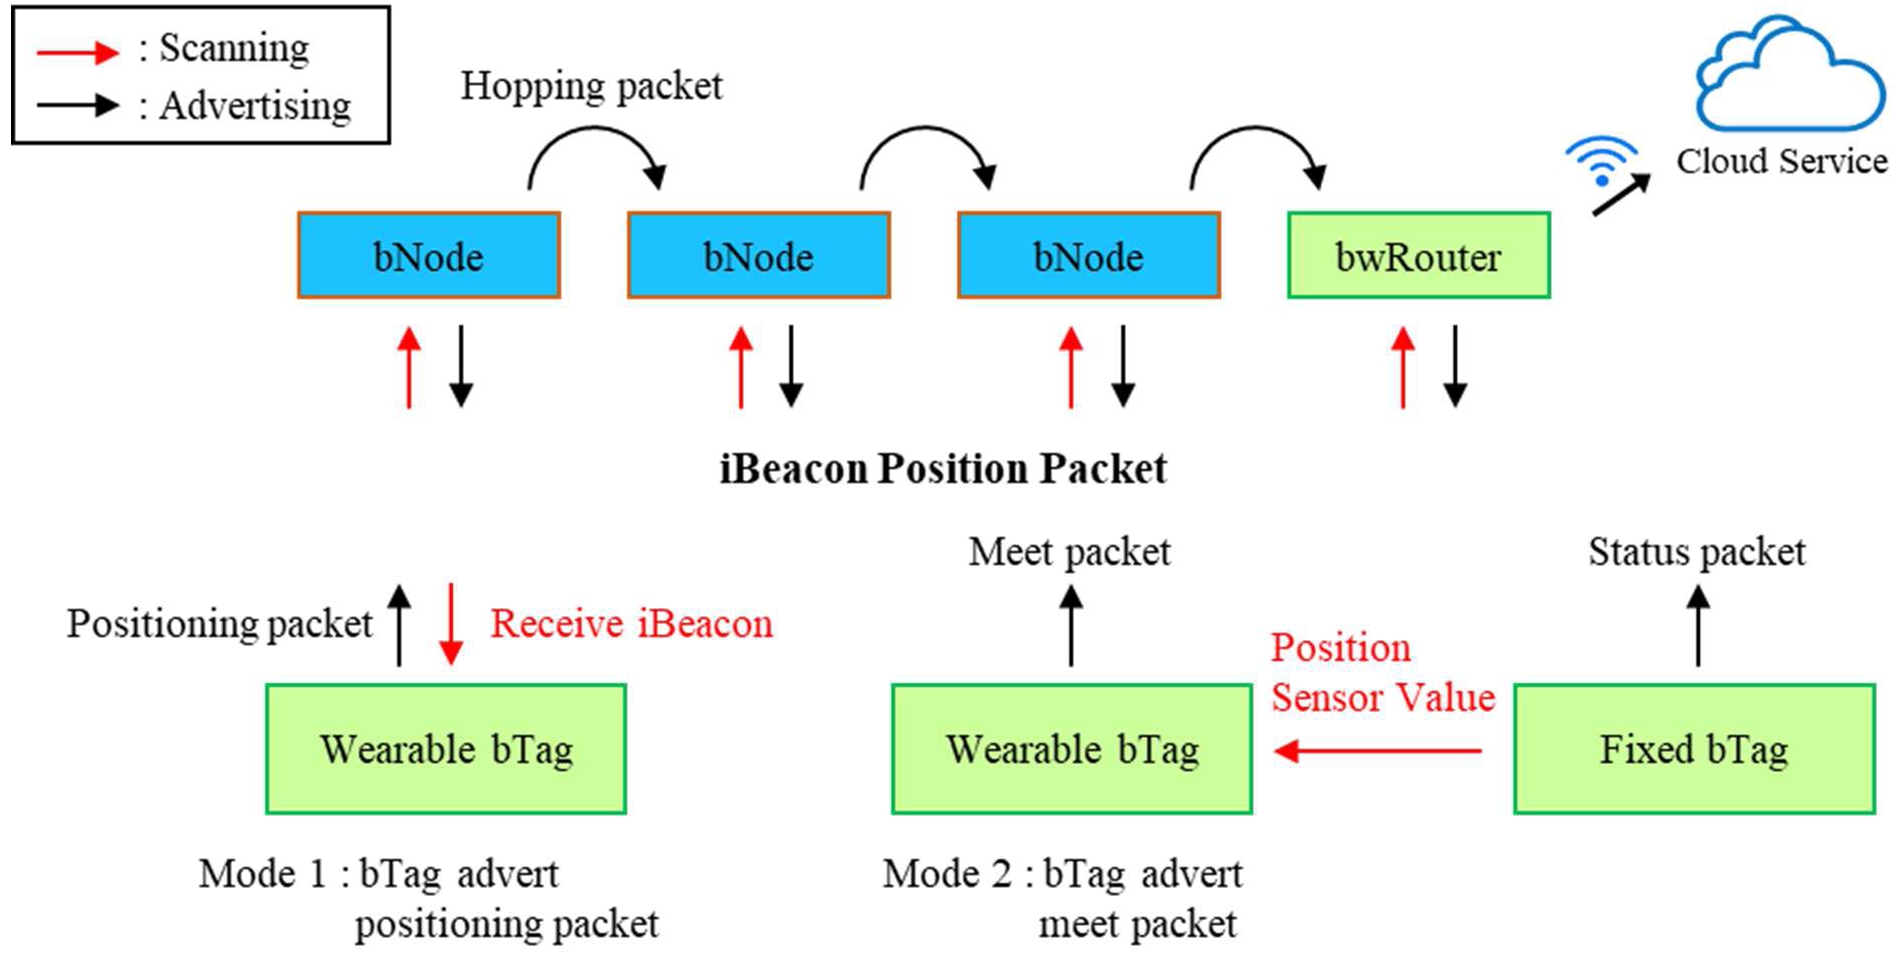
The master node transmits the data to the slave through the universal synchronous asynchronous receiver transmitter (USART) communication interface. The latter broadcasts the location packets for wearable device positioning, and the data sent by the master is considered as priority forwarding data. The data will be sent continuously to the next bNode until the master scans its return packet and notifies the slave device to stop broadcasting. This design not only ensures that each piece of data reaches the next bNode, but also reduces end-to-end latency. Based on this design concept, it can build a Bluetooth mesh network. Figure 2 describes the workflow and data flow among several bNodes. The bTags here are mobile sensors and fixed sensors with Bluetooth module, which ultilize the batteries as the source of power supply.
Fig. 2.
Diagram of the upload and transfer process of bNode from bTag.
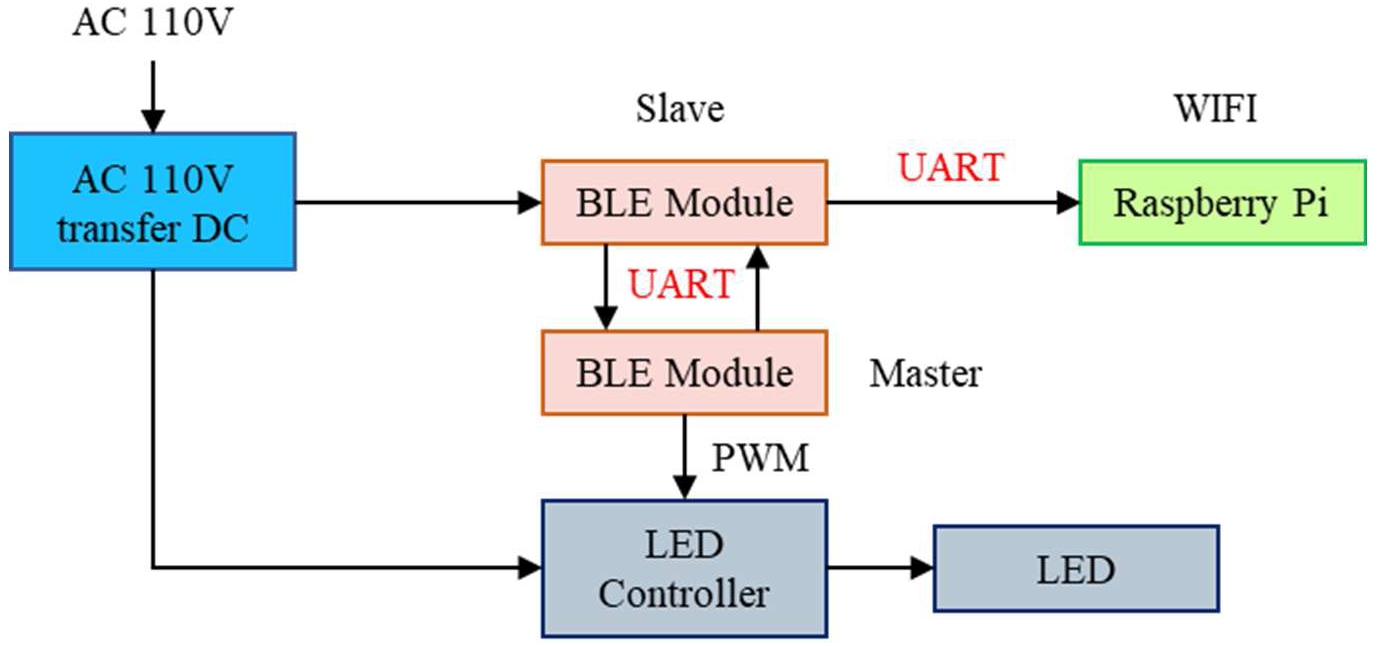
The bwRouter consists of two Bluetooth modules and one Raspberry Pi module (with embedded Wi-Fi) as shown in Fig. 3. It inherits the bNode function, and it is the top layer of the LBMN. It acts as a communication bridge between the Bluetooth and Wi-Fi. The BLE uses the USART communication interface to send data to the Raspberry Pi and then uploads the data to the cloud via Wi-Fi for data storage and analysis. The bwRouter can send confirmation messages to the bNode or send commands to the lower-layer devices in the LBMN to implement a two-way transmission system. For example, the bNode is connected to a light source device and controls its switch or brightness by pulse width modulation (PWM). The cloud server can specify the light source device (bNode) and download the duty cycle command through the LBMN.
Fig. 3.
BwRouter circuit block diagram.
3.2.Setting terminal
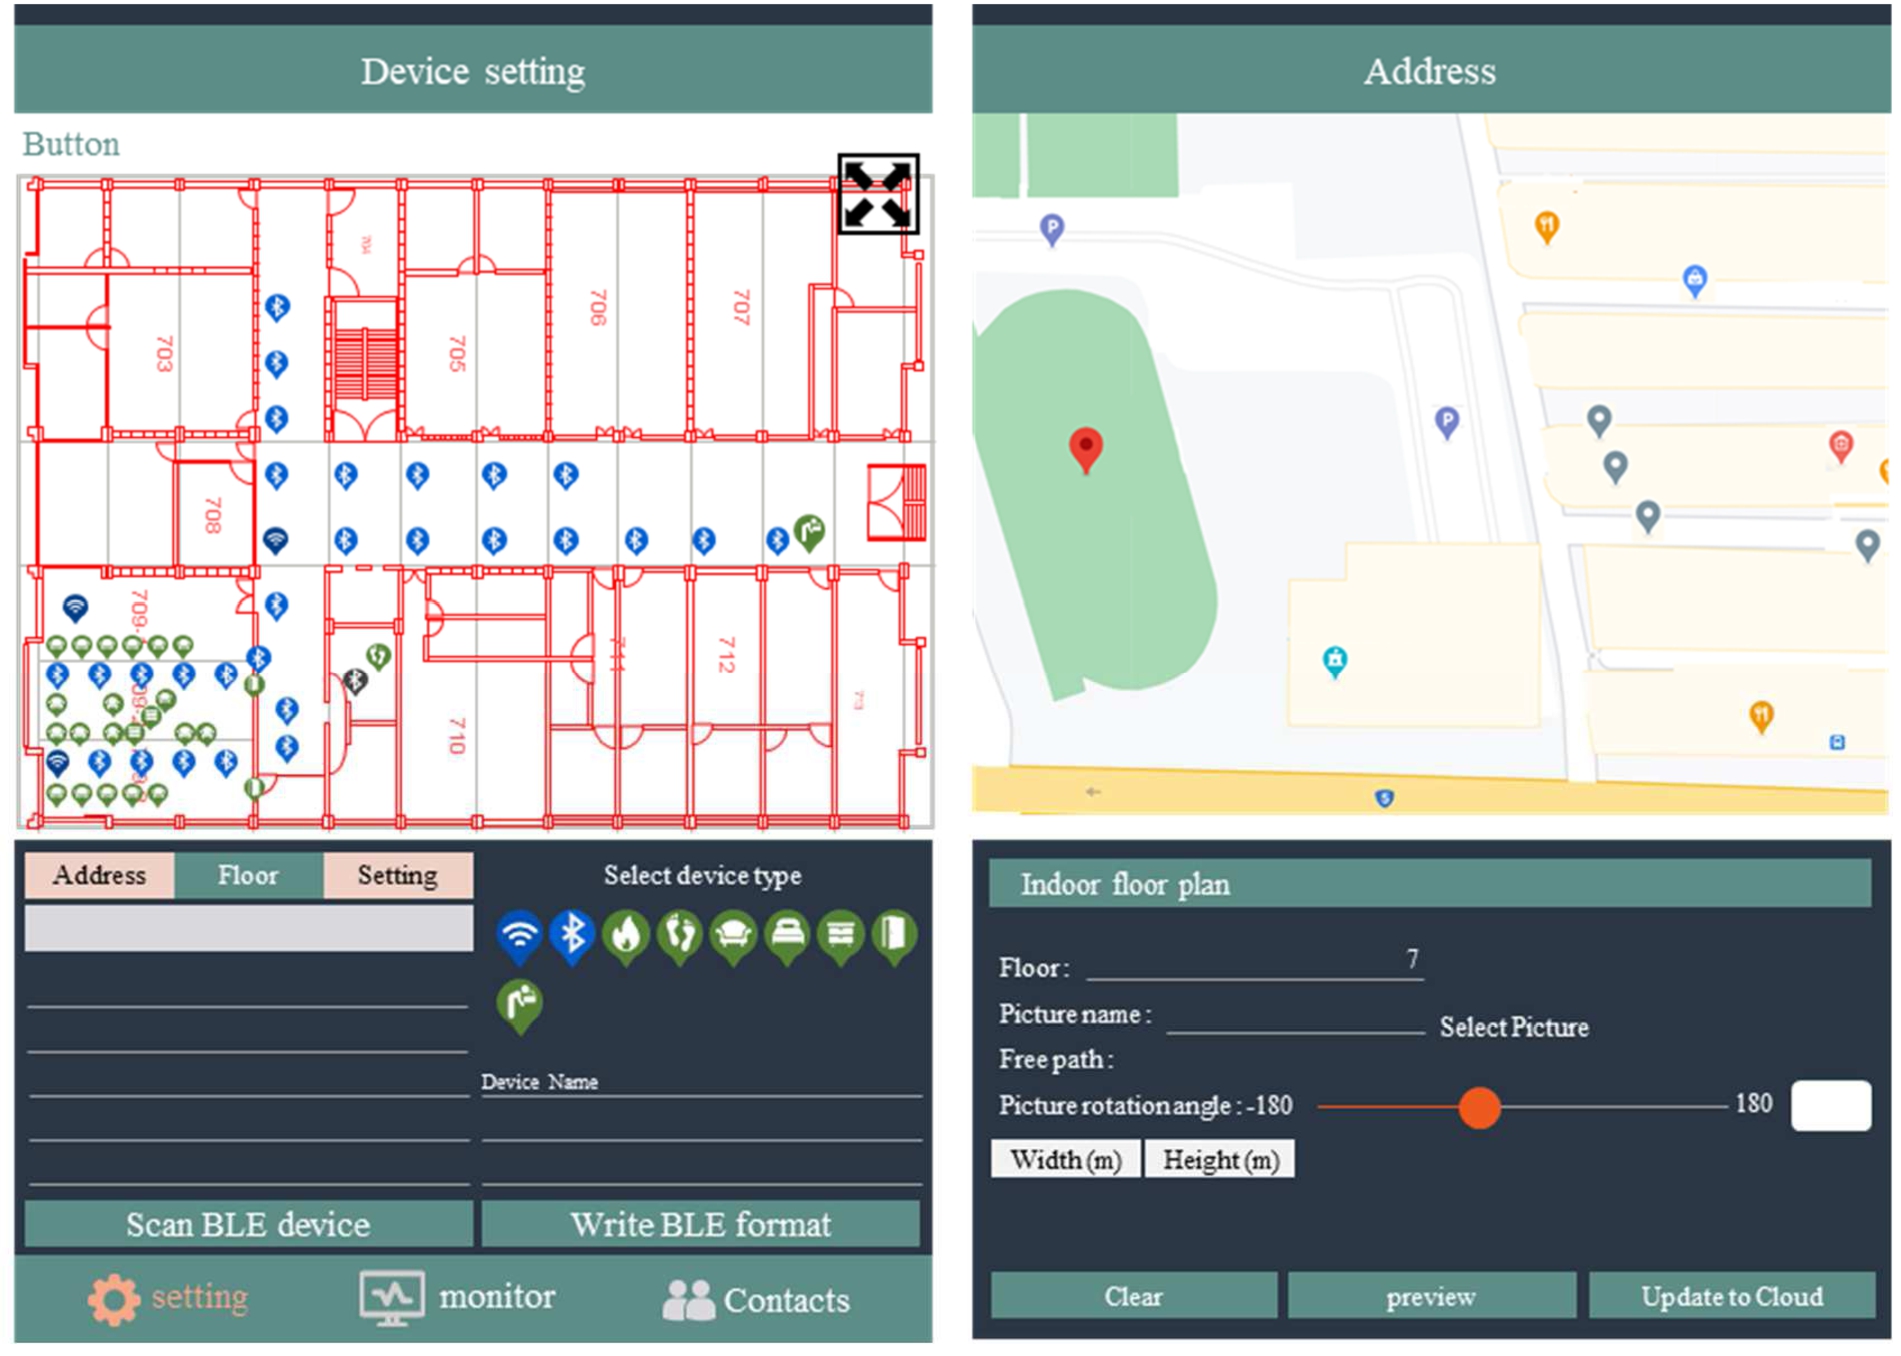
Mobile device application play a role in setting all the devices in the LBMN. As shown in Fig. 4, the system uses IOS smartphones as the mobile devices. The LBMN uses a method called “flooding” to publish and relay messages. To set the direction of the flooding, the mobile devices first establish a connection with BLE devices such as bTag (i.e., mobile sensors and fixed sensors), bNode, and bwRouter, then write the information to the BLE devices. This information include the absolute position obtained from the Google Map app in the mobile device for each BLE device, and lets each bNode know the location of the bwRouter. This method enable the bNode master to determine the distance away from the bwRouter, and makes the data transmission directional. In addition to setting the altitude, latitude, and longitude, for example, it can also divide the home into several specific areas, such as dining room, bathroom, living room, balcony, and kitchen.
Fig. 4.
IOS APP setting interface.
3.3.Cloud server database and the web
This system uses some of the cloud functions of Google Cloud Platform (GCP) such as web development framework and related development tools. It can collect the data of the posture and behavior mode of the elderly by bTags, and can store these data in a database that can be accessed on a web page via browsers on a computer and apps on mobile devices.
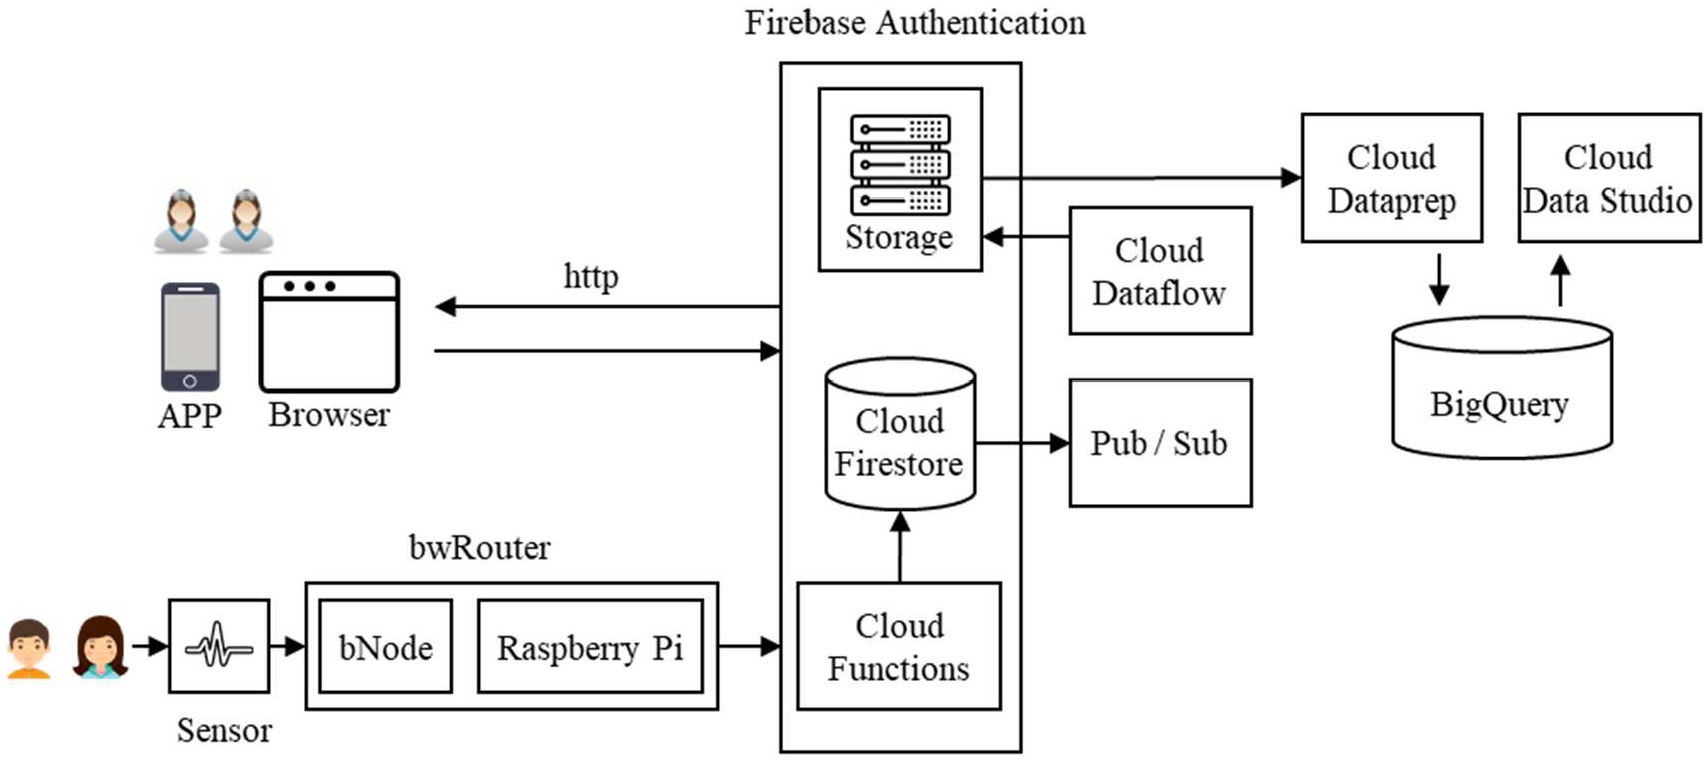
Statistical analysis of the behavioral pattern of the elderly can be performed on the regular output of historical data using data Extract-Transform-Load (ETL). Thereafter, the results can be pushed to the front-end community group and smart speakers through the push broadcast platform. These concepts are introduced in detail below. The cloud architecture diagram for this system is shown in Fig. 5.
Fig. 5.
The architecture diagram of the cloud system.
3.3.1.Angular framework
It is one of the user interface (UI) service web pages in the system. In order to efficiently make the data collected by the large number of IoT sensors of the user in real time, our research used Angular framework to build a client application platform. The architecture can be divided into modules, components, data binding, routing, services and dependency injection.
3.3.2.Cloud functions for firebase
This service allows deploying back-end environments and code to cloud services, thus eliminating the need to set up, maintain, expand, and manage them. This is a service that keeps application processing logic centralized, and it is called a serverless architecture. The user interface of this system includes web pages on a computer and apps on mobile phones that often add to, delete from, modify, and query the structural fields at the same level of the database. In order to unify the specifications and to easily maintain the operation of the database at the application layer, this system adopts the same API (application programming interface) specifications.
3.3.3.Cloud firestore for firebase
Firestore is a flexible and extensible NoSQL (Not only Structured Query Language) database that can synchronize data between client applications through a real-time listener. It provides offline support for apps on mobile devices and also for web applications. Whenever the data that the client application listening is changing, the system will be notified with a snapshot of the data and will only retrieve the new changes. By employing Firestore, we can modify the database only in response to new physiological data in the healthcare system, without the need to significantly reset and modify the back end of entire system. Moreover, this database has the advantage that it can trigger events at the back end of the database. When the sensors collect new data, the front-end web page and app screen can be actively updated by the back end, without the front end actively refreshing. This significantly reduces the use of front-end performance, and can load a large amount of data from IoT sensors for visualization. The main reason for using a NoSQL database is that it can process with large amount of data at high speed with a scale out architecture, and it can also store unstructured, semi-structured, or structured data.
3.3.4.Cloud storage for firebase
The storage space in this system is can store the accessing media files such as images, audio, and video. This study introduced how to extract and transpose the Firestore object data for follow-up analysis. Cloud Storage for Firebase is a powerful, simple, and cost-effective object storage service built for Google scale. The Firebase SDKs for Cloud Storage add Google security to file uploads and downloads for your Firebase apps, regardless of network quality.
3.3.5.Cloud pub/sub
This system uses Cloud Pub/Sub services in three important message exchanges: (i) Edge device (Raspberry Pi) to database; (ii) Firestore database, the data is transposed to BigQuery; (iii) database trigger to push alert messages to the users. This design separates the system and cutting module, which can consume data collected by a large quantity of IoT sensors and digest batch data via Cloud Pub/Sub message queue. It can also avoid missing important information due to network conditions because of the Pub/Sub pattern, which only retrieves information based on the topic subscribed to after the data is successfully processed.
3.3.6.Cloud dataflow
Dataflow is a fully hosted, high-speed, integrated streaming and batch data processing service that minimizes latency, processing time, and costs by automatically scheduling resources and batch processing functions. Thus, our research use the dataflow service to subscribe to the pub/sub topic to extract and convert each historical record in the database into a JSON file, and to store it in cloud storage for subsequent data transposition.
3.3.7.Cloud dataprep
Cloud Dataprep is a smart data service that uses a visual interface to explore, clean, and prepare structured and unstructured data for analysis, reporting, and machine learning. In our research, Dataprep is used to automatically convert the data extracted by dataflow, format, clean, label, and combine the data of different objects collected by fixed devices and wearable devices. Thus, subsequent research can focus on analyzing these data in the future.
3.3.8.BigQuery
BigQuery is a serverless enterprise data warehousing service from Google that has high scalability. It is cost-effective, and can help to improve the efficiency of data analysis [15]. In this study, batches of table data in the custom view model format were transferred from Dataprep to BigQuery for large-scale data streaming storage and analysis of IoT device.
3.3.9.Cloud data studio
Our research use Google’s data visualization tool and Cloud Data Studio. It is a system’s big data statistical report UI service and is able to create custom visualizations by turning data into compelling visual content and reports. We linked Data Studio to BigQuery by transposing dataset in advance via Cloud Dataprep. With BigQuery business intelligence (BI) engine, the system can analyze data in a very short time (less than one second).
3.4.Indoor positioning method
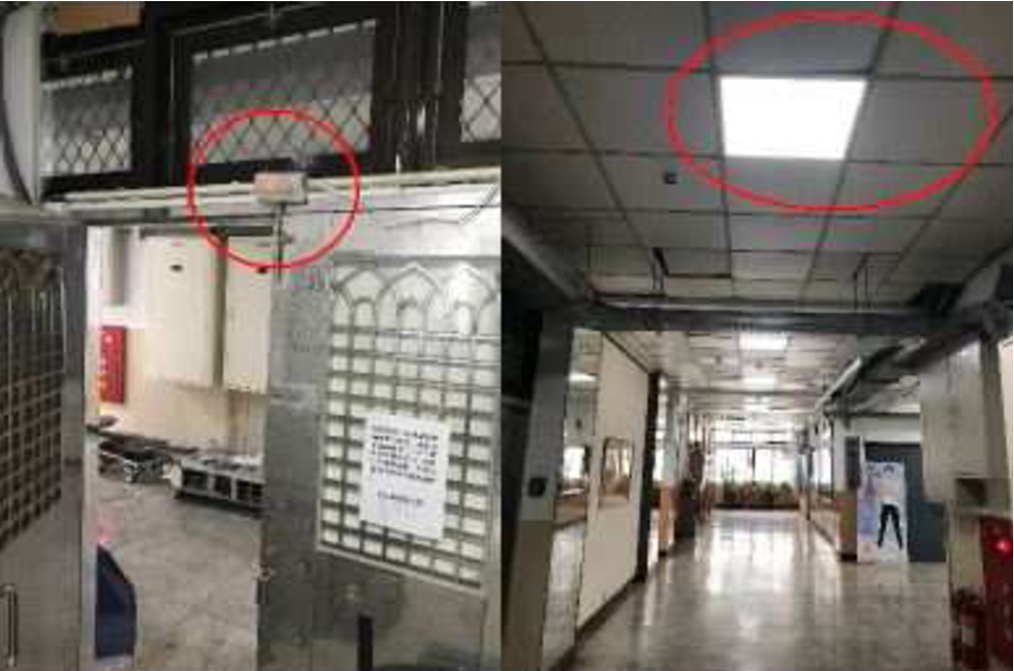
The LBMN in our system was set at the fixed position on the ceiling through multiple light source devices with bNodes. The bNodes are 2–5 m apart, and they can flexibly match omnidirectional and directional antennas. For example, omnidirectional antenna can be integrated with a light source device and set on the ceiling. In addition, in order to avoid the influence of multipath effect, multi-hop networks were implemented to increase the data transmission speed. Furthermore, a directional antenna was installed on the door as shown in Fig. 6, and it can determine who enters or leaves through the door. For example, if the elderly with Alzheimer’s disease are going outside to wander through the door, the system will issue an alert to notify the caregivers to keep a close watch on their moving path and take the necessary measures to avoid any possible accident in advance,
Fig. 6.
bNode set on the ceiling or the door.
When a person with a wearable device touches the fixed sensors installed in the surrounding environment, the sensors can provide the information for positioning. This positioning method utilize the Euclidean distance formula to calculate the straight-line distance between two nodes based on the longitude and latitude of the actual location. By using this positioning method, we can calculate the predicted position and achieve highly accurate positioning. First, we search the number of nodes with the threshold received signal strength indication (RSSI) to determine a suitable positioning method such as three-point positioning, two-point positioning, or single-point positioning. According to Eq. (1), the signal path loss model calculates the relative distance between the wearable devices and each node.
Broadcast data format and transmission Our system uses a definition from our proprietary protocol called PetaCom. Based on the format of the data packet, all Bluetooth transmissions and data analysis can be performed. For example, bNode broadcast location data packet, the forwarding data packet. The wearable devices broadcast positioning data packet and also receive fixed sensor data packet including information from wearable devices and the fixed sensors.
First, we describe location data package of bNode and positioning data package of wearable device. The former sets the latitude and longitude of each bNode, and two parameters (Pr0, ε) are required by the path loss model through a mobile device. BNode embeds the information in the data packet, and broadcasts it to the wearable device to determine the position of the person. as shown in Fig. 7 and 8. Figure 7 show that reporting your location to the other users. Figure 8 show that logging location information before recharging.
Fig. 7.
The location data package of BNode.
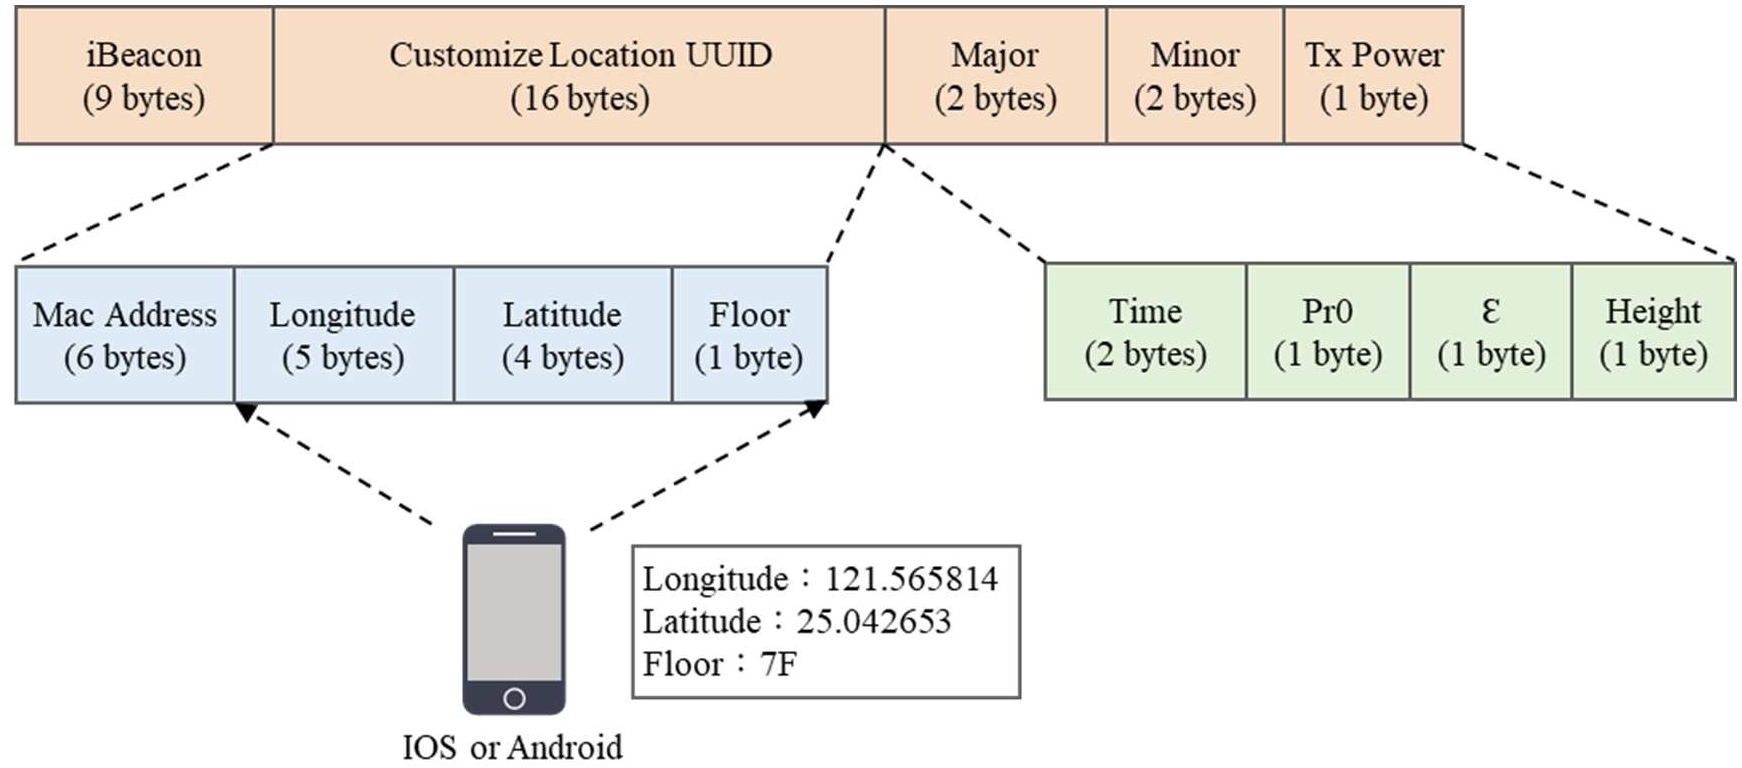
Fig. 8.
The positioning data package of wearable device.
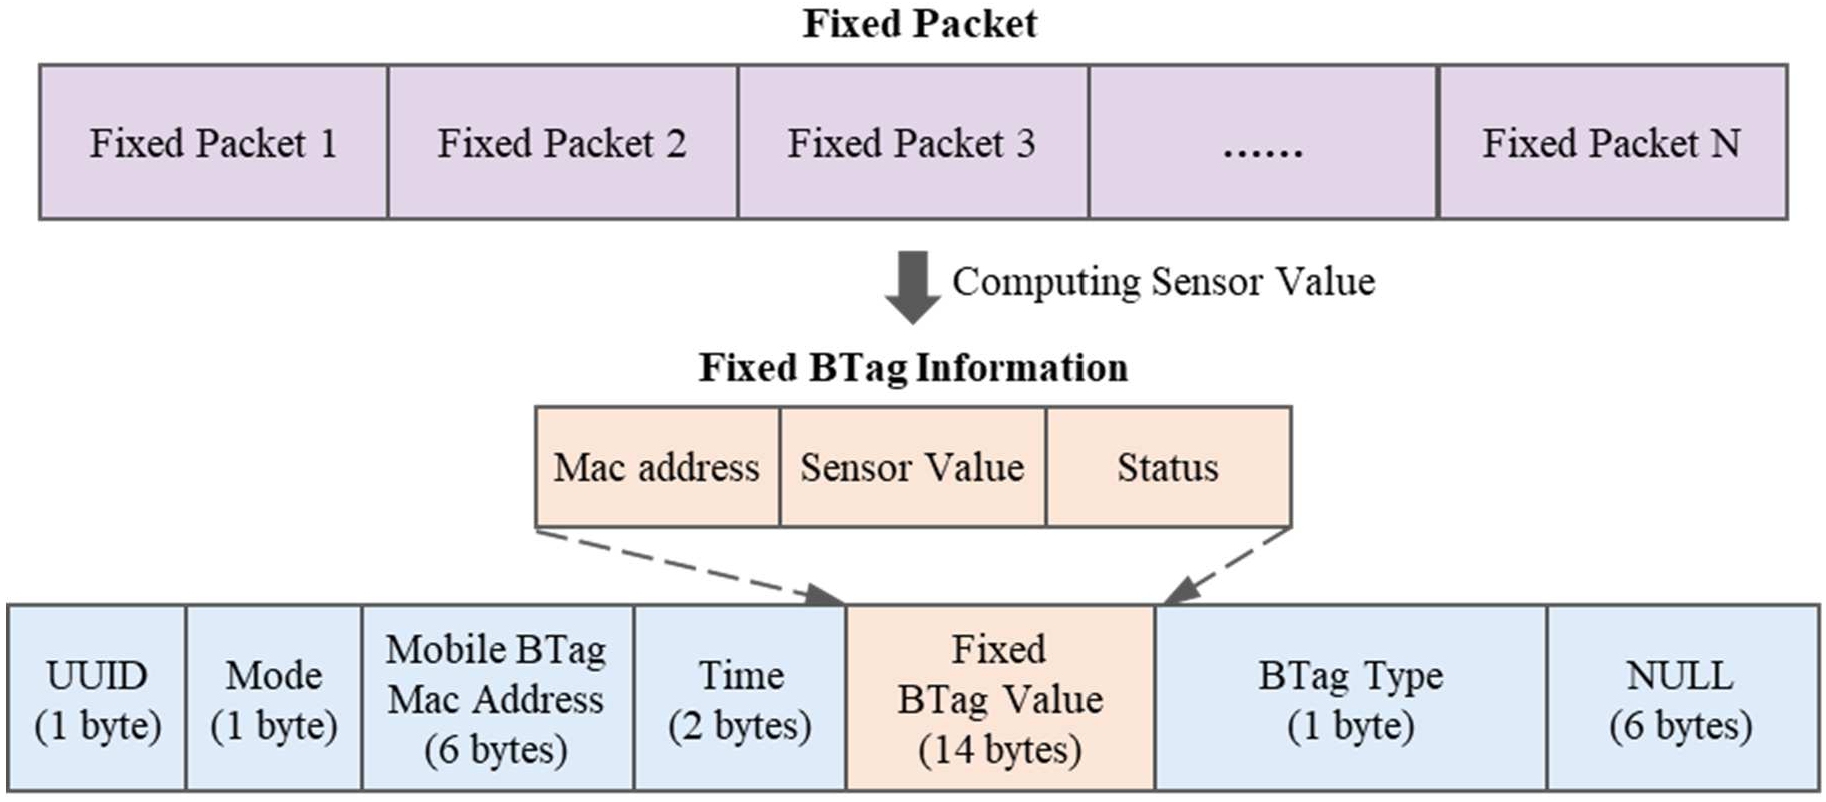
When a person with a wearable device touches a fixed sensor (bTag), the wearable device (bTag) will broadcast a data packet to intergrated the information of wearable device in the person with that in the fixed sensor. The information of the data packet consist of MAC address, sensing value, and status data as shown in Fig. 9.
Fig. 9.
BTag packets in which a person touches the fixed sesnor (bTag).
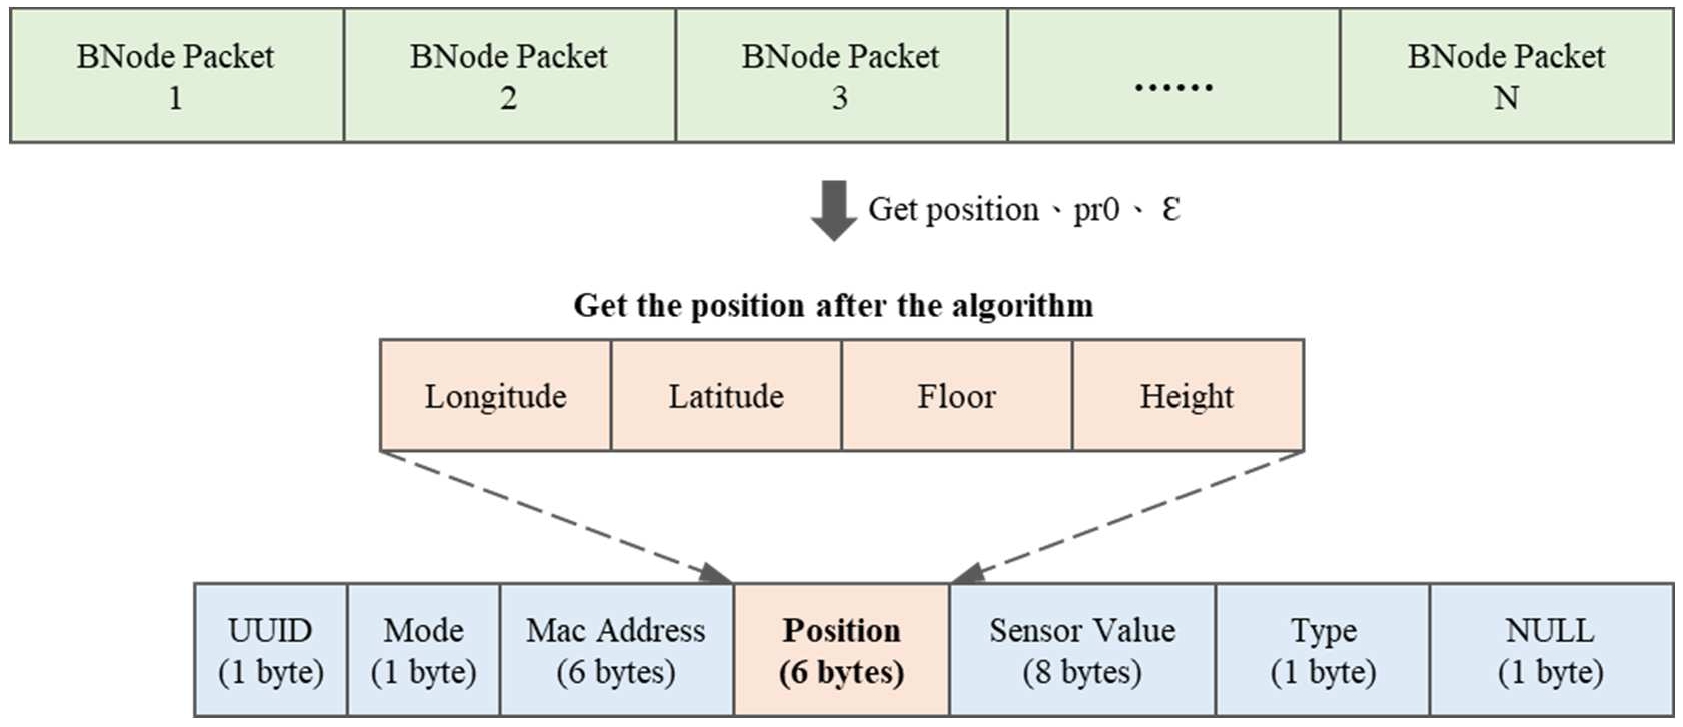
The BNode receives the data packets conforming to the PetaCom protocol, and embeds the data into a forwarding data packet. Then, the bNode broadcasts the data packet until it arrives at bwRouter. The forwarding data packet information consist of latitude, longitude, and mesh group as shown in Fig. 10. Figure 11 is the schematic diagram of the transmission in the system based on the data packets in Figs 7–10.
Fig. 10.
BNode forwarding data packet.
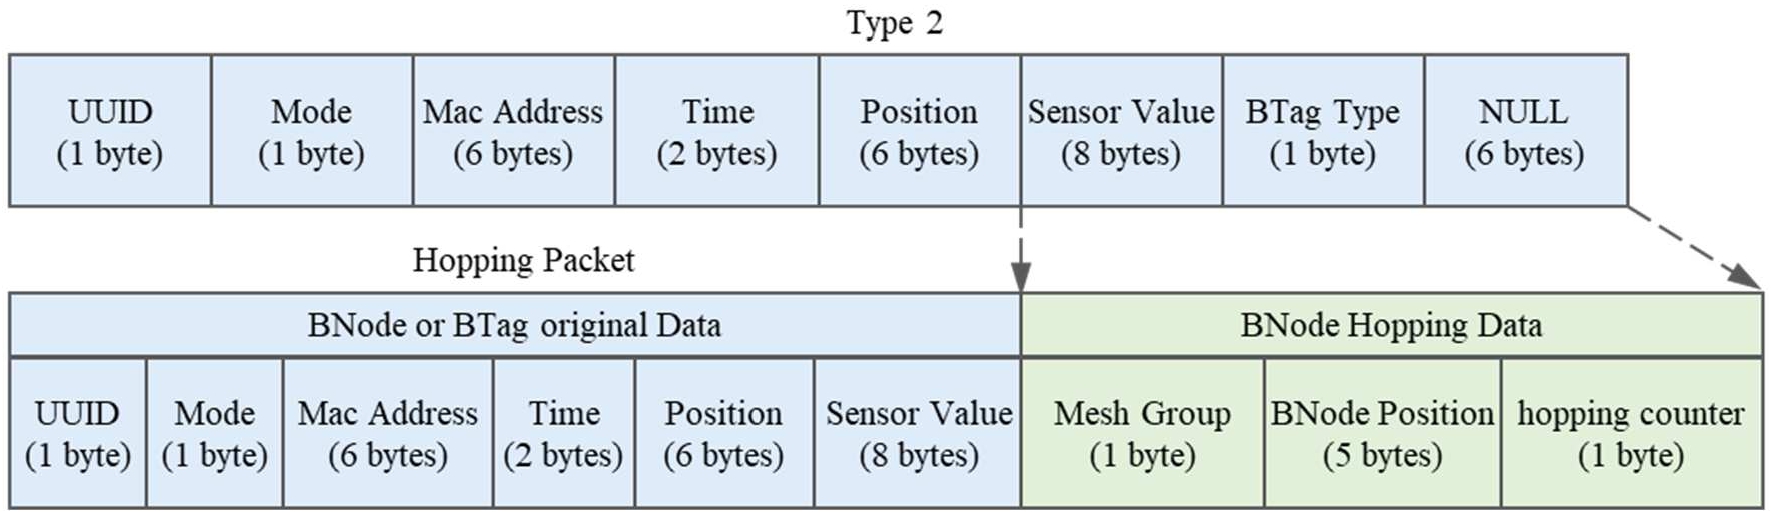
Fig. 11.
Schematic diagram of the transmission in the indoor positioning system.
3.5.Wearable devices and fixed sensors
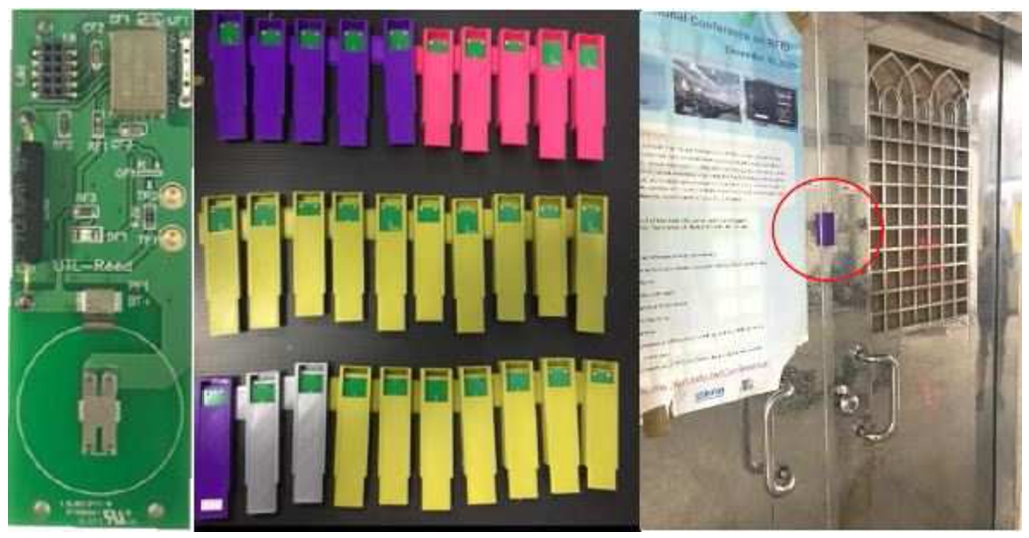
The sensors in our system consist of wearable devices (mobile bTag) and fixed sensors (fixed bTag). Wearable devices utilize identification cards (name tags) for positioning as shown in Fig. 12. Fixed sensors acting as contact sensors consist of seat cushions, pedal mats (as shown in Fig. 13), and magnetic reed switches (Fig. 14) that can be triggered by a touching from a given person.. The magnetic reed switch with the BLE is installed on any accessible equiments to be switched appropriately, such as door, window, drawer, or refrigerator door handle. When a person touch the magnetic reed switch, a status packet is sending and then it search the nearest wearable device. At this moment, the reverse positioning packet is also sending. Both of the above packets are uploaded to the LBMN. Finally, the caregiver can know the equipment had been used by whom at some point in time through a web page or check it in the database.
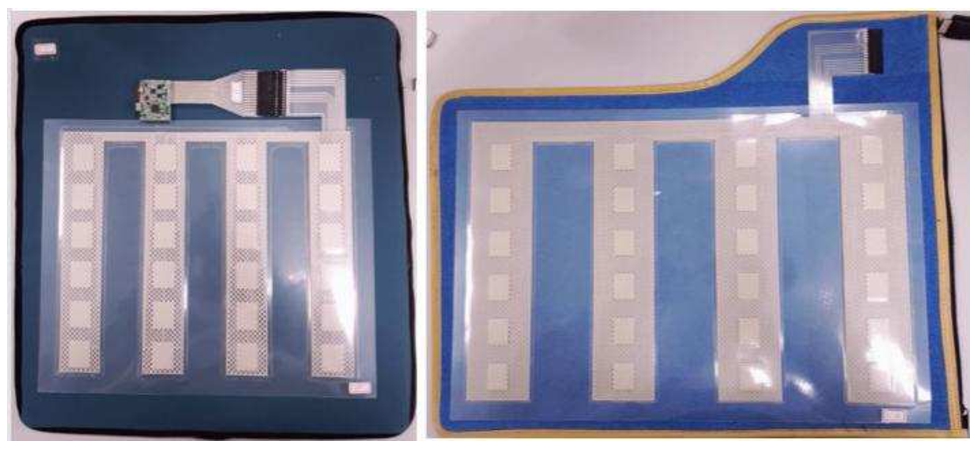
The seat cushion and pedal mat utilize silicone rubber as the dielectric material which has 24 capacitive sensors inside. Through the calibration algorithm, the capacitance value is converted into the corresponding pressure for comparison and analysis to determine the sitting posture as normal, forward, backward, leftward, or rightward. The cloud server records the position of the center of gravity of the various postures and analyzes its proportion. When a person stands on the pedal mat installed in front of the toilet or washbasin, the cloud server record the standing posture as forward, backward, rightward, or leftward.
Fig. 12.
Name tag.
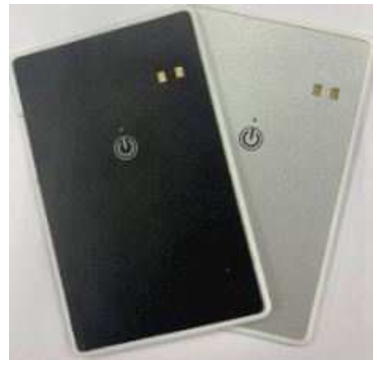
Fig. 13.
Types of contact sensor: cushion (left), pedal mat (right).
The Bluetooth character of the magnetic reed switch is multifunctional, and thatof seat cushion and pedal mat are peripherals. According to the indoor positioning method described in Section 3.4, radio frequency (RF) signals are easily affected by the persons and the surrounding environment. A wearable device together with the contact sensors can increase the positioning accuracy. The caregiver can know the current behavior mode of the elderly from a web page or an app on a mobile device. The details are described below.
Fig. 14.
The diagram of magnetic Reed switch.
3.5.1.Posture determination with the aid of fixed sensors
The name tag with an IMU sensor inside can determine the current posture of a given person, such as sitting, standing, walking, standing still, lying down or falling. When a person with a name tag on the chest sit on the seat cushion, the IMU sensor determines the posture as sitting. The name tag will scan the status packet of the seat cushion and send a packet in which the person touches the sensor of cushion. Then the packet is uploaded to the cloud server which determines the person’s location is on the seat cushion, as shown in Fig. 15. When a person stands on the pedal mat, the IMU sensor determines that it changes from waling status to standing still status. The name tag will scan the status packet of pedal mat and send a packet in which the person touches the sensor of pedal mat. Then the packet was uploaded to the cloud server, which determines that the location of the person is on the pedal mat. When a person touches the magnetic reed switch, it will reverse to scan the name tag. Then the cloud server determines the location of the person is near the magnetic reed switch such as the door, window, drawer or refrigerator.
If the definition is in terms of rooms, each room has its own specific function, such as a bathroom, which usually includes a toilet, a washbasin (for brushing the teeth, washing hand), a bathtub or a shower area. First, the absolute latitude and longitude were defined in each room, and the indoor map was set. When an user enters the bathroom and is positioned on the toilet. If the posture is changing from standing to sitting that will be detected by the name card IMU and the behavior can be determined that the user is defecating. For the bathrooms with small space, we can place a pressure-sensing pedal mat on the ground in front of the toilet or the washbasin to improve the positioning accuracy. Thus we can know who stepped in the front of the toilet or the washbasin.
Fig. 15.
Web page monitoring: determination of a person’s location on the seat cushion.
3.5.2.Determining the amount of physical activity with the aid of fixed sensors
The name tag is placed on the chest of a person The IMU sensor inside the name tag can determine the current posture of the person, and then integrate with fixed sensors for positioning. Therefore, the caregiver is able to know the daily behavior pattern of the person, for example, the times and frequency of going to toilet and drinking water in one day. Because the positioning information is stored in the cloud database, the path and total distance moved by the person is available for further data analysis. Whether the amount of physical activity of a given person is enough or not can also be checked. If a person spends too much time sitting, the seat cushion will send a notification to inform the caregiver that the person needs to stand or walk instead of sitting all the time. In addition, the seat cushion can also make emotional judgment. For example, if the sitting posture is constantly changed or unstable within a short period of time, it might determine that the person is restless. For the aging people with dementia who may wander away from home or even get loss, the cloud server can analyze their moving path. If the IMU sensor suddenly receives a sharply changing data of the accelerometer in the Z-axis and the posture changes from standing or sitting to lying down, it is determined as a fall. Besides, the IMU sensor can also determine if an elderly person has staggering gait which often caused by arthritis, musculoskeletal injuries, and inner ear or visual disorders
All of these abnormal behavior patterns could be detected by our smart healthcare system, which could notify the caregiver or family members to take preventive measures to avoid the occurrence of adverse events. The above behavior patterns were stored in the cloud database. Thus the caregiver is able to know the daily life activities of the elderly, and then monitor their health status. To prevent the persons from removing or losing the name tag, when the IMU sensor determines that the persons stand still for more than one minute, it will broadcast to notify the system and then display the location of the persons immediately online.
4.Experiments and results
4.1.Indoor positioning experiment
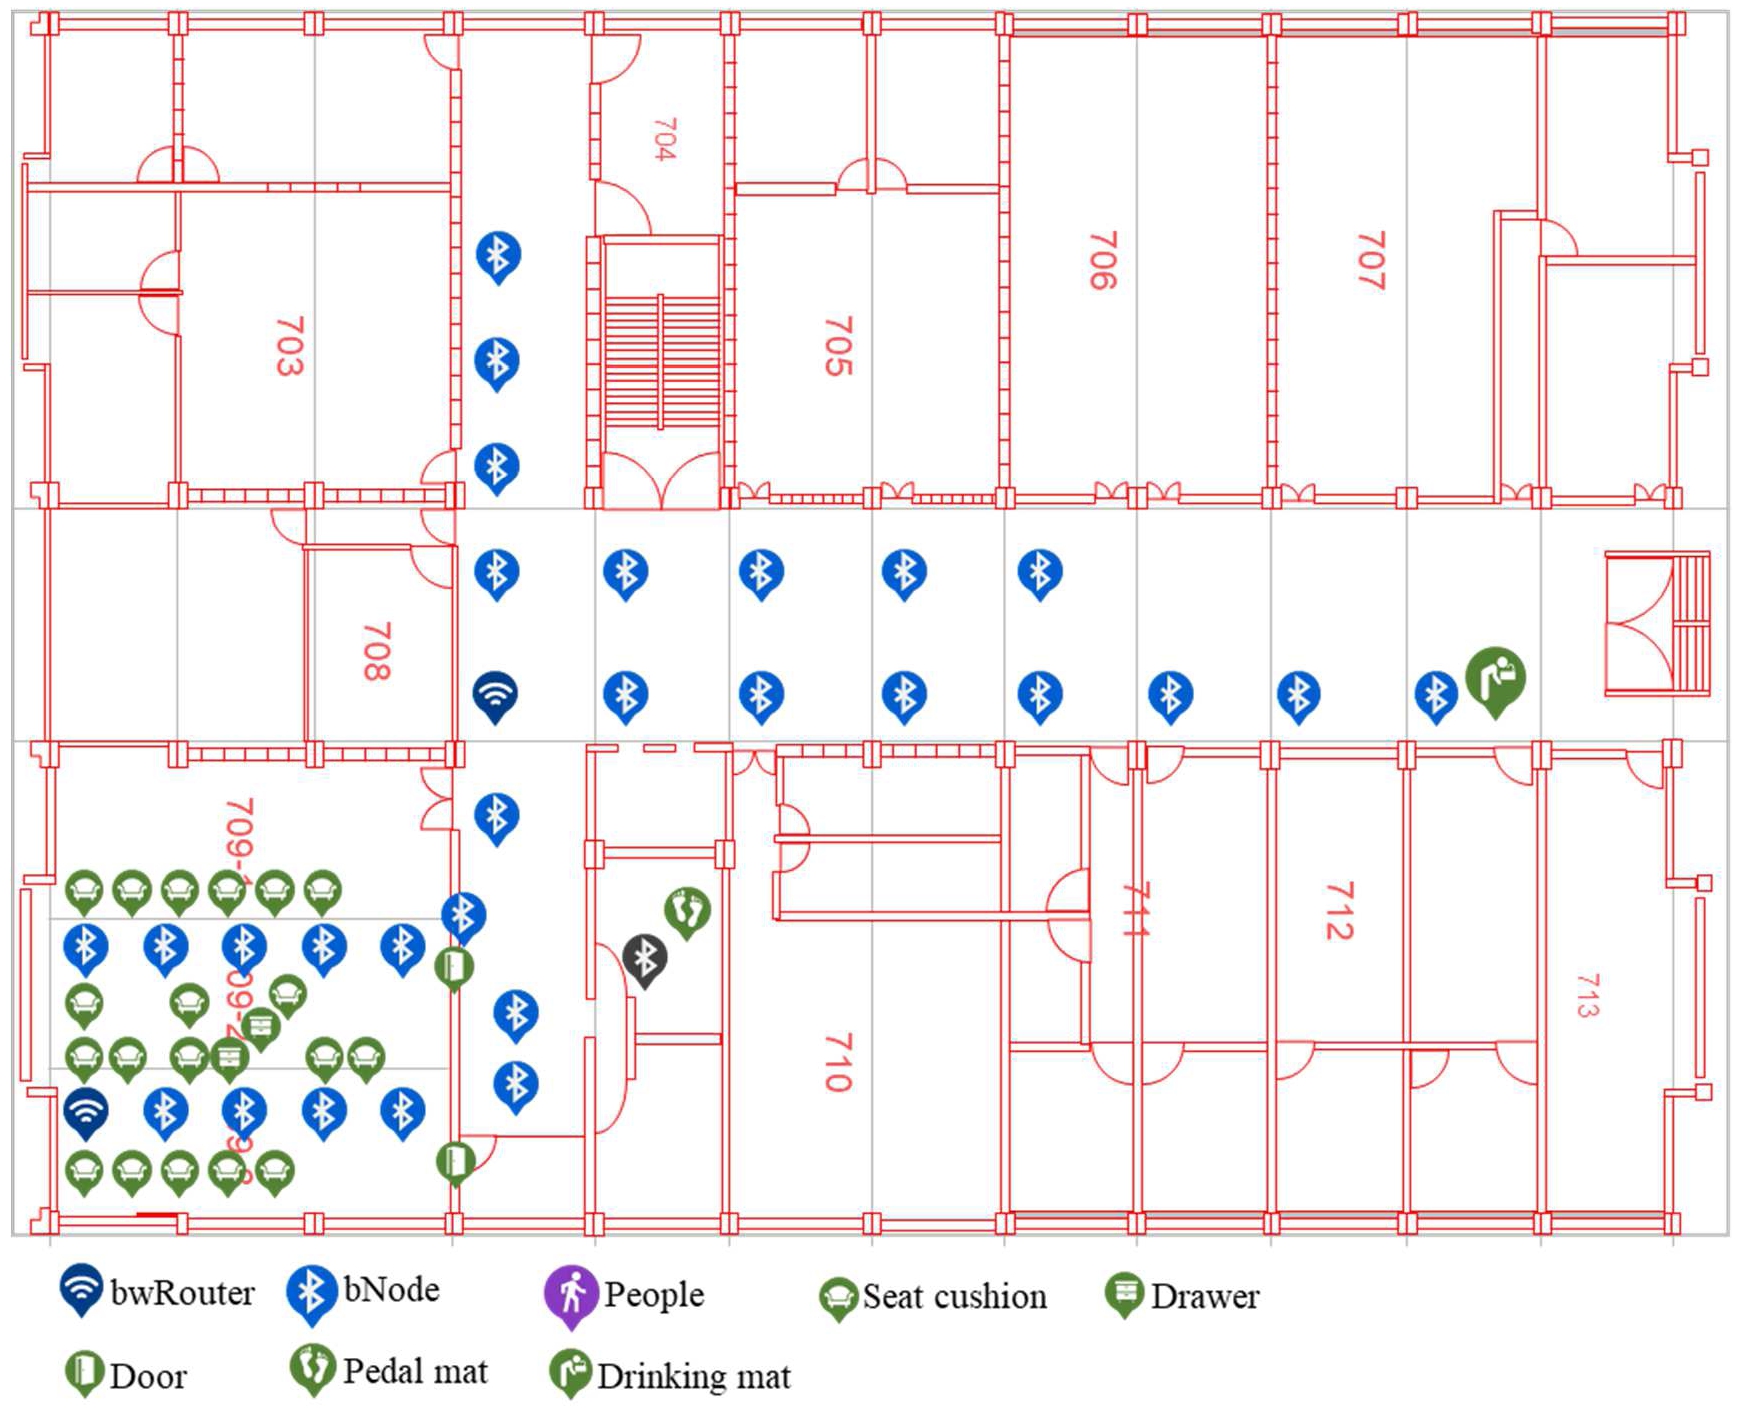
In our study, there were 31 bluetooth light-source devices (bNode) installed on the ceiling in a field of 45 × 31 m. Each light-source device was 3 m high from the floor. Twenty persons participated in the experiments, which lasted 5 h daily for 3 weeks. The average age of the 20 participants is
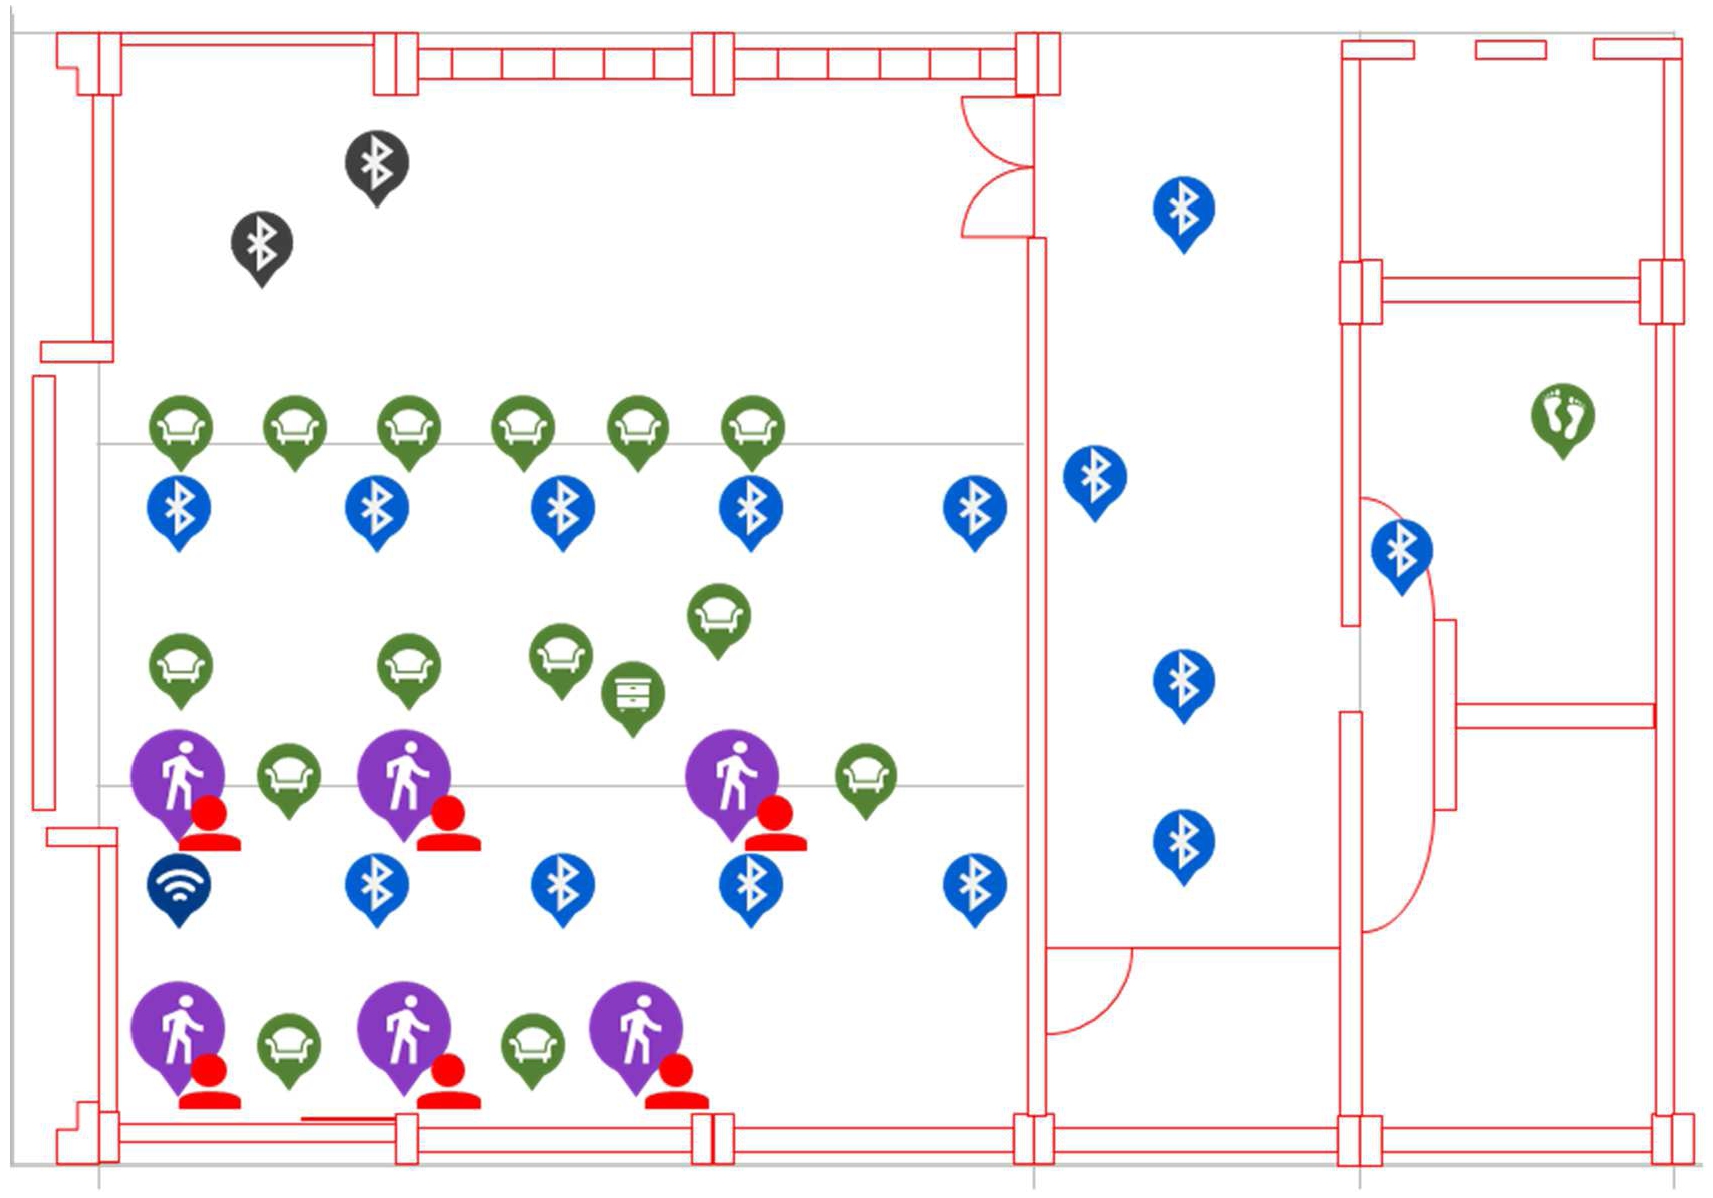
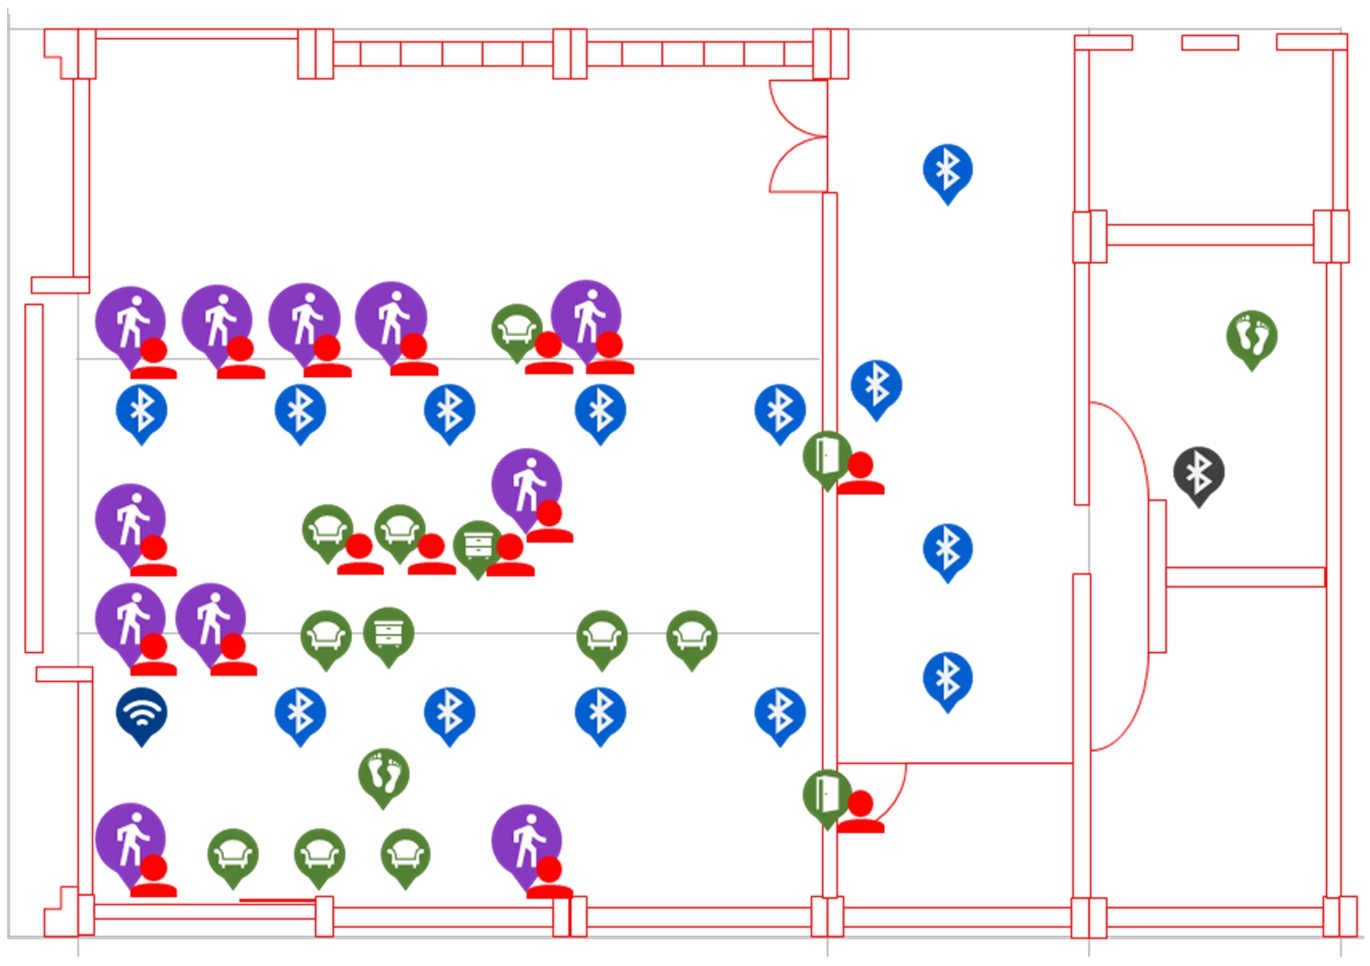
The data of the personal behavior pattern were recorded in a cloud database. Every experimenter with a wearable device used seat cushions, pedal mats, and magnetic reed switches to assist in determining their positions and behavior patterns, as shown in Fig. 16. RSSI measurements and analysis were conducted in the wearable devices, and the personal behavior pattern was recorded in the cloud database for analysis.
Fig. 16.
Experimental field plan and bNode installation location.
In this experiment, a total of 11,938 data on the tag-records of mobile devices, 10,594 data on device-records, and 200 data on people-records are obtained The statistical data are shown in Table 1. The people-records are an individual’s behavioral statistical data for one day and there will be only one historical data per day.
Table 1
The experimental data in ten days
| Data field | Number of data |
| Tag-records | 11,938 |
| Device-records | 10,594 |
| People-records | 200 |
4.2.Analysis of wearable device experiment
In our experiment, the thick red line with red arrow represents the walking path for 5 experimenters with the name tag. All the name tag’s algorithms were integrated for testing, and every single one data was uploaded every 3 s. Finally, both the actual position and predicted position were recorded as shown in Fig. 17.
Fig. 17.
The comparison of actual position and predicted position.
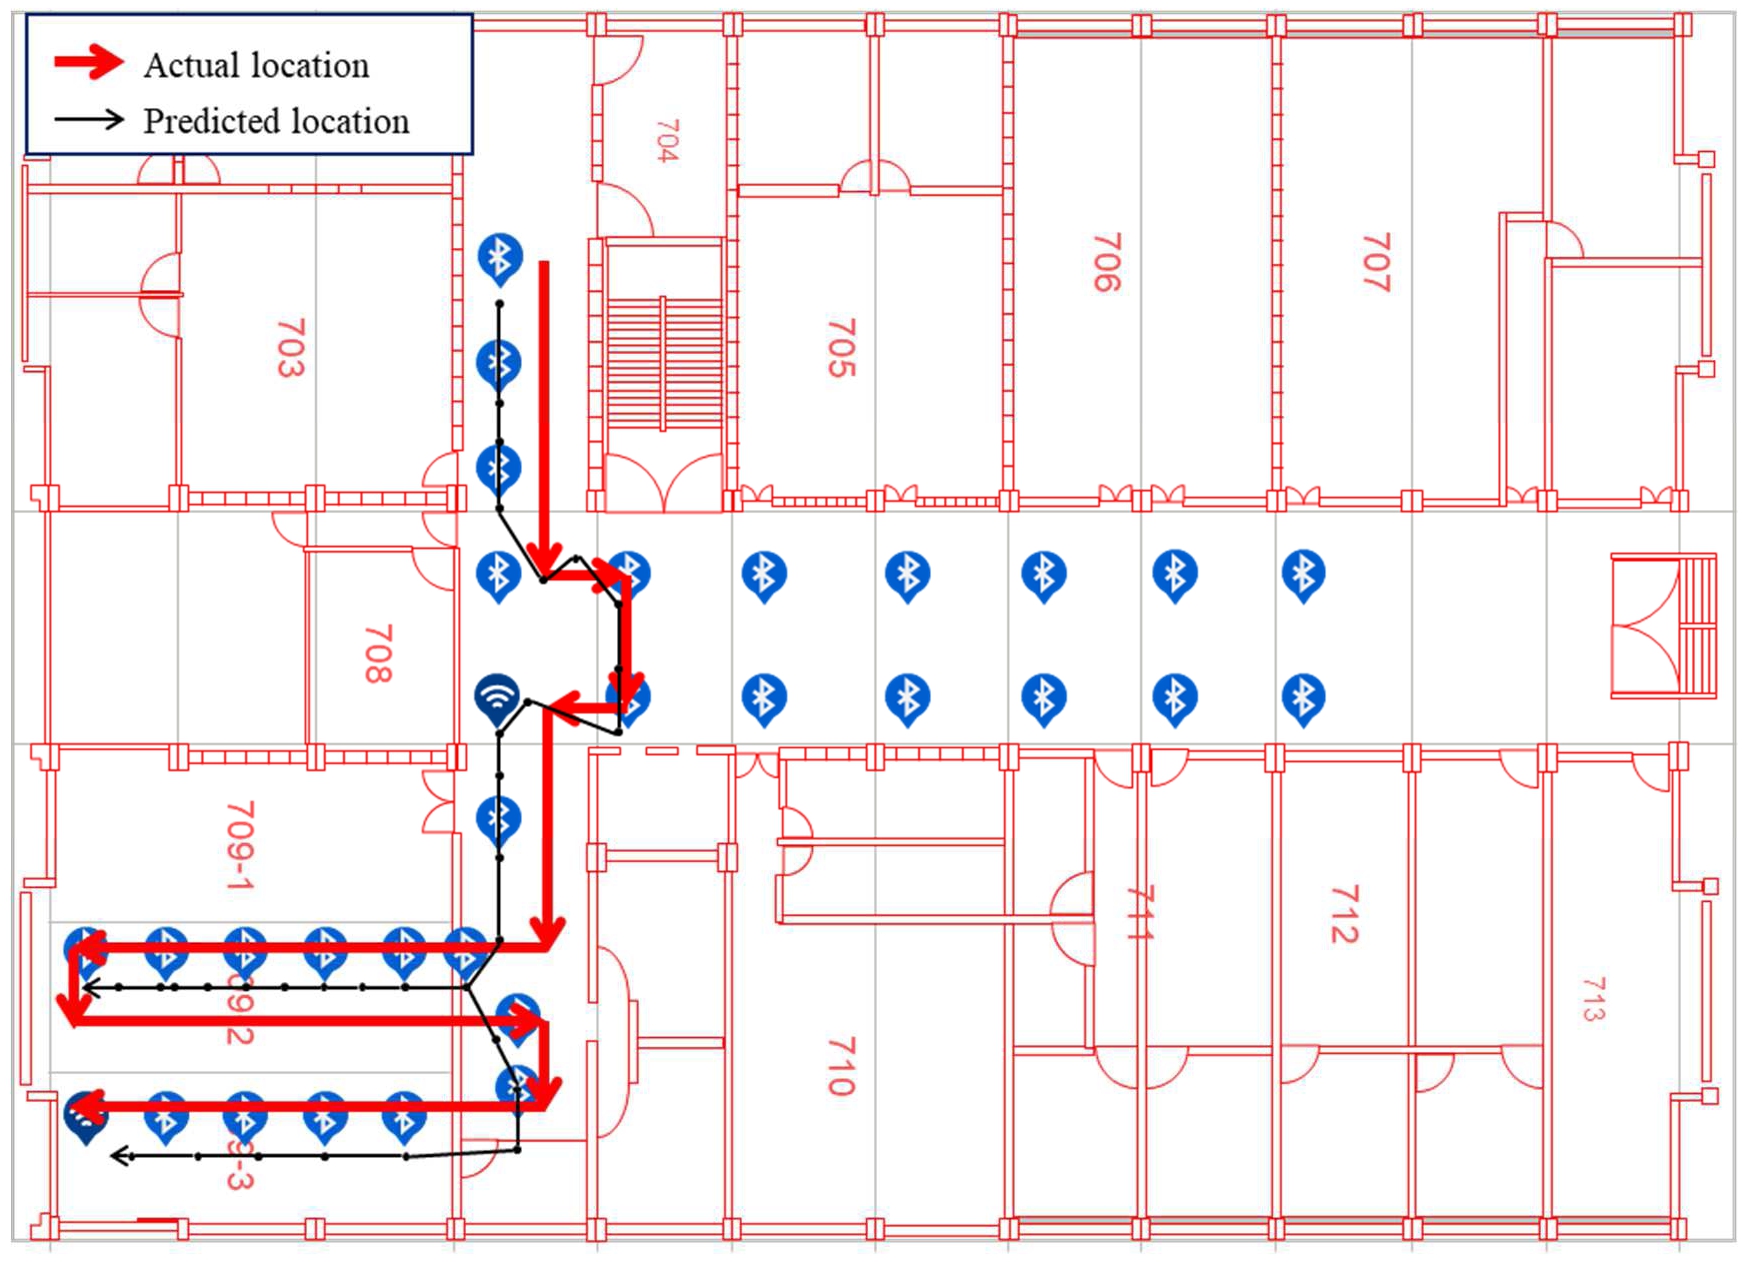
When a person is moving, the RSSI will be inaccurate due to the human body’s shadow or the speed of movement. In addition, this is also one other factor that could cause inaccurate positioning. Therefore, in order to test the reliability of our system, we changed the bNode mounting pitch to test the deviation of the accuracy. At the same time, five experimenters are moving along the path as shown in Fig. 17. Actual deviations were recorded in Table 2: the number of data varied from 42–54, and the average deviation varied from 1.2 m–3.2 m.
Table 2
The testing result of name tag
| User | Number of data | Installation interval | Average deviation |
| 1 | 42 | 2.0 m–2.5 m | 1.2 m |
| 2 | 47 | 2.5 m–3.0 m | 1.6 m |
| 3 | 46 | 3.3 m–3.7 m | 1.6 m |
| 4 | 54 | 4.2 m–4.5 m | 2.0 m |
| 5 | 48 | 5.8 m–6.1 m | 3.2 m |
4.3.Data model design
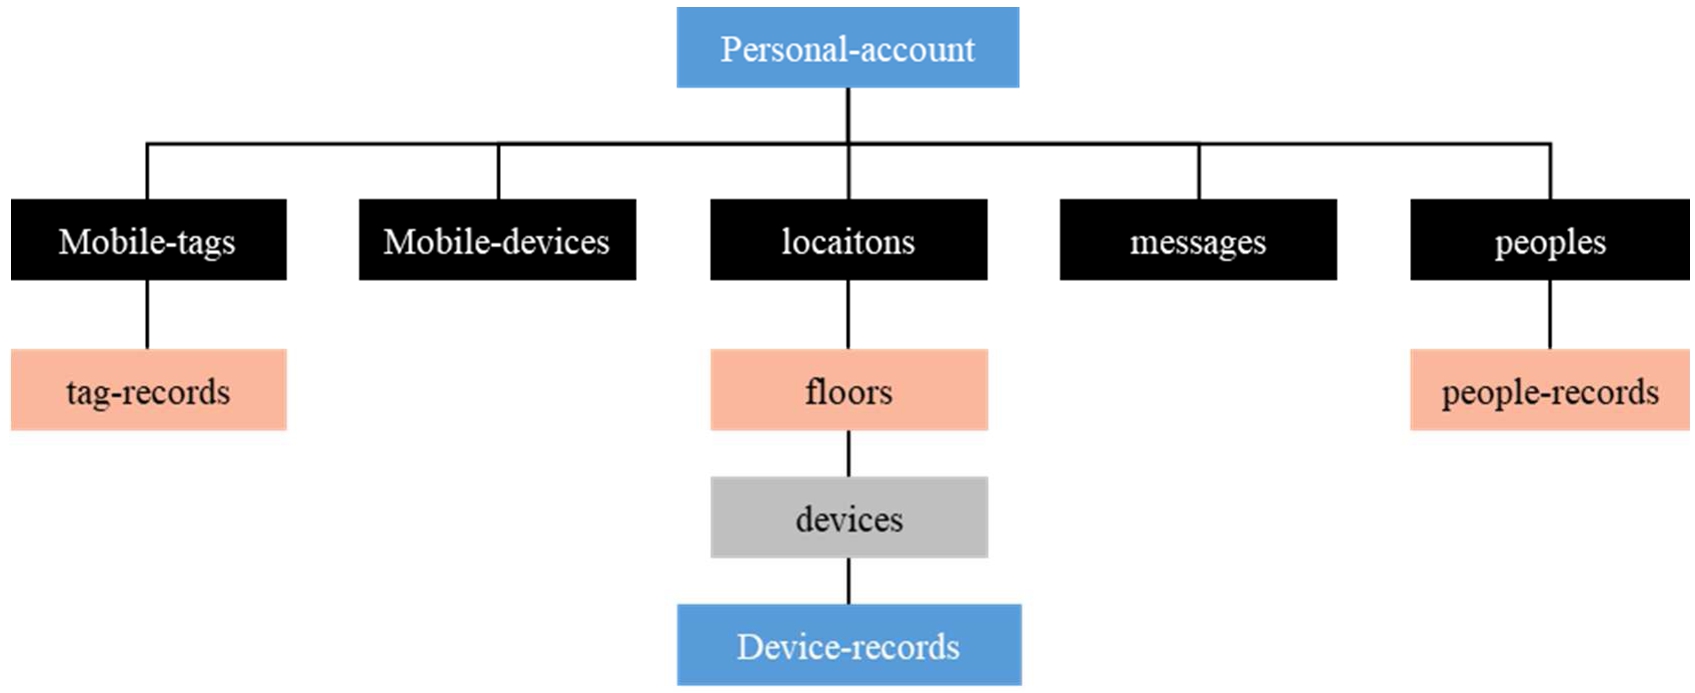
This cloud database of the system is mainly based on Firestore. The concept of the data structure design involves permission security, optimized query, and reuse. Figure 18 is the Firestore database object design diagram, which is presented in the form of a multi-tree. The following are the definition of object structure nodes.
Personal-account: Records user account, mobile phone, permissions, device passwords, and setup time. The user information covers individuals and organizations.
Locations: Records one or more addresses.
Floors: Inherits the address information on the previous layer, and multiple floor information, including the latitude and longitude of the floor boundary and the floor plan of the current floor.
Devices: Inherits the information on the previous floor and records the current status of the fixed devices on the current floor. The fixed device information includes fire detection devices, seat cushions, pedal mats, magnetics reed switches.
Devices-records: Inherits a fixed device whose content is the historical contact information on the current equiment.
Mobile-devices: To this end, the user’s mobile phone records the alias that the user gives to this mobile phone, and the necessary information for the push function.
Mobile-tags: This is a wearable device. The current wearable device in the system is a name tag.The fixed device that records the current address, floor level, movement of the personnel, and contact of thecontact sensors.
Tag-records: The record of historical information from the previous wearable device, The record contains latitude and longitude information of the positioning.
Messages: This records the content of the message from the web page and app on mobile phone, the source information is the point in time. The content of the message can be divided into text sources and sound sources.
Peoples: As mentioned in the personal-account, the user can be divided into individuals and organizations. When the user is an individual, this node idetify and record the current user or their family, their current behavior, and the wearable device. The nodes record the behavior mode of the current user and the devices they wear.
People-records: The inherited parent node records the historical data of the person’s activity pattern, including the amount of exercise, the number of toilet visits, the moving path, the total time of sittig, and the distribution of sitting postures in one day.
Fig. 18.
Design diagram of firestore database object.
4.4.Web monitoring status and database analysis
This section describes the data obtained from the wearable devices and contact sensors can be displayed on the web page of mobile devices and stored in the cloud for further analysis.
4.4.1.Web monitoring status
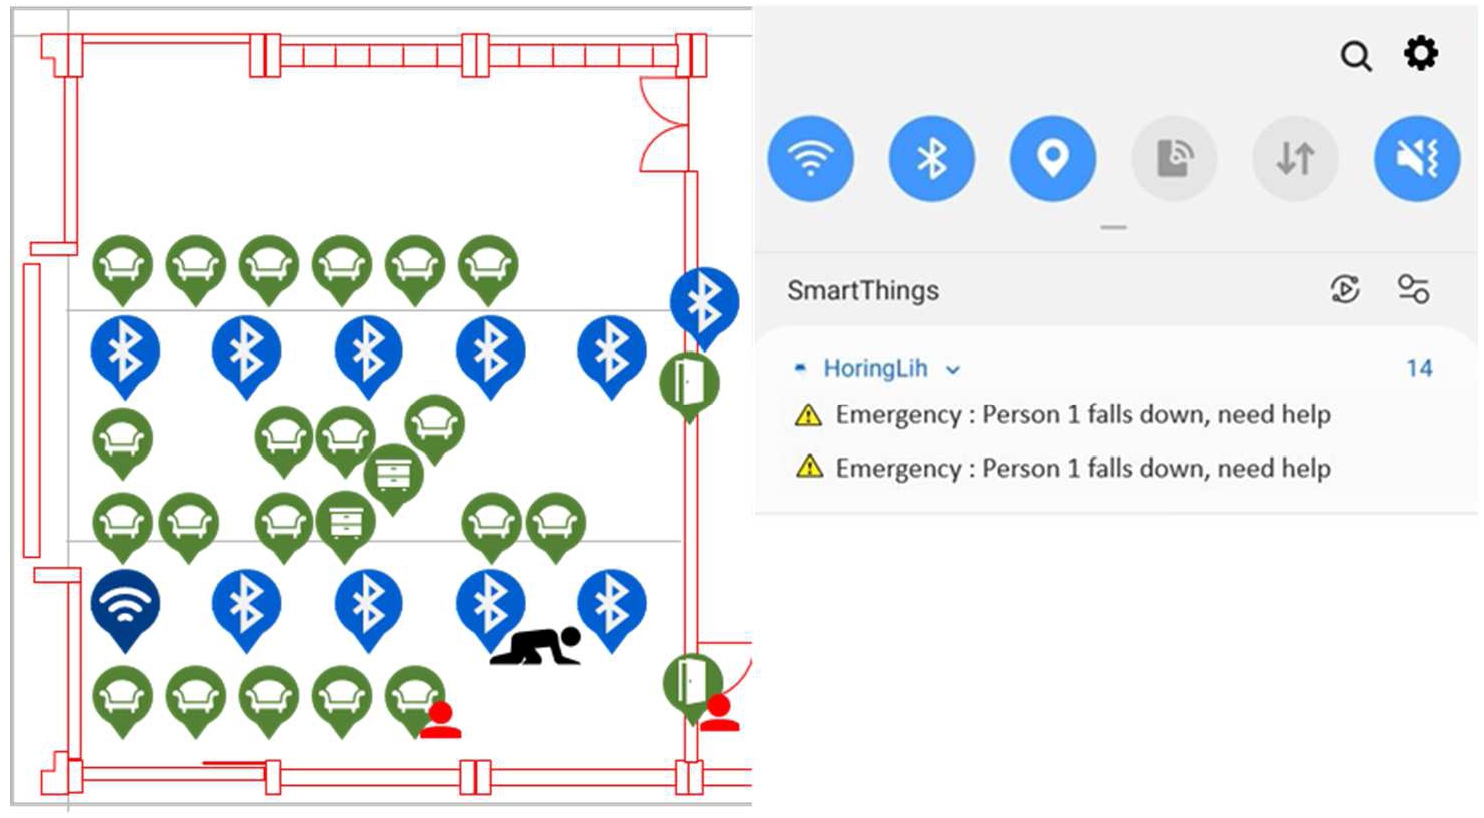
The web monitoring is divided into personnel status, equipment status and monitoring equipment status. Through a web page, we can monitor the position of the personnel and the status of related equipment in real time. Web monitoring can determine the position of the personnel at any time and can also determine the activity mode of the personnel including sitting on the seat cushion, going to the toilet and drinking water. The location of the seat cushion is set according to the actual seat location. Each interval is 1.5 m. The name tags scan the closest cushion and the position of the cushion to determine if a person’s posture is sitting or standing. The IMU inside the name tag on the chest can accurately determine the person’s position on the cushion. However, if two persons sit down on the cushion at the same time, the RSSI value will be affected by the human body. Because the distance between their cushions is too close, both persons will be positioned on the same cushion as shown in Fig. 19.
Fig. 19.
The web monitoring of the location of the personnel.
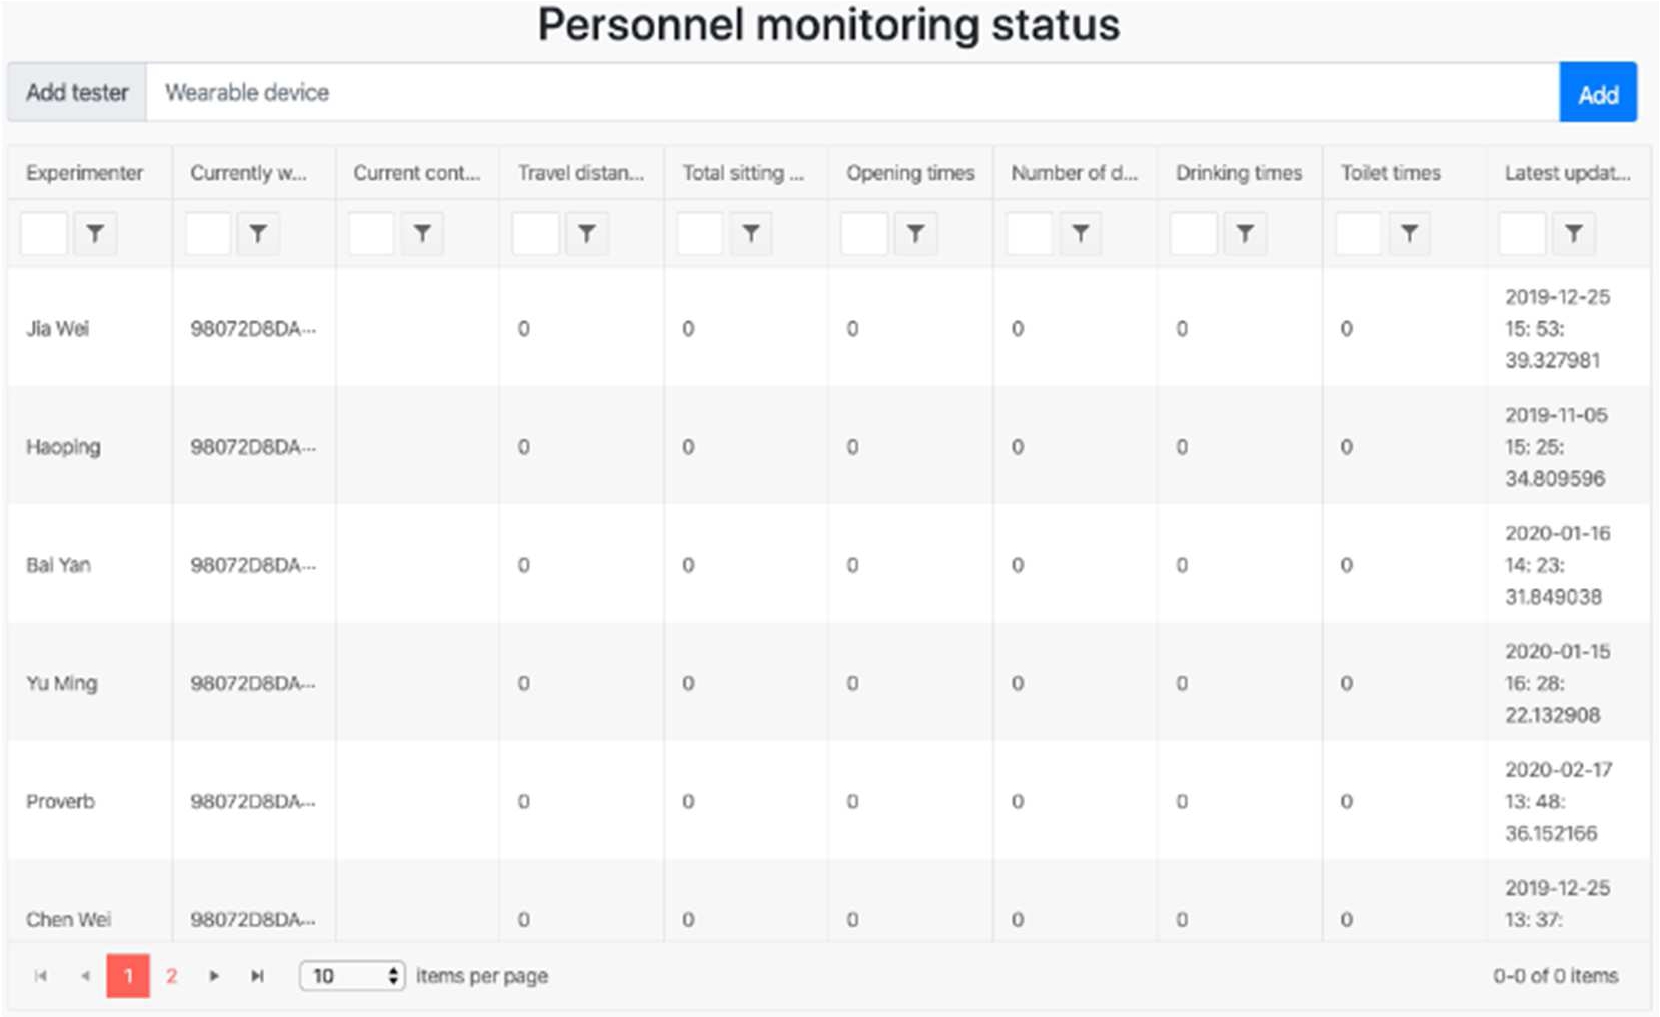
The caregiver can know the real-time behavior status and location of the elderly when they use the equipment by online monitoring. One purpose of the IoT healthcare system is to let the caregiver obtain a variety of information from the equipment used by the elderly including the equipment name, equipment type, MAC address, latitude, longitude, behavior mode, number of data, establishment time, and latest update time as shown in Fig. 20. Figure 21 shows the status of personnel monitoring, including moving distance, total sitting time, numbers of door opening, numbers of drawer opening, number of water drinking, and number of toilet visits. The most important thing is to check which equipment the person is currently touching, position determination and behavior mode of the person in real time.
Fig. 20.
Equipment monitoring status.
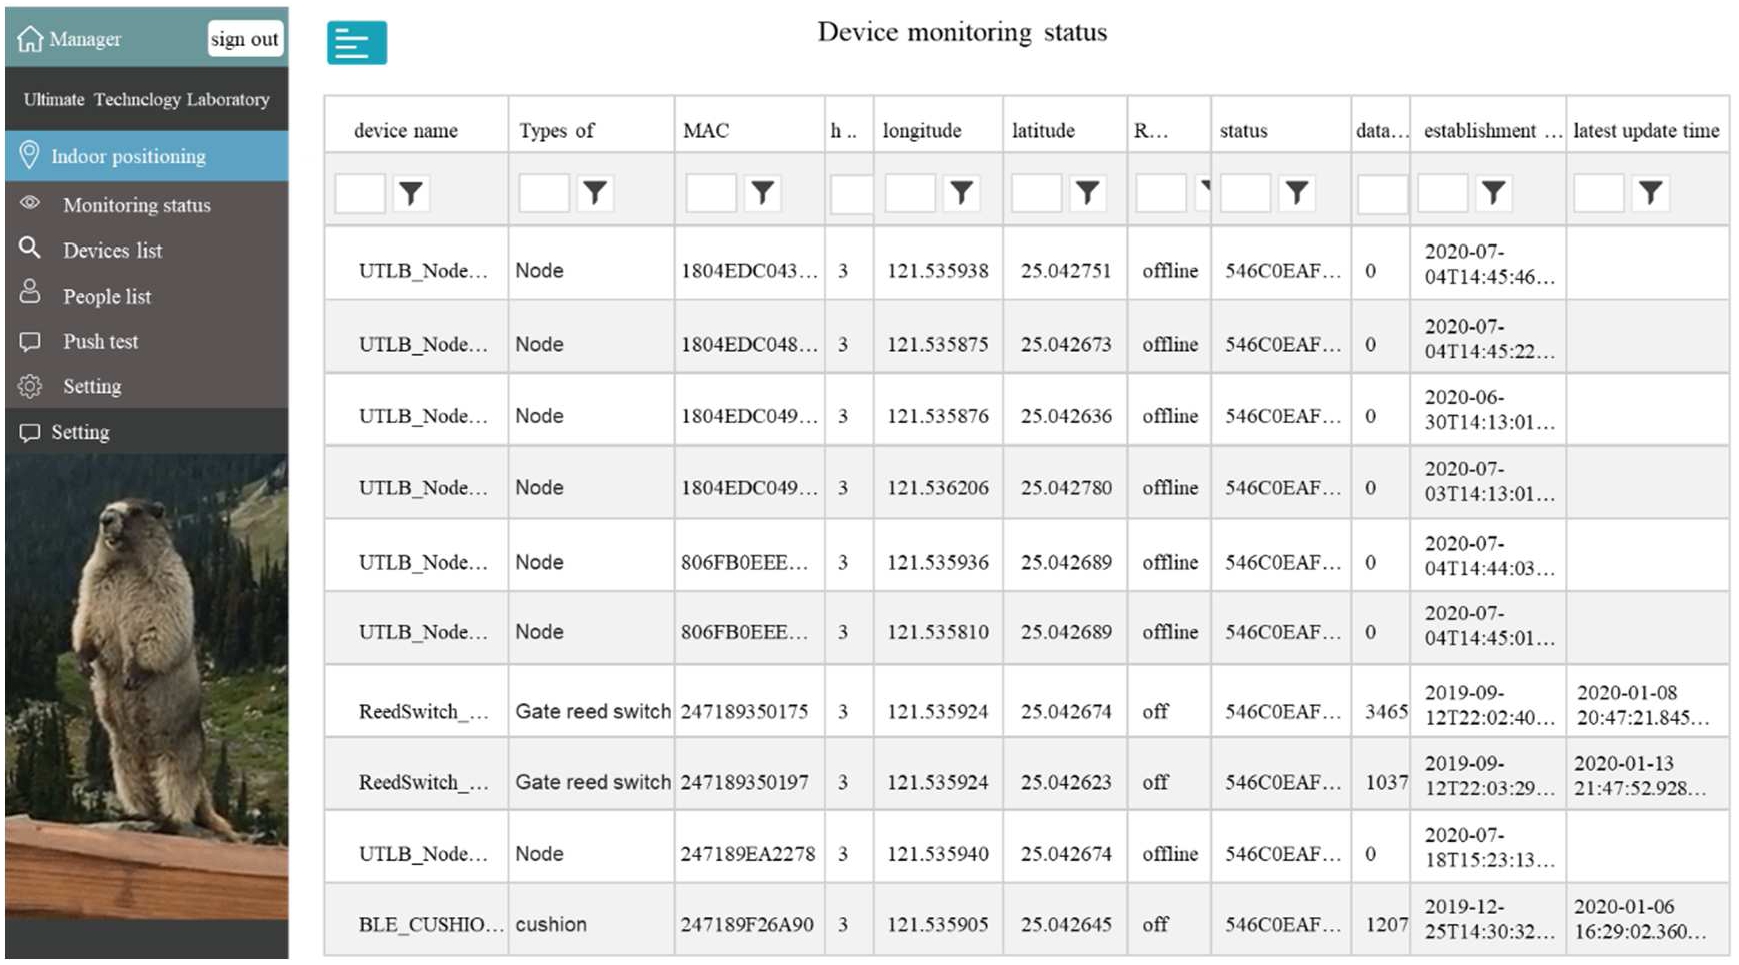
Fig. 21.
Personnel monitoring status.
When an aging people fall, the web page could show the location of the fall event. And the app of mobile device will connect to the Firebase project to push a notification to inform the caregiver through Cloud Messaging. This allows the caregiver be able to immediately help the elderly that has fallen, as shown in Fig. 22.
Fig. 22.
Online monitoring of fall event and the message notification.
4.4.2.Database analysis
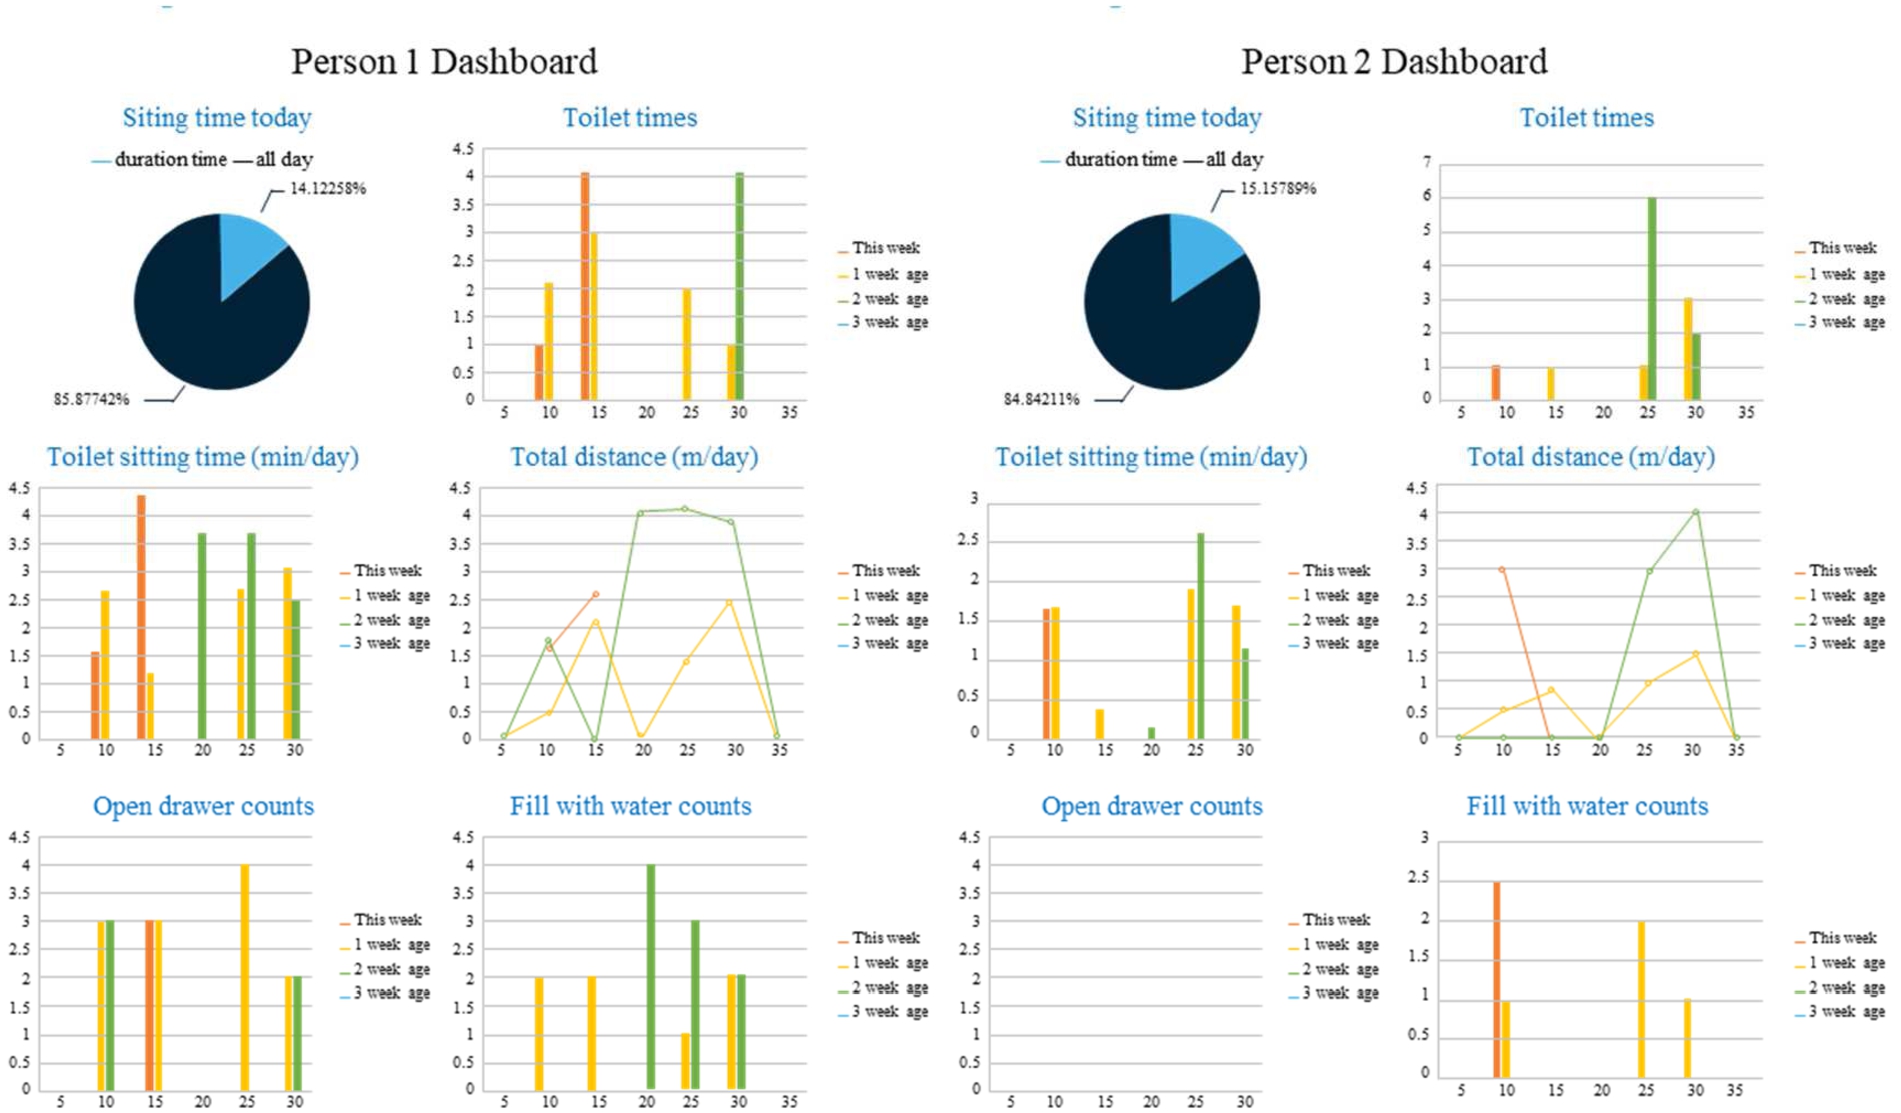
This research utilized Firebase as its cloud database. The data uploaded from all the wearable and fixed devices is made into a historical data table to help the caregivers to monitor health status of the elderly. Figure 23 show a three-week record of the experiment, a fixed time of 5 h per day, red for this week, yellow for one week ago, and green for two weeks ago. The recorded information includes the total daily sitting time, total daily moving distance and the frequency of going to the toilet, drinking water, drawer opening. The caregivers can monitor the real-time behavior status of the elderly and analyze their daily activity pattern. For example, the caregiver can know how much time the elderly has been seated in a day from the pie chart on the upper left, and frequency of drinking water and going to the toilet.
Fig. 23.
The dashboard of two of the experimenters.
This research utilize Google’s Cloud Data Studio to create custom visual effects and convert a large amount of data into concise and clear visual content as shown in Fig. 24. The statistical data include the average number of falls, average moving distance, average total time spent on sitting, average frequency of water drinking and going to the toilet in one day. The caregivers can use it to observe the daily activity pattern of the elderly person they care.
Fig. 24.
Statistically analytic data of the activity mode.
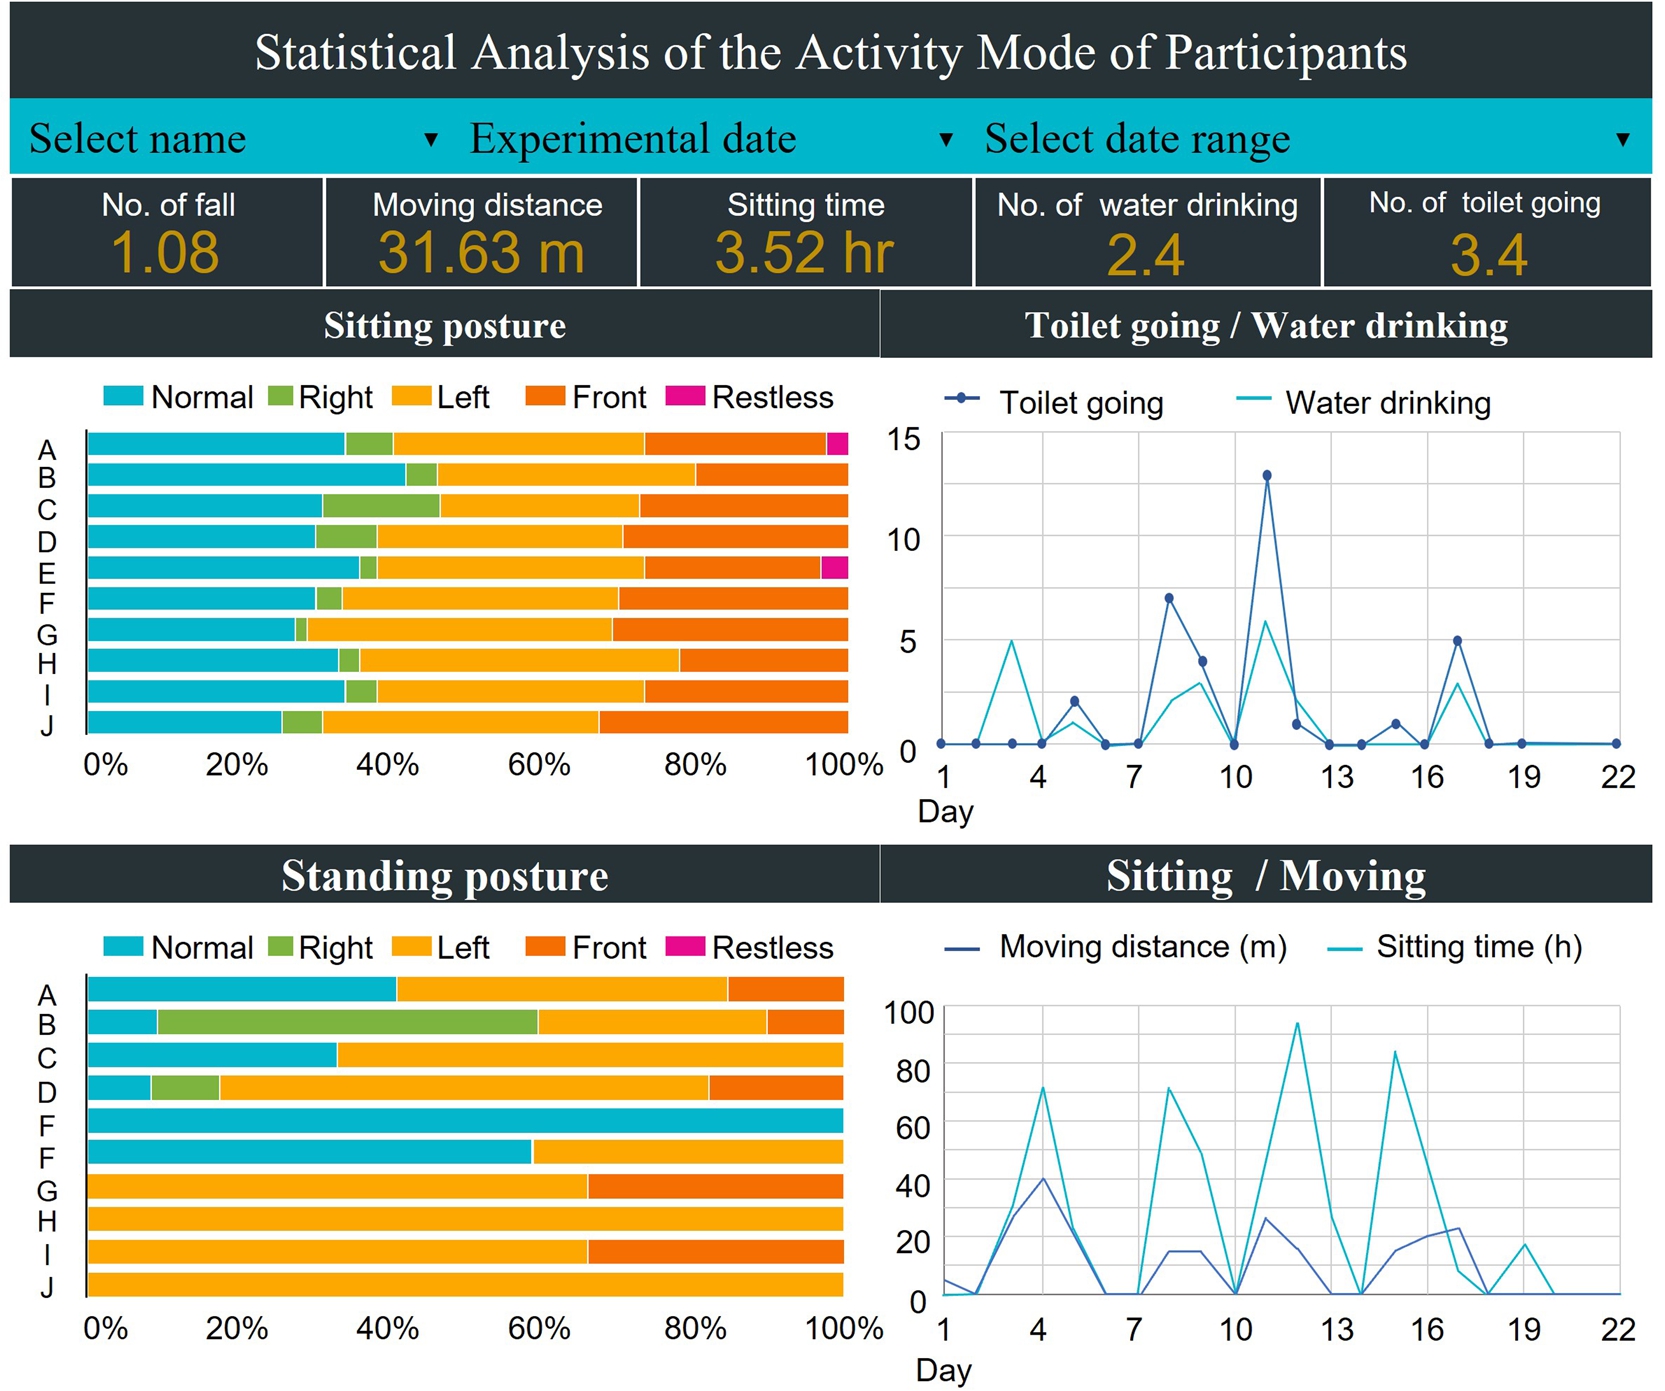
In this study, the experimental data was collected 5 h per day These data show that the experimenters spend most of the time 3.52 h (70.4%) sitting on a chair. The average daily moving distance is 31.63 m. The upper left stripe chart is the distribution map of sitting postures. The blue stripe represents a normal sitting posture, the green stripe represents a bias of the COP to the right, the yellow stripe represents a bias to the left, the orange stripe represents a bias to the front, and the purple stripe represents a restless state. The lower left stripe chart is the distribution map of standing postures. The color status of the chart is the same as above. It can be observed that the COP of the person standing on the pedal mat deviates to the left. The experimenters drink water 2.4 times per day, and the frequency of going to the toilet is 3.4 times per day.
4.4.3.Data ETL (extract-transform-load)
In order to obtain long-term daily activity pattern of the elderly, we periodically output the people-records, tag-records, and device-records data of the object database through Cloud Dataflow and Cloud DataPrep to set the data recipe as shown in Fig. 25. And then we use the Dataprep’s graphical interface to perform data cleaning, merging, labeling, and other data preprocessing actions, as shown in Fig. 26. Finally, we output the analytic results of personal activity pattern into Bigquery database and Cloud Data Studio to link output visual report as shown in Fig. 24. The people-records data contain the mac address of the wearable device on the experimenters; tag-records data contain the tag’s mac address, the mac address of contacted devices, and positioning coordinates. Device-records include the device’s mac address and the contacted event type. We can combine the above three types of historical data records through the above-mentioned ETL data transposition to obtain the long-term who-when-where-which features and information of long-term activity pattern. Figure 25 show the setup interface of the Dataprep recipe. Figure 26 presents a web-based, serverless, NoOps, intelligent data service to visually perform exploratory analysis on a given dataset. It helps to explore structured and unstructured data to be further processed for machine learning, reporting dashboards, and analytical frameworks.
Fig. 25.
The setup interface of dataprep recipe.
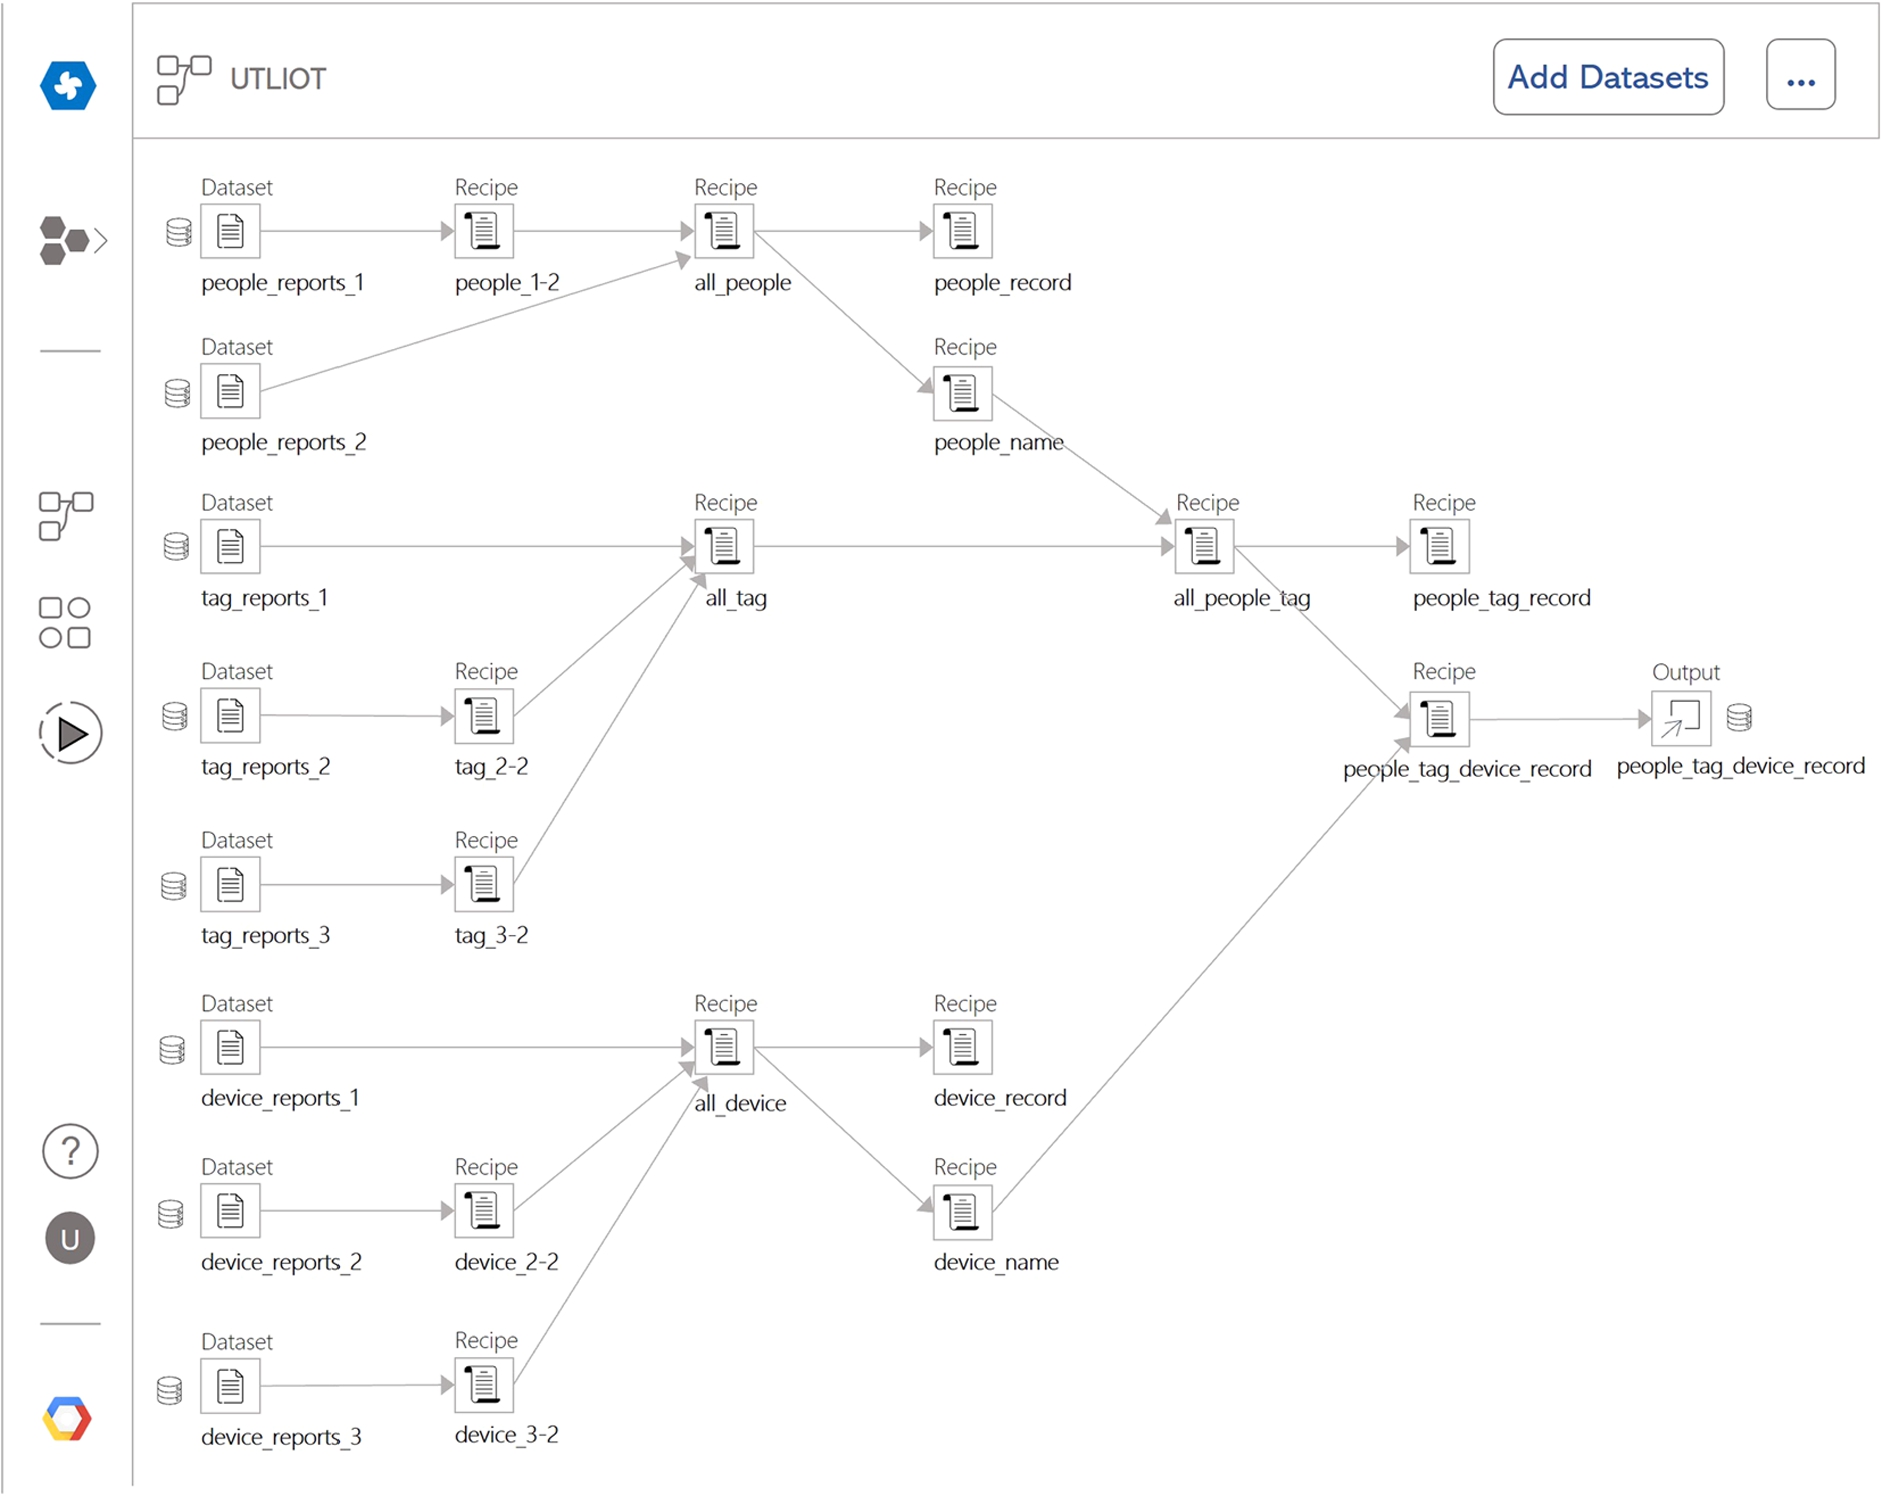
Fig. 26.
The processing interface of dataprep data.
The advantage of the design of our system is that data can be passed through the fixed DataPrep recipes. Historical data can be ETL repeatedly stored in Bigquery to accumulate a huge mass of big data. There is no need to perform data preprocessing all the time. The Data Studio reports are continuously updated through the BI engine and Structured Query Language (SQL). In addition to passing through the filter of the Data Studio, we can easily search for any individual or data on specific dates and time intervals for analysis.
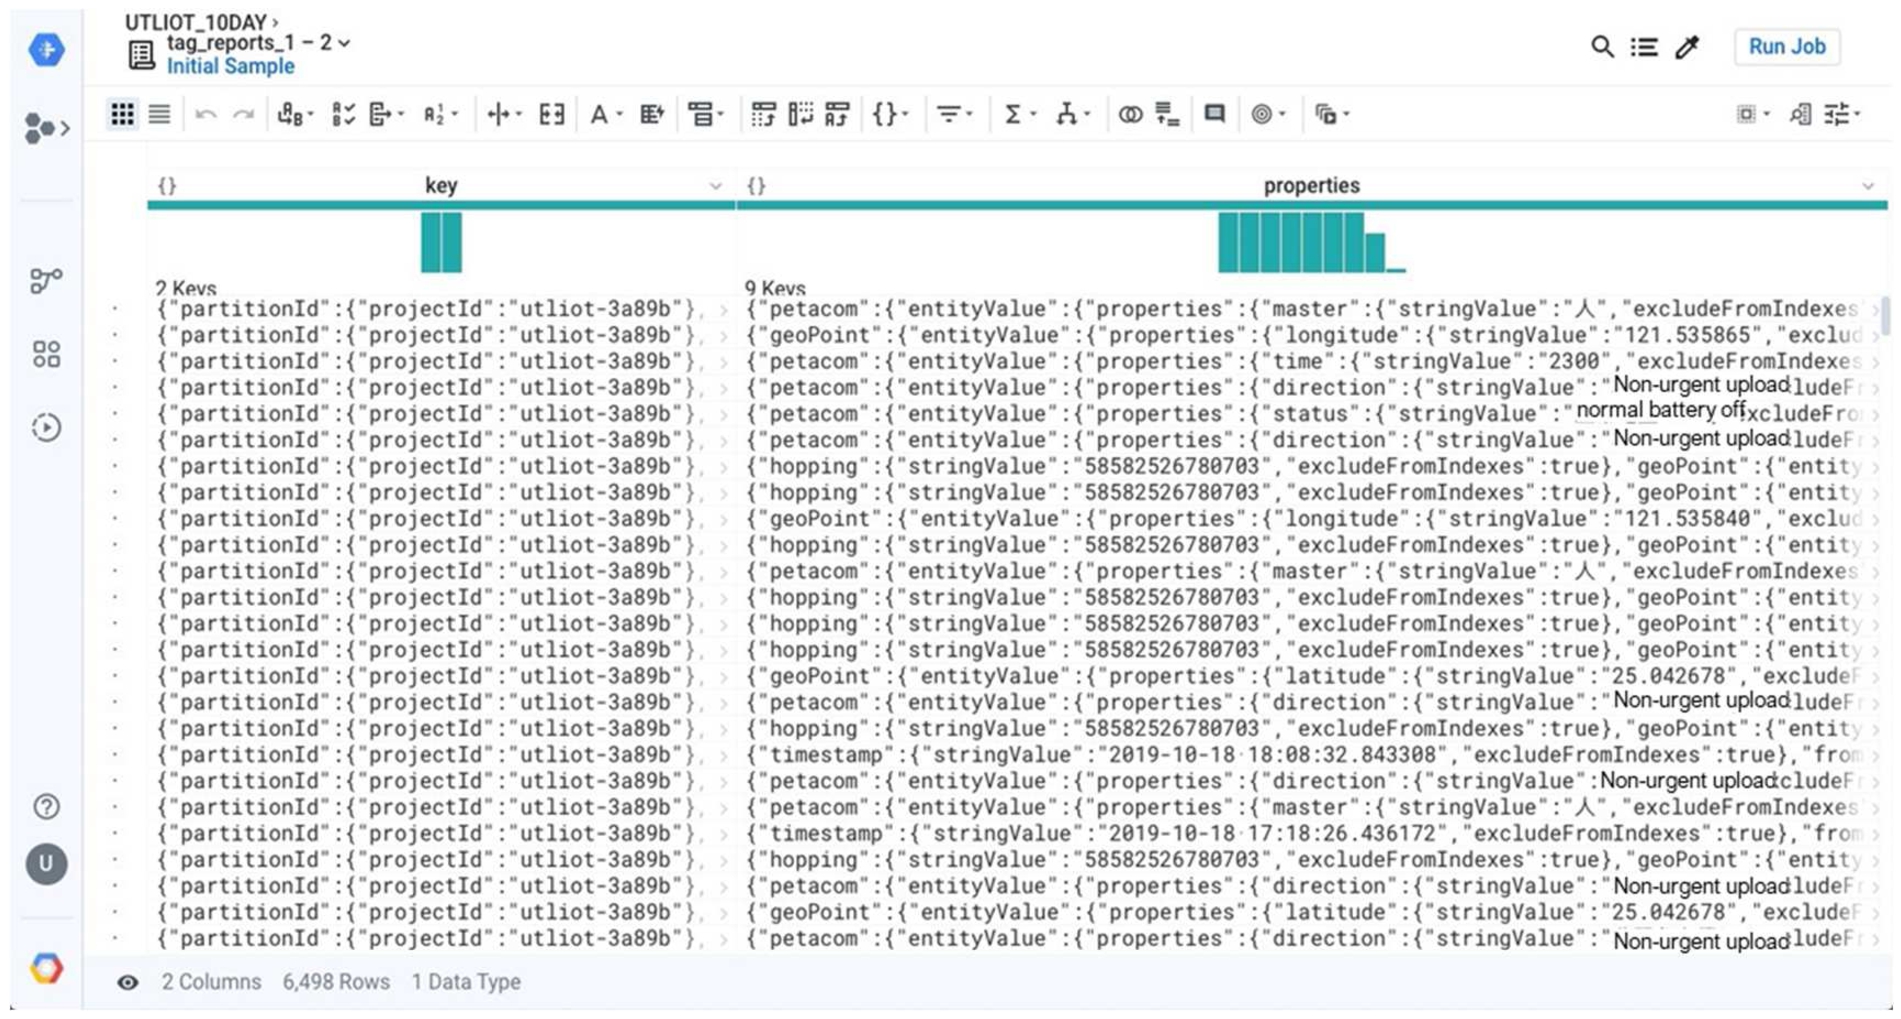
According to the experimental results, it was found that 2 persons (10%) were often restless. On the average, each person had a sitting time of 3.52 h, going to the toilet 3.4 times, drinking water 2.31 times, and walking distance of 31.63 m in 5 h per day. If a person shows an abnormal day activity pattern, timely referral to a doctor will be indicated by more tag positioning and the historical data from the device as shown in Fig. 27. For each experiment, a large quantity of data were collected including the wearable device’s mac addresses, contact device’s mac addresses, corresponding event actions, positioning coordinates, and event time. Figure 28 shows that the detailed daily activity mode such as door opening, refrigerator opening, going to the toilet and fall event 5 h in one day.
Fig. 27.
The detail of tag-records data.
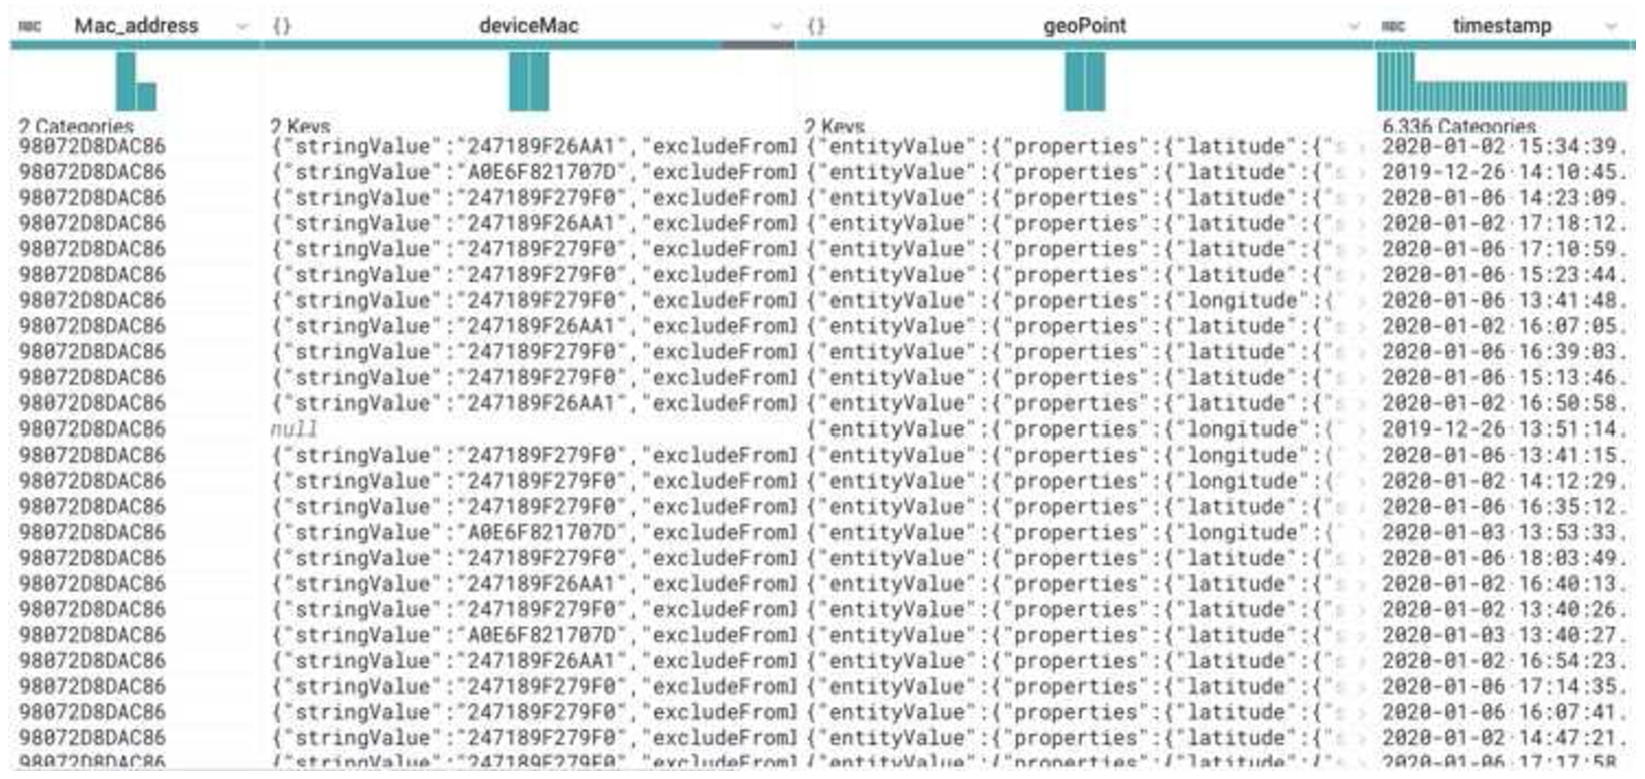
Fig. 28.
Detailed daily activity mode of the experimenters.
The development cost for the building infrastructure our experiment conducted is 1050 USD plus monthly $35 GCP (Google Cloud Platform) cloud costs. The detailed is shown in Table 3.
5.Conclusion
With the increase in the aging population all over the world, the healthcare system is facing a big challenge to provide adequate healthcare to the elderly. No matter the aging people stay at home or at nursing center, information technology can provide a better quality of healthcare for them. A healthcare system with IoT application is a network of interconnected sensors that can monitor the health status of the elderly in real time.
The primary aim of the IoT-based smart healthcare system we develop is to provide a solution for a good quality of healthcare for the elderly. Actually, the system is also suitable for the people of all ages but is most helpful for the aging people. Because the elderly population is soaring and fall remain the main cause of injury leading to the need for hospital admissions among them. Generally speaking, the higher the regularity of life of the elderly, the better their health. Elderly people with chronic diseases often experience a gradual deterioration in their health. Whereas our system is able to detect the health status from the changes in their daily life habit. Life habits can be known from their behavior mode in daily life. Our system can accurately determine the behavior mode of the elderly by the sensing information from a series of integrated sensors. In addition, falls are not an uncommon injury for the elderly. With the name card-type IMU placed in the chest pocket, we can effectively detect fall events for the elderly, as well as their behavior mode such as standing, sitting, and walking. Coupled with the application of the seat cushion pressure sensor, if a stress state is sensed, it represents that user is seated. If the seat cushion changes from a stress state to an unstressed state, it can determine that the user is changing from a sitting posture to a standing posture. Therefore, the accuracy of the behavior determination can reach 100%. The seat cushion adopts an array type capacitive pressure sensing cushion, it can effectively determine whether the user’s sitting posture is good or poor. In addition to the pressure-sensing seat cushion, there are also pressure-sensing pedal mats that can detect whether the user is standing in front of certain furniture such as a urinal or washbasin and thus determining the user is urinating or washing hands. It can also detect the standing balance of users, which can predict the risk of falling.
One of the advantage of our proposed healthcare system is that it not only can be installed in a building, such as nursing center, but also be suitable for a home environment. For the home environment, the installation of healthcare system can be slightly modified. The home environment is relatively free of Bluetooth devices and does not have many electromagnetic devices that will interferes the signal transmission just like in the factory, so the number of Nodes can be reduced to one per area or per room. There is not much space at home and the transmission distance of the Bluetooth 5.0 is quite long. Thus there is no need to install MESH, which is suitable for large areas such as nursing centers and factories. In the home environment, the fixed sensor needs to be installed on the various furniture, and its latitude and longitude height can be set on the map. In our system, if the user have the name card type IMU on their body and coupled with the LBMN, the approximate location of the indoor personnel can be determined. If the fixed contact sensor is replaced with a factory equipment sensor, the equipment of the factory and the activities of personnel can be monitored at the same time. Therefore, the LBMN system can be widely used in various places and field.
Table 3
The development cost in our experiment
| Items | Unit price (USD) | Quantity | Total price (USD) |
| Name tag with IMU | 15 | 2 | 30 |
| Pressure-sensing | 50 | 5 | 250 |
| seat cushion | |||
| Pressure-sensing | 50 | 3 | 150 |
| pedal mat | |||
| Magnetic reed switch | 20 | 8 | 160 |
| bNode | 35 | 6* | 210 |
| bwRouter | 100 | 1 | 100 |
| GCP cloud** | 35/per month | ||
| Total cost | 1050+ 35/month |
*One bNode is installed per room. **Monthly GCP cloud cost is $35.
At present, the latest positioning system is mainly UWB (Ultra Wide Band). But the cost is higher and the installation is more complicated. Besides, there are many shortcomings of UWB, such as shielding effects. The cost of our position system is much lower compared to the latest positioning one. In addition, our system is installed more easily. The advantages and disadvantages of UWB are described on the following two conditions: (1) In order to locate UWB, at least three anchors is needed to be set in each room, and there should also be a tag on the person, so the cost is not low. Besides, if positioning accuracy is required, the prerequisite is that LOS environment should not be too complicated. In addition, if positioning accuracy is required, the prerequisite is that LOS environment should not be too complicated. If there is NLOS, more complicated calculations are required [5,16,20]. (2) If positioning accuracy is not required, only one UWB is needed. If wearable device is not worn, the user’s posture is determined by the DOPPLER effect and deep learning algorithm, which requires the user to have a specific angle and must be quasi-static. Besides, it is not easy to obtain physiological signals at the same time. Although it claims to be able to detect respiratory rate and heart rate, the prerequisites are that the anchor can face the user’s face and chest. If the shielding effect occurs, for example, the user is turning around; the user must be in static status. It means that walking, talking, shaking head or hands movements cannot be effectively distinguished. That is to say, walking, talking, shaking head or hands movements cannot be effectively distinguished. And the physiological signals may not be continuously and effectively obtained. Not to mention the measurement of blood oxygen saturation, the direction, strength and dynamic posture of the fall, etc. In addition, if there are pets, visitors or more than one person in the same room, it is impossible to identify who is who. Furthermore, it is not easy to identify the risk of falling at all, let alone effectively identifying the behaviors. The behavior is related to what the furniture the user is utilizing, thus accurate indoor positioning is required. As a result, the software and hardware must be used, thus lead to the soaring cost. Under this circumstance, UWB does lose its advantage. It is impossible to use only the DOPPLER effect of UWB as to determine whether the user is doing exercise, or whether the posture of the movement is in balanced or imbalanced status.
The weaknesses of our system are as follows: (1) Users need to remember to wear a name card IMU. If it is not worn, the cloud cannot receive valid data at a fixed time that lead to the value of the IMU does not change. At this time, the user needs to be notified by using mobile phone to wear the name card IMU. (2) When the power of the name card type IMU is insufficient, the cloud will notify the user to replace the battery, or to replace another name card type IMU with sufficient power. (3) Name card-type IMU and pressure-sensing mat are not waterproof. (4) For areas with more complex compartments or more electromagnetic interference, the system needs to install more bNode so that the MESH can run more smoothly. (5) Once the contact switches such as seat cushions, pressure-sensing pedal mat, and magnetic reed switches are set in the field, they need to be fixed. And the battery should be replaced according to the notification of insufficient power. The experimental data was collected only for 5 h per day. If the experiment is extended to 24 h per day, the results will reflect a more complete daily behavioral pattern and provide more information to show the relationship between daily activity pattern and the health status.
Our IoT-based smart healthcare system is able to provide a solution for early detection of health risks to the elderly. However, it is not without limitations: (1) The fixed tag in our system usually uses batteries for power supply. Although it adopts power saving mode, it will notify the cloud through MESH when the power is insufficient. The battery still needs to be replaced every six months to one year. (2) The cost of pressure-sensing seat cushion is more than 80 US dollars, thus it still cannot be installed on every seat due to the high cost.
The highlights of our main contribution are as follows: (1) We established the first built-in latitude and longitude data on the Bluetooth fixed tag, fixed node, and router, through the Bluetooth broadcasting to achieve efficient Bluetooth MESH. (2) Each communication node in MESH has built-in absolute latitude and longitude. Therefore the three-point positioning service can be directly provided through broadcasting without requiring extra hard hardware such UWB. (3) The absolute indoor position of the users (including personnel, pets or robots) wearing mobile tags can updated at any time. Therefore, the location-based service can be provided as long as it is integrated with the electronic map on the cloud. For example, if an aging people falls, the absolute position of his fall can be shown on the cloud. Thus the rescue people can directly and quickly arrive at the position of his falling to provide an instantaneous help. (4) A variety of touch sensors (fixed tags) integrated with Bluetooth MESH can increase the positioning accuracy of user and identify behavior mode of the user at the same time. (5) Although UWB can provide accurate positioning, it is impossible to accurately determine the behaviors of such as standing, sitting, opening doors, opening drawers, and opening refrigerators
Our smart IoT-based healthcare system uses BLE devices to automatically sense the surrounding environment. The system can determine the health status, activity recognition and behavior pattern of the elderly through an indoor positioning method and a variety of wearable and fixed sensors. Physiological information is collected from the interconnected IoT-based devices and transmitted to a cloud database for storage and analysis. The information consist of daily behavior pattern of the elderly, such as the times of going to toilet, the times of drinking water, fall event, moving distance, sitting time, number of drawer opening, number of door opening in one day. Caregivers or family members can get the information via a remote monitoring function of an app on their smartphones and a web page on a computer in real time. The caregiver or family members can take preventive measures to avoid the occurrence of adverse events if necessary. The above behavior patterns were stored in the cloud database. The long-term daily life activity pattern of the elderly can be provided to the doctor for regular health evaluation and necessary management. If the behavior pattern of the elderly is very different from that in the past, the system can broadcast care reminders to notify the caregiver or their families to take appropriate actions. In our smart healthcare system, when the COP on sitting of an aging people on the seat cushion is deviated to the left or right and it is determined as poor sitting posture. Prolonged poor sitting posture might lead to the occurrence of back pain, scoliosis or even herniated intervertebral disc disease in the future. The analyzed information collected by the interconnected devices can assist the doctors with correcting poor sitting posture of the elderly to avoid developing long-term adverse consequences. Except for determination of sitting posture, the seat cushion can also make emotional judgment. For example, if the sitting posture is constantly changed within a short period of time, it might imply that the person is restless. In our experiment, it was found that 2 persons (10%) were often restless. This could be as assumed that the person is anxious or irritable and timely referral to a medical specialist is indicated. A person stands on the pedal mat and the standing posture can be determined as forward, backward, rightward, or leftward by the system. If the standing posture changes several times within a very short duration, it may infer that the person might have certain health problems such as muscle weakness due to illness or sarcopenia. The amount of physical activity can be checked by our system. If the elderly spends too much time sitting, the seat cushion will send a notification to inform the caregiver. In our search, the experimenters spend most of the time (70.4%) sitting on a chair. Besides, the average daily moving distance is just 31.63 m in 5 h during the day. The sedentary lifestyle is harmful to the health. It is good to periodically stretch the body, stand, or walk instead of sitting for a long time. Modern office workers always have long sitting time even for 7 to 8 hours a day. If there is no regular exercise, not only obesity will come to the door, but also the severe heath threat such as heart disease, stroke, diabetes and metabolic syndrome will be increased. All of these abnormal behavior patterns could be detected by our smart healthcare system. If a given person shows an abnormal pattern or be very different from that in the past, timely referral to a doctor is necessary. It efficiently assists in nursing care for the elderly, lead to higher quality care, and ensures safety for them.
Our study uses the BLE as the main axis, interconnecting with the light source IoT, wearable devices, seat cushions, pedal mats, and magnetic reed switches to construct a two-way communication system for the LBMN. All the devices are integrated for accurate positioning. The activity recognition and daily behavior pattern of the elderly can be obtained by analyzing the cloud database. The system employs algorithms which can detect falling accident once it occurs suddenly. Whenever an emergency event occurs, the system will notify the caregivers immediately, who can then assist the elderly to deal with these adverse situations. The system can increase family members’ willingness to care for the elderly at home. Moreover, patients staying in nursing care centers can also benefit from this smart system. The modality of disease risk prediction collects data via wearable devices, uploads the data to the cloud through a network, and analyzes the results based on big data-based algorithms. The result of the prediction is then sent to the caregiver or doctors in real time through an app on a smartphone or a web page on a computer. Big Data Analytics play a crucial role in the healthcare field. It is mostly used for providing a more efficient healthcare. We adopted the PaaS to obtain, store, and analyze the health data generated from the interconnected devices. Long-term follow up of big data analysis can reveal more detailed lifestyle pattern, and the social relationships of the elderly. The proposed system supports the healthcare provider with the analysis of the collected data, enabling early detection of the development of a health disorder in the future. It also has the potential to improve efficiency in delivering healthcare, and increase the positive outcomes for patients. The results of our experiments verify the system’s feasibility and point to future development directions.
Conflict of interest
None to report.
References
[1] | A. Athira, T.D. Devika, K.R. Varsha and S.S. Bose, Design and development of IOT based multi-parameter patient monitoring system, in: 2020 6th International Conference on Advanced Computing and Communication Systems, (2020) , pp. 862–866. |
[2] | M. Donati, A. Celli, A. Ruiu, S. Saponara and L. Fanucci, A telemedicine service platform exploiting bt/ble wearable sensors for remote monitoring of chronic patients, in: 2018 7th International Conference on Modern Circuits and System. |
[3] | H. Drew, The trouble with the Internet of things, G. L. A. 10: ((2015) ), 1–12. |
[4] | B. Eric, 21 open source projects for IoT, Linux com 23: ((2016) ), 21–30. |
[5] | M. Hämäläinen, L. Caputo, L. Biotti, L. Marabissi and G. Patrizi, Ultra-wideband radar-based indoor activity monitoring for elderly care, Sensors 21: ((2021) ), 3158. doi:10.3390/s21093158. |
[6] | Internet of Things Global Standards Initiative, ITU, 2015. |
[7] | D.M. Jeya Priyadharsan, K. Kabin Sanjay, S. Kathiresan and K. Kiran Karthik, Patient health monitoring using IoT with machine learning, International Research Journal of Engineering and Technology 6: ((2019) ), 7514–7520. |
[8] | S. Lee, L. Wang and Q. Fang, A low-power RFID integrated circuit for intelligent healthcare systems, IEEE Trans. Inform. Technol. Biomed. 14: ((2010) ), 1387–1396. doi:10.1109/TITB.2010.2053942. |
[9] | Y. Lu and C. Lin, The study of smart elderly care system, Eighth International Conference on Information Science and Technology (2018), 483–486. |
[10] | R. Margaret, Internet of things (IoT), IOT Agenda 14: ((2019) ), 28–42. |
[11] | C. Min, L. Wei, H. Yixue, Q. Yongfeng and H. Iztok, Edge cognitive computing based smart healthcare system, Future Gener Comput Syst 86: ((2018) ), 04. |
[12] | S. Pirbhulal, W. Wu, S.C. Mukhopadhyay and G. Li, A medical-IoT based framework of e-health care, 2018 International Symposium in Sensing and Instrumentation in IoT Era (2018), 1–4. |
[13] | M. Prince, R. Bryce, E. Albanese, A. Wimo, W. Ribeiro and C. Ferri, The global prevalence of dementia: A systematic review and metaanalysis, Alzheimers Dement 9: ((2013) ), 63–75. doi:10.1016/j.jalz.2012.11.007. |
[14] | M.R. Ruman, A. Barua, W. Rahman, K.R. Jahan, M. Jamil Roni and M.F. Rahman, IoT based emergency health monitoring system, in: 2020 International Conference on Industry 4.0 Technology, (2020) , pp. 159–162. doi:10.1109/I4Tech48345.2020.9102647. |
[15] | T.M. Siham Sayeed, M.T. Rayhan and S. Chowdhury, Bluetooth low energy based portable medical sensor kit platform with cloud connectivity, in: 2018 International Conference on Computer, Communication, Chemical, Material and Electronic Engineering. |
[16] | G. Tiberi and M. Ghavami, Ultra-wideband (UWB) systems in biomedical sensing, Sensors 22: ((2022) ), 4403. doi:10.3390/s22124403. |
[17] | World Population Ageing, Highlights, Department of Economic and Social Affairs, United Nations, 2015. |
[18] | Y. Wu, A. Beiser and M. Breteler, The changing prevalence and incidence of dementia over time – current evidence, Nat. Rev. Neurol. 13: ((2017) ), 327–342. doi:10.1038/nrneurol.2017.63. |
[19] | G. Yang, A health-IoT platform based on the integration of intelligent packaging, unobtrusive bio-sensor, and intelligent medicine box, IEEE Trans Ind. Informat. 10: ((2014) ), 2180–2191. doi:10.1109/TII.2014.2307795. |
[20] | Y. Zhang and L. Duan, A phase-difference-of-arrival assisted ultra-wideband positioning method for elderly care, Measurement 170: ((2021) ), 108689. |


