
Indoor air quality prediction systems for smart environments: A systematic review
Abstract
Air quality is a critical matter of concern in terms of the impact on public health and well-being. Although the consequences of poor air quality are more severe in developing countries, they also have a critical impact in developed countries. Healthcare costs due to air pollution reach $150 billion in the USA, whereas particulate matter causes 412,000 premature deaths in Europe, every year. According to the Environmental Protection Agency (EPA), indoor air pollutant levels can be up to 100 times higher in comparison to outdoor air quality. Indoor air quality (IAQ) is in the top five environmental risks to global health and well-being. The research community explored the scope of artificial intelligence (AI) in the past years to deal with this problem. The IAQ prediction systems contribute to smart environments where advanced sensing technologies can create healthy living conditions for building occupants. This paper reviews the applications and potential of AI for the prediction of IAQ to enhance building environment and public health. The results show that most of the studies analyzed incorporate neural networks-based models and the preferred evaluation metrics are RMSE,
1.Introduction
Air quality not only has a material responsibility in human exposure to pollutants but is also crucial for specific groups such as older adults and people with disabilities [121]. Numerous research studies state the adverse health effects associated with poor air quality levels, such as premature death, respiratory, cardiovascular disease along with a relevant increase in asthma attacks, dementia, and cancer [112,128,130]. Poor air quality concentration levels are responsible for 3.2 million deaths worldwide [128,130]. The consequences of poor air quality are most severe in developing countries where there is no regulation to control pollutant emissions. However, air quality levels are also a problem in developed countries. Every year in the USA, approximately 60,000 premature deaths are reported and linked to reduced air quality levels. Moreover, the healthcare costs related to air quality diseases reach $150 billion [87]. According to the European Environment Agency, air pollution was responsible for 400,000 premature deaths in the European Union (EU) in 2016. The particulate matter caused 412,000 premature deaths in 41 European countries, and 374,000 occurred in the EU [36]. Moreover, the cost related to the air pollutant emissions caused by industrial facilities in the EU was estimated at around €59 to 189 billion in 2012 [51]. The Environmental Protection Agency (EPA) stated that indoor pollutant levels could be up to 100 times higher when compared with outdoor air quality. Therefore, indoor air quality (IAQ) is ranked as one of the top five environmental risks to global health and well-being [107]. IAQ is a matter of potential concern for the building occupants [26]. As people spend most of their time indoors, poor air quality leaves a significant impact on overall public health [8,14,17]. In particular, older adults and people with disabilities, who are the most venerable groups, commonly spend all of their time inside buildings [82]. Living environments include numerous types of spaces and locations, such as workplaces, clinics, public service centers, faculties, leisure spaces, vehicles, cabins, and outdoor locations [29]. Notably, a significant percentage of indoor environments have a high number of occupants [79]. Even in locations with good air quality, short-term exposure to pollutant levels can cause potential health symptoms to sensitive groups such as elderly and children; especially those suffering from asthma and cardiovascular problems [62,126].
World Health Organization (WHO) has developed numerous reports on IAQ [19,88,127,130]. These reports state that almost three billion of the most impoverished population in the world rely on solid fuels (crop wastes, charcoal, animal dung, wood and coal) for their everyday cooking and heating needs [129]. These solid fuels produce a considerable level of harmful gases and increase particulate matter concentration levels [72]. Repeated exposure to these pollutants can hamper the health quality of an individual. The impact of indoor air pollution (IAP) is equally high in the urban buildings as well due to excessive use of chemical-rich cleaning agents, oil-based pains, fragrant decorations, and other toxic consumer products and building elements [47,72]. Unfortunately, household air pollution caused more than 4.3 million premature deaths in 2012, mostly in middle and low-income countries [18,44,54,58,65,74]. The stats show 6% deaths due to lung cancer, 12% due to pneumonia, 22% because of chronic obstructive pulmonary disease (COPD), ischemic heart disease accounts for 26% and stroke for 34% deaths annually [129].
Ventilation arrangements considerably influence the quality of indoor air [59,67,76,93]. Numerous countries have set up new regulations for achieving adequate ventilation and IAQ in the buildings [7,35–37]. However, the starting point should be the source control and reduction of pollutants in the indoor air [1,7,10,15,52,80,94]. Several studies available in the state-of-art reveal a considerable change from open fireplaces in the residential areas to sealed modern fireplaces [28,34,117]. The new buildings are equipped with wireless communication technologies and sensors. Therefore, it becomes easier to monitor the environmental factors on a real-time basis [71].
Governments and environmental agencies have also designed new public policies to reduce pollutant exposure to the building occupants [27,41,45,118]. Although it is a reasonable response towards IAQ management, monitoring pollutant levels in the building environment on a real-time basis can be a significant step towards efficient source control and management. Furthermore, the latest technologies, such as artificial intelligence (AI) and machine learning (ML), can utilize Big Data related to pollutant levels for forecasting future conditions in the living environment [3,6,73,105]. Several researchers are also exploring the potential of the Internet of Things (IoT) for developing smart environments that could address major challenges related to IAQ, building energy efficiency and occupant comfort [39,43]. The concept of smart homes, smart factories, smart cities and smart health systems are gaining immense popularity around the world. Moreover, smart environments are mainly influenced by the combination of AI and IoT [43,110,123]. On the one hand, traditional threshold-triggered solutions can provide instant updates about critical IAQ levels. On the other hand, AI-based prediction systems can deliver prior information about upcoming critical changes in IAQ levels. Hence, building occupants can take preventive majors to avoid serious health impacts [5,125]. The research communities from the past years are exploring the potential of AI to design intelligent environments where building occupants get automatic, real-time updates about changing environmental conditions [24,95,135]. This vision has taken them to the concept of ambient intelligence that further contribute to the development of smart environments for healthy living [30,110,111]. Several researchers in the past have proposed efficient prediction systems for IAQ to improve public health and well-being [70,109,115,139,140]. These studies can enhance the daily activity level while providing better scope for ventilation arrangements. Also, these applications can assist in the development of favorable ambient assisted living systems and improved productivity levels at office premises.
In sum, IAQ leaves a considerable impact on public health and well-being. Therefore, it is a critical matter of concern for both developed and developing countries [20]. This paper reviews the application of AI for the prediction of IAQ to enhance the building environment and public health. The main objective of this work is to study the potential of AI methods for developing smart IAQ systems to enhance building environments. To achieve this, an in-depth analysis is performed on IAQ prediction systems considering features used for evaluation of pollutant levels in the indoor environment, accuracy rate of the existing systems, and prediction interval for which IAQ condition is predicted by the system. The scope of this systematic review consists of an analysis of the AI-based forecasting approach proposed by researchers from different countries with unique demographic conditions such as domestic environment, IAP variables and socioeconomic status [40,99,103].
This review will help to find answers for potential research questions while highlighting the new problem domain in which future researchers need to put effort. Moreover, this systematic review provides a detailed comparison of existing AI-based IAQ prediction systems for smart environments. It highlights the potential of the specific techniques, along with the impact of several feature extraction methods. In addition, this paper aims to summarize the findings achieved by previous studies regarding the accuracy and methods used.
The rest of this review article is structured as follows: Section 2 provides the methodology with research questions, inclusion and exclusion criteria, search strategy, study selection and risk of bias. Section 3 includes the results and discussions along with answers to the RQs. Finally, Section 4 presents the conclusion.
2.Materials and methods
This systematic review is conducted using the PRISMA (Preferred Reporting Items for Systematic Review and Meta-Analysis) methodology. This is a technique of evidence-based reporting with a minimum set of items for meta-analysis and systematic reviews. In order to address the challenges associated to IAQ prediction, the process was divided into several steps. In the first step, the relevant research questions were identified and then a search strategy developed following specific search keywords and strings. After this, the inclusion and exclusion criteria were defined to ease the selection of most relevant papers from the existing database. Next, data extraction was carried out based on the pre-defined research questions. Furthermore, the answers to these questions were given while highlighting the challenges, opportunities and limitations in the field. These steps are defined in the subsequent sections below.
2.1.Research questions
The rising number of health problems due to poor building environments is a matter of concern for government agencies and policymakers as well. It is essential to address the challenges by utilizing the latest technologies, and AI shows potential in this direction. However, future research needs to examine the critical aspects to design a more reliable solution for IAQ management. The authors in this systematic review identified essential research questions and tried to find relevant answers through this detailed study. Therefore, the research questions for this systematic review are:
(RQ1) What are the system architectures used for IAQ data collection and how is it collected?
(RQ2) What are the features or input parameters used to process the IAQ data for prediction system design?
(RQ3) What are the widely used AI methods for IAQ prediction?
(RQ4) What are the accuracies and prediction times of these methods?
(RQ5) What application domains are addressed by existing publications?
(RQ6) How can these systems be integrated into smart building systems?
(RQ7) How are the results of IAQ systems presented to the end-users?
These questions have been established by the authors to achieve the main contribution of this paper, that is to present a systematic review of AI methods used for IAQ prediction. Moreover, this paper aims to provide a comprehensive review of the main features used for the prediction, the accuracies achieved, the data collection techniques, the period of prediction, and state the future research challenges and opportunities.
2.2.Search strategy
To address the research questions, the authors have used three different databases: PubMed, IEEE and ACM. The research for relevant publications was initiated on 27th March 2020, and a filter to select studies after the year 2008 was applied. The initial search query used has the following combination of keywords: “indoor air quality AND (prediction OR forecasting)”.
In total, 235 documents were identified, out of which 159 were obtained from PubMed, 41 from IEEE and 35 from ACM database. These studies were further processed as per the inclusion and exclusion criteria.
2.3.Inclusion and exclusion criteria
All the authors independently evaluated all papers, which were selected for analysis by the cumulative agreement of all parties. The documents were analyzed to address the different methods related to the implementation of AI methods for IAQ prediction. The selection of the papers for inclusion in this review was made if the research satisfied the following eligibility criteria.
Inclusion criteria: (1) Research studies that include IAQ prediction based on methods related to AI sub-domains; (2) The information about the data used and their origin must be present in the document; (3) The paper must concern an analysis of indoor living environments; (4) The study must present at least one prediction metric; (5) The information of the indoor parameters monitored, or the instruments used must be presented in the document; (6) The research paper must be written in English and published after 2008.
Exclusion criteria: (1) Duplicate papers; (2) Publications that are secondary studies, such as reviews, study paper or demo papers; (3) Papers that do not provide clear insights about the prediction system and performance parameters; (4) Papers that are relevant to outdoor environments only.
2.4.Study selection
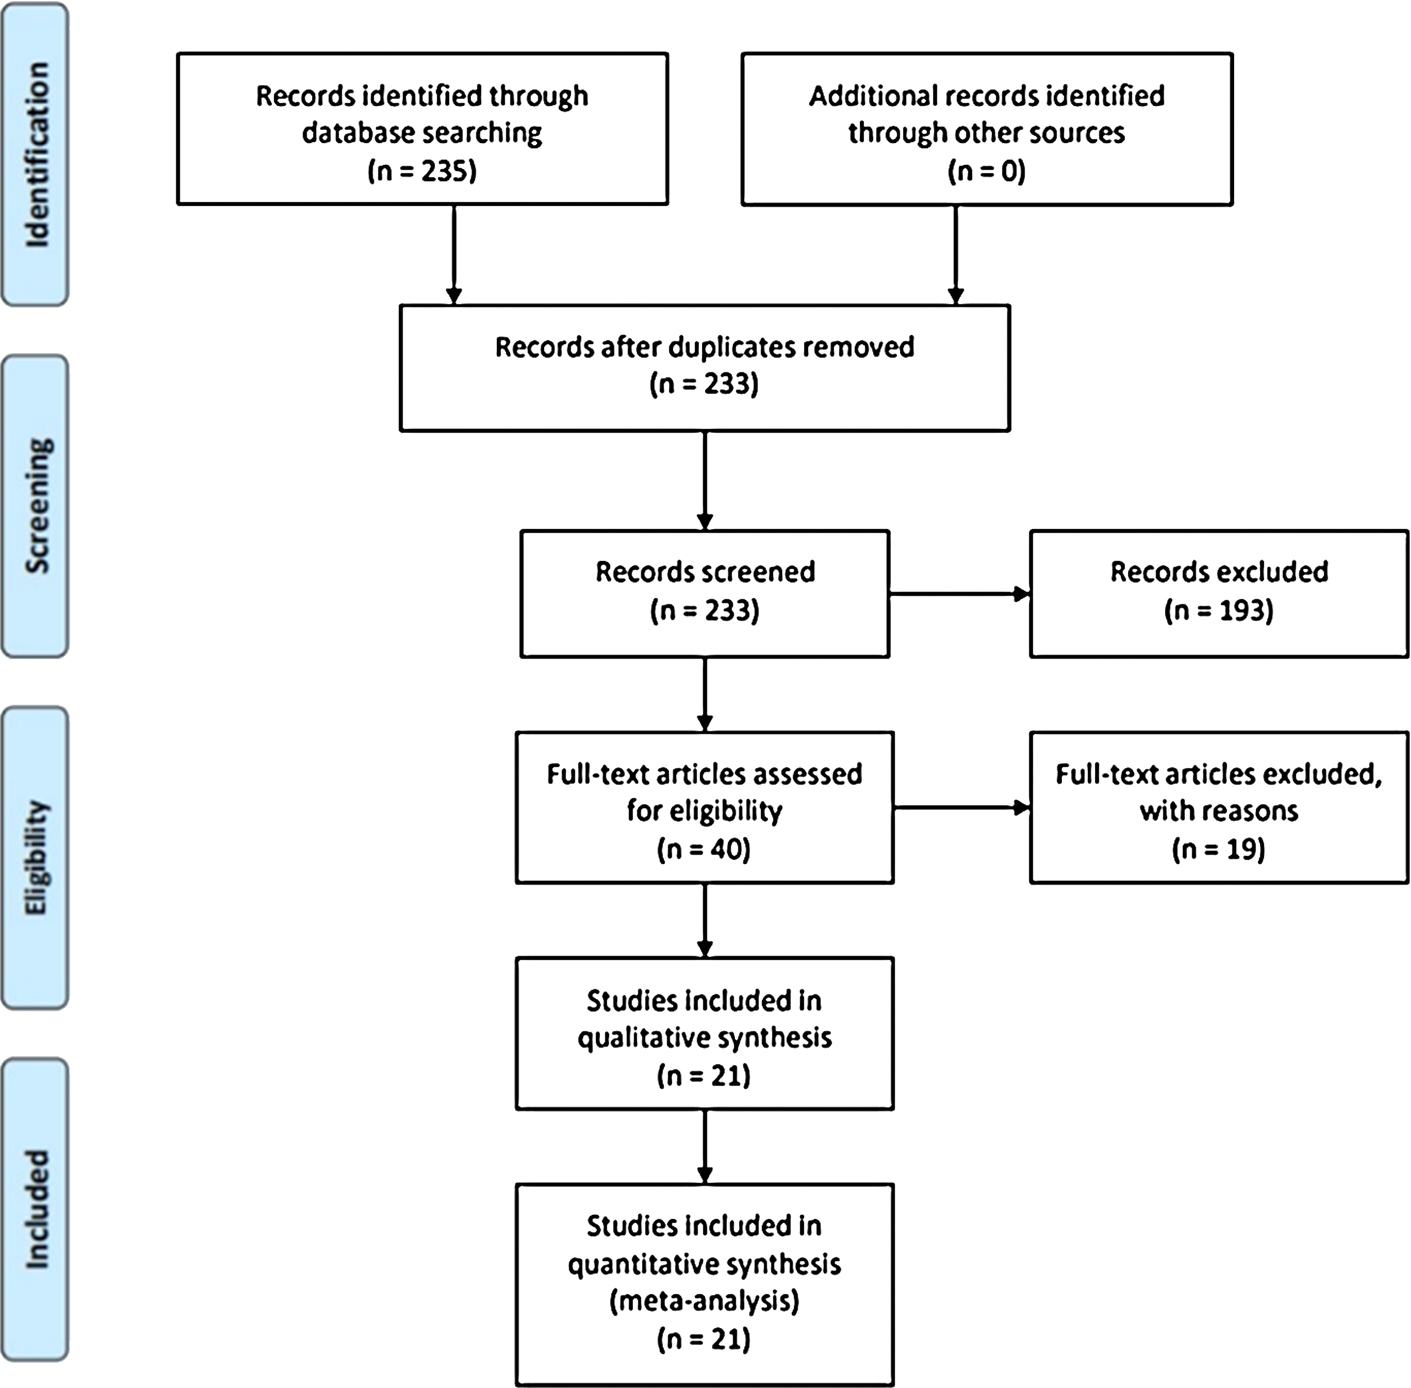
All publications obtained after applying the initial search query were analyzed as per the PRISMA guidelines. First of all, the documents were analyzed for presence of any duplicate studies and at this stage, two papers were rejected. The remaining 233 papers were transferred for a second level screening. The relevance of papers was then identified by considering the title, and abstract and 193 papers were excluded because they did not meet the specified inclusion and exclusion criteria. Most of the papers were literature reviews of the environmental science field, studies about the IAQ exposure and their effects on people’s health, studies on building-related problems, IoT and WSN architectures for IAQ supervision, research on HVAC systems and sensors, computation fluid dynamics IAQ models, IAQ prediction methods using theoretical and mathematical approaches, and were not related to artificial intelligence methods.
After applying the above-mentioned eligibility criteria, the authors obtained 40 papers for the third stage, which were studied in detail. In this list, two papers only focus on outdoor air quality [64,97], eight papers do not include any AI-specific prediction algorithms [22,31,47,50,84,91,116,122] or were based on some mathematical approaches. Three papers [12,96,137] only focused on thermal comfort (temperature and/or humidity data) or other smart building aspects instead of air quality. Moreover, two studies [89,120] were rejected because they were limited to a monitoring system design and no prediction system was implemented. One paper [9] had a relevant abstract, but the authors did not specify the prediction methods. Similarly, authors in [108] did not specify the AI method used for prediction. Therefore, these studies did not meet the first criteria for inclusion and were thus excluded. Besides this, the document presented in [124] was excluded from the study. The authors used a fuzzy control method, but the evaluation parameters such as prediction accuracy or period were not defined. Therefore, this study does not fulfil the fourth inclusion criteria. The researchers in [23] applied advanced fuzzy control theory to control IAQ and reduce energy consumption. They worked on the prediction of the Air Quality Index, and the parameters considered to control indoor environment conditions were indoor temperature, air quality and humidity. The fuzzy prediction system helped to create an energy balance between IAQ, and at the same time, energy consumption was optimized. The authors implemented real-time monitoring and concluded that the system is correct and feasible. However, this study does not provide the details in terms of prediction accuracy and period. Therefore, it did not fulfil the inclusion criteria no. 4 and was not included in the meta-analysis. Finally, this systematic review analyzed 21 papers that were relevant to address the research questions identified at the beginning of this section. Clear insights concerning the selection process as per the PRISMA guidelines are presented in Fig. 1.
Fig. 1.
PRISMA flow diagram for studies included in this systematic review.
2.5.Extraction of study characteristics
The relevant data was extracted from the selected publications for further analysis. In order to conduct this systematic review, the following information was extracted:
Author details, titles and abstracts.
Year of publication and associated database.
Focused geographical area and application.
Pollutant type, sensors used, and calibration status of sensors.
AI method used for IAQ prediction.
After data extraction, the included publications were synthesized and analyzed in detail to obtain answers for the pre-defined research questions.
2.6.Risk of bias
The main limitation of conducting a systematic review is that it is influenced by bias. The first risk of bias arises during the selection of initial keywords/string to initiate a search on database. Moreover, the subjectivity of eligibility criteria defined by authors increases bias at the screening stage. Furthermore, the search only included three databases (PubMed, IEEE and ACM). However, based on the PRISMA guidelines, the authors tried to follow the best possible criteria and procedures for completing this systematic review. Although early researchers have conducted several reviews of AI-based IAQ prediction systems [11,55,90,101], they did not consider all these relevant RQs, especially RQ2, RQ3 and RQ4. The information provided for all these relevant factors make this review a valuable addition to the scientific community.
3.Results and discussion
This systematic review includes 21 studies on AI-based IAQ prediction systems from three different databases out of which eight studies (38.09%) were included from PubMed, seven (33.3%) from IEEE and six (28.57%) from ACM (Table 1).
Table 1
Year-wise distribution of papers from the three databases
| Year of publication | PubMed | IEEE | ACM | Number of studies |
| 2008 | [113] | 1 | ||
| 2009 | [66,133] | 2 | ||
| 2012 | [114,136] | 2 | ||
| 2013 | [132] | 1 | ||
| 2014 | [24,25] | 2 | ||
| 2015 | [21] | 1 | ||
| 2016 | [134] | [119] | [38] | 3 |
| 2017 | [2,4] | 2 | ||
| 2018 | [75] | [78] | 2 | |
| 2019 | [77] | [33] | [106,131] | 4 |
| 2020 | [49] | 1 |
Table 2 summarizes the studies based on the origin of the selected papers. It can be seen that out of the included publications, six studies (28.57%) were conducted in China, four (19%) in the USA and three (14.28%) in Korea. Finally, one study each was included from other countries as mentioned in Table 2. However, no study from other developing countries such as India, Nepal and Bangladesh that are greatly affected by IAP due to inadequate ventilation arrangements were included [13,42,48,53,83,100]. As the majority of the population in these countries use biomass fuels for cooking and heating purpose, the researchers in these locations need to show an active participation in the development of some potential IAQ monitoring and prediction systems that can provide more accurate results based on specific geographic conditions and pollutant concentrations [61,85,138].
Table 2
Country-wise distribution of included publications
| Country | Reference number | Number of studies |
| China | [24,25,75,114,131,133] | 6 |
| USA | [38,113,132,134] | 4 |
| Korea | [4,66,77] | 3 |
| South Africa | [2] | 1 |
| Ireland | [21] | 1 |
| Czech Republic | [119] | 1 |
| Australia | [49] | 1 |
| Taiwan | [136] | 1 |
| Egypt | [33] | 1 |
| Switzerland | [78] | 1 |
| Denmark | [106] | 1 |
Furthermore, the synthesis process that focused on extracting relevant information from the included publications is presented in Tables 3, 4 and 5. Table 3 lists technical insights of the system designed by previous researchers, Table 4 presents details about the focus IAQ parameters, and Table 5 provides an analysis of extracted features and performance parameters of the existing systems.
Table 3
List of papers included in the study
| Reference number | Application area | IAQ parameters | Thermal comfort | Sensors used | Calibrated data input | Integrated to smart building | AI methods used | Result display method |
| [134] | Commercial building | NH3 | Temp, RH | Innova 1412 multigas model; T-type thermocouples; RH transmitter Model HX92BC; Infrared motion sensors | Yes | Yes | ANFIS | N/A |
| [21] | Office building | NO2, | Temp, RH, | EPAM 5000 Haz-Dust Monitor, Teledyne M200 Monitor | Yes | No | ANN | N/A |
| [113] | Commercial building | NH3, SO2, H2S, CO2, | Temp, RH | Mobile Emission Laboratory Gas Sampling System | Yes | No | RBFNN | N/A |
| [4] | Office building | PM2.5, CO2, VOCs, | Temp, RH, light quantity | SH-300-DS, PMS3003, SHT11, GL5537, MICS-VZ-89 | Yes | No | Gated recurrent unit | Web |
| [2] | Residential building | Not used | Dylos air quality monitor DC1100 Pro and NOVA PM Sensor SDS011 | Yes | Yes | MLP NN | Web | |
| [75] | Residential building | CO2, | Temp, RH, air velocity | TSI 8520, TSI 7515, TSI 8392A | Yes | No | ANN | N/A |
| [77] | Waiting rooms and underground platforms | Temp, RH | Telemonitoring system | Yes | No | Deep RNN | N/A | |
| [132] | Office building | CO2, VOC | Temp, RH | Custom-built measurement equipment using ELT S-100 CO2 sensor & TGS2602 VOC | Yes | No | Bayesian inference | N/A |
| [119] | Residential building | CO2 | Temp, RH | Siemens QPA2062 and QAC22 sensors | Yes | Yes | Decision tree regression method | N/A |
| [66] | Indoor spaces at subway station | CO2, CO, NOx, NO, NO2, | Temp, RH | - | - | No | RNN | N/A |
| [114] | Office building | Toluene, NO2, CO, benzene, CH2O | Temp, RH | GSBT11, O2-A1, TGS2620, TGS2201, and TGS2602, | Yes | No | GA-based least squares SVM regression | N/A |
| [133] | Office building | CO2, | Temp, RH, air velocity | - | - | No | MLP NN | N/A |
| [49] | Office building | H2, NH3, ethanol, H2S, toluene, CO, CO2, O2 | Temp, RH | Waspmote sensors from Libellium | Yes | Yes | Extended fractional-order Kalman filter | N/A |
| [136] | Office building | CO2 | Temp, RH | IEEE1451.4 standard-based wireless sensing equipment | No | ARIMA | Web | |
| [33] | Office building | CO2 | Temp, RH | KNX modules | Yes | Yes | Gated recurrent unit | N/A |
| [24] | Commercial building | Temp, RH, pressure, wind speed | Dylos DC1700 | No | Yes | ANN-based purification time interface method | Web |
Table 3
(Continued)
| Reference number | Application area | IAQ parameters | Thermal comfort | Sensors used | Calibrated data input | Integrated to smart building | AI methods used | Result display method |
| [25] | Office building | Temp, RH, pressure, wind speed | Shinyei PPD42NJ, Thermo | Yes | No | Back propagation NN | Smartphone App | |
| [38] | Residential building | Temp, RH | Dylos DC1700, Applied Sensor IAQ Engine, SHT15 | No | No | Machine learning-based non-parametric forecasting | Smartphone App | |
| [78] | Office and residential building | O3, CO2, VOC | Temp | MISC-OZ-47 O3 Sensor, CC811 VOC Sensor | Yes | No | Multiple linear regression, non-linear ANN | N/A |
| [106] | Office building | CO2 | - | - | No | Yes | Time slicer method, PAD method | Smartphone App |
| [131] | Residential building | Temp, RH | - | No | No | ARIMA | Smartphone App |
3.1.Answer to RQ1
The first research question concerned the types of system architectures used and the methods of data collection. Consequently, the studies can be divided into four parts: 1) Studies that were based on real-time monitoring systems designed by the researchers, 2) Commercial monitoring solutions, 3) Studies that used data obtained from already installed or government-operated systems and 4) Mobile stations or wearable sensors. The results are summarized in Table 6.
Most of the reviewed studies use data acquisition systems either developed by the authors or commercially available ones for data collection. In total, 57.14% (
To ensure accuracy in real-time data collection, either researchers used expensive, highly calibrated sensor units or low-cost sensors with specific calibration arrangements. There are several air quality pollutants that affect indoor environment. However, distinct researchers have focused on different set of pollutants to predict the future conditions. An analysis of main parameters for data collection is provided in Table 4.
Table 4
Different IAQ pollutants measured by researchers in different studies
| Reference no. | SO2 | CO2 | CO | NO2 | NH3 | NO | NHx | F. | Tol. | H2 | H2S | Eth. | VOC | Ben. | Air. | Fun. | T. | R.H. | ||
| [134] | X | X | X | |||||||||||||||||
| [21] | X | X | X | X | ||||||||||||||||
| [113] | X | X | X | X | X | X | X | |||||||||||||
| [4] | X | X | X | X | X | |||||||||||||||
| [2] | X | |||||||||||||||||||
| [75] | X | X | X | X | X | |||||||||||||||
| [77] | X | X | X | X | X | X | X | X | ||||||||||||
| [132] | X | X | X | X | ||||||||||||||||
| [119] | X | X | X | |||||||||||||||||
| [66] | X | X | X | X | X | X | X | X | X | |||||||||||
| [114] | X | X | X | X | X | X | X | |||||||||||||
| [133] | X | X | X | X | X | X | X | |||||||||||||
| [49] | X | X | X | X | X | X | X | X | X | |||||||||||
| [136] | X | X | X | |||||||||||||||||
| [33] | X | X | X | |||||||||||||||||
| [24] | X | X | X | |||||||||||||||||
| [25] | X | X | X | |||||||||||||||||
| [38] | X | X | X | X | ||||||||||||||||
| [78] | X | X | X | |||||||||||||||||
| [106] | X | |||||||||||||||||||
| [131] | X | X | X | X | X | X | X | |||||||||||||
| Total | 11 | 5 | 1 | 14 | 4 | 4 | 3 | 2 | 1 | 2 | 2 | 1 | 2 | 1 | 6 | 1 | 1 | 1 | 19 | 18 |
F.: Formaldehyde; Tol: Toluene; Eth.: Ethanol; Ben.: Benzene; Air.: Airborne bacteria; Fun.: Fungi; T.: Temperature; R.H.: Relative Humidity.
Table 5
Essential details extracted from all papers
| Authors | Methods of dataset collection | Features extracted/input parameters | Period of prediction | Accuracy measures | Compared performance | Main outcomes |
| [134] | Sensor network | Summertime: Pit NH3 concentration (PNH3), pit temperature (PT), pig activities (ACT), pit fan-E speed (PFE), pit fan-W speed (PFW), Room fan 14”(F14) and Room fan 20”(F20) Wintertime: Pit ammonia concentration (PNH3), Pit temperature (PT), Room humidity (RH), Pit humidity (PH), Pig activities (ACT), Pit fan-E speed (PFE) and Pit fan-W speed (PFW) | - | Summertime: Wintertime: | Backpropagation neural network, multiple linear regression model | Suitable for input parameters having complex, highly fluctuating and non-linear relationship |
| [21] | Sensor network for IAQ parameters, national meteorological monitoring stations for weather data | Time of day, barometer level pressure (hPa), sea level pressure (hPa), temperature (°C), relative humidity (%), wind speed (knots), wind direction (knots), Pasquill atmospheric stability class, global solar radiation (j·cm−2) and outdoor pollutant concentrations. | - | NO2 Building 1: Building 2: Building 3: PM2.5 Building 1: Building 2: Building 3: | - | Stronger predictive abilities for indoor NO2 concentration when compared to PM2.5 using outdoor concentrations of meteorological variables. |
| [113] | Sensor network | Outdoor temperature and RH; static pressure difference between the inside and outside of the swine building; barn inventory and average mass per pig; building fan revolutions per minute (RPM); indoor, inlet, and exhaust temperatures; and inside RH were considered as preliminary model input variables. | - | NH3 Concentration: Emission: H2S Concentration: Emission: CO2 textitConcentration: Emission: PM10 Concentration: Emission: | - | PCA and statistical modelling promises higher prediction performance |
Table 5
(Continued)
| Authors | Methods of dataset collection | Features extracted/input parameters | Period of prediction | Accuracy measures | Compared performance | Main outcomes |
| [4] | Arduino-based sensor network | CO2, PM, temperature, humidity, light, VOC | - | Prediction accuracy = 84.69% | LSTM and linear regression | The proposed algorithm determines optimal time-step size automatically for deep learning models |
| [2] | Raspberry Pi-based sensor network | Timestamps, mean for sliding window sequence, class value for mean, class label for the target class | 30 min, 1 hour | 30 min Accuracy = 0.864; Precision = 0.855; Sensitivity = 0.855; Specificity = 0.871; F-Measure = 0.855 1 hour Accuracy = 0.788; Precision = 0.780; Sensitivity = 0.754; Specificity = 0.817; F-Measure = 0.767 | Bayesian network, decision table, J48, random forest | Network performance tested for variable sliding window length |
| [75] | Tester models from TSI Co Ltd. | Max, min, range, average, std deviation | - | Prediction accuracy = 83.33% | Support vector machine | The proposed method could dramatically reduce the measurement time from days to seconds, avoiding unnecessary costs, time consumption, and labors |
| [77] | Telemonitoring system | Statistical features | 6 h, 12 h, 18 h, 24 h | LSTM, SRNN | Provide point-by-point prediction and multiple sequence prediction | |
| [132] | Hybrid sensor network | Standard deviation of VOC concentration and CO2 levels sampled at 0.2 Hz | - | Simulations indicate that our hybrid sensor network architecture on average is 23.9% more accurate than the mobile-only architecture and 35.8% more accurate than the stationary-only architecture. | Bayesian inference | The proposed framework is composed of an optimal indoor concentration prediction, an error estimation model, and a hybrid sensor network synthesis algorithm |
| [119] | BACnet (Building Automation and Control network) technology-based sensor network | Date, time, internal RH, external and internal temperature | For randomly selected 200 values | Performance compared with variable parameter settings | Presents close relation of temperature and humidity values with CO2 prediction | |
| [66] | - | Case 1 NO, NO2, NOX, CO, CO2, temperature, humidity, Case 2 | - | Case 1 Case 2 | Regression and NN | Study reveals that several input variables have a bad impact on the prediction model; hence, only sensitive parameters must be considered for design. |
Table 5
(Continued)
| Authors | Methods of dataset collection | Features extracted/input parameters | Period of prediction | Accuracy measures | Compared performance | Main outcomes |
| [114] | E-nose system | - | - | Formaldehyde Benzene Toluene CO NO2 | GA-BPNN | The adaptive genetic algorithm was used for optimizing biases and weights of LSSVM and BPNN |
| [133] | Occupant symptom metric | Mean, median, std deviation, min, max, distribution and parameters | - | Multiple linear regression analysis, backpropagation NN | ANOVA test was performed to check significance level of input variables | |
| [49] | Libellium sensor motes | - | - | MAPE, | Extended Kalman filter | The factional order version of the extended Kalman filter can deal with missing/inaccurate and highly non-linear data |
| [136] | Wireless sensor network | CO2 levels from ten, twenty, thirty, forty, and fifty minutes in the past, were used as inputs for prediction | - | Maximum error rate = 7.18%, minimum error rate = 0.06% | ARIMA | An integrated solution to collect and analyse IAQ using sensor nodes and ARIMA prediction models. |
| [33] | Wireless sensor network installed in a domestic house (SML system house) | Outdoor and indoor temperature and humidity, CO2, indoor and outdoor light, rain and wind velocity | 24 hours | Day 1 Day 2 | LSTM network | Utilized MIMO method for forecasting h-step ahead multivariate time series, it helps to handle dependencies between future values while avoiding error accumulation |
| [24] | Sensor network and meteorological website | Outdoor IAQ, indoor IAQ, temp, hum, wind speed, pressure | - | Accuracy = 1.00; Purification time = 2 hours | Linear regression, simple ANN | Meteorological features improved system accuracy |
| [25] | Sensor network and meteorological website | GPS coordinates, location-related humidity, temperature, point of interest | - | Accuracy Raw data = 0.504; Signal reconstruction data = 0.603; ANN calibrated data = 0.641; GP inference data = 0.81 | Raw data, signal reconstructed data, ANN calibrated data, GP inference data | Detailed calibration analysis |
Table 5
(Continued)
| Authors | Methods of dataset collection | Features extracted/input parameters | Period of prediction | Accuracy measures | Compared performance | Main outcomes |
| [38] | Sensor network | PM2.5 increase rate; VOC increase rate, PM2.5 increase magnitude; VOC increase magnitude; PM2.5 decrease rate; VOC decrease rate; PM2.5 decrease magnitude, VOC decrease magnitude; PM2.5 Std; VOC Std; Hum Std; Hum change magnitude; Cross sensor change magnitude ratio; cross sensor Std ratio | - | In terms of IAQ forecast, the average NRMSD (normalized root mean square deviation) when starting prediction at two minutes after the peak value is 7.3% for Family 3, 7.9% for Family 4, and 7.5% for Family 5. Average source identification accuracy of 87.0%, 90.7% and 92.2% across all pollution events at three families respectively. | Not compared | Analysis carried out on three homes |
| [78] | Wristband/sensor network | O3, VOC, T | - | O3 prediction CO2 prediction | - | Discussed calibration in detail |
| [106] | Sensor network | CO2 count, occupancy count using PIR sensors | - | Time slicer method: | Time slicer vs. PAD method | - |
| [131] | Sensor network | - | - | Akaike Information Criterion (AIC) value of ARIMA (0,2,1) model obtained from previous step is 312, while the AIC value of ARIMA (1,0,1) obtained automatically by the method called Auto-ARIMA in R language is 337.37. So, ARIMA (0,2,1) is better. | Not compared | - |
Table 6
Data collection methods
| Domain | Studies | Number of studies |
| Real time monitoring systems designed by researchers | [2,4,24,25,38,49,78,108,114,131,132,136] | 12 |
| Commercial monitoring solutions | [2,21,75,119,134] | 5 |
| Data obtained from already installed systems | [33,77,106] | 3 |
| Mobile stations or wearable sensors | [78,113] | 2 |
This analysis reveals that 66.6% (
Besides this, particulate matters (
3.2.Answer to RQ2
The second research question concerned features or input parameters used for designing a prediction system. Feature extraction and input parameter selection play an essential role in designing an AI-based prediction system. The performance of the prediction model is highly dependent on the type of features used for network training. The list of features used in included 21 papers is presented in Table 5 (column 3).
In total, four studies [24,66,119,133] presented an analysis of the sensitivity of selected features. In order to ensure higher accuracy for forecasting system, it is essential to ensure that network is trained with most relevant features because irrelevant or least relevant features can deviate network performance [16,69,86,92,102].
Seven studies used measured input parameters as training parameters [4,21,66,113,119,134] and five studies considered statistical analysis of features to ensure that most relevant features are fed to the network [2,75,77,132,133]. One study [66] provided a clear analysis of the relevance of features and how their inclusion or exclusion affect the performance of the IAQ prediction system. The researchers in this paper executed different cases with unique input parameter selection and visualized network performance for those changes. The analysis shows that bad or irrelevant parameters cause a worse impact on the prediction system performance.
3.3.Answer to RQ3
The third research question focuses on the used AI methods for IAQ prediction systems. As can be seen in Table 3, most of the researchers worked on different versions of neural networks. In total, the researchers of 10 studies (47.61%) used neural network-based methods. Two studies [131,136] followed ARIMA and two other studies used the GRU method for IAQ prediction. Besides this, one study each focused on ANFIS [134], Kalman filter [49], GA-based SVM [114], time slicer method [106], Bayesian inference [132] and decision tree regression [119]. However, none of these studies included fuzzy logic, which otherwise offers potentials scope for forecasting problems [56,57]. Future researchers should focus on the application of fuzzy logic and other relevant machine learning methods for forecasting IAQ conditions [32]. LSTM is another crucial solution, and several researchers considered this technique (see Table 5) for comparing performance of their proposed methods and to validate the quality of results. It is also possible to create hybrid forecasting techniques by combining these available methods or by utilizing the potential of optimization techniques such as PSO, GA and simulated annealing [63,98].
3.4.Answer to RQ4
In terms of the accuracies and prediction time of the existing models, essential details are mentioned in Table 4. Researchers focused on common parameters to evaluate the performance of the prediction system, which are listed in Table 7.
As can be seen, 42.85% (
3.5.Answer to RQ5
This RQ focuses on the application domains that are addressed by existing publications. As can be seen from Table 3, 11 (52.03%) out of 21 studies were executed on IAQ data collected from an office building which were either an institute-labs, staff rooms or traffic prone workspaces. The data collected in six studies (28.57%) [2,4,38,78,119,131] is related to residential buildings. However, three studies [24,113,134] focused on other commercial buildings such as gym, shopping malls and two studies were conducted at indoor spaces such as waiting rooms of subway stations. IAQ has been a considerable challenge for people who spend most of their routine time indoors. A considerable number of health issues among employees in offices and industrial units are reported due to unfavourable environmental conditions. The excessive use of chemical-rich cleaning agents and fragrance solutions put more threat to the overall health and well-being of employees [46,71]. Furthermore, the risks are more significant in remote areas where people use traditional sources such as wood, coal and kerosene for cooking and heating purpose [60]. Women, children and elderly members of such poor families are at a higher risk since they spend 80–90% of their routine time indoors [103]. The main concern while designing IAQ monitoring and prediction systems is that the ultimate product must be cost-effective, easy to use and simple to install at rural as well as urban areas [68]. Besides this, future researchers need to address the issues related to battery consumption, type of sensors, a communication mechanism and system architecture [104]. An adequate combination of hardware and software is a must to achieve real-time IAQ monitoring and prediction goals. At the same time, policymakers need to raise awareness about the use of real-time monitoring systems so that most of the people consider installing them.
3.6.Answer to RQ6
RQ6 concerns the opportunities for integrating IAQ prediction systems with smart building systems. In total, seven (33.3%) out of 21 studies [2,24,33,49,106,119,134] were based on smart building solutions where the IAQ prediction system was integrated with other smart solutions in the premises for improved lifestyle and well-being. However, the remaining 14 studies (66.6%) were independent solutions where researchers worked solely on IAQ monitoring and prediction. Ventilation is one of the main concerns in modern as well as traditional houses. The new age IAQ prediction systems must be integrated into automated ventilation management so that adequate arrangements for the circulation of fresh air can be made on time. The prediction systems can provide updates about future conditions of IAQ levels, and the smart building management can be adjusted accordingly to prevent serious health consequences for the building occupants. As can be seen in Table 5, four studies [2,33,77,119] provided information about the number of predicted hours using their proposed method. One study [33] claimed prediction for the next 24 hours. However, the authors of [77] proposed prediction for 6, 12, 18 and 24 hours. Furthermore, the authors of [2] provided a prediction efficiency of 30 minutes and one hour only. The number of predicted hours is crucial for real-time systems as it can help occupants make prior arrangements in terms of expected critical changes in the pollutant concentrations [30]. This information could be essential for disabled patients and those suffering from chronic diseases such as respiratory health problems or cardiovascular disease.
3.7.Answer to RQ7
Finally, RQ7 focuses on the methods that are used by early researchers to present IAQ system results to the end-users. The field of research is not restricted to the design and development of the IAQ prediction system. Moreover, future researchers need to be careful about how the predictions or ultimate results of monitoring systems are presented to the end-users. As can be seen in Table 3, four studies (19.04%) presented the results of the prediction system on a web-based solution. Alternatively, four other studies (19.04%) preferred designing a smartphone application. The details about the end-user interface were missing from the remaining studies. The overall effectiveness of the IAQ prediction system depends on how the results are accessible to end-users. The design should not be limited to smartphone applications and web-based platforms. It is equally relevant to provide alerts for predicted critical situations so that building occupants can take immediate actions for ventilation arrangements [30]. The triggers must be further connected to the smart building management systems to control all mechanisms accordingly.
4.Conclusion
This study conducted a systematic literature review on IAQ prediction systems based on AI methods. The review was performed by studying and analyzing academic papers published in PubMed, IEEE and ACM databases. The most relevant articles were analyzed as per the pre-defined RQs and eligibility criteria, which helped to highlight the potential of AI to address IAQ-related problems.
The trend for IAQ monitoring has become a dominant concept in most developing countries where a significant part of the population is dependent on traditional cooking, heating measures and use of inadequate ventilation arrangements [103]. Furthermore, the forecasting of IAQ conditions ahead of time has become an essential concern for improved public health and well-being for enhanced ambient intelligence and smart environments. In this study, 47.61% of the reviewed papers (
The researchers have shown interest in measuring a variety of IAQ pollutants, 66.6% (
The analyzed literature presents the potential of deep learning, machine learning and neural networks for enhanced living environments and occupational health in the smart environments. Nevertheless, this literature review has limitations. For this study, only papers in English from PubMed, IEEE and ACM were considered. This study may help to outline crucial possibilities in the field of IAQ and public health management. At the same time, this literature review states multiple challenges regarding the current state-of-the-art for smart environments. Future research also needs to evaluate the impact of different pollutants based on different geographical conditions and variable living arrangements. Another critical area of work is the development of the most adequate and highly calibrated sensor networks to measure IAQ levels on a real-time basis. Furthermore, future research needs to ensure that developed systems are useful on a real-time basis for rural areas, where people might not be able to afford more expensive solutions.
Conflict of interest
None to report.
References
[1] | S. Abraham and X. Li, A cost-effective wireless sensor network system for indoor air quality monitoring applications, Procedia Computer Science 34: ((2014) ), 165–171. doi:10.1016/j.procs.2014.07.090. |
[2] | J. Adeleke, D. Moodley, G. Rens and A. Adewumi, Integrating statistical machine learning in a semantic sensor web for proactive monitoring and control, Sensors 17: ((2017) ), 807. doi:10.3390/s17040807. |
[3] | S.S. Ahmad, R. Urooj and M. Nawaz, Air pollution monitoring and prediction, in: Current Air Quality Issues, F. Nejadkoorki, ed., InTech, (2015) . doi:10.5772/59678. |
[4] | J. Ahn, D. Shin, K. Kim and J. Yang, Indoor air quality analysis using deep learning with sensor data, Sensors 17: ((2017) ), 2476. doi:10.3390/s17112476. |
[5] | M. Alirezaie and A. Loutfi, Reasoning for sensor data interpretation: An application to air quality monitoring, Journal of Ambient Intelligence and Smart Environments 7: ((2015) ), 579–597. doi:10.3233/AIS-150323. |
[6] | Z. Allam and Z.A. Dhunny, On big data, artificial intelligence and smart cities, Cities 89: ((2019) ), 80–91. doi:10.1016/j.cities.2019.01.032. |
[7] | M.M. Andamon and J. Woo, Indoor environmental quality of preparatory to year 12 (P-12) educational facilities in Australia: Challenges and prospects, in: Energy Performance in the Australian Built Environment, P. Rajagopalan, M.M. Andamon and T. Moore, eds, Springer, Singapore, Singapore, (2019) , pp. 111–130. doi:10.1007/978-981-10-7880-4_8. |
[8] | M.S. Andargie, M. Touchie and W. O’Brien, A review of factors affecting occupant comfort in multi-unit residential buildings, Building and Environment 160: ((2019) ), 106182. doi:10.1016/j.buildenv.2019.106182. |
[9] | K.A.G. Arano, S. Sun, J. Ordieres-Mere and B. Gong, The use of the Internet of things for estimating personal pollution exposure, IJERPH 16: ((2019) ), 3130. doi:10.3390/ijerph16173130. |
[10] | Z. Argunhan and A.S. Avci, Statistical evaluation of indoor air quality parameters in classrooms of a university, Advances in Meteorology 2018: ((2018) ), 1–10. doi:10.1155/2018/4391579. |
[11] | L. Bai, J. Wang, X. Ma and H. Lu, Air pollution forecasts: An overview, Int J Environ Res Public Health 15: ((2018) ). doi:10.3390/ijerph15040780. |
[12] | M.R. Barbosa and A.M. Lopes, Temperature time series: Pattern analysis and forecasting, in: 2017 4th Experiment@International Conference (Exp.at’17), IEEE, Faro, Portugal, (2017) , pp. 226–231. doi:10.1109/EXPAT.2017.7984416. |
[13] | BBC News, Why is India’s pollution much worse than China’s?, 2019, https://www.bbc.com/news/world-asia-50298972 (accessed November 27, 2019). |
[14] | R. Becher, J. Øvrevik, P. Schwarze, S. Nilsen, J. Hongslo and J. Bakke, Do carpets impair indoor air quality and cause adverse health outcomes: A review, International Journal of Environmental Research and Public Health 15: ((2018) ), 184. doi:10.3390/ijerph15020184. |
[15] | M. Benammar, A. Abdaoui, S. Ahmad, F. Touati and A. Kadri, A modular IoT platform for real-time indoor air quality monitoring, Sensors 18: ((2018) ), 581. doi:10.3390/s18020581. |
[16] | V. Bolón-Canedo, N. Sánchez-Maroño and A. Alonso-Betanzos, Feature selection for high-dimensional data, Prog Artif Intell 5: ((2016) ), 65–75. doi:10.1007/s13748-015-0080-y. |
[17] | S. Bonino, Carbon dioxide detection and indoor air quality control, Occupational Health & Safety (Waco, Tex.) 85: ((2016) ), 46–48. |
[18] | D.J. Briggs, K. de Hoogh, C. Morris and J. Gulliver, Effects of travel mode on exposures to particulate air pollution, Environment International 34: ((2008) ), 12–22. doi:10.1016/j.envint.2007.06.011. |
[19] | N. Bruce, D. Pope, E. Rehfuess, K. Balakrishnan, H. Adair-Rohani and C. Dora, WHO indoor air quality guidelines on household fuel combustion: Strategy implications of new evidence on interventions and exposure–risk functions, Atmospheric Environment 106: ((2015) ), 451–457. doi:10.1016/j.atmosenv.2014.08.064. |
[20] | S. Capolongo and G. Settimo, Indoor air quality in healing environments: Impacts of physical, chemical, and biological environmental factors on users, in: Indoor Air Quality in Healthcare Facilities, S. Capolongo, G. Settimo and M. Gola, eds, Springer International Publishing, Cham, (2017) , pp. 1–11. doi:10.1007/978-3-319-49160-8_1. |
[21] | A. Challoner, F. Pilla and L. Gill, Prediction of indoor air exposure from outdoor air quality using an artificial neural network model for inner city commercial buildings, IJERPH 12: ((2015) ), 15233–15253. doi:10.3390/ijerph121214975. |
[22] | T.-J. Chang, M.-Y. Huang, Y.-T. Wu and C.-M. Liao, Quantitative prediction of traffic pollutant transmission into buildings, Journal of Environmental Science and Health, Part A 38: ((2003) ), 1025–1040. doi:10.1081/ESE-120019861. |
[23] | W.-K. Chen, C.-T. Wang and M.-W. Lin, An experimental study on fuzzy control for indoor air quality and the energy consumption in a building, in: 2015 International Conference on Machine Learning and Cybernetics (ICMLC), (2015) , pp. 452–455. doi:10.1109/ICMLC.2015.7340963. |
[24] | X. Chen, Y. Zheng, Y. Chen, Q. Jin, W. Sun, E. Chang and W.-Y. Ma, Indoor air quality monitoring system for smart buildings, in: Proceedings of the 2014 ACM International Joint Conference on Pervasive and Ubiquitous Computing, Association for Computing Machinery, Seattle, Washington, (2014) , pp. 471–475. doi:10.1145/2632048.2632103. |
[25] | Y. Cheng, X. Li, Z. Li, S. Jiang, Y. Li, J. Jia and X. Jiang, AirCloud: A cloud-based air-quality monitoring system for everyone, in: Proceedings of the 12th ACM Conference on Embedded Network Sensor Systems – SenSys’14, ACM Press, Memphis, Tennessee, (2014) , pp. 251–265. doi:10.1145/2668332.2668346. |
[26] | L. Cony Renaud Salis, M. Abadie, P. Wargocki and C. Rode, Towards the definition of indicators for assessment of indoor air quality and energy performance in low-energy residential buildings, Energy and Buildings 152: ((2017) ), 492–502. doi:10.1016/j.enbuild.2017.07.054. |
[27] | A. Coutts, J. Beringer and N. Tapper, Changing urban climate and CO2 emissions: Implications for the development of policies for sustainable cities, Urban Policy and Research 28: ((2010) ), 27–47. doi:10.1080/08111140903437716. |
[28] | G. de Gennaro, P. Dambruoso, A. Di Gilio, V. Di Palma, A. Marzocca and M. Tutino, Discontinuous and continuous indoor air quality monitoring in homes with fireplaces or wood stoves as heating system, IJERPH 13: ((2015) ), 78. doi:10.3390/ijerph13010078. |
[29] | G. de Gennaro, P.R. Dambruoso, A.D. Loiotile, A. Di Gilio, P. Giungato, M. Tutino, A. Marzocca, A. Mazzone, J. Palmisani and F. Porcelli, Indoor air quality in schools, Environmental Chemistry Letters 12: ((2014) ), 467–482. doi:10.1007/s10311-014-0470-6. |
[30] | S. Deleawe, J. Kusznir, B. Lamb and D.J. Cook, Predicting air quality in smart environments, J Ambient Intell Smart Environ 2: ((2010) ), 145–152. doi:10.3233/AIS-2010-0061. |
[31] | X. Ding, W. Du and A. Cerpa, OCTOPUS: Deep reinforcement learning for holistic smart building control, in: Proceedings of the 6th ACM International Conference on Systems for Energy-Efficient Buildings, Cities, and Transportation, ACM, New York NY USA, (2019) , pp. 326–335. doi:10.1145/3360322.3360857. |
[32] | A.I. Dounis, M. Bruant, M. Santamouris, G. Guarracino and P. Michel, Comparison of conventional and fuzzy control of indoor air quality in buildings, Journal of Intelligent & Fuzzy Systems 4: ((1996) ), 131–140. doi:10.3233/IFS-1996-4205. |
[33] | E. Elhariri and S.A. Taie, H-ahead multivariate microclimate forecasting system based on deep learning, in: 2019 International Conference on Innovative Trends in Computer Engineering (ITCE), IEEE, Aswan, Egypt, (2019) , pp. 168–173. doi:10.1109/ITCE.2019.8646540. |
[34] | A. Elnakat and J.D. Gomez, The flame dilemma: A data analytics study of fireplace influence on winter energy consumption at the residential household level, Energy Reports 2: ((2016) ), 14–20. doi:10.1016/j.egyr.2016.01.002. |
[35] | Environmental Protection Agency, Air quality – national summary, (n.d.), https://www.epa.gov/air-trends/air-quality-national-summary (accessed January 15, 2020). |
[36] | European Environment Agency, Air quality in Europe: 2019 report, 2019, https://op.europa.eu/publication/manifestation_identifier/PUB_THAL19012ENN (accessed January 14, 2020). |
[37] | European Environment Agency, Air pollution, 2015, https://www.eea.europa.eu/soer-2015/europe/air#tab-based-on-data (accessed January 15, 2020). |
[38] | B. Fang, Q. Xu, T. Park and M. Zhang, AirSense: An intelligent home-based sensing system for indoor air quality analytics, in: Proceedings of the 2016 ACM International Joint Conference on Pervasive and Ubiquitous Computing, ACM, Heidelberg Germany, (2016) , pp. 109–119. doi:10.1145/2971648.2971720. |
[39] | P. Fazenda, K. Veeramachaneni, P. Lima and U.-M. O’Reilly, Using reinforcement learning to optimize occupant comfort and energy usage in HVAC systems, Journal of Ambient Intelligence and Smart Environments 6: ((2014) ), 675–690. doi:10.3233/AIS-140288. |
[40] | A.M. da C. Ferreira, M. Cardoso, A.M. da C. Ferreira and M. Cardoso, Indoor air quality and health in schools, Jornal Brasileiro de Pneumologia 40: ((2014) ), 259–268. doi:10.1590/S1806-37132014000300009. |
[41] | S. Foster and S. Everett Jones, Association of school district policies for radon testing and radon-resistant new construction practices with indoor radon zones, IJERPH 13: ((2016) ), 1234. doi:10.3390/ijerph13121234. |
[42] | S. Ghimire, S.R. Mishra, A. Sharma, A. Siweya, N. Shrestha and B. Adhikari, Geographic and socio-economic variation in markers of indoor air pollution in Nepal: Evidence from nationally-representative data, BMC Public Health 19: ((2019) ), 195. doi:10.1186/s12889-019-6512-z. |
[43] | C. Gomez, S. Chessa, A. Fleury, G. Roussos and D. Preuveneers, Internet of things for enabling smart environments: A technology-centric perspective, Journal of Ambient Intelligence and Smart Environments 11: ((2019) ), 23–43. doi:10.3233/AIS-180509. |
[44] | A.K. Gorai, P.B. Tchounwou, S. Biswal and F. Tuluri, Spatio-temporal variation of particulate matter(PM2.5) concentrations and its health impacts in a mega city, Delhi in India, Environ Health Insights 12: ((2018) ). doi:10.1177/1178630218792861. |
[45] | C.F. Gould, S. Schlesinger, A.O. Toasa, M. Thurber, W.F. Waters, J.P. Graham and D.W. Jack, Government policy, clean fuel access, and persistent fuel stacking in Ecuador, Energy for Sustainable Development 46: ((2018) ), 111–122. doi:10.1016/j.esd.2018.05.009. |
[46] | G.S. Graudenz, C.H. Oliveira, A. Tribess, C. Mendes, M.R.D.O. Latorre and J. Kalil, Association of air-conditioning with respiratory symptoms in office workers in tropical climate, Indoor Air 15: ((2005) ), 62–66. doi:10.1111/j.1600-0668.2004.00324.x. |
[47] | I. Gryech, Y. Ben-Aboud, B. Guermah, N. Sbihi, M. Ghogho and A. Kobbane, MoreAir: A low-cost urban air pollution monitoring system, Sensors 20: ((2020) ), 998. doi:10.3390/s20040998. |
[48] | A. Gupta, A. Gupta, K. Jain and S. Gupta, Noise pollution and impact on children health, The Indian Journal of Pediatrics 85: ((2018) ), 300–306. doi:10.1007/s12098-017-2579-7. |
[49] | Q.P. Ha, S. Metia and M.D. Phung, Sensing data fusion for enhanced indoor air quality monitoring, IEEE Sensors J. 20: ((2020) ), 4430–4441. doi:10.1109/JSEN.2020.2964396. |
[50] | A.T. Hodgson, D.G. Shendell, W.J. Fisk and M.G. Apte, Comparison of predicted and derived measures of volatile organic compounds inside four new relocatable classrooms, Indoor Air 14: ((2004) ), 135–144. doi:10.1111/j.1600-0668.2004.00315.x. |
[51] | M. Holland, J. Spadaro, A. Misra and B. Pearson, Costs of air pollution from European industrial facilities 2008–2012 – an updated assessment, EEA Technical report, 2014. |
[52] | D. Ibaseta, J. Molleda, F. Díez and J.C. Granda, Indoor air quality monitoring sensor for the web of things, Proceedings 2: ((2018) ), 1466. doi:10.3390/proceedings2231466. |
[53] | India Today, Air pollution in Delhi was 16 times worse than prescribed limit on Diwali night, 2019, https://www.indiatoday.in/diu/story/delhi-air-pollution-16-times-worse-prescribed-limit-diwali-night-1613477-2019-10-28 (accessed November 27, 2019). |
[54] | K. Isiugo, R. Jandarov, J. Cox, P. Ryan, N. Newman, S.A. Grinshpun, R. Indugula, S. Vesper and T. Reponen, Indoor particulate matter and lung function in children, Science of The Total Environment 663: ((2019) ), 408–417. doi:10.1016/j.scitotenv.2019.01.309. |
[55] | D. Iskandaryan, F. Ramos and S. Trilles, Air quality prediction in smart cities using machine learning technologies based on sensor data: A review, Applied Sciences 10: ((2020) ), 2401. doi:10.3390/app10072401. |
[56] | K. Jabłoński and T. Grychowski, Fuzzy inference system for the assessment of indoor environmental quality in a room, Indoor and Built Environment 27: ((2018) ), 1415–1430. doi:10.1177/1420326X17728097. |
[57] | A. Javid, A.A. Hamedian, H. Gharibi and H. Sowlat, Towards the application of fuzzy logic for developing a novel indoor air quality index (FIAQI), Iran J Public Health 45: ((2016) ), 11. |
[58] | M. Jerrett, M.C. Turner, B.S. Beckerman, C.A. Pope, A. van Donkelaar, R.V. Martin, M. Serre, D. Crouse, S.M. Gapstur, D. Krewski, W.R. Diver, P.F. Coogan, G.D. Thurston and R.T. Burnett, Comparing the health effects of ambient particulate matter estimated using ground-based versus remote sensing exposure estimates, Environmental Health Perspectives 125: ((2017) ), 552–559. doi:10.1289/EHP575. |
[59] | F. Jomehzadeh, P. Nejat, J.K. Calautit, M.B.M. Yusof, S.A. Zaki, B.R. Hughes and M.N.A.W.M. Yazid, A review on windcatcher for passive cooling and natural ventilation in buildings, part 1: Indoor air quality and thermal comfort assessment, Renewable and Sustainable Energy Reviews 70: ((2017) ), 736–756. doi:10.1016/j.rser.2016.11.254. |
[60] | V. Joon and A. Chandra, Household air pollution from cooking fuels: An environmental and public health challenge, Asian Journal of Water, Environment and Pollution 13: ((2016) ), 33–39. doi:10.3233/AJW-160036. |
[61] | J. Jung and M. Huxham, Firewood usage and indoor air pollution from traditional cooking fires in Gazi Bay, Kenya, Bioscience Horizons: The International Journal of Student Research 11: ((2018) ), hzy014. doi:10.1093/biohorizons/hzy014. |
[62] | J. Kaiser, EPIDEMIOLOGY: How dirty air hurts the heart, Science 307: ((2005) ), 1858b–1859b. doi:10.1126/science.307.5717.1858b. |
[63] | E. Kalapanidas and N. Avouris, Feature selection for air quality forecasting: A genetic algorithm approach, AI Communications 16: ((2003) ), 235–251. |
[64] | J.-J. Kao and S.-S. Huang, Forecasts using neural network versus Box–Jenkins methodology for ambient air quality monitoring data, Journal of the Air & Waste Management Association 50: ((2000) ), 219–226. doi:10.1080/10473289.2000.10463997. |
[65] | C.A. Keet, J.P. Keller and R.D. Peng, Long-term coarse particulate matter exposure is associated with asthma among children in medicaid, Am J Respir Crit Care Med 197: ((2018) ), 737–746. doi:10.1164/rccm.201706-1267OC. |
[66] | M. Kim, Y. Kim, S. Sung and C. Yoo, Data-driven prediction model of indoor air quality by the preprocessed recurrent neural networks, in: 2009 ICCAS-SICE, (2009) , pp. 1688–1692. |
[67] | R.C. Klein, C. King and A. Kosior, Laboratory air quality and room ventilation rates: An update, Journal of Chemical Health and Safety 18: ((2011) ), 21–24. doi:10.1016/j.jchas.2010.10.002. |
[68] | A. Kumar and B.R. Gurjar, Low-cost sensors for air quality monitoring in developing countries – a critical view, Asian Journal of Water, Environment and Pollution 16: ((2019) ), 65–70. doi:10.3233/AJW190021. |
[69] | M. Labani, P. Moradi, F. Ahmadizar and M. Jalili, A novel multivariate filter method for feature selection in text classification problems, Engineering Applications of Artificial Intelligence 70: ((2018) ), 25–37. doi:10.1016/j.engappai.2017.12.014. |
[70] | LaSVM-based big data learning system for dynamic prediction of air pollution in Tehran, PubMed – NCBI, (n.d.), https://www.ncbi.nlm.nih.gov/pubmed/29679160 (accessed January 13, 2020). |
[71] | J.-Y. Lee, P. Wargocki, Y.-H. Chan, L. Chen and K.-W. Tham, How does indoor environmental quality in green refurbished office buildings compare with the one in new certified buildings?, Building and Environment 171: ((2020) ), 106677. doi:10.1016/j.buildenv.2020.106677. |
[72] | D.Y.C. Leung, Outdoor-indoor air pollution in urban environment: Challenges and opportunity, Front. Environ. Sci. 2: ((2015) ). doi:10.3389/fenvs.2014.00069. |
[73] | B. Li, T. Wen, C. Hu and B. Zhou, Power system transient stability prediction algorithm based on ReliefF and LSTM, in: Artificial Intelligence and Security, X. Sun, Z. Pan and E. Bertino, eds, Springer International Publishing, Cham, (2019) , pp. 74–84. doi:10.1007/978-3-030-24274-9_7. |
[74] | W. Liu, G. Shen, Y. Chen, H. Shen, Y. Huang, T. Li, Y. Wang, X. Fu, S. Tao, W. Liu, Y. Huang-Fu, W. Zhang, C. Xue, G. Liu, F. Wu and M. Wong, Air pollution and inhalation exposure to particulate matter of different sizes in rural households using improved stoves in central China, Journal of Environmental Sciences 63: ((2018) ), 87–95. doi:10.1016/j.jes.2017.06.019. |
[75] | Z. Liu, K. Cheng, H. Li, G. Cao, D. Wu and Y. Shi, Exploring the potential relationship between indoor air quality and the concentration of airborne culturable fungi: A combined experimental and neural network modeling study, Environ Sci Pollut Res 25: ((2018) ), 3510–3517. doi:10.1007/s11356-017-0708-5. |
[76] | D. Lohani and D. Acharya, SmartVent: A context aware IoT system to measure indoor air quality and ventilation rate, in: 2016 17th IEEE International Conference on Mobile Data Management (MDM), IEEE, Porto, (2016) , pp. 64–69. doi:10.1109/MDM.2016.91. |
[77] | J. Loy-Benitez, P. Vilela, Q. Li and C. Yoo, Sequential prediction of quantitative health risk assessment for the fine particulate matter in an underground facility using deep recurrent neural networks, Ecotoxicology and Environmental Safety 169: ((2019) ), 316–324. doi:10.1016/j.ecoenv.2018.11.024. |
[78] | B. Maag, Z. Zhou and L. Thiele, W-air: Enabling personal air pollution monitoring on wearables, Proc. ACM Interact. Mob. Wearable Ubiquitous Technol. 2: ((2018) ), 1–25. doi:10.1145/3191756. |
[79] | I. Mäkeläinen, S. Moisio, H. Reisbacka and T. Turtiainen, Indoor occupancy and radon exposure in Finland, in: Radioactivity in the Environment, Elsevier, (2005) , pp. 687–693. doi:10.1016/S1569-4860(04)07084-6. |
[80] | G. Marques, I. Pires, N. Miranda and R. Pitarma, Air quality monitoring using assistive robots for ambient assisted living and enhanced living environments through Internet of things, Electronics 8: ((2019) ), 1375. doi:10.3390/electronics8121375. |
[81] | G. Marques, J. Saini, M. Dutta, P.K. Singh and W.-C. Hong, Indoor air quality monitoring systems for enhanced living environments: A review toward sustainable smart cities, Sustainability 12: ((2020) ), 4024. doi:10.3390/su12104024. |
[82] | C. Matos, C.A. Teixeira, R. Bento, J. Varajão and I. Bentes, An exploratory study on the influence of socio-demographic characteristics on water end uses inside buildings, Science of The Total Environment 466–467: ((2014) ), 467–474. doi:10.1016/j.scitotenv.2013.07.036. |
[83] | N. Mdege, C. Fairhurst, T. Ferdous, C. Hewitt, R. Huque, C. Jackson, I. Kellar, S. Parrott, S. Semple, A. Sheikh, S. Swami and K. Siddiqi, Muslim communities learning about second-hand smoke in Bangladesh (MCLASS II): Study protocol for a cluster randomised controlled trial of a community-based smoke-free homes intervention, with or without indoor air quality feedback, Trials 20: ((2019) ), 11. doi:10.1186/s13063-018-3100-y. |
[84] | A. Melikov and J. Kaczmarczyk, Measurement and prediction of indoor air quality using a breathing thermal manikin, Indoor Air 17: ((2007) ), 50–59. doi:10.1111/j.1600-0668.2006.00451.x. |
[85] | V.K. Mishra, R.D. Retherford and K.R. Smith, Biomass cooking fuels and prevalence of blindness in India, Journal of Environmental Medicine 1: ((1999) ), 189–199. doi:10.1002/jem.30. |
[86] | A. Moayedikia, K.-L. Ong, Y.L. Boo, W.G. Yeoh and R. Jensen, Feature selection for high dimensional imbalanced class data using harmony search, Engineering Applications of Artificial Intelligence 57: ((2017) ), 38–49. doi:10.1016/j.engappai.2016.10.008. |
[87] | National Weather Service, Why air quality is important, why air quality is important, (n.d.), https://www.weather.gov/safety/airquality (accessed July 21, 2019). |
[88] | G.D. Nielsen, S.T. Larsen and P. Wolkoff, Re-evaluation of the WHO (2010) formaldehyde indoor air quality guideline for cancer risk assessment, Archives of Toxicology 91: ((2017) ), 35–61. doi:10.1007/s00204-016-1733-8. |
[89] | N. Nikzad, T.Š. Rosing, W.G. Griswold, N. Verma, C. Ziftci, E. Bales, N. Quick, P. Zappi, K. Patrick, S. Dasgupta and I. Krueger, CitiSense: Improving geospatial environmental assessment of air quality using a wireless personal exposure monitoring system, in: Proceedings of the Conference on Wireless Health – WH’12, ACM Press, San Diego, California, (2012) , pp. 1–8. doi:10.1145/2448096.2448107. |
[90] | G. Oliveri Conti, B. Heibati, I. Kloog, M. Fiore and M. Ferrante, A review of AirQ models and their applications for forecasting the air pollution health outcomes, Environ Sci Pollut Res 24: ((2017) ), 6426–6445. doi:10.1007/s11356-016-8180-1. |
[91] | W.R. Ott, Mathematical models for predicting indoor air quality from smoking activity, Environmental Health Perspectives 107: ((1999) ), 7. |
[92] | R.B. Pereira, A. Plastino, B. Zadrozny and L.H.C. Merschmann, Categorizing feature selection methods for multi-label classification, Artif Intell Rev 49: ((2018) ), 57–78. doi:10.1007/s10462-016-9516-4. |
[93] | A.K. Persily, Field measurement of ventilation rates, Indoor Air 26: ((2016) ), 97–111. doi:10.1111/ina.12193. |
[94] | R. Pitarma, G. Marques and B.R. Ferreira, Monitoring indoor air quality for enhanced occupational health, Journal of Medical Systems 41: ((2017) ). doi:10.1007/s10916-016-0667-2. |
[95] | K. Qian, X. Ma, X. Dai, F. Fang and B. Zhou, Gaussian process based IAQ distribution mapping using an interactive service robot, Journal of Ambient Intelligence and Smart Environments 8: ((2016) ), 359–373. doi:10.3233/AIS-160376. |
[96] | T. Ramachandran, T. Perumal and P. Boursier, Fuzzy logic predictive method for indoor environment parametric dataset, in: 2017 IEEE International Symposium on Consumer Electronics (ISCE), IEEE, Kuala Lumpur, (2017) , pp. 50–51. doi:10.1109/ISCE.2017.8355545. |
[97] | B.P.S. Rao, V.I. Pandit, H. Gupta, M.Z. Hasan and B. Shrinivas Rao, Identification of inplant ambient air quality monitoring stations using a prediction model, Bulletin of Environmental Contamination and Toxicology 68: ((2002) ), 839–844. doi:10.1007/s00128-002-0031-8. |
[98] | S.S. Roy, N. Paraschiv, M. Popa, R. Lile and I. Naktode, Prediction of air-pollutant concentrations using hybrid model of regression and genetic algorithm, Journal of Intelligent & Fuzzy Systems 38: ((2020) ), 5909–5919. doi:10.3233/JIFS-179678. |
[99] | K. Rumchev, Y. Zhao and J. Spickett, Health risk assessment of indoor air quality, socioeconomic and house characteristics on respiratory health among women and children of Tirupur, South India, Int J Environ Res Public Health 14: ((2017) ). doi:10.3390/ijerph14040429. |
[100] | D. Rupakheti, N.T. Kim Oanh, M. Rupakheti, R.K. Sharma, A.K. Panday, S.P. Puppala and M.G. Lawrence, Indoor levels of black carbon and particulate matters in relation to cooking activities using different cook stove-fuels in rural Nepal, Energy for Sustainable Development 48: ((2019) ), 25–33. doi:10.1016/j.esd.2018.10.007. |
[101] | W.F. Ryan, The air quality forecast rote: Recent changes and future challenges, Journal of the Air & Waste Management Association 66: ((2016) ), 576–596. doi:10.1080/10962247.2016.1151469. |
[102] | S. Sadr, V. Mozafari, H. Shirani, H. Alaei and A. Tajabadi Pour, Selection of the most important features affecting pistachio endocarp lesion problem using artificial intelligence techniques, Scientia Horticulturae 246: ((2019) ), 797–804. doi:10.1016/j.scienta.2018.11.048. |
[103] | J. Saini, M. Dutta and G. Marques, A comprehensive review on indoor air quality monitoring systems for enhanced public health, Sustainable Environment Research 30: ((2020) ), 6. doi:10.1186/s42834-020-0047-y. |
[104] | J. Saini, M. Dutta and G. Marques, Indoor air quality monitoring systems based on Internet of things: A systematic review, International Journal of Environmental Research and Public Health 17: ((2020) ), 4942. doi:10.3390/ijerph17144942. |
[105] | N.J. Schork, Artificial intelligence and personalized medicine, in: Precision Medicine in Cancer Therapy, D.D. Von Hoff and H. Han, eds, Springer International Publishing, Cham, (2019) , pp. 265–283. doi:10.1007/978-3-030-16391-4_11. |
[106] | J.H. Schwee, F.C. Sangogboye and M.B. Kjærgaard, Anonymizing building data for data analytics in cross-organizational settings, in: Proceedings of the International Conference on Internet of Things Design and Implementation, ACM, Montreal, Quebec Canada, (2019) , pp. 1–12. doi:10.1145/3302505.3310064. |
[107] | J.M. Seguel, R. Merrill, D. Seguel and A.C. Campagna, Indoor air quality, American Journal of Lifestyle Medicine ((2016) ). doi:10.1177/1559827616653343. |
[108] | P.K. Sharma, T. De and S. Saha, IoT based indoor environment data modelling and prediction, in: 2018 10th International Conference on Communication Systems & Networks (COMSNETS), IEEE, Bengaluru, (2018) , pp. 537–539. doi:10.1109/COMSNETS.2018.8328266. |
[109] | P.-W. Soh, J.-W. Chang and J.-W. Huang, Adaptive deep learning-based air quality prediction model using the most relevant spatial-temporal relations, IEEE Access 6: ((2018) ), 38186–38199. doi:10.1109/ACCESS.2018.2849820. |
[110] | T.G. Stavropoulos, G. Koutitas, D. Vrakas, E. Kontopoulos and I. Vlahavas, A smart university platform for building energy monitoring and savings, Journal of Ambient Intelligence and Smart Environments 8: ((2016) ), 301–323. doi:10.3233/AIS-160375. |
[111] | T.G. Stavropoulos, D. Vrakas, D. Vlachava and N. Bassiliades, BOnSAI: A smart building ontology for ambient intelligence, in: Proceedings of the 2nd International Conference on Web Intelligence, Mining and Semantics – WIMS’12, ACM Press, Craiova, Romania, (2012) , p. 1. doi:10.1145/2254129.2254166. |
[112] | D.R. Stewart, E. Saunders, R.A. Perea, R. Fitzgerald, D.E. Campbell and W.R. Stockwell, Linking air quality and human health effects models: An application to the Los Angeles air basin, Environmental Health Insights 11: ((2017) ), 117863021773755. doi:10.1177/1178630217737551. |
[113] | G. Sun, S.J. Hoff, B.C. Zelle and M.A. Nelson, Forecasting daily source air quality using multivariate statistical analysis and radial basis function networks, Journal of the Air & Waste Management Association 58: ((2008) ), 1571–1578. doi:10.3155/1047-3289.58.12.1571. |
[114] | F.C. Tian, C. Kadri, L. Zhang, J.W. Feng, L.H. Juan and P.L. Na, A novel cost-effective portable electronic nose for indoor-/in-car air quality monitoring, in: 2012 International Conference on Computer Distributed Control and Intelligent Environmental Monitoring, IEEE, Zhangjiajie, Hunan, China, (2012) , pp. 4–8. doi:10.1109/CDCIEM.2012.9. |
[115] | R. Tiwari, S. Upadhyay, P. Singhal, U. Garg and S. Bisht, Air pollution level prediction system 8: ((2019) ), 8. |
[116] | X. Tong, J.M.W. Ho, Z. Li, K.-H. Lui, T.C.Y. Kwok, K.K.F. Tsoi and K.F. Ho, Prediction model for air particulate matter levels in the households of elderly individuals in Hong Kong, Science of The Total Environment ((2019) ), 135323. doi:10.1016/j.scitotenv.2019.135323. |
[117] | R. Trojanowski and V. Fthenakis, Nanoparticle emissions from residential wood combustion: A critical literature review, characterization, and recommendations, Renewable and Sustainable Energy Reviews 103: ((2019) ), 515–528. doi:10.1016/j.rser.2019.01.007. |
[118] | W.-T. Tsai, Overview of green building material (GBM) policies and guidelines with relevance to indoor air quality management in Taiwan, Environments 5: ((2017) ), 4. doi:10.3390/environments5010004. |
[119] | J. Vanus, R. Martinek, P. Bilik, J. Zidek, P. Dohnalek and P. Gajdos, New method for accurate prediction of CO2 in the smart home, in: 2016 IEEE International Instrumentation and Measurement Technology Conference Proceedings, IEEE, Taipei, Taiwan, (2016) , pp. 1–5. doi:10.1109/I2MTC.2016.7520562. |
[120] | N. Vidakis, M.A. Lasithiotakis and E. Karapidakis, Recodify: An intelligent environment and space hazard condition monitoring system based on WSN and IoT technology, in: Proceedings of the 22nd Pan-Hellenic Conference on Informatics – PCI’18, ACM Press, Athens, Greece, (2018) , pp. 300–305. doi:10.1145/3291533.3291554. |
[121] | P.J. Walsh, C.S. Dudney and E.D. Copenhaver, Indoor Air Quality, CRC Press, (1983) . |
[122] | F. Wang, B. Zhu, R. Li, D. Han, Z. Sun, S. Moon, Z. Gong and W. Yu, Smart control of indoor thermal environment based on online learned thermal comfort model using infrared thermal imaging, in: 2017 13th IEEE Conference on Automation Science and Engineering (CASE), IEEE, Xi’an, (2017) , pp. 924–925. doi:10.1109/COASE.2017.8256221. |
[123] | Y. Wang, A. Yalcin and C. VandeWeerd, Health and wellness monitoring using ambient sensor networks, Journal of Ambient Intelligence and Smart Environments 12: ((2020) ), 139–151. doi:10.3233/AIS-200553. |
[124] | Z. Wang and L. Wang, Intelligent control of ventilation system for energy-efficient buildings with CO2 predictive model, IEEE Trans. Smart Grid 4: ((2013) ), 686–693. doi:10.1109/TSG.2012.2229474. |
[125] | W. Wei, O. Ramalho, L. Malingre, S. Sivanantham, J.C. Little and C. Mandin, Machine learning and statistical models for predicting indoor air quality, Indoor Air 29: ((2019) ), 704–726. doi:10.1111/ina.12580. |
[126] | J. Weuve, Exposure to particulate air pollution and cognitive decline in older women, Arch Intern Med 172: ((2012) ), 219. doi:10.1001/archinternmed.2011.683. |
[127] | WHO, Household air pollution and health, 2018, https://www.who.int/news-room/fact-sheets/detail/household-air-pollution-and-health (accessed July 4, 2019). |
[128] | C.P. Wild, Complementing the genome with an “exposome”: The outstanding challenge of environmental exposure measurement in molecular epidemiology, Cancer Epidemiology Biomarkers & Prevention 14: ((2005) ), 1847–1850. doi:10.1158/1055-9965.EPI-05-0456. |
[129] | H. World, Organization, Burden of Disease from Household Air Pollution for 2012: Summary of Results, World Health Organization, Geneva, Switzerland, (2014) , https://www.who.int/phe/health_topics/outdoorair/databases/FINAL_HAP_AAP_BoD_24March2014.pdf?ua=1. |
[130] | World Health Organization, Ambient (outdoor) air quality and health, 2014, retrieved from World Health Organization, available from http://Www.Who.Int/Mediacentre/Factsheets/Fs313/En/ [last accessed on 2015 Nov 26]. |
[131] | R. Xiahou, J. Yi, L. He, W. He and T. Huang, Indoor air monitoring system based on Internet of things and its prediction model, in: Proceedings of the International Conference on Industrial Control Network and System Engineering Research – ICNSER2019, ACM Press, Shenyang, China, (2019) , pp. 58–63. doi:10.1145/3333581.3333582. |
[132] | Y. Xiang, R. Piedrahita, R.P. Dick, M. Hannigan, Q. Lv and L. Shang, A hybrid sensor system for indoor air quality monitoring, in: 2013 IEEE International Conference on Distributed Computing in Sensor Systems, IEEE, Cambridge, MA, USA, (2013) , pp. 96–104. doi:10.1109/DCOSS.2013.48. |
[133] | H. Xie, F. Ma and Q. Bai, Prediction of indoor air quality using artificial neural networks, in: 2009 Fifth International Conference on Natural Computation, IEEE, Tianjian, China, (2009) , pp. 414–418. doi:10.1109/ICNC.2009.502. |
[134] | Q. Xie, J. Ni and Z. Su, A prediction model of ammonia emission from a fattening pig room based on the indoor concentration using adaptive neuro fuzzy inference system, Journal of Hazardous Materials 325: ((2017) ), 301–309. doi:10.1016/j.jhazmat.2016.12.010. |
[135] | T.-C. Yu and C.-C. Lin, An intelligent wireless sensing and control system to improve indoor air quality: Monitoring, prediction, and preaction, International Journal of Distributed Sensor Networks 11: ((2015) ), 140978. doi:10.1155/2015/140978. |
[136] | T.-C. Yu, C.-C. Lin, R.-G. Lee, C.-H. Tseng and S.-P. Liu, Wireless sensing system for prediction indoor air quality, in: 2012 4th International High Speed Intelligent Communication Forum, IEEE, Nanjing, Jiangsu, China, (2012) , pp. 1–3. doi:10.1109/HSIC.2012.6213022. |
[137] | C. Zhang, S.R. Kuppannagari, R. Kannan and V.K. Prasanna, Building HVAC scheduling using reinforcement learning via neural network based model approximation, in: Proceedings of the 6th ACM International Conference on Systems for Energy-Efficient Buildings, Cities, and Transportation, ACM, New York NY USA, (2019) , pp. 287–296. doi:10.1145/3360322.3360861. |
[138] | N. Zhao, Y. Zhang, B. Li, J. Hao, D. Chen, Y. Zhou and R. Dong, Natural gas and electricity: Two perspective technologies of substituting coal-burning stoves for rural heating and cooking in Hebei Province of China, Energy Science & Engineering 7: ((2019) ), 120–131. doi:10.1002/ese3.263. |
[139] | H. Zheng, H. Li, X. Lu and T. Ruan, A multiple kernel learning approach for air quality prediction, Advances in Meteorology 2018: ((2018) ), 1–15. doi:10.1155/2018/3506394. |
[140] | D. Zhu, C. Cai, T. Yang and X. Zhou, A machine learning approach for air quality prediction: Model regularization and optimization, BDCC 2: ((2018) ), 5. doi:10.3390/bdcc2010005. |


