
Societal Costs of Dementia: 204 Countries, 2000–2019
Abstract
Background:
Dementia prevalence is expected to increase as populations grow and age. Therefore, additional resources will be needed to meet the global demand for care for Alzheimer’s disease and related dementias (ADRD).
Objective:
Estimate global and country-level health care spending attributable to ADRD and the cost of informal care for people living with ADRD.
Methods:
We gathered data from three systematic literature reviews and the Global Burden of Disease 2019 study. We used spatiotemporal Gaussian process regression to impute estimates for the many countries without underlying data. We projected future costs to 2050 based on past trends in costs, diagnosis rates, and institutionalization rate.
Results:
We estimated that in 2019, the direct health care spending attributable to ADRD across 204 countries reached $260.6 billion (95% uncertainty interval [UI] 131.6–420.4) and the cost of informal ADRD care was $354.1 billion (95% UI 190.0–544.1). On average, informal care represents 57% (95% UI 38–75%) of the total cost of care. We estimated that direct health care spending attributable to ADRD will reach $1.6 trillion (95% UI 0.6–3.3) in 2050, or 9.4% (95% UI 3.9–19.6%) of projected health spending worldwide. We estimated the cost of informal care will reach $0.9 trillion (95% UI 0.3–1.7) in 2050.
Conclusions:
These cost estimates underscore the magnitude of resources needed to ensure sufficient resources for people living with ADRD and highlight the role that informal care plays in provision of their care. Incorporating informal care cost estimates is critical to capture the social cost of ADRD.
INTRODUCTION
Currently over 57 million people are living with Alzheimer’s disease and other dementias (hereafter referred to as dementia) worldwide.1 This population is expected to grow to over 150 million by 2050, with the largest increases in the Middle East, North Africa, and eastern sub-Saharan Africa. As the world’s population grows and ages, dementia is becoming a growing priority in many countries.2
Dementia represents a significant economic burden, and historically treatment options have been limited. The progressive nature of the condition and lack of treatment options lead to extensive demand for personal care. This care, whether provided at a nursing home, by formal (paid) caregivers at home, or by informal (unpaid) caregivers such as family or friends, leads to high societal costs of dementia. In countries with aging populations, health policy is often focused on keeping individuals out of nursing homes and in the community.3,4 While it is important to support individuals who want to live independently, some studies have found that care in the community can be more expensive than nursing home care when the cost of informal care is taken into account.5 Understanding the full societal costs of dementia will be increasingly important as policymakers plan for the aging population and new disease-modifying treatments change the dementia care landscape.
A recent study by Wimo and colleagues6 estimated the global cost of dementia at US$1.3 trillion in 2019. This number includes all direct spending and caregiving provided to people living with dementia, rather than costs that are attributable solely to dementia. About half of the reported cost (US$651.4 billion) was due to informal care, with the remaining $661.9 billion going to direct costs, including the cost of long-term care. A prior study by Jia and colleagues found similar results, estimating that the global cost of dementia in 2015 was $958 billion and would increase to $2.5 trillion by 2030.7
Pedroza and colleagues8 focused on direct costs but used a detailed modeling framework that estimated separate costs for people who have diagnosed versus undiagnosed dementia, and those who live in nursing homes versus in the community. With this approach, their global estimates for direct spending on dementia were close to estimates from Wimo and colleagues. They estimated that $594 billion was spent worldwide on people living with dementia in 2019, with $263 billion being attributable to dementia. Other studies have found even higher economic burdens of dementia. Using the value of a statistical life to value the economic impact of dementia, Nandi and colleagues estimated global costs of dementia and found an economic burden of $2.8 trillion in 2019.9 While informative, these previous studies tend to be focused only on direct spending (Pedroza et al), ignore cost of informal care (Nandi et al), or are based on older data (Jia et al). 7 Of the existing global estimates for the cost of dementia care, our study is closest to the work by Wimo and colleagues.6 We add to their work in a few ways. First, we estimate direct spending attributable to dementia rather than direct spending on people living with dementia, i.e. we adjust the costs downward to account for the fact that many people living with dementia also have comorbidities that require care. We also explicitly model the percent of individuals with dementia symptoms who have a diagnosis. This allows us to estimate costs for diagnosed versus undiagnosed individuals separately, which is particularly important for a condition like dementia which often goes undiagnosed, even in high resource countries.10 We also allow this percentage to vary in future scenarios, given that improvements to the timeliness of dementia diagnoses is often listed as a goal in national dementia plans.11
Our work creates estimates for direct and indirect costs of dementia for 204 countries from 2000 through 2019 and projects these costs to 2050 under multiple scenarios. We use the framework developed by Pedroza and colleagues8 to model the fraction of people living with dementia who are undiagnosed, as well as the fraction of people who are living in nursing homes. Modeling these parameters allows us to examine the impact of accelerated diagnosis rates or institutionalization rates on future health spending.
METHODS
Overview
We model both direct and indirect costs of dementia. As the components included in these groups can vary in cost of illness studies, we define them as follows. Direct costs include medical spending such as doctor appointments, hospital visits, prescription drugs, paid home care, and nursing home care. Indirect costs include lost productivity of caregivers, operationalized as their estimated lost wages. While lost productivity of the person with the condition is often included in cost of illness studies, none of the studies we reviewed included this cost component.
Given the lack of formal treatment options, the stigma around a dementia diagnosis, and the lack of health care access in many parts of the world, it is relatively common for people to be living with undiagnosed dementia. For the purposes of estimating costs, we model people living with undiagnosed dementia and people living with diagnosed dementia separately. Our model also distinguishes between those living in nursing homes and those living in the community, due to the high cost of nursing facilities. Consequently, we model separately the costs for four groups of people living with dementia: diagnosed individuals in nursing homes, diagnosed individuals in the community, undiagnosed individuals in nursing homes, and undiagnosed individuals in the community. Modeled inputs used to make these estimates included 1) the population and dementia prevalence rates for each country and year, 2) diagnosis rates among prevalent cases, 3) the rate of nursing home– based care versus community-based care among diagnosed cases, 4) the rate of nursing home– based care among undiagnosed cases, and 5) the cost per patient of dementia care for patients receiving nursing home– based care and patients receiving community-based care. A diagram of our model is presented in Supplementary Figure 4.
We conducted systematic reviews to gather data on direct costs of dementia in the community and in institutions, the fraction of people living with dementia who have a formal diagnosis, the rate of nursing home– based care versus community-based care among diagnosed cases, the rate of nursing home– based care among undiagnosed cases, and time spent on informal caregiving. Many countries did not have any data on dementia costs, diagnosis rates, or caregiving available. To create estimates for all countries and years, we use a modeling process called spatiotemporal Gaussian progress regression (ST-GPR).12 Covariates that are available for all countries and year (e.g., total health expenditure), are selected using out-of-sample cross-validation to determine which have the strongest predictive power for the parameter in question, e.g., diagnosis rates. Predictions using these covariates are used as a prior distribution, which is then updated using the observations from the systematic review data using a Gaussian process. We sampled 1,000 draws from the resulting distribution of each modeled element (dementia prevalence, diagnosis rates, nursing home– based care rates among patients diagnosed and undiagnosed with dementia, and unit costs), and performed all calculations at the draw level to propagate uncertainty throughout the modeling process. Because of the dearth of primary input data and the reliance on modeling, we consider these estimates to be high-quality approximations and expect that true spending and costs will vary, in some cases substantially, from our estimates. Moving forward, more primary input data are needed to ensure more precise estimates less reliant on modeling.
Data
We used data from the following sources to generate our estimates of dementia costs. Disease prevalence estimates and forecasts were extracted from the Global Burden of Disease (GBD) 2019 study.1 These prevalence estimates include the following dementia subtypes: Alzheimer’s disease, vascular, Lewy Body, brain injury, alcohol-related, frontotemporal, and mixed dementia. As a sensitivity analysis, we created additional cost estimates using high and low prevalence rates based on the 85th and 15th percentile estimates from the GBD study. Diagnosis rates, the percentage of people with dementia symptoms who have a diagnosis of dementia, came from a systematic review conducted on November 29, 2022, on PubMed, Embase, and Web of Science. The search terms used were (dementia[MeSH Terms] OR alzheimer* OR dementia) AND (diagnosis[MeSH Terms] OR diagnosis) AND (“undiagnosed diseases”[MeSH Terms] OR “undiagnosed” OR “un-diagnosed” OR “under-diagnosed” OR “underdetected” OR “under-detected” OR “underdetection” OR “under-detection” OR “underrecognition” OR “under-recognition”). Further detail can be found in the Supplementary Material. Under-diagnosis of dementia is costly to study, given that cognitive assessments must be conducted on a representative sample of the population. We were able to find data on dementia diagnosis rates for 18 countries, and ST-GPR modeling was used to create a complete set of estimates.12 In summary, ST-GPR models give significant weight to observed data and, in the absence of data, the models borrow strength across time and geographies to generate a complete set of estimates along with uncertainty intervals. Covariates that are available across all countries and years are also included in the ST-GPR model to increase its predictive power. The covariates used in our model of the dementia diagnosis rate were total health expenditure and the fraction of the population over 65.13
Data on the fraction of diagnosed individuals receiving nursing home– based care were extracted from a second literature review, and then a complete set of estimates were modeled using ST-GPR. The second literature review used the terms (“Dementia”[MeSH Terms] OR alzheimer* OR dementia) AND (“Costs and Cost Analysis”[MeSH Terms] OR “Health Expenditures”[MeSH Terms] OR “Cost of Illness”[MeSH Terms]). It was conducted on November 29, 2022, on PubMed, Embase, and Web of Science. Those not receiving nursing home– based care were considered to be receiving community-based care. The percentage of people with undiagnosed dementia who live in a nursing home can be calculated based on other model parameters. A detailed derivation of this parameter can be found in the Supplementary Material. The covariate used in our model of care settings was GDP.
Data on annual health care costs for a person living with dementia were extracted from the second systematic literature review, described above. For this process, the unit cost of dementia care was calculated as the average annual cost for treating a dementia patient, stratified by patients receiving nursing home– based care versus community-based care. Due to limited data, we used ST-GPR to model dementia unit costs across all countries and years and to generate uncertainty. The covariate used in our model of unit costs was GDP.
Data on caregiving hours provided by informal (unpaid) caregivers was extracted from a third literature review. The third literature review used the terms (“Dementia”[MeSH Terms] OR alzheimer* OR dementia) AND ((patient care[MeSH Terms]) OR (informal care)) AND ((hours) OR (“caregiving time”)). It was conducted on November 29, 2022, on PubMed, Embase, and Web of Science. The covariate used in our model of caregiving hours was the Socio-demographic Index (SDI). The SDI is a proxy for development that combines multiple indicators and has been shown to be well correlated with health outcomes.14,15 It is calculated as a composite of total fertility in women under 25, income, and education. Some studies report aggregate caregiving time, while others report time by time spent assisting with activities of daily living, instrumental activities of daily living, and supervision, or various subsets of these categories. Therefore, our model estimates coefficients for each of these three categories. Our results are inclusive of all time spent on caregiving, i.e. the sum of time spent on supporting activities of daily living, instrumental activities of daily living, and supervision time.
Data on caregiver sex was also extracted from a subset of the sources found in the third literature review. The outcome variable modeled was the percentage of caregivers who are female. The covariates used in our model of caregiver sex were the fraction of the population over 65 and the percentage of the population that is female. Outliers for all models were identified using Cook’s distance.16 A list of the outliers excluded from analysis can be found in the Supplementary Material.
To estimate the value of caregivers’ time, we first split caregiving hours proportionally based on the percentage of caregivers who are male and female. We did not have data on the age breakdown of caregivers; therefore, we used the average wages by sex for each country and year. The average wages were estimated using a multi-step modeling process to combine wages data from the International Labour Organization and the Luxembourg Income Study.17,18 We first used ST-GPR modeling based on the International Labour Organization wage data to create an intermediate set of wage estimates that cover each country and year. We then created a final set of wage estimates based on the Luxembourg Income Study wage data, using ST-GPR and the intermediate wage estimates as a covariate. Finally, to account for the fact that some caregivers would likely not have been in the workforce, we scaled the wages by the labor force participation rate for each sex-country-year group.19
Using average wages and labor force participation rates for males and females assumes that within each sex, caregivers represent a random sample of individuals. However, caregivers are not a random sample of individuals, and their forgone wages are likely to be lower for several reasons. Caregivers of people living with dementia are often above traditional retirement age; some caregivers are able to continue with paid employment while providing care; and caregivers with lower educational attainment provide more hours of care on average.20 As a sensitivity analysis to account for caregivers having a below-average likelihood of being in the workforce, we estimated the costs of caregiving after adjusting the labor force participation rates down by 50%. Scaling the wage rate by the labor force participation rate implicitly assumes the leisure of lost due to caregivers has no value. We therefore conducted an additional sensitivity analysis in which labor force participation rate is set to 100% for all demographic groups, thereby valuing lost leisure time at the prevailing wage rate.
Attributable costs
Direct costs: Not all medical spending on people living with dementia is attributable to dementia; some of the spending is due to comorbidities. As part of our systematic review of unit costs, we found 34 sources that contained information on the percentage of costs that are attributable to dementia. We conducted a mixed-effects meta-regression21 with the data points from these sources to estimate the percentage of spending that is directly attributable to dementia care, rather than to care for other conditions. Studies that compared a group of people living with dementia to a control group but did not control for age, sex, or comorbidities were excluded from this analysis. We also performed a sensitivity analysis where these studies were included. Our model used care setting as a moderator and included four care settings: nursing home, community, mixed, or not reported. Given the small amount of data on attributable costs of dementia, we estimated one attributable fraction per care setting that was applied across all countries and years. To estimate uncertainty around our estimates, we ran a simulation based on the results of our meta-analysis. A more detailed explanation can be found in the Supplementary Material. Due to the lack of data on attributable costs of dementia for undiagnosed patients, we assumed that the attributable fraction for undiagnosed persons with dementia was half of that for persons diagnosed with dementia, following Pedroza and colleagues.8 We performed high and low sensitivity analyses using 75% and 25% of the attributable fraction for diagnosed patients.
The final unit cost was calculated by multiplying the estimated unit cost in each care setting by the corresponding attributable fraction.
Indirect costs: Similarly, not all caregiving hours provided to people living with dementia are attributable to dementia. As part of our systematic review of unit costs, we found 6 sources that contained information on the percentage of caregiving time that is attributable to dementia. We conducted a mixed-effects meta-regression with the data points from these sources to estimate the percentage of informal care that is directly attributable to dementia, rather than to comorbidities. The final annual informal care cost attributable to dementia was calculated by multiplying the estimated informal care cost by the caregiving attributable fraction. Unless otherwise specified, all estimates presented in this paper reflect health care spending and informal care costs attributable to dementia.
Modeling
Attributable health care spending and attributable informal care costs were estimated for each country and year from 2000 through 2019. Costs for each of the four modeled groups are calculated as follows: First, for diagnosed individuals in nursing homes, attributable costs were estimated as the total population multiplied by the dementia prevalence rate, the diagnosis rate, the percentage of diagnosed individuals in a nursing home setting, and the unit cost of medical spending for individuals in nursing homes, scaled by the attributable fraction for diagnosed patients in a nursing home setting. Second, for undiagnosed individuals in nursing homes, attributable costs were estimated as the total population multiplied by the dementia prevalence, one minus the diagnosis rate, the percentage of undiagnosed individuals in a nursing home setting, and the unit cost of medical spending for individuals in nursing homes, scaled by the attributable fraction for undiagnosed individuals in nursing homes. An attributable fraction for undiagnosed individuals could not be estimated directly, due to a lack of data on dementia treatment for people with undiagnosed dementia. Therefore, we assumed that the percentage of direct medical spending for undiagnosed individuals in nursing homes that is attributable to dementia is half of the value for diagnosed individuals in nursing homes. We also assumed that individuals living in nursing homes had no informal caregiving hours.
The third and fourth modeled groups are the diagnosed and undiagnosed individuals living in the community. For diagnosed individuals in the community, attributable costs were estimated as the total population multiplied by the dementia prevalence rate, the diagnosis rate, one minus the percentage of diagnosed individuals in a nursing home setting, and the total cost per prevalent case. The total cost for this group is the sum of direct and indirect costs; the direct cost is the unit cost of medical spending for individuals in the community, scaled by the attributable fraction for diagnosed patients in the community, and the indirect cost is the annual caregiving hours multiplied by the expected caregiver wage, scaled by the attributable fraction for caregiving. Finally, for undiagnosed individuals in the community, attributable costs were estimated as the total population multiplied by the dementia prevalence rate, one minus the diagnosis rate, one minus the percentage of diagnosed individuals in a nursing home setting, and the total cost per prevalent case. For undiagnosed individuals living in the community, we assumed that they did not have any medical spending attributable to dementia and therefore their total costs were solely composed of indirect costs. While we did not find any sources that report caregiving time for undiagnosed individuals living with dementia, we assumed that informal caregiving hours were the same for diagnosed or undiagnosed individuals living in the community.
Projections
We modeled country-specific dementia costs from 2020–2050 for a baseline scenario and four alternate scenarios. For our baseline forecast, we measured the country-specific annualized rates of change (AROC) for unit costs of medical spending for both nursing home– based care and community-based care and assumed these rates would continue through 2050. For the parameters that represent a percentage and are bounded between 0 and 1— diagnosis rates and nursing-home based care rates— we modeled the change from 2000 to 2019 as linear. To estimate future dementia prevalence, we used age-sex-specific projections for populations by country from GBD 2019 and multiplied these by age-sex-specific dementia prevalence rate projections from Nichols and colleagues.1 All future health spending estimates were adjusted to represent only costs attributable to dementia, as with the retrospective estimates.
Alternate scenarios. We modeled attributable dementia health care spending for the period 2020–2050 for four alternative scenarios. In all scenarios, we assumed that dementia prevalence was unchanged from our baseline scenario. For the first three alternative scenarios, we assumed that one of the following parameters— diagnosis rates, nursing home– based care rates, or unit costs— increased at an accelerated pace. To estimate the accelerated pace, we used the 85th percentile of the AROCs observed across countries for 2000–2019 as a minimum rate of change. If a country-specific AROC was lower than the 85th percentile AROC in the baseline scenario, we used the 85th percentile AROC to approximate a realistic but accelerated rate of increase. If a country-specific AROC was at or above the 85th percentile, it remained unchanged. For the fourth alternative scenario, we assumed that the nursing home– based care rate grew at a decelerated pace, using the 15th percentile AROC observed across all countries as a maximum rate of change. If a country-specific AROC was at or below the 15th percentile, it remained unchanged. This scenario was included due to preliminary evidence that newly available disease-modifying drugs may enable people living with dementia to stay in their homes longer.22
RESULTS
From our systematic review of dementia diagnosis rates, we identified a total of 874 results for title and abstract screening, of which six proceeded to full article review and extraction and standardization. From our systematic review of dementia costs, we identified a total of 1,357 results for title and abstract screening, of which 30 proceeded to full article review and extraction. From our systematic review of dementia caregiving, we identified a total of 1,263 results for title and abstract screening, of which 77 proceeded to full article review and extraction (see the Supplementary Material for details of the three systematic reviews).
Our meta-regression estimated that 41% (95% uncertainty interval [UI] 29–54%) of the health care spending on patients receiving community-based care who are diagnosed with dementia can be attributed to dementia care (Supplementary Figure 5). For patients receiving nursing home– based care who are diagnosed with dementia, we estimated that 74% (95% UI 32–99%) of total spending was attributable to dementia. For patients with dementia who receive nursing home– based care, but who lack a dementia diagnosis, we estimated that 37% (95% UI 16–49%) of spending was attributable to dementia. For indirect cost, our meta-regression estimated that 58% (95% UI 51–65%) of caregiving hours were attributable to dementia (Supplementary Figure 6). Unless otherwise noted, all estimates herein have been adjusted to reflect these attribution rates.
We estimated that in 2019, health care spending attributable to dementia was $260.6 billion (95% UI 131.6–420.4) and the cost of caregiving attributable to dementia was $354.1.2 billion (95% UI 190.0–544.1), bringing the total societal cost to $614.8 billion (95% UI 403.1–861.3) (Table 1). Globally, 71% (95% UI 67–75%) of caregivers were female. This proportion was even higher for low– income countries, with 85% (95% UI 80–90%) being female. The costs of dementia care are not distributed globally according to dementia prevalence. While high-income countries accounted for 78.8% % of total spending (95% UI 74.8–82.8%), they accounted for just 43.8% of total prevalence (95% UI 43.1–44.5%) in 2019. From 2000 to 2019, our estimates indicate that direct costs grew faster than informal care costs. We estimated an annual growth rate of 4.15% (95% UI 1.81–6.57%) for direct costs and 3.65% (95% UI 0.00–6.83%) for informal care costs. Growth rates for both direct costs and informal care costs were highest in the Southeast Asia, East Asia, and Oceania GBD super-region and lowest in the high-income GBD super-region (Table 1). A complete set of modeled cost estimates reported at the country level are included in the Supplementary Material in both US dollars and purchasing power parity (Supplementary Tables 21 and 22). Findings from our sensitivity analyses were qualitatively similar to our baseline findings and are shown in Supplementary Tables 29–36.
Table 1
Total cost of dementia in 2019 and annualized rate of change from 2000 to 2019 by World Bank Income Group and Global Burden of Disease super-region. All costs are adjusted for comorbidities
| Direct cost attributable to dementia in 2019 (In millions of USD) | Indirect cost (In millions of USD) | Total cost (In millions of USD) | Annualized rate of change 2000 to 2019 direct cost | Annualized rate of change 2000 to 2019 indirect cost | Annualized rate of change 2000 to 2019 total cost | |
| Global | $260 600 ($131 600–$420 400) | $354 100 ($190 000–$544 100) | $614 800 ($403 100–$861 300) | 4.2% (1.8% –6.6%) | 3.6% (0.0% –6.8%) | 3.9% (1.8% –5.7%) |
| World Bank Income Group | ||||||
| High income | $238 800 ($120 700–$382 400) | $245 800 ($125 900–$387 200) | $484 600 ($315 800–$674 100) | 3.8% (1.5% –6.2%) | 2.7% (–0.9% –5.9%) | 3.2% (1.2% –5.0%) |
| Upper middle income | $20 900 ($10 700–$34 500) | $91 800 ($48 700–$137 700) | $112 700 ($67 500–$163 400) | 11.0% (7.9% –14.3%) | 7.4% (4.0% –10.5%) | 7.9% (5.1% –10.5%) |
| Lower middle income | $1 000 ($500–$1 600) | $13 900 ($7 900–$20 100) | $14 900 ($9 000–$21 200) | 7.6% (4.7% – 10.7%) | 5.3% (2.3% – 7.6%) | 5.4% (2.6% – 7.6%) |
| Low income | $33 ($15–$54) | $2 600 ($1 900–$3 300) | $2 600 ($1 900–$3 300) | 4.8% (2.0% – 7.7%) | 4.6% (2.9% – 6.0%) | 4.6% (2.9% – 6.0%) |
| Global Burden of Disease Super Regions | ||||||
| Central Europe, Eastern Europe, and Central Asia | $3 700 ($1 900–$6 200) | $17 900 ($8 900–$27 400) | $21 600 ($12 700–$31 700) | 6.5% (3.4% – 9.7%) | 5.0% (1.3% – 8.2%) | 5.3% (2.3% – 7.9%) |
| High-income | $235 900 ($119 300–$377 400) | $237 700 ($121 700–$374 100) | $473 600 ($308 200–$658 700) | 3.8% (1.5% – 6.2%) | 2.6% (–1.0% –5.8%) | 3.2% (1.2% –4.9%) |
| Latin America and Caribbean | $2 500 ($1 300–$4 100) | $13 600 ($7 200–$20 000) | $16 000 ($9 700–$22 900) | 6.1% (3.0% – 9.3%) | 4.2% (0.9% – 6.9%) | 4.5% (1.7% – 6.8%) |
| North Africa and Middle East | $1 100 ($500–$1 800) | $4 000 ($1 800–$6 600) | $5 100 ($2 800–$7 900) | 6.7% (3.9% – 9.7%) | 4.8% (0.8% – 8.6%) | 5.2% (2.0% – 8.2%) |
| South Asia | $400 ($200–$700) | $5 500 ($3 500–$7 300) | $5 900 ($4 000–$7 800) | 11.1% (8.1% – 14.2%) | 6.7% (4.3% – 8.2%) | 6.9% (4.8% – 8.4%) |
| Southeast Asia, East Asia, and Oceania | $16 900 ($8 600–$27 900) | $70 300 ($36 300–$107 100) | $87 100 ($51 500–$126 800) | 14.0% (10.8% – 17.3%) | 8.8% (5.4% – 11.9%) | 9.5% (6.8% – 12.2%) |
| Sub-Saharan Africa | $200 ($100–$300) | $5 100 ($3 400–$6 800) | $5 300 ($3 600–$7 000) | 4.7% (1.9% – 7.7%) | 4.0% (1.8% – 5.6%) | 4.0% (1.9% – 5.6%) |
The direct costs of dementia made up 3.0% (95% UI 1.5–4.9%) % of total health spending13 in 2019, varying from 3.5% (95% CI 1.8–5.6%) in high-income countries to only 0.1% (95% CI 0.1–0.2) in low-income countries. If past trends continue, dementia care will take up an increasing share of total health spending, climbing to 9.4% (95% CI 3.9–19.6%) globally by 2050 (Supplementary Table 26).
Our global estimate for societal costs attributable to dementia was $79 (95% UI 52–111) per capita in 2019 (Table 2). Of this cost, $34 (95% UI 17–54) was for direct medical spending and $46 (95% UI 25–70) was for informal care. Per capita costs of dementia increase with GDP per capita, ranging from $3.56 (95% UI 2.57–4.55) in World Bank– defined low-income countries to $401 (95% UI 262–558) in high-income countries (Table 1, Supplementary Figure 7). Table 2 also shows costs per prevalent case of dementia. The per-case direct costs increase with GDP, but the indirect costs follow a U-shaped pattern, with slightly higher costs in the low-income region than the lower-middle-income region.
Table 2
Costs per capita and costs per prevalent case of dementia in 2019 by World Bank Income Group and Global Burden of Disease super-region. All costs are adjusted for comorbidities
| Direct cost attributable to dementia per person in 2019 (USD) | Indirect cost per person (USD) | Total cost per person (USD) | Direct cost attributable to dementia per case in 2019 (USD) | Indirect cost per case (USD) | Total cost per case (USD) | |
| Global | $34 ($17–$54) | $46 ($25–$70) | $79 ($52–$111) | $4 542 ($2 357–$7 239) | $6 169 ($3 328–$9 391) | $10 711 ($6 989–$14 549) |
| World Bank Income Group | ||||||
| High income | $198 ($100–$317) | $204 ($104–$321) | $401 ($262–$558) | $11 181 ($5 751–$17 612) | $11 506 ($5 970–$18 035) | $22 687 ($14 522–$31 073) |
| Upper middle income | $8 ($4–$13) | $34 ($18–$51) | $42 ($25–$61) | $831 ($433–$1 368) | $3 656 ($2 011–$5 346) | $4 487 ($2 765–$6 303) |
| Lower middle income | $0.31 ($0.15–$0.51) | $4 ($3–$6) | $5 ($3–$7) | $101 ($50–$167) | $1 467 ($851–$2 063) | $1 568 ($951–$2 158) |
| Low income | $0.04 ($0.02–$0.07) | $4 ($3–$5) | $4 ($3–$5) | $22 ($11–$37) | $1 768 ($1 309–$2 177) | $1 790 ($1 334–$2 199) |
| Global Burden of Disease Super Regions | ||||||
| Central Europe, Eastern Europe, and Central Asia | $9 ($5–$15) | $43 ($21–$66) | $52 ($30–$76) | $704 ($371–$1 163) | $3 398 ($1 741–$5 140) | $4 102 ($2 385–$5 790) |
| High-income | $218 ($110–$348) | $219 ($112–$345) | $437 ($284–$608) | $11 857 ($6 100–$18 648) | $11 946 ($6 188–$18 741) | $23 803 ($15 237–$32 597) |
| Latin America and Caribbean | $4 ($2–$7) | $23 ($12–$34) | $28 ($17–$39) | $646 ($339–$1 071) | $3 555 ($1 902–$5 100) | $4 201 ($2 491–$5 808) |
| North Africa and Middle East | $2 ($1–$3) | $7 ($3–$11) | $8 ($5–$13) | $392 ($183–$652) | $1 426 ($670–$2 322) | $1 818 ($1 005–$2 730) |
| South Asia | $0.23 ($0.1–$0.38) | $3 ($2–$4) | $3 ($2–$4) | $81 ($39–$134) | $1 089 ($729–$1 384) | $1 170 ($805–$1 479) |
| Southeast Asia, East Asia, and Oceania | $8 ($4–$13) | $33 ($17–$50) | $40 ($24–$59) | $902 ($459–$1 485) | $3 754 ($2 018–$5 591) | $4 657 ($2 877–$6 587) |
| Sub-Saharan Africa | $0.16 ($0.07–$0.26) | $5 ($3–$6) | $5 ($3–$7) | $92 ($45–$154) | $2 760 ($1 890–$3 525) | $2 853 ($1 978–$3 641) |
The uneven distribution of costs is particularly pronounced for direct spending, with high-income countries accounting for 91.6% (95% UI 90.3–92.7%) of direct costs (Fig. 1A) despite only making up 37.3% (95% UI 35.9–38.5%) of prevalent cases. In terms of informal care, the distribution of costs is slightly more balanced, with high-income countries accounting for 69.2% (95% UI 64.7–73.5%) of indirect costs (Fig. 1A). Globally, we estimated that 85.4% (95% UI 80.8–89.2%) of people living with dementia are living in the community, with the remainder in nursing home care (Fig. 1B). Nursing homes have an outsized impact on the cost of dementia care, making up 69.6% (95% UI 49.4–80.4%) of the direct cost of dementia. However, when informal care costs are included, nursing home–based care drops to 25.7% (95% UI 11.7–41.7%) of global costs.
Fig. 1
Dementia prevalence and costs by World Bank income group and care setting/diagnosis status in 2019.
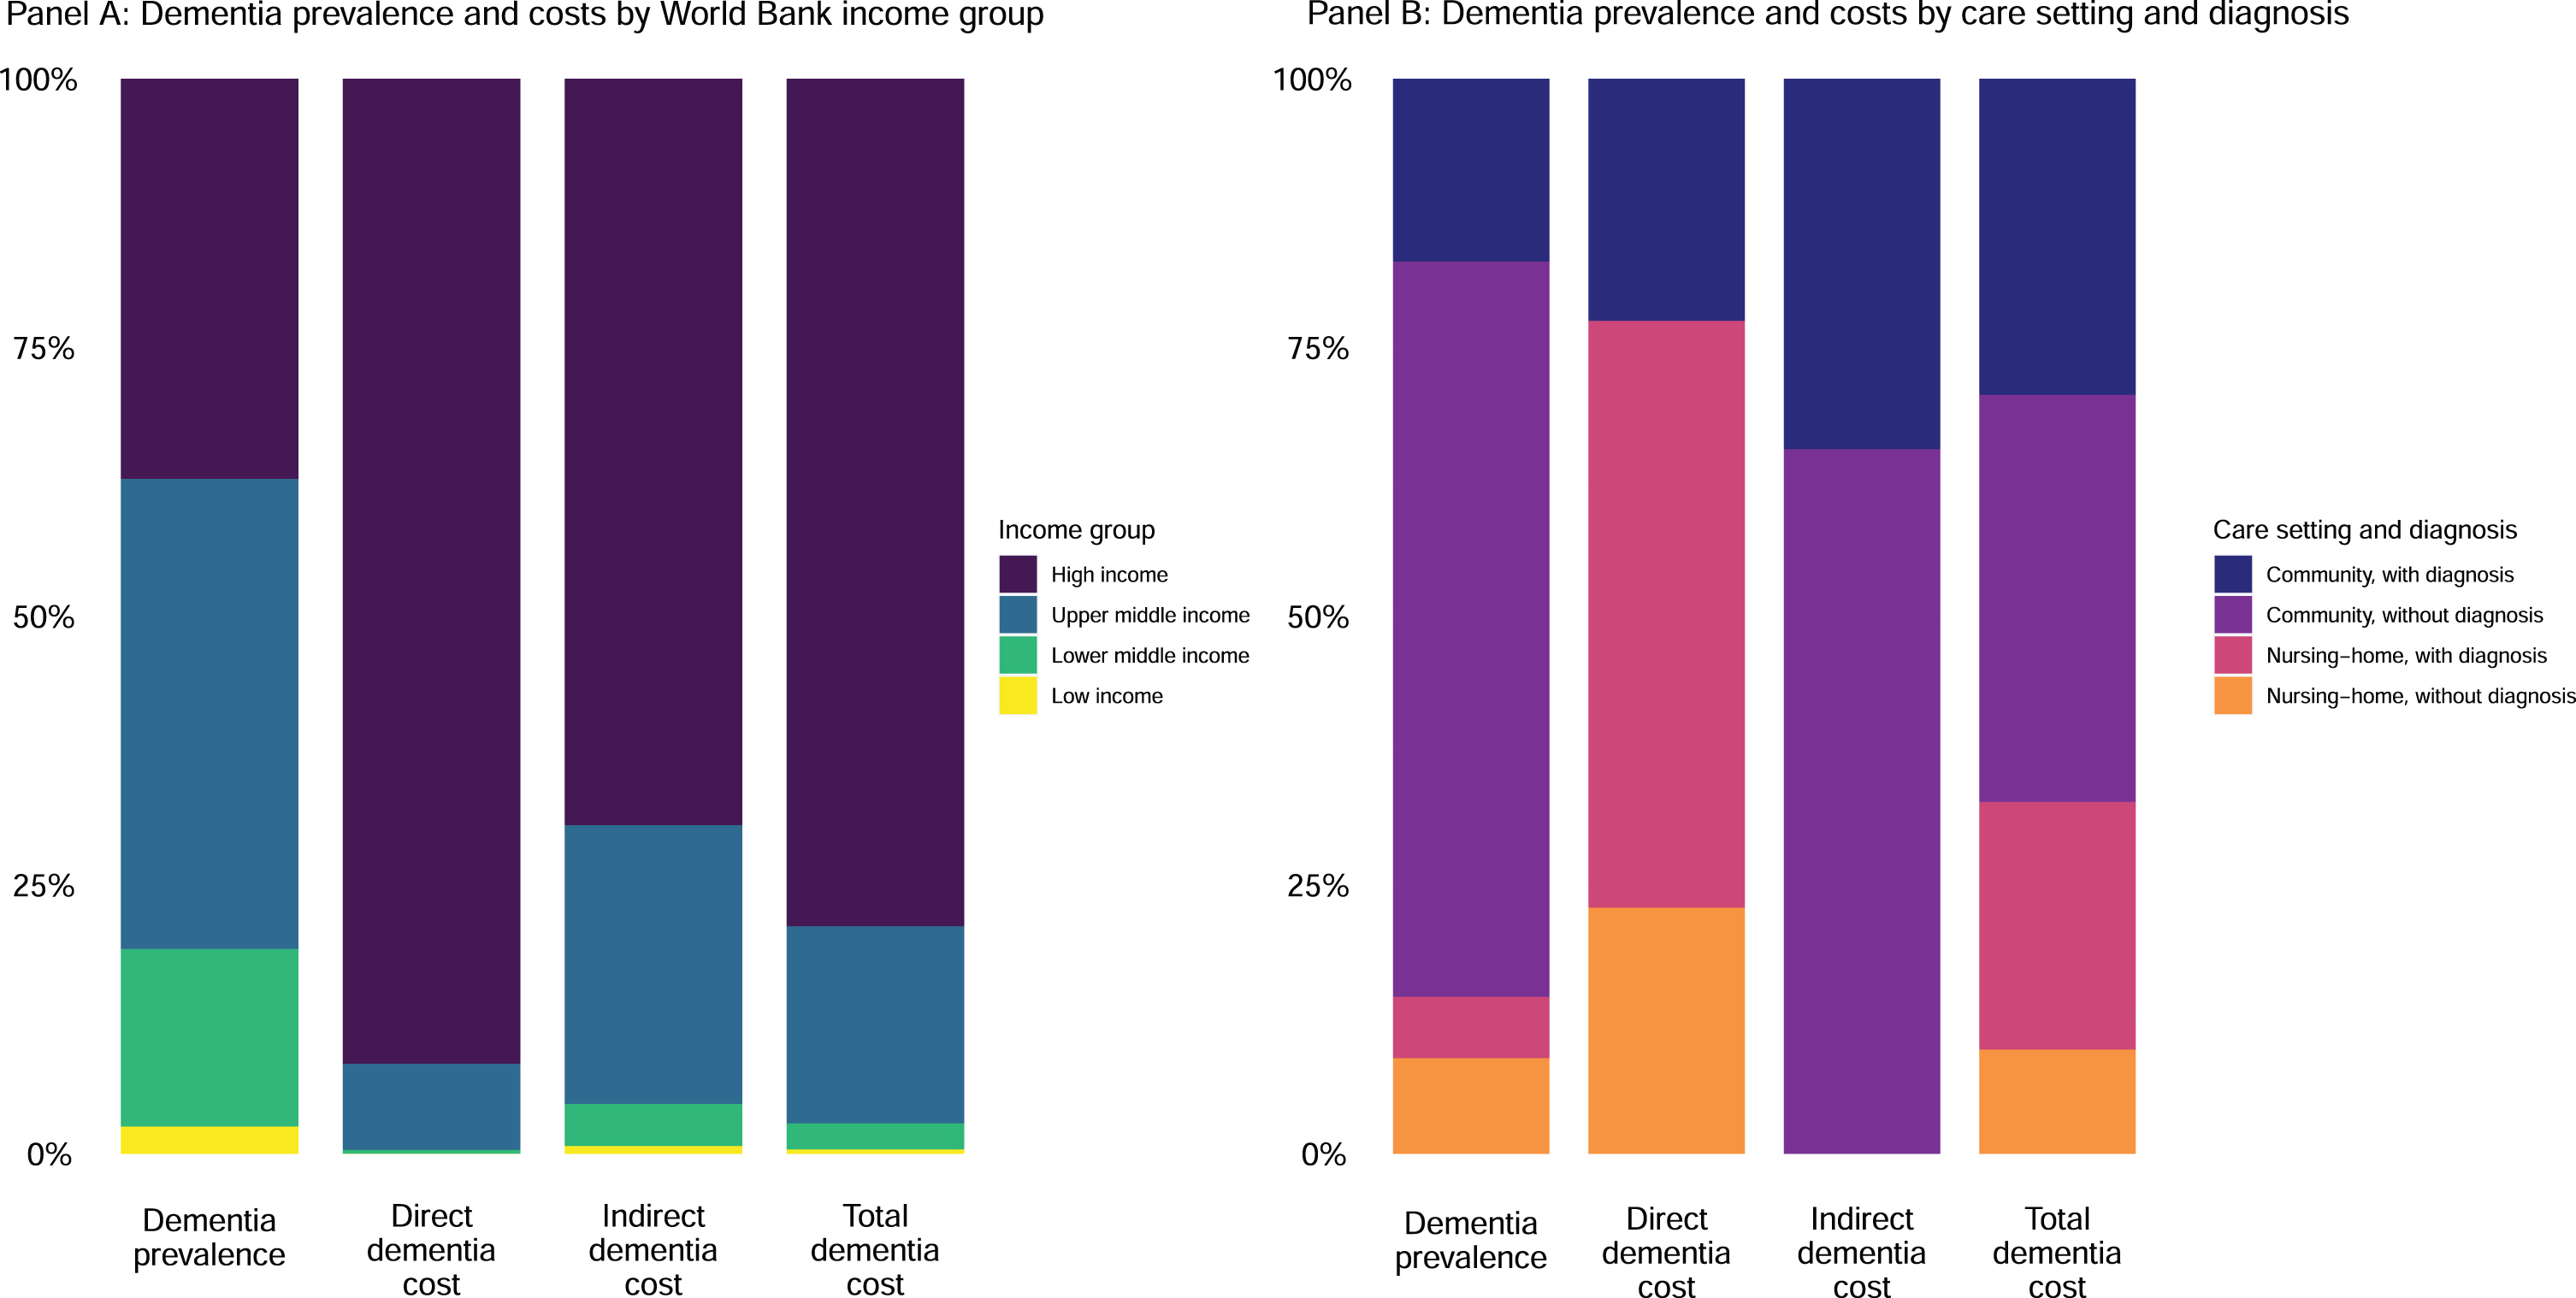
Fig. 2
Das Gupta decomposition by GBD region.
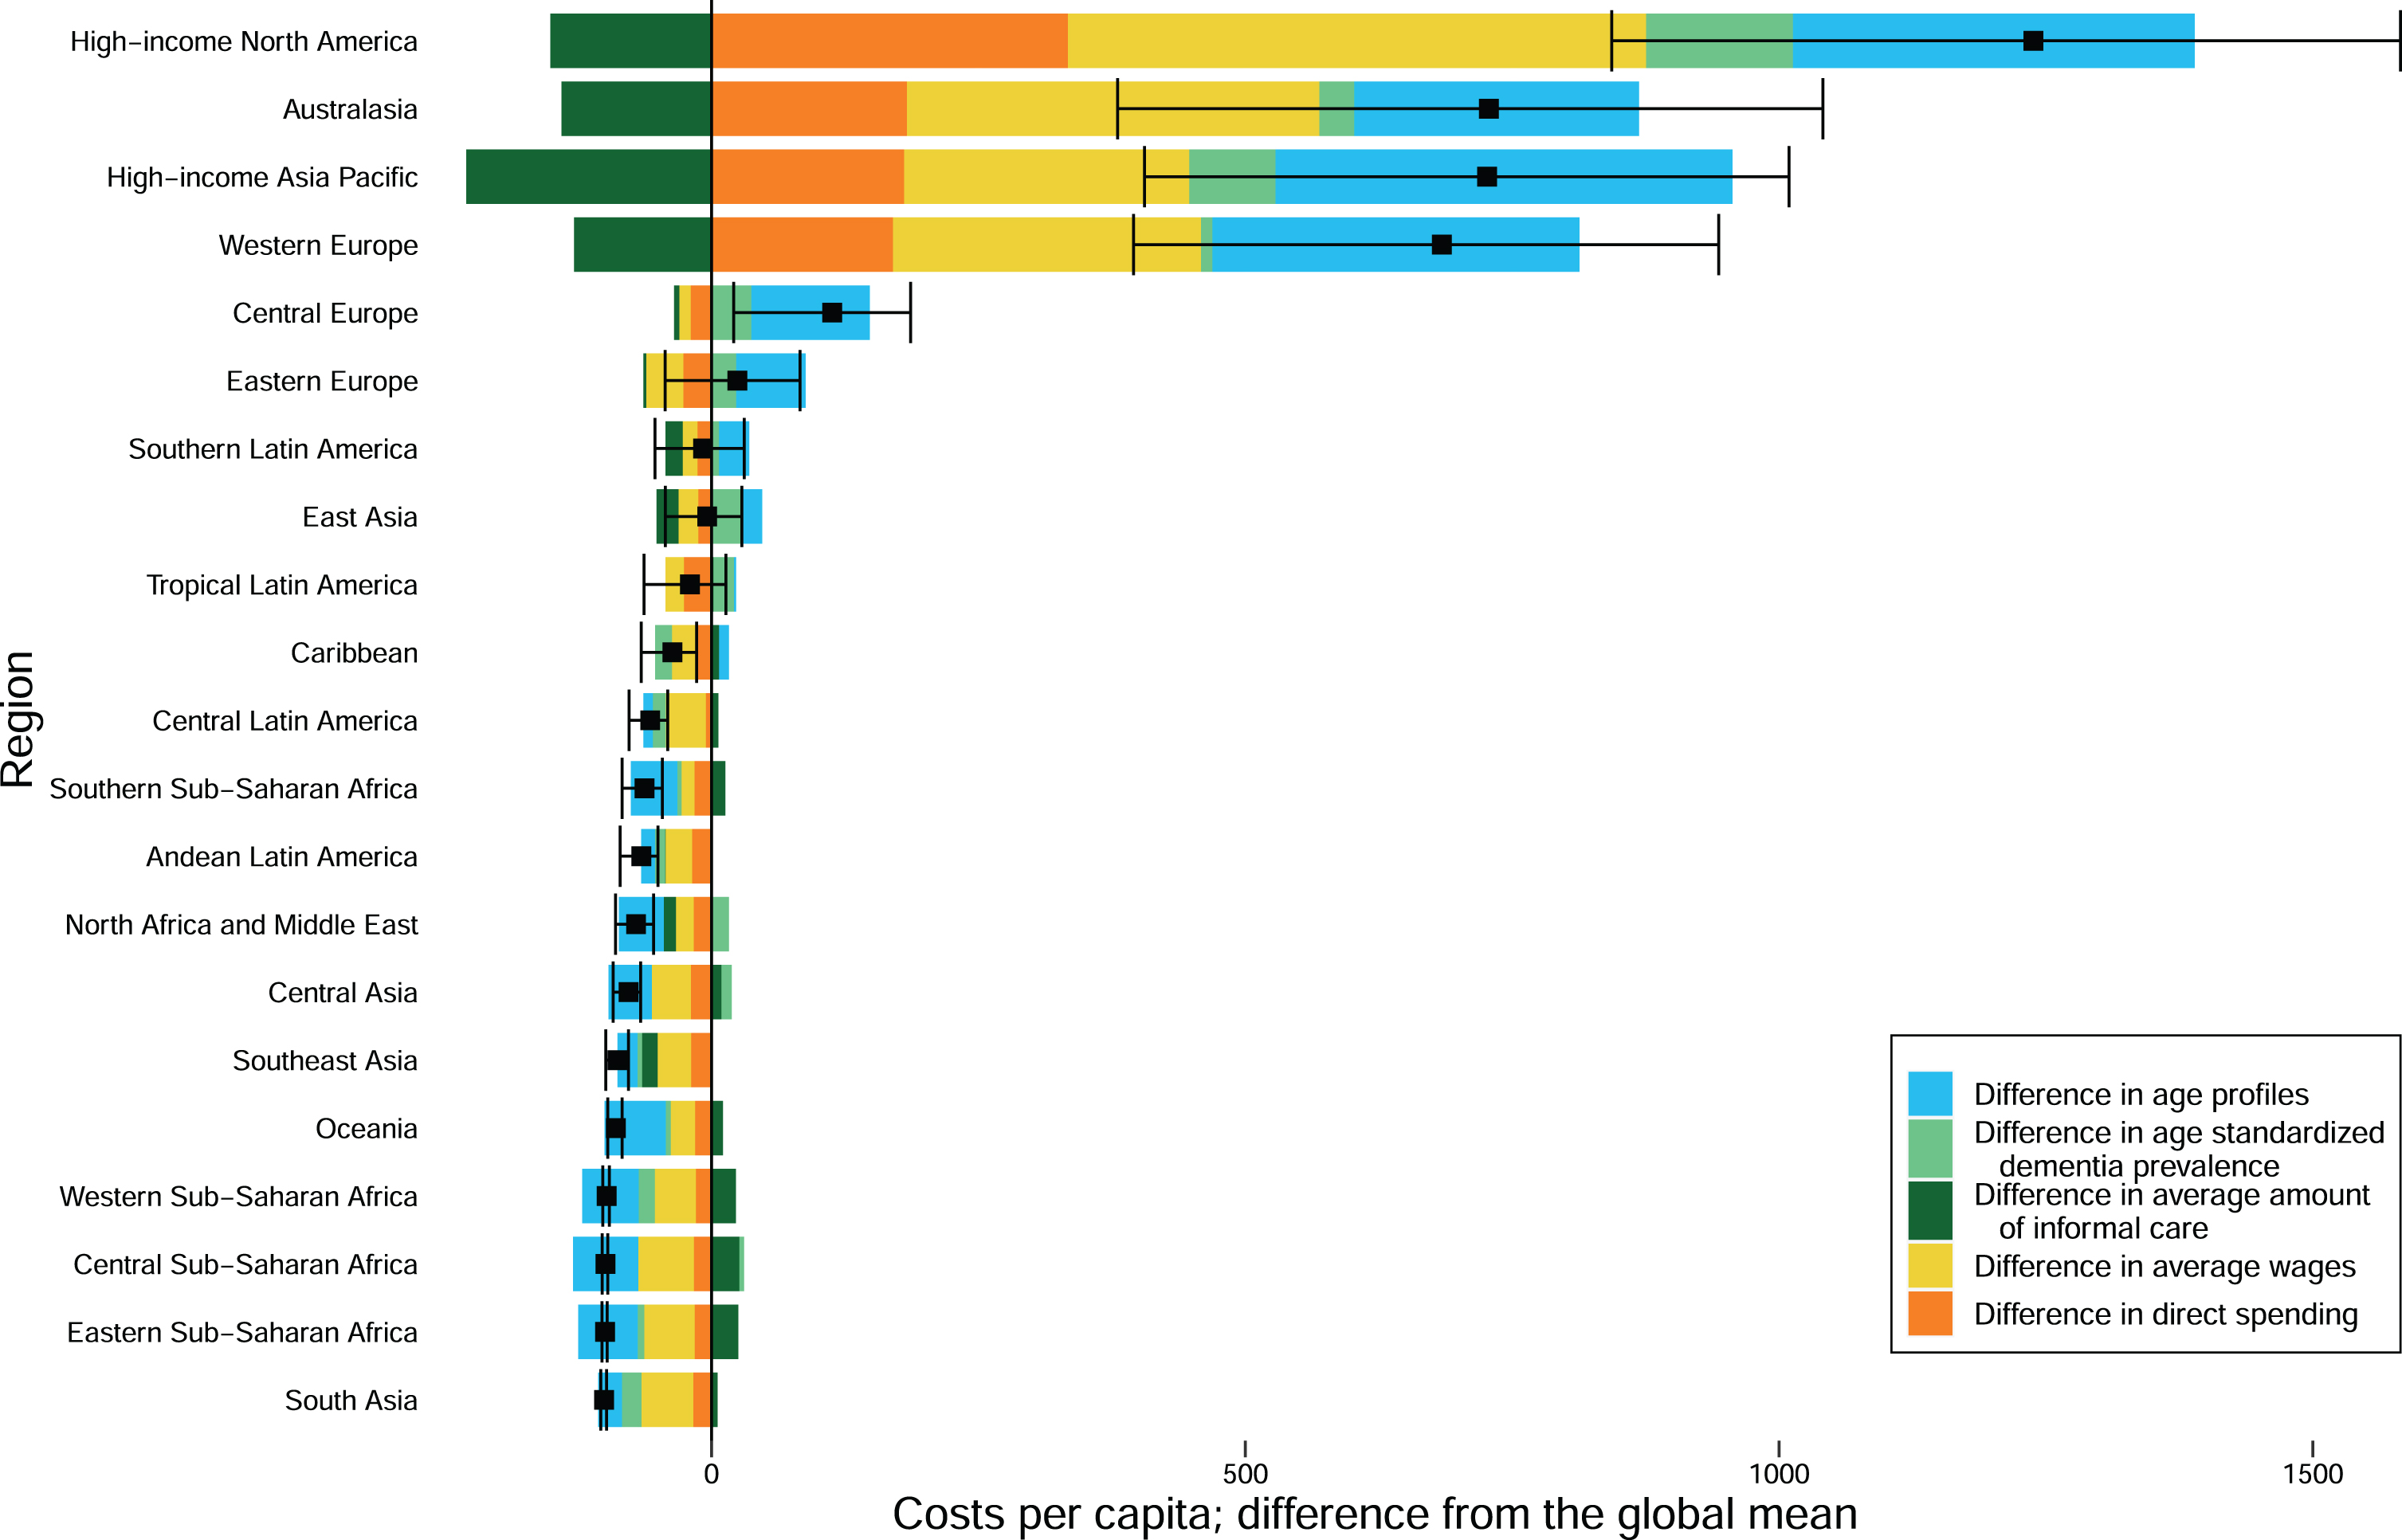
To examine the role of dementia prevalence and age structure in total cost, we decomposed the cost of dementia into five components— the age-standardized prevalence; the ratio of prevalence to age-standardized prevalence, herein denoted age ratio; the direct cost; the number of caregiving hours; and the expected wage (wage scaled by labor force participation) of the caregiver. Most regions with older populations also had higher direct costs and higher indirect costs due to higher expected wages for caregivers. Eastern Europe, Southern Latin America, East Asia, and the Caribbean were the only exceptions that had older than average populations but below average costs.
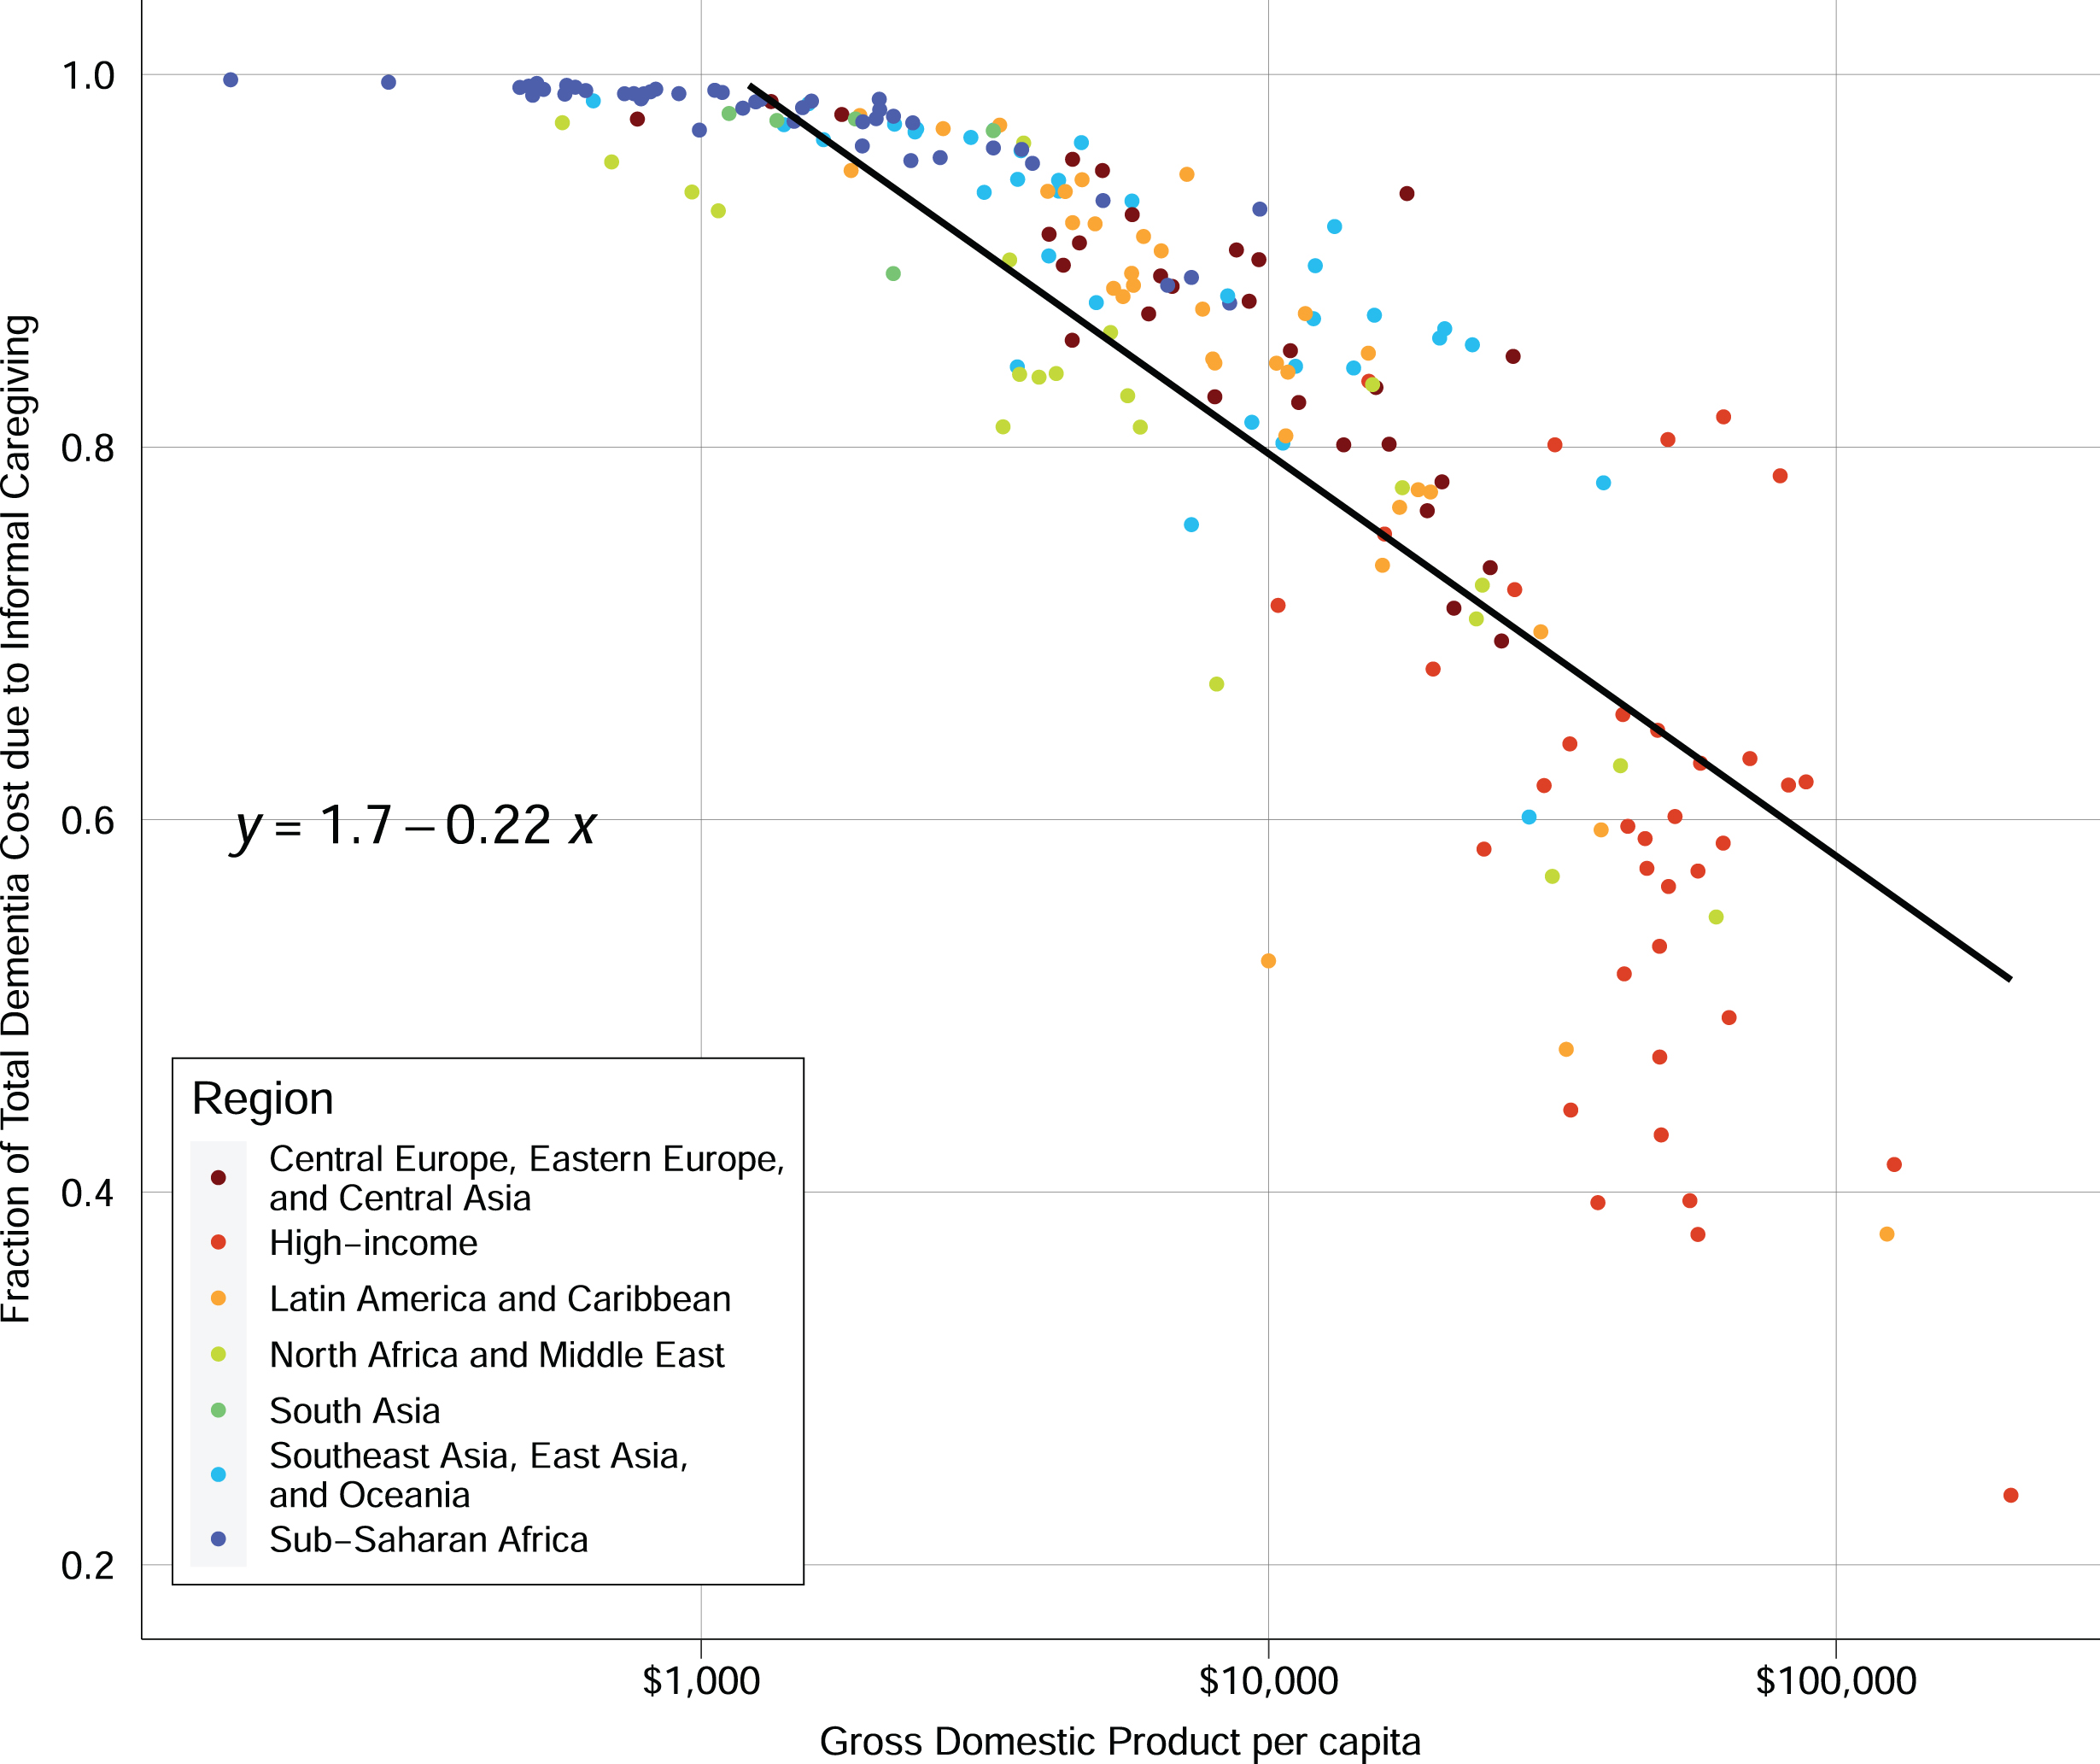
Informal caregiving is a large component of dementia care in all countries, but it plays an especially important role in some low-income countries (Fig. 3). While absolute costs for both direct medical spending and caregiving are higher in high-income countries, the relative contribution of caregiving to total costs decreases with GDP (Fig. 3). In many sub-Saharan African countries, the costs of dementia are almost entirely due to informal care.
Fig. 3
Informal care fraction of total dementia spending versus GDP per capita. Notes: In the linear regression equation shown, x represents the log base 10 of GDP and y represents the fraction of total spending on informal care.
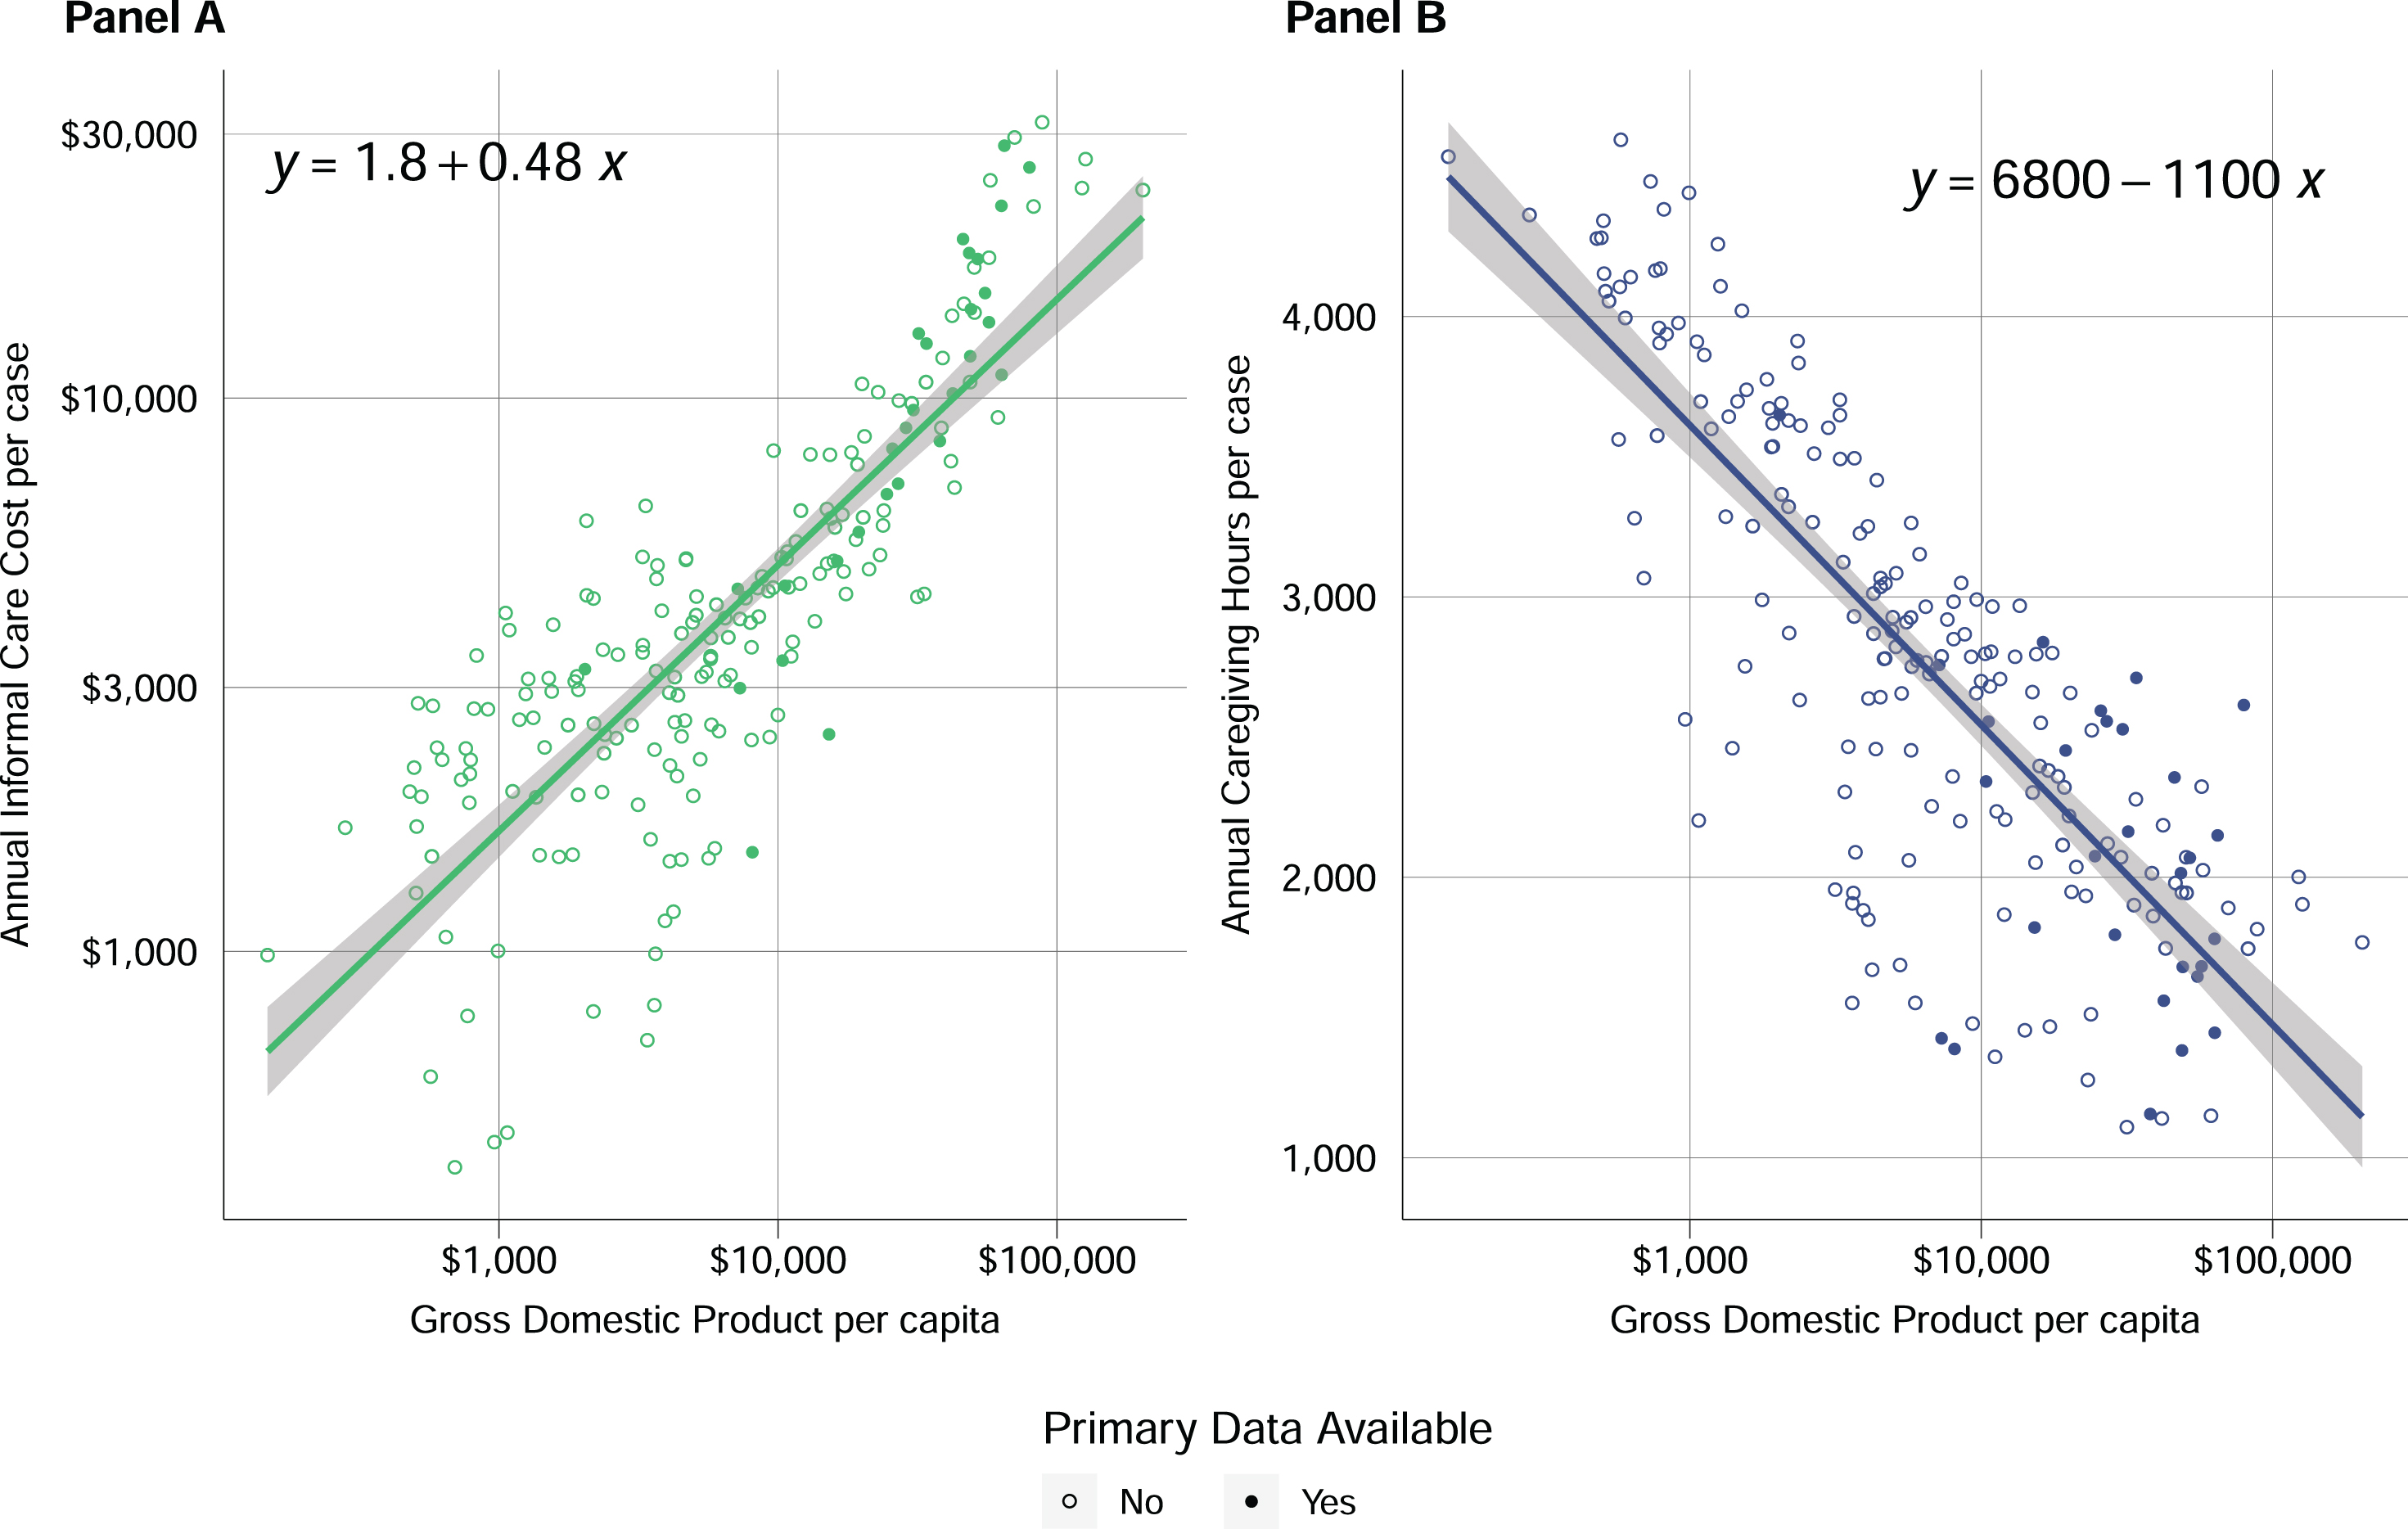
Although informal care makes up a decreasing share of dementia care as GDP rises, the cost of informal care is increasing with GDP (Fig. 4A). This increase in cost occurs despite estimated per-case annual hours of caregiving declining with GDP (Fig. 4B), highlighting the large differences in wages across countries.
Fig. 4
A) Annual informal care cost per case versus GDP per capita. In the equation shown, x represents the log base 10 of GDP. and y represents the log base 10 of the cost of informal care. B) Annual informal caregiving hours per case versus GDP per capita. In the equation shown, x represents the log base 10 of GDP, and y represents the number of caregiving hours provided per year.
Under our baseline scenario, dementia costs will increase from $79 (95% UI 52–111) per person in 2019 (Table 2) to $268 (95% UI 132–490) in 2050 (Table 3). The scenario with accelerated diagnosis rates led to estimated dementia spending of $273 (95% UI 134–499) per person. Using the 85th percentile for the accelerated diagnosis rate did not lead to large changes, with the global average diagnosis rate reaching 20% (95% UI 16–24%) in the baseline scenario versus 23% (95% UI 19–28%) in the accelerated scenario (Table 4). The scenario with accelerated nursing home– based care rates yielded global spending estimates of $282 (95% UI 142–509 per person, while the scenario with decelerated nursing home– based care rates yielded spending estimates of $236 (95% UI 117–$434) per person. Of the parameters modified by these scenarios, accelerating the direct costs had the largest impact, leading to per-person costs of $336 (95% UI 177–575) in 2050 (Table 2).
Table 3
Estimated attributable dementia spending, by World Bank income groups and GBD super regions, 2050 – baseline and alternative scenarios
| Cost attributable to dementia 2050 (In millions of USD) | Cost per person attributable to dementia – baseline (USD) | Cost per person attributable to dementia – accelerated diagnosis rates | Cost per person attributable to dementia – accelerated unit costs | Cost per person attributable to dementia – accelerated nursing homed based care rates | Cost per person attributable to dementia – decelerated nursing homed based care rates | |
| Global | $2 478 000 (1 218 200–4 581 500) | $268 (132–490) | $273 (134–499) | $336 (177–575) | $282 (142–509) | $236 (117–434) |
| World Bank Income Group | ||||||
| High income | $1 038 000 (560 200–1 711 400) | $863 (459–1 425) | $892 (475–1 475) | $1 364 (691–2 296) | $966 (512–1 571) | $826 (440–1 366) |
| Upper middle income | $1 353 100 (605 500–2 739 100) | $525 (234–1 044) | $527 (235–1 048) | $532 (241–1 042) | $526 (235–1 047) | $426 (183–878) |
| Lower middle income | $71 200 (31 900–130 500) | $18 (8–33) | $18 (8–34) | $18 (8–33) | $18 (8–33) | $17 (7–32) |
| Low income | $15 700 (8 000–24 700) | $11 (5–17) | $11 (5–17) | $11 (6–17) | $11 (5–17) | $11 (5–17) |
| Global Burden of Disease Super Regions | ||||||
| Central Europe, Eastern Europe, and Central Asia | $84 500 (38 800–149 200) | $218 (102–398) | $224 (105–411) | $227 (113–394) | $219 (102–400) | $216 (98–390) |
| High-income | $995 800 (541 600–1 638 500) | $917 (490–1 522) | $948 (507–1 576) | $1 461 (748–2 469) | $1 029 (544–1 683) | $879 (471–1 457) |
| Latin America and Caribbean | $52 200 (23 900–93 100) | $79 (36–141) | $81 (37–145) | $97 (50–164) | $81 (37–143) | $75 (34–136) |
| North Africa and Middle East | $30 700 (13 600–57 200) | $36 (16–68) | $39 (17–73) | $46 (22–81) | $38 (17–71) | $31 (13–59) |
| South Asia | $31 700 (15 200–55 300) | $15 (7–27) | $15 (7–27) | $15 (7–27) | $15 (7–27) | $14 (7–25) |
| Southeast Asia, East Asia, and Oceania | $1 257 200 (556 200–2 564 000) | $626 (278–1 255) | $626 (278–1 255) | $630 (284–1 256) | $627 (278–1 256) | $502 (213–1 047) |
| Sub-Saharan Africa | $25 800 (12 600–42 700) | $12 (6–20) | $12 (6–20) | $12 (6–20) | $12 (6–20) | $12 (6–20) |
Table 4
Diagnosis rates and nursing home care rates in 2019 and 2050
| Diagnosis rates 2019 | Diagnosis rates 2050 (Baseline) | Diagnosis rates 2050 (Accelerated) | Nursing home-based care rates 2019 | Nursing home-based care rates 2050 (Baseline) | Nursing home-based care rates 2050 (Accelerated) | Nursing home-based care rates 2050 (Decelerated) | |
| Global | 13% (10–16%) | 20% (16–24%) | 23% (19–28%) | 12% (10–14%) | 14% (12–17%) | 17% (14–20%) | 8% (6–9%) |
| World Bank Income Group | |||||||
| High income | 42% (35–52%) | 56% (47–68%) | 64% (55–75%) | 29% (25–34%) | 28% (23–34%) | 39% (33–45%) | 22% (18–27%) |
| Upper middle income | 12% (10–15%) | 30% (24–36%) | 32% (27–40%) | 12% (10–14%) | 21% (18–25%) | 22% (19–26%) | 8% (7–10%) |
| Lower middle income | 5% (4–6%) | 8% (7–11%) | 11% (9–14%) | 7% (6–8%) | 9% (7–11%) | 10% (8–12%) | 5% (4–6%) |
| Low income | 3% (2–3%) | 4% (3–5%) | 6% (5–8%) | 4% (3–5%) | 5% (4–6%) | 6% (5–7%) | 3% (2–3%) |
| Global Burden of Disease Super Regions | |||||||
| Central Europe, Eastern Europe, and Central Asia | 15% (12–19%) | 23% (18–29%) | 29% (24–36%) | 13% (11–16%) | 16% (13–19%) | 18% (15–22%) | 9% (8–11%) |
| High-income | 45% (37–55%) | 59% (50–71%) | 68% (58–78%) | 30% (25–35%) | 28% (23–34%) | 39% (34–46%) | 23% (19–28%) |
| Latin America and Caribbean | 17% (13–22%) | 29% (23–36%) | 34% (27–41%) | 10% (8–11%) | 12% (10–14%) | 14% (12–17%) | 7% (6–8%) |
| North Africa and Middle East | 8% (6–10%) | 11% (9–14%) | 17% (13–21%) | 11% (9–13%) | 13% (10–15%) | 14% (12–17%) | 7% (6–9%) |
| South Asia | 4% (3–6%) | 9% (7–11%) | 11% (8–14%) | 6% (5–8%) | 10% (8–12%) | 10% (9–12%) | 5% (4–6%) |
| Southeast Asia, East Asia, and Oceania | 9% (7–11%) | 27% (22–33%) | 27% (22–33%) | 11% (9–13%) | 21% (18–24%) | 22% (19–26%) | 8% (6–9%) |
| Sub-Saharan Africa | 3% (3–4%) | 4% (3–5%) | 8% (6–10%) | 5% (4–6%) | 6% (5–7%) | 8% (6–9%) | 4% (3–4%) |
DISCUSSION
We updated the work of Pedroza and colleagues8 and extended their models to include the cost of informal care. We estimated that the global costs of dementia were approximately US$600 billion in 2019 and are likely to rise to over $2 trillion by 2050. Despite a goal from the World Health Organization (WHO) Action Plan on the Public Health Response to Dementia 2017–20254 for 50% of countries to have a 50% diagnosis rate for individuals living with dementia by 2025, we estimated that only 13% (95% UI 10–16%) of individuals living with dementia had a diagnosis in 2019. We also found that a large majority of people living with dementia live in the community, with only 12% (95% UI 10–14%) living in nursing homes.
Our estimate of US$600 billion for the worldwide cost of dementia in 2019 is substantially smaller than the estimate of US$1.3 trillion from Wimo and colleagues.6 The largest difference between our methodologies is that Wimo reported all spending on people living with dementia, while we estimated costs attributable to dementia by implementing a comorbidity adjustment for both direct and indirect costs. This approach avoids double-counting costs for people with more than one condition, which is particularly relevant for dementia as multimorbidity is known to increase with age.23 Our global cost estimate without comorbidity adjustment was US$1.1 trillion, aligning more closely to Wimo’s estimate.
The additional sources found in our updated systematic reviews resulted in significant changes relative to the work by Pedroza and colleagues.8 Our diagnosis rate was smaller than the rate of 29% found by Pedroza and colleagues, due largely to a diagnosis rate of only 4% in Thailand that was added from our systematic review. Our rate of people living with dementia who are in nursing homes was also much smaller than the estimate of 23% from Pedroza and colleagues. High-income Asian Pacific countries had much smaller rates of nursing home residence in our model due to new data from South Korea. These large downward revisions highlight the sparsity of data underlying our models and the pressing need for data from a wider geographic representation.
We estimated that the indirect cost of informal care for people living with dementia makes up over half of the societal cost, echoing findings from Wimo and colleagues.6 While there are massive differences in costs between high-income countries and low-income countries, the inclusion of indirect costs narrows the gap somewhat. We estimated that direct costs in World Bank– defined high-income countries were over 7,000 times higher than direct costs in low-income countries, but when considering all costs, the ratio of high- to low-income countries drops to 186. Despite high-income countries providing fewer hours of informal care than low-income countries, the cost of informal care rises steeply with GDP, reflecting the higher wages in high-income countries. In many countries, particularly in sub-Saharan Africa, almost 100% of the costs of dementia are from informal care.
Under our baseline scenario which assumes a continuation of growth rates from 2000 through 2019, we estimated that the per capita cost of dementia care will more than triple by 2050. Under an accelerated direct cost scenario, the per capita cost in 2050 would be approximately 25% higher than under the baseline scenario. Scenarios that accelerate or decelerate the proportion of individuals who live in nursing homes did not have a large impact on expected cost. A decrease in the proportion of individuals who live in nursing homes is offset by an increase in the cost of informal care, leading to a small overall cost impact.
As the prevalence of dementia continues to rise, the projected increase in costs threatens to burden health care systems significantly. Our finding that informal care makes up over half of the total cost of dementia highlights the large amount of unpaid care provided by family and friends of those living with dementia throughout the world. The importance of caregivers has been stressed by WHO, as one of the action areas in their global plan is support for caregivers.4 Investing in caregiver support and training has been shown to decrease caregiver burden and improve quality of life for both caregivers and people living with dementia.24 This reliance on informal care faces a potential crisis as demographic shifts lead to an older population structure with fewer younger caregivers available. Policymakers should develop sustainable strategies to fund medical costs of dementia and support caregivers.
There are several limitations to this analysis. Most importantly, primary data on dementia costs, diagnosis rates, and caregiving are sparse, and missingness is concentrated in low-income regions. We were only able to find one study from an African country. To deal with the large amount of missingness, our modeling approach relies on data that are available for all countries to make informed predictions for countries where no primary data are available. These data include economic and demographic indicators, but they do not include cultural norms. Cultural differences are known to affect caregiver motivation, wellbeing, and burden; however, there is limited research on whether these differences translate to more or fewer hours of care provided.25–29 One channel through which cultural factors may impact the amount of care provided is through coresidency, as caregivers who live with their care recipient tend to provide more care.30 However, even in cultures with high levels of familism, socioeconomic factors play a large role in determining the likelihood of adult children residing with their parents.31 Cultural factors will also likely impact the decision to transfer a loved one who is living with dementia to a nursing home, although government policies play a large role in these outcomes.32 Within the US, studies have shown that Hispanic and Black caregivers are more likely to provide high-intensity care (defined as over 50 hours per week) but did not control for the level of impairment of the care recipient. While cultural norms certainly affect caregiving decisions, we have no evidence to indicate that they are biasing our caregiving estimates in one direction.
Another limitation was the inability to estimate attributable fractions by age group for both direct spending and caregiving. The attributable fractions would likely vary with age due to an increasing number of comorbidities with older age, and estimating the attributable fraction by age group would allow us to adjust the overall attributable fraction for each country based on its age profile. Unfortunately, no studies in our systematic review reported attributable fractions of either direct spending or caregiving by age.
An additional limitation of the caregiving meta-analysis was the variation in how caregiving was estimated. Some sources include supervision time while some only include caregiving support for activities of daily living and instrumental activities of daily living. Due to the small amount of data available, we included all sources with an attributable fraction for caregiving despite these differences. Including sources that do not measure supervision time likely biases our attributable fraction downward, as supervision time is more often needed for dementia than for other comorbidities.
Another limitation of this work is the use of mean wages to value caregiving time. Using the mean wage covers up substantial heterogeneity in the demographics of caregivers and ignores the connection between a caregiver’s wage and their decision to provide care. This metric also does not include employer contributions that provide a monetary value, such as retirement plans or health insurance. Finally, we made strong assumptions around informal care hours, specifically that individuals living in nursing homes receive zero hours of care and that undiagnosed individuals living in the community receive the same number of hours of informal care as diagnosed individuals.
Conclusion
As life expectancy continues to increase throughout the world, dementia prevalence will increase in many countries. Our estimates highlight the growing demand for resources for dementia care, which will be occurring in conjunction with additional needs associated with an aging population.
AUTHOR CONTRIBUTIONS
Amy Lastuka (Conceptualization; Data curation; Formal analysis; Investigation; Methodology; Project administration; Writing – original draft; Writing – review & editing); Elye Bliss (Formal analysis; Validation; Visualization; Writing – review & editing); Michael R. Breshock, MSE (Formal analysis; Investigation; Validation; Visualization; Writing – review & editing); Vincent C. Iannucci (Writing – review & editing; Systematic Review); William T. Sogge (Writing – review & editing; Systematic Review); Kayla V. Taylor (Project administration; Writing – review & editing); Paola Pedroza (Methodology; Writing – review & editing); Joseph L Dieleman (Conceptualization; Funding acquisition; Investigation; Methodology; Project administration; Resources; Supervision; Validation; Writing – original draft; Writing – review & editing).
ACKNOWLEDGMENTS
The authors have no acknowledgments to report.
FUNDING
This research was supported by Gates Ventures.
CONFLICT OF INTEREST
The authors have no conflict of interest to report.
DATA AVAILABILITY
The datasets generated and/or analyzed during the current study are available at https://ghdx.healthdata.org/record/ihme-data/global-health-care-spending-dementia-2000-2050.
SUPPLEMENTARY MATERIAL
[1] The supplementary material is available in the electronic version of this article: https://dx.doi.org/10.3233/JAD-240163.
REFERENCES
1. | Nichols E , Steinmetz JD , Vollset SE , et al. Estimation of the global prevalence of dementia in and forecasted prevalence in 2050: an analysis for the Global Burden of Disease Study 2019. Lancet Public Health (2022) ;7: :e105–e125. |
2. | National Dementia Plans, https://www.alzint.org/what-we-do/policy/dementia-plans/ (accessed 14 December 2023). |
3. | Colello K and Napilli A . Older Americans act: Overview and funding. Congressional Research Service. |
4. | World Health Organization. Global action plan on the public health response to dementia, 2017–2025. Geneva: World Health Organization, https://apps.who.int/iris/bitstream/handle10665/259615/9789241513487-eng.pdf;jsessionid=9D02CCDE713EB5A59867E0B66AE19E70?sequence=1 (2017, accessed 7 April 2020). |
5. | Konig H , Leicht H , Brettschneider C , et al. The costs of dementia from the societal perspective: is care provided in the community really cheaper than nursing home care? J Am Med Direct Assoc (2014) ; 15: : 117–126. |
6. | Wimo A , Seeher K , Cataldi R , et al. The worldwide costs of dementia in 2019. Alzheimers Dement (2023) ; 19: : 2865–2873. |
7. | Jia J , Wei C , Chen S , et al. The cost of Alzheimer’s disease in China and re-estimation of costs worldwide. Alzheimers Dement (2018) ; 14: : 483–491. |
8. | Pedroza P , Miller-Petrie MK , Chen C , et al. Global and regional spending on dementia care from 2000–2019 and expected future health spending scenarios from 2020–2050: An economic modelling exercise. eClinicalMedicine (2022) ; 45: : 101337. |
9. | Nandi A , Counts N , Chen S , et al. Global and regional projections of the economic burden of Alzheimer’s disease and related dementias from 2019 to 2050: A value of statistical life approach. eClinicalMedicine (2022) ; 51: : 101580. |
10. | Amjad H , Roth DL , Sheehan OC , et al. Underdiagnosis of dementia: an observational study of patterns in diagnosis and awareness in US older adults. J Gen Intern Med (2018) ; 33: : 1131–1138. |
11. | Nakanishi M and Nakashima T . Features of the Japanese national dementia strategy in comparison with international dementia policies: How should a national dementia policy interact with the public health- and social-care systems? Alzheimers Dement (2014) ; 10: : 468–476. e3. |
12. | Schumacher AE , Kyu HH , Aali A , et al. Global age-sex-specific mortality, life expectancy, and population estimates in 204 countries and territories and 811 subnational locations, 1950–2021 and the impact of the COVID-19 pandemic: a comprehensive demographic analysis for the Global Burden of Disease Study 2021. Lancet (2024) ; 403: : 1989–2056. |
13. | Micah AE , Bhangdia K , Cogswell IE , et al. Global investments in pandemic preparedness and COVID-19: development assistance and domestic spending on health between 1990 and 2026. Lancet Global Health (2023) ; 11: : e385–e413. |
14. | GBD 2019 Demographics Collaborators. Global age-sex-specific fertility, mortality, healthy life expectancy (HALE), and population estimates in 204 countries and territories, 1950–2019: a comprehensive demographic analysis for the Global Burden of Disease Study 2019. Lancet (2020) ; 396: : 1160–1203. |
15. | Kassebaum NJ , Arora M , Barber RM , et al. Global, regional, and national disability-adjusted life-years (DALYs) for 315 diseases and injuries and healthy life expectancy (HALE), 1990–2015: a systematic analysis for the Global Burden of Disease Study 2015. Lancet (2016) ; 388: : 1603–1658. |
16. | Pinho LGB , Nobre JS and Singer JM . Cook’s distance for generalized linear mixed models. Comput Stat Data Anal (2015) ; 82: : 126–136. |
17. | International Labour Organization. ILO modelled estimates database, ILOSTAT, https://ilostat.ilo.org/data/ (accessed 1 August 2023). |
18. | Luxembourg Income Study (LIS) Database, http://www.lisdatacenter.org (multiple countries; 01-1990 through 12-2019). |
19. | Haakenstad A , Irvine CMS , Knight M , et al. Measuring the availability of human resources for health and its relationship to universal health coverage for 204 countries and territories from 1990 to 2019: a systematic analysis for the Global Burden of Disease Study 2019. Lancet (2022) ; 399: : 2129–2154. |
20. | AARP and National Alliance for Caregiving. Caregiving in the United States 2020. Washington, DC: AARP. https://doi.org/10.26419/ppi.00103.001. |
21. | Viechtbauer W . Conducting meta-analyses in R with the metafor package. J Stat Softw (2010) ; 36: : 1–48. |
22. | Prados MJ , Liu Y , Jun H , et al. Projecting the long-term societal value of a disease-modifying treatment for Alzheimer’s disease in the United States. Alzheimers Dement (2022) ; 18: : 142–151. |
23. | Chen Y , Shi L , Zheng X , et al. Patterns and determinants of multimorbidity in older adults: study in health-ecological perspective. Int J Environ Res Public Health (2022) ; 19: : 16756. |
24. | Walter E and Pinquart M . How effective are dementia caregiver interventions? An updated comprehensive meta-analysis. Gerontologist (2020) ; 60: : e609–e619. |
25. | Zarzycki M , Vilchinsky N , Bei E , et al. Cross-country variations in the caregiver role: evidence from the ENTWINE-iCohort study. BMC Public Health (2024) ; 24: : 898. |
26. | Janevic MR and Connell CM . Racial, ethnic, and cultural differences in the dementia caregiving experience: recent findings. Gerontologist (2001) ; 41: : 334–347. |
27. | Anngela-Cole L and Hilton JM . The role of attitudes and culture in family caregiving for older adults. Home Health Care Serv Q (2009) ; 28: : 59–83. |
28. | Rote SM and Moon H . Racial/ethnic differences in caregiving frequency: does immigrant status matter? J Gerontol B Psychol Sci Soc Sci (2018) ; 73: : 1088–1098. |
29. | Dilworth-Anderson P , Brummett BH , Goodwin P , et al. Effect of race on cultural justifications for caregiving. J Gerontol B Psychol Sci Soc Sci (2005) ; 60: : S257–S262. |
30. | Tennstedt SL , Crawford S and McKinlay JB . Determining the pattern of community care: is coresidence more important than caregiver relationship? J Gerontol (1993) ; 48: : S74–S83. |
31. | Takagi E and Silverstein M . ‘Intergenerational coresidence of the japanese elderly: are cultural norms proactive or reactive?’: Erratum. Res Aging (2006) ; 28: : 779–779. |
32. | Payette A and Chien Y-C . Culture or context? Comparing recent trajectories of elder care development in China and Taiwan. Asian J Soc Sci (2020) ; 48: : 227–249. |


