
Mayo Normative Studies: Amyloid and Neurodegeneration Negative Normative Data for the Auditory Verbal Learning Test and Sex-Specific Sensitivity to Mild Cognitive Impairment/Dementia
Abstract
Background:
Conventional normative samples include individuals with undetected Alzheimer’s disease neuropathology, lowering test sensitivity for cognitive impairment.
Objective:
We developed Mayo Normative Studies (MNS) norms limited to individuals without elevated amyloid or neurodegeneration (A–N–) for Rey’s Auditory Verbal Learning Test (AVLT). We compared these MNS A–N– norms in female, male, and total samples to conventional MNS norms with varying levels of demographic adjustments.
Methods:
The A–N– sample included 1,059 Mayo Clinic Study of Aging cognitively unimpaired (CU) participants living in Olmsted County, MN, who are predominantly non-Hispanic White. Using a regression-based approach correcting for age, sex, and education, we derived fully-adjusted T-score formulas for AVLT variables. We validated these A–N– norms in two independent samples of CU (n = 261) and mild cognitive impairment (MCI)/dementia participants (n = 392) > 55 years of age.
Results:
Variability associated with age decreased by almost half in the A–N– norm sample relative to the conventional norm sample. Fully-adjusted MNS A–N– norms showed approximately 7– 9% higher sensitivity to MCI/dementia compared to fully-adjusted MNS conventional norms for trials 1– 5 total and sum of trials. Among women, sensitivity to MCI/dementia increased with each normative data refinement. In contrast, age-adjusted conventional MNS norms showed greatest sensitivity to MCI/dementia in men.
Conclusions:
A–N– norms show some benefits over conventional normative approaches to MCI/dementia sensitivity, especially for women. We recommend using these MNS A–N– norms alongside MNS conventional norms. Future work is needed to determine if normative samples that are not well characterized clinically show greater benefit from biomarker-refined approaches.
INTRODUCTION
Demographically-corrected normative data (i.e., norms) are the basis for determining presence or absence of impairment on cognitive tests. However, conventional norms often unintentionally include individuals with mild cognitive impairment (MCI) or mild dementia when relying on self-reported status [1, 2] or when norms pre-date current diagnostic criteria [3, 4]. Additionally, many norms are based on outdated models of cognitive aging that assume cognitive decline is an inevitable part of the aging process [5]. A large proportion of late-life cognitive decline among cognitively unimpaired (CU) older adults is driven by ongoing neuropathologic processes, including Alzheimer’s disease (AD) [6–8]. We previously provided updated fully-adjusted (age, sex, and education) regression-based Mayo Normative Studies (MNS) norms for Rey’s Auditory Verbal Learning Test (AVLT), but we did not exclude individuals with evidence of preclinical disease in these “conventional” MNS norms [9].
Neuropathological processes can now be measured in vivo, including by amyloid PET imaging and MRI markers of AD-related neurodegeneration. Amyloid positivity (A+) is associated with subtly lower cognition compared to amyloid negativity (A–) in CU older adults [10]. Further, among A+ CU participants, memory performance is lower in those with MRI-derived measures of neuro-degeneration (N+) versus A+ CU participants without neurodegeneration (N–) [11]. The incidence of A+ and N+ increases substantially with age [12], suggesting a large portion of older individuals in conventional normative samples have undetected neuropathology. Failure to account for higher levels of neuropathology lowers the sensitivity of cognitive tests to identify abnormal cognition and reduces diagnostic utility [8, 13].
Removing individuals with preclinical disease from normative samples improves the sensitivity of cognitive measures and facilitates earlier detection of cognitive impairment by decreasing performance variability and raising mean performance estimates [14, 15]. This “robust normative approach” has previously relied on longitudinal data. For example, robust approaches have required that individuals remain CU over time to reduce the likelihood of preclinical disease. However, recent availability of brain imaging and fluid biomarkers of AD neuropathological processes allows a more precise exclusion of individuals with preclinical disease that does not require longitudinal follow-up. For example, Bos and colleagues [13] included only A– individuals (based on PET or cerebrospinal fluid (CSF) data) in their normative sample and showed improved predictive accuracy of memory measures and identification of individuals at risk of dementia. These A– norms identified an additional group who were CU based on traditional normative data (that included A+ individuals) but who also progressed to a dementia syndrome faster than those who were considered CU using both A– and traditional norms. N+/– status was not included though evidence suggests that neurodegeneration as measured by structural MRI is more closely coupled with cognitive change than amyloid status [16, 17]. Others have created normative data by requiring negative biomarker status across multiple biomarkers including amyloid, neurodegeneration, tau (T), and/or cerebrovascular disease. These studies have consistently shown attenuated impacts of age on neuropsychological test performance and generally higher cognitive performances relative to biomarker positive samples [18–20].
Sex differences in verbal memory, including a specific verbal memory benefit for women, have been well established [9, 21, 22]. Despite an equivalent prevalence of a biological diagnosis of AD in men and women, the prevalence of a clinical diagnosis of MCI is greater in men [23, 24], demonstrating a need to understand factors that may contribute to under diagnosis of MCI in women [25]. The normative data applied when making a diagnosis may be one such factor. Using traditional normative data unadjusted for sex results in under diagnosis of MCI in women and over diagnosis in men [22]. To our knowledge, no studies have examined whether biomarker-refined normative data have a sex-specific impact.
The aim of this study was to develop biomarker-refined normative data for Rey’s Auditory Verbal Learning Test (AVLT) using individuals without amyloid PET positivity or elevated neurodegeneration per temporal cortical thickness on MRI (MNS A–N– norms, referred to as A–N– norms for simplicity). Due to sample size considerations and availability of other biomarkers, these norms do not exclude individuals with numerous other pathologies that can also contribute to variance in cognition including tau, alpha-synuclein, Lewy bodies, cerebrovascular disease, or TDP-43 [26]. Sensitivity of these A–N– norms were then compared to conventional norms in a validation sample of individuals with MCI/dementia. We hypothesized that (1) age, sex, and education would explain significant variance in AVLT performance in this biomarker-refined normative sample, but that the variance explained by age would be reduced relative to conventional norms, and (2) fully-adjusted A–N– norms would be more sensitive to MCI/dementia relative to fully-adjusted MNS conventional norms. We also examined the frequency (i.e., base rates) of low test performance based on A–N– norms in a separate CU validation sample. We describe results for all participants combined as well as sex-stratified.
METHODS
Participants
Participants were from the Mayo Clinic Study of Aging (MCSA), which is a population-based study of aging in Olmsted County, Minnesota, that includes individuals aged 30 and older. MCSA participants are randomly sampled by age- and sex-stratified groups using the resources of the Rochester Epidemiology Project medical records-linkage system, which has linked the medical records from all county providers since 1966. This permits the enumeration of the Olmsted County population (102% of the US Census); 97% of whom consent to use their medical records for research [27, 28]. Exclusion criteria for the MCSA are a terminal illness or hospice. Over 60% of residents contacted enroll in the MCSA and follow-up retention is 80%. The study protocols were approved by the Mayo Clinic and Olmsted Medical Center Institutional Review Boards. All participants provided written informed consent.
Participants have clinical evaluations every 15 months. A subset of participants also undergo MRI, and amyloid and tau PET scans. Study visits include a neurologic evaluation by a physician, an interview by a study coordinator, and neuropsychological testing by a psychometrist supervised by a neuropsychologist [29]. The physician examination includes medical history review, complete neurological examination, and the Short Test of Mental Status [30]. The study coordinator interview includes demographic information and medical history, and questions about memory to both the participant and an informant using the Clinical Dementia Rating scale [31]. The interviewing study coordinator, examining physician, and neuropsychologist all make an independent diagnostic determination of CU, MCI, or dementia. Only the neuropsychologist has access to the neuropsychological data for this diagnostic determination. Following this independent assessment, a final diagnosis is achieved through consensus agreement [24, 29]. To minimize circularity in the current analyses (e.g., AVLT performance is considered by the neuropsychologist in assigning a diagnosis), diagnoses are based on the independent diagnosis of the physician and study coordinator assigned before the consensus meeting and they do not have access to AVLT performance for this initial diagnosis. Specifically, individuals with a CU diagnosis in this study were judged to be CU by both the physician and study coordinator. Individuals with a diagnosis of MCI/dementia for this study had a diagnosis of MCI and/or dementia by both the physician and study coordinator.
Inclusion and neuroimaging criteria for the A–N– normative sample
The initial sample prior to application of A–N– norms criteria was the sample presented in our previous AVLT norms manuscript comprised of CU individuals aged 30+ who completed the AVLT at the baseline visit (see Stricker et al. [9] for details). Because of the MCSA’s continual enrollment process to meet long-term accrual and retention goals, baseline visits occurred any time between study onset in 2004 through the time of our data freeze for derivation of normative data (March 12, 2018). Over a third (N = 1,594, 36%) of participants had MRI (3T GE system) and amyloid PET (Pittsburgh Compound B) scan data available. Participants were identified as A–N– if (1) whole brain amyloid PET SUVR was ≤1.42 (A–; centiloid 19 [32], and (2) cortical thickness in a temporal meta region of interest (ROI; previously referred to as an AD-signature composite ROI) was >2.67 mm (N–) [33, 34]. Because a subset of A–N– individuals may transition to A+ N–, A– N+ or A+N+ over time [35], we used participants’ last available neuroimaging scan as of March 12, 2018 to determine AN status. This approach, similar to elements of the robust normative approach, further reduced the likelihood of including individuals with preclinical disease. Recent biomarker classification systems also include tau [36, 37]. However, available sample sizes for tau PET were too small for the purpose of normative data development, thus a two-biomarker framework (AN) was used.
We required verified A–N– status for participants ages 50+ for inclusion in the A–N– normative sample. Due to low rates of MCI/dementia and biomarker positivity in younger age groups, we did not require neuroimaging for individuals aged < 50 for the normative sample. However, if MRI and amyloid PET were available then A–N– status was required.
Inclusion criteria for the independent validation samples
We also derived two independent validation samples— CU and MCI/dementia— from the MCSA to validate and compare the conventional and A–N– normative scores. For these validation samples, individuals aged 55+ who completed the AVLT at a baseline study visit were included. Fifty-five years was used as a cutoff to allow comparison to MOANS norms [3]. First, the CU validation sample was comprised of individuals who were newly enrolled in the MCSA after March 12, 2018 (n = 261; [9]). Concordant CU classification by both the physician and study coordinator was required for inclusion. For the second validation sample, all individuals classified as MCI or dementia (MCI/dementia) at baseline by study coordinator and physician were included (n = 392); these individuals were not in the normative sample (did not meet the inclusion criteria). MCI/dementia were grouped to allow discordant diagnosis across the physician and study coordinator (MCI/MCI, n = 335; MCI/dementia, n = 23; dementia/dementia, n = 34). Across all 392 MCI/dementia participants, n = 16 were aged 56–64, n = 139 were 65–79, and n = 237 were 80+.
Auditory verbal learning test
The AVLT is a widely used public domain word list memory test [38]. The procedures for test administration are the same as those used in the original MOANS studies [3, 39]. We recently provided updated conventional norms for numerous primary and secondary AVLT variables [9]. Those norms adjusted for 1) age, 2) age and sex, 3) age, sex, and education (fully-adjusted). All adjustments for age included linear and quadratic age terms. The current study focuses on four variables: sum of trials (trials 1–5 total + trial 6+ 30-min recall), trials 1–5 total, 30-min delayed recall, and recognition percent correct.
Normative methods
We applied the same regression-based normative approach from our recently published conventional AVLT norms to the A–N– norms, which allows for a direct comparison [9]. Each test score distribution was normalized [40, 41]. Percentile ranks for each raw test score were calculated. Percentile ranks were then converted to scaled scores (mean = 10, SD = 3) based on the cumulative frequency distributions of raw scores. This step was previously completed in the larger conventional AVLT cohort [9], and we use the same scaled score conversions here. Next, linear regression models were generated using the A–N– normative sample to predict scaled scores from age, age squared, sex, and education. Consistent with our prior approach, we verified that interactions and higher-order terms explained <1% variance of the model per a priori criteria (age×sex, age×education, sex×education, education squared, age cubed; none explained more than 0.41% incremental variance). Residuals for linear regression equations were converted to T-scores with a mean of 50 and a standard deviation of 10. Q-Q plots were visually reviewed to assess normality of residuals. We examined whether variance of residuals was equal in magnitude across the range of predictors (i.e., not requiring smoothing; for example, ensuring that, on average, residuals for the full sample had approximately equal variances across age [41]). We examined mean and SD values by age (30–49, 50–69, 70+), sex, and education (8–12, 13–15, 16, 17–20). Means were within 3 T-score points from the expected value of 50 (47 to 53) [40], and SDs were largely between 9.4 to 10.6 T-score points across age, sex, and education bins, consistent with our a priori criteria [9]. However, some education bins for AVLT delay had results just beyond this SD range, falling within a range of 9.3 to 10.7. We examined the relationship between education and education squared with T-scores and residuals and found that the variance was not systematically related to education (all ps > 0.05). We therefore did not apply smoothing.
All information needed to derive the fully-corrected A–N– AVLT norms are provided in Tables 1–3. An Excel file that automates T-score calculations is available by request through the Mayo Clinic Study of Aging website at the following link:https://www.mayo.edu/research/centers-programs/alzheimers-disease-research-center/research-activities/mayo-clinic-study-aging/for-researchers/data-sharing-resources.
Table 1
Table for converting raw scores to unadjusted scaled scores for AVLT variablesa
| SS | Trials 1–5 | 30-Min | Sum of | Recognition |
| total | recall | trials | PC | |
| 0 | 0–14 | – | 0–17 | 0–23 |
| 1 | 15–17 | – | 18–21 | 27–47 |
| 2 | 18–20 | – | 22–24 | 50–57 |
| 3 | 21–23 | 0 | 25–27 | 60–63 |
| 4 | 24–25 | 1 | 28–31 | 67 |
| 5 | 26–27 | 2 | 32–35 | 70–73 |
| 6 | 28–30 | 3 | 36–39 | 77 |
| 7 | 31–33 | 4 | 40–44 | 80 |
| 8 | 34–36 | 5–6 | 45–49 | 83–87 |
| 9 | 37–40 | 7 | 50–55 | 90 |
| 10 | 41–43 | 8 | 56–61 | – |
| 11 | 44–47 | 9 | 62–66 | 93 |
| 12 | 48–50 | 10–11 | 67–72 | 97 |
| 13 | 51–54 | 12 | 73–78 | – |
| 14 | 55–57 | 13 | 79–83 | – |
| 15 | 58–61 | 14 | 84–88 | 100 |
| 16 | 62–63 | – | 89–92 | – |
| 17 | 64–65 | 15 | 93–95 | – |
| 18 | 66–67 | – | 96–96 | – |
| 19 | 68 | – | 97–97 | – |
| 20 | 69–75 | – | 98–105 | – |
aScaled scores are provided only as a step in determining the demographically-corrected T-scores using the equations in Table 2. These scaled scores are not adjusted for any demographic variables and should not be used for clinical practice. Use of the fully-adjusted T-scores is recommended. Trials 1–5 Total = trial 1 recall + trial 2 recall+trial 3 recall + trial 4 recall+trial 5 recall; 30-Min Recall = 30-Minute Delayed Recall; PC = Percentage Correct; Recognition PC = {/30}×100; Sum of Trials = Trials 1–5 total + trial 6 + 30-min recall. From: Stricker et al. Mayo Normative Studies: Regression-Based Normative Data for the Auditory Verbal Learning Test for Ages 30–91 Years and the Importance of Adjusting for Sex, Journal of the International Neuropsychological Society (2021), 27, 211–226; used with permission of Mayo Foundation for Medical Education and Research, all rights reserved.
Table 2
MNS A–N– age, sex, and education-adjusted T-score formulas for Rey’s Auditory Verbal Learning Test variables
| Variable | Fully-adjusted T-score formula |
| Trials 1–5 totala | rounde(50+((((AVLTSum5SS – (8.9311725830+(Age* 0.0622181486)+(Age**2 *– 0.0012265242)+(Male*– 1.8271754487)+(EDUC*0.2773785909)))/1)+0.000000047190442)/0.23299996)) |
| 30-Minute delayb | rounde(50+((((AVDSS – (10.3727115779+(Age* 0.0411740931)+(Age**2 *– 0.0010165728)+(Male*– 1.8136012723)+(EDUC*0.1923049724)))/1)+0.000000126657990)/0.25259153)) |
| Sum of trialsc | rounde(50+((((AVLTsum5p6DSS– (9.5195729873+(Age* 0.0537613178)+(Age**2 *– 0.0011585957)+(Male*– 1.9095549651)+(EDUC*0.2535111119)))/1)+0.000000113818520)/0.23552497)) |
| Recogn. percent. correctd | rounde(50+((((AVRecPCSS – (9.5398105103+(Age* 0.0348447079)+(Age**2 *– 0.0006757800)+(Male*– 1.7207397252)+(EDUC*0.1603971102)))/1)– 0.000000059869380)/0.28348941)) |
aAVLT Trials 1–5 Total = total of all correct items recalled on trials 1–5. bAVLT 30-minute delay = total items correctly recalled at the 30-minute delay. cAVLT Sum of Trials = trials 1–5 total + trial 6 + 30-min recall. dAVLT Recognition Percentage Correct=([Recognition hits+{15– recognition false positive errors}]/30)* 100. Age**2, age squared; AVDSS, AVLT 30-minute delayed recall unadjusted scaled score; AVLTSum5SS, AVLT Trials 1–5 Total unadjusted scaled score; AVLTsum5p6DSS, AVLT sum of trials unadjusted scaled score; AVRecPCSS, AVLT Recognition Percentage Correct unadjusted scaled score; EDUC, education (as defined in Table 3); Male, indicates male is coded as 1, female is coded as 0; Rounde, signifies the specific round function used in Statistical Analysis Software (SAS) Version 9.4. SS, unadjusted scaled score (see raw score to scaled score conversions in Table 1). Tables used with permission of Mayo Foundation of Medical Education and Research, all rights reserved.
Table 3
Education level determination rules
| Education completed | Years of Education Assigned |
| Below high school diploma/GED: each full year completed in formal education is counted | 0–11 |
| High school diploma/GED | 12 |
| 1 or more years of vocational/trade school | 13 |
| 1 or more full-time years of Associate’s program without degree | 13 |
| Associate degree | 14 |
| 1 full-time year of Bachelor’s program without degree | 13 |
| 2 full-time years of Bachelor’s program without degree | 14 |
| 3 or more full-time years of Bachelor’s program without degree | 15 |
| Bachelor’s degree | 16 |
| 1 or more full-time years of Master’s program without degree | 17 |
| Master’s degree | 18 |
| 1 or more full-time years of Doctoral program without degree | 19 |
| Attorneys and priests | 19 |
| Doctoral degree | 20 |
| Continuing education/certifications: no additional years are counted |
12 years of education includes individuals with a GED as well as individuals who graduated from high school with a high school diploma. These data were coded the same and thus could not be differentiated. Caution is suggested when interpreting performance in individuals with 8–11 years of education, as this group was less represented in the normative sample. Application of the fully demographically corrected normative formulas for individuals with age or education levels outside of the observed ranges is not recommended. From: Karstens et al. Mayo Normative Studies: Regression-Based Normative Data for Ages 30–91 Years with a Focus on the Boston Naming Test, Trail Making Test and Category Fluency. Journal of the International Neuropsychological Society, 2023; used with permission of Mayo Foundation for Medical Education and Research, all rights reserved.
Additional statistical methods
Pearson correlation coefficients measured the association between AVLT performance and demographic variables. These values were squared to examine the percent variance explained by each individual demographic variable. We applied the normative formulas derived from both the conventional normative sample [9] and the A–N– normative sample (Table 2) to the independent validation samples (CU and MCI/dementia) for each individual’s raw test score. We calculated the observed proportions of participants performing below a cut-off of T < 40. We also provide 95% confidence intervals around those observed proportions.
In main analyses, we compared the sensitivity of fully-adjusted A–N– norms to that of conventional norms within our MCI/dementia validation sample for all participants and separately for men and women. Sensitivity was defined as frequency of low test performance in the MCI/dementia sample. The sensitivity of norms was compared via two statistical approaches. First, paired comparisons (e.g., comparing use of different norms on the same individuals) were completed using a 2×2 table approach to statistically compare agreement across two norms using McNamar p-values (performed using the /agree option in PROC FREQ in SAS). This was used to test our primary comparison of interest, which was to compare the fully-adjusted conventional norms to the fully-adjusted A–N– norms. To comprehensively examine our data, we also report results of secondary analyses comparing conventional norms with age-adjusted or age and sex-adjusted norms to illustrate how each additional normative refinement impacts results. Second, the sensitivity of the same norm applied to men versus women (two independent samples, secondary analyses) was compared with chi-square analyses of the proportion with low test performance in the MCI/dementia sample. An alpha level of 0.05 was used. We also examined rates of low test performance in the CU validation sample (i.e., base rates). CIs that did not contain the 14.7% expected base rate (based on a normal distribution) were considered significantly different than expected. The Supplementary Material also includes analyses for AVLT delayed recall using Mayo’s Older Americans Normative Studies (MOANS), which did not exclude individuals with MCI as part of the normative inclusion criteria [3].
RESULTS
Sample characteristics
Application of robust neuroimaging inclusion criteria resulted in a MNS A–N– AVLT normative sample of N = 1,059 (n = 640, aged 50+). Thirty-six percent of individuals in the conventional normative sample had available AN data (N = 1,594 out of 4,428). Almost all individuals aged 30–49 were included in the A–N– norms (419/424), except 5 who were biomarker positive (4.5% of those with AN data). The percentage of biomarker-positive individuals increased significantly across age bands (see Table 4). Few individuals 70–79 (22%) or 80+ (7%) met the robust inclusion criteria (i.e., A–N– with most recent imaging data).
Table 4
Participant characteristics for individuals with amyloid PET and MRI (neurodegeneration) data available (N= 1,594)a, including years from baseline AVLT visit to the last available neuroimaging scan date and subsample characteristics by AN status (green shading). Red shading characterizes those who were excluded from the A–N– norms due to positive biomarker status
| Baseline visit to last AN scan used | Biomarker negative A–N– | Biomarker positive | A+N+ | A+N– | A– N+ | |
| Age, y | Years, median (IQR) | N (%) | N (%) | N (%) | N (%) | N (%) |
| All, 30–90, n = 1,594 | 1.36 [0.28, 2.78] | 747 (46.9%)a | 847 (53.1%) | 339 (21.3%) | 195 (12.2%) | 313 (19.6%) |
| 30–39, n = 57 | 0.28 [0.24, 0.31] | 56 (98.2%) | 1 (1.8%) | 0 (0%) | 0 (0%) | 1 (1.8%) |
| 40–49, n = 55 | 0.29 [0.24, 0.33] | 51 (92.7%) | 4 (7.3%) | 0 (0%) | 0 (0%) | 4 (7.3%) |
| 50–59, n = 280 | 1.35 [0.27, 2.75] | 238 (85.0%) | 42 (15.0%) | 0 (0%) | 13 (4.6%) | 29 (10.4%) |
| 60–69, n = 459 | 1.47 [0.30, 2.67] | 262 (57.1%) | 197 (42.9%) | 47 (10.2%) | 75 (16.3%) | 75 (16.3%) |
| 70–79, n = 583 | 3.06 [1.33, 5.40] | 129 (22.1%) | 456 (77.9%) | 216 (36.9%) | 95 (16.2%) | 145 (24.8%) |
| 80–90, n = 158 | 3.03 [1.76, 5.60] | 11 (7.0%) | 147 (93.0%) | 76 (48.1%) | 12 (7.6%) | 59 (37.3%) |
| Mean age (SD) | 59.7 (11.1) | 72.6 (7.6) | 75.3 (5.3) | 69.7 (6.8) | 71.4 (9.1) |
aNote that this N differs from the total N of the MNS A–N– sample because individuals < 50 were not required to have AN data (no AN data was available for 157 participants ages 30–39 and 155 participants ages 40–49), but if participants did have AN data available then they had to be A–N– to be included. A, amyloid status based on amyloid PET scan; N, neurodegeneration status based on MRI. Table used with permission of Mayo Foundation for Medical Education and Research, all rights reserved.
Demographic characteristics are presented in Table 5 and Supplementary Table 1. Given our aim to compare performance of A–N– and conventional norms, we provide demographic characteristics of the conventional normative sample for ease of reference [9]. We did not directly compare the A–N– and conventional norms groups because the A–N– normative sample is a subset of the conventional normative sample. However, we compared the A–N– norms cohort to a subset of the conventional norms cohort that excluded those in the A–N– norms cohort to allow comparison. As expected, the A–N– cohort is younger, more highly educated, and has higher raw AVLT scores than the non-overlapping participants in the conventional norms (see Table 5). Table 6 shows that the sample size of our refined A–N– normative cohort is similar to other normative samples [3, 9, 42, 43].
Table 5
Demographic characteristics and AVLT performance for Mayo Normative Studies (MNS) A–N– and Conventional Normative Samples, as well as individuals excluded from the A–N– Normative Sample; mean (SD) or count (percent)
| Characteristic | A–N– Norms participants N (%) (Total N = 1,059) | Not A–N– Norms participants N (%) (Total N = 3,369) | Conventional norms participants N (%) (Total N = 4,428) | p | |
| Age, y, mean (SD) | 54.0 (13.2) | 72.8 (9.3) | 68.3 (13.1) | <0.001a | |
| 30–39, n (%) | 213 (20.1) | 1 (0.0) | 214 (4.8) | ||
| 40–49, n (%) | 206 (19.5) | 4 (0.1) | 210 (4.7) | ||
| 50–59, n (%) | 238 (22.5) | 372 (11.0) | 610 (13.8) | ||
| 60–69, n (%) | 262 (24.7) | 654 (19.4) | 916 (20.7) | ||
| 70–79, n (%) | 129 (12.2) | 1526 (45.3) | 1655 (37.4) | ||
| 80+, n (%) | 11 (1.0) | 812 (24.1) | 823 (18.6) | ||
| Sex (male), n (%) | 548 (51.7) | 1,663 (49.4) | 2,211 (49.9) | 0.176b | |
| Education, y, mean (SD) | 15.4 (2.3) | 14.5 (2.6) | 14.7 (2.6) | <0.001a | |
| 8–12, n (%) | 149 (14.1)c | 1108 (32.9) | 1257 (28.4) | ||
| 13–15, n (%) | 311 (29.4) | 952 (28.3) | 1263 (28.5) | ||
| 16, n (%) | 308 (29.1) | 614 (18.2) | 922 (20.8) | ||
| 17–20, n (%) | 291 (27.5) | 695 (20.6) | 986 (22.3) | ||
| Race, n (%) | |||||
| White | 1,015 (95.8) | 3,318 (98.5) | 4,333 (97.9) | <0.001b | |
| Black/African American | 14 (1.3) | 8 (0.2) | 22 (0.5) | ||
| Asian | 17 (1.6) | 12 (0.4) | 29 (0.7) | ||
| Native Hawaiian/Other Pacific Islander | 0 (0) | 0 (0) | 0 (0) | ||
| American Indian/Alaska native | 2 (0.2) | 2 (0.1) | 4 (0.1) | ||
| Multiracial | 6 (0.6) | 19 (0.6) | 25 (0.6) | ||
| Unknown | 5 (0.5) | 10 (0.3) | 15 (0.3) | ||
| Ethnicity other than Hispanic/Latino | 1,046 (98.8) | 3,345 (99.3) | 4,391 (99.2) | 0.267b | |
| Neuropsychologists’ Diagnosisd | <0.001b | ||||
| CU | 954 (90.1) | 2,996 (88.9) | 3,950 (89.2) | ||
| MCI | 67 (6.3) | 340 (10.1) | 407 (9.2) | ||
| Dementia | 1 (0.1) | 4 (0.1) | 5 (0.1) | ||
| Other | 37 (3.5) | 29 (0.9) | 66 (1.5) | ||
| AVLT, mean (SD) | |||||
| Trials 1–5 total | 48.3 (9.2) | 40.4 (9.4) | 42.3 (10.0) | <0.001a | |
| 30-Min recall (long delay) | 9.7 (3.4) | 7.4 (3.4) | 8.0 (3.5) | <0.001a | |
| Sum of trialse | 68.1 (14.8) | 55.7 (15.0) | 58.7 (15.9) | <0.001a | |
| Recognition percentage | 92.0 (8.5) | 88.8 (9.7) | 89.6 (9.6) | <0.001a | |
| correctf |
aKruskal Wallis. bChi-Square. cMost A–N– individuals in this education group had 12 years of education (n = 141), with limited representation of individuals with 8 (n = 2), 9 (n = 1), 10 (n = 1) and 11 (n = 4) years of education. Caution is needed when applying these norms to individuals with <12 years of education. Note that individuals completing a GED are considered to have 12 years of education for the purposes of the Mayo Clinic Study of Aging and this normative data. dAll participants were considered cognitively unimpaired as defined in the method. The diagnosis listed here represents the neuropsychologist’s independent diagnosis based only on review of neuropsychological test scores in isolation. Whenever possible, a CU, MCI or dementia diagnosis is assigned. When a judgement is uncertain due to missing data or other factors complicating a neuropsychological data only diagnosis, a diagnosis of Other is assigned. eTrials 1–5 total + trial 6 + 30-min recall. f([Recognition hits+{15– recognition false positive errors}]/30)×100. The p-value compares the participants in the A–N– norms to those excluded from the A–N– norms (Not A–N– Norms Participants). AVLT, Auditory Verbal Learning Test. Also see Supplementary Table 1 for additional descriptive information in the form mean (SD) by collapsed age bins. Table used with permission of Mayo Foundation for Medical Education and Research, all rights reserved.
Table 6
MNS sample characteristics for conventional and A–N– norms relative to other conventional normative samples
| Total N | Age range | Ages | Ages | Ages | |
| total sample | 30–49 | 50–69 | 70+ | ||
| MNS conventional | 4,428 | 30–91 | 424 | 1,526 | 2,459 |
| MNS A–N– | 1,059 | 30–90 | 419 | 500 | 140 |
| CVLT-3 | 700 | 16–90 | 150 | 250 | 200 |
| AVLT meta-norms | 2,699 | 16–89 | 1,603 | 327 | 193 |
| MOANS | 530 | 56–97 | 0 | 196 | 334 |
AVLT, Rey’s Auditory Verbal Learning Test; AVLT meta-norms, Schmidt et al. [42]; CVLT-3, California Verbal Learning Test, Third Edition; MOANS, Mayo Older Adult Normative Studies; MNS, Mayo Normative Studies. Table used with permission of Mayo Foundation for Medical Education and Research, all rights reserved.
Demographic associations with AVLT performance
Within the refined A–N– cohort, all four AVLT variables were significantly correlated with age, education, and sex (Fig. 1 and Supplementary Table 2). Age and age-squared individually explained the most variance across the three recall measures (11–14%), followed by sex (9–10%) and education (3–7%). Sex accounted for the most variance in recognition (6%), followed by age (3%) and education (2%).
Fig. 1
Percentage Variance Explained (Pearson Correlation Coefficient, Squared) for Each Demographic Variable for the A–N– and Conventional Normative Samples. Box within each panel shows the combined R2 for the full model that includes age, age squared, sex, and education. Pearson Correlation Coefficients, Squared is equivalent to R2. All p values for Pearson correlation coefficients (before squaring) are p < 0.001. Figure used with permission of Mayo Foundation for Medical Education and Research, all rights reserved.
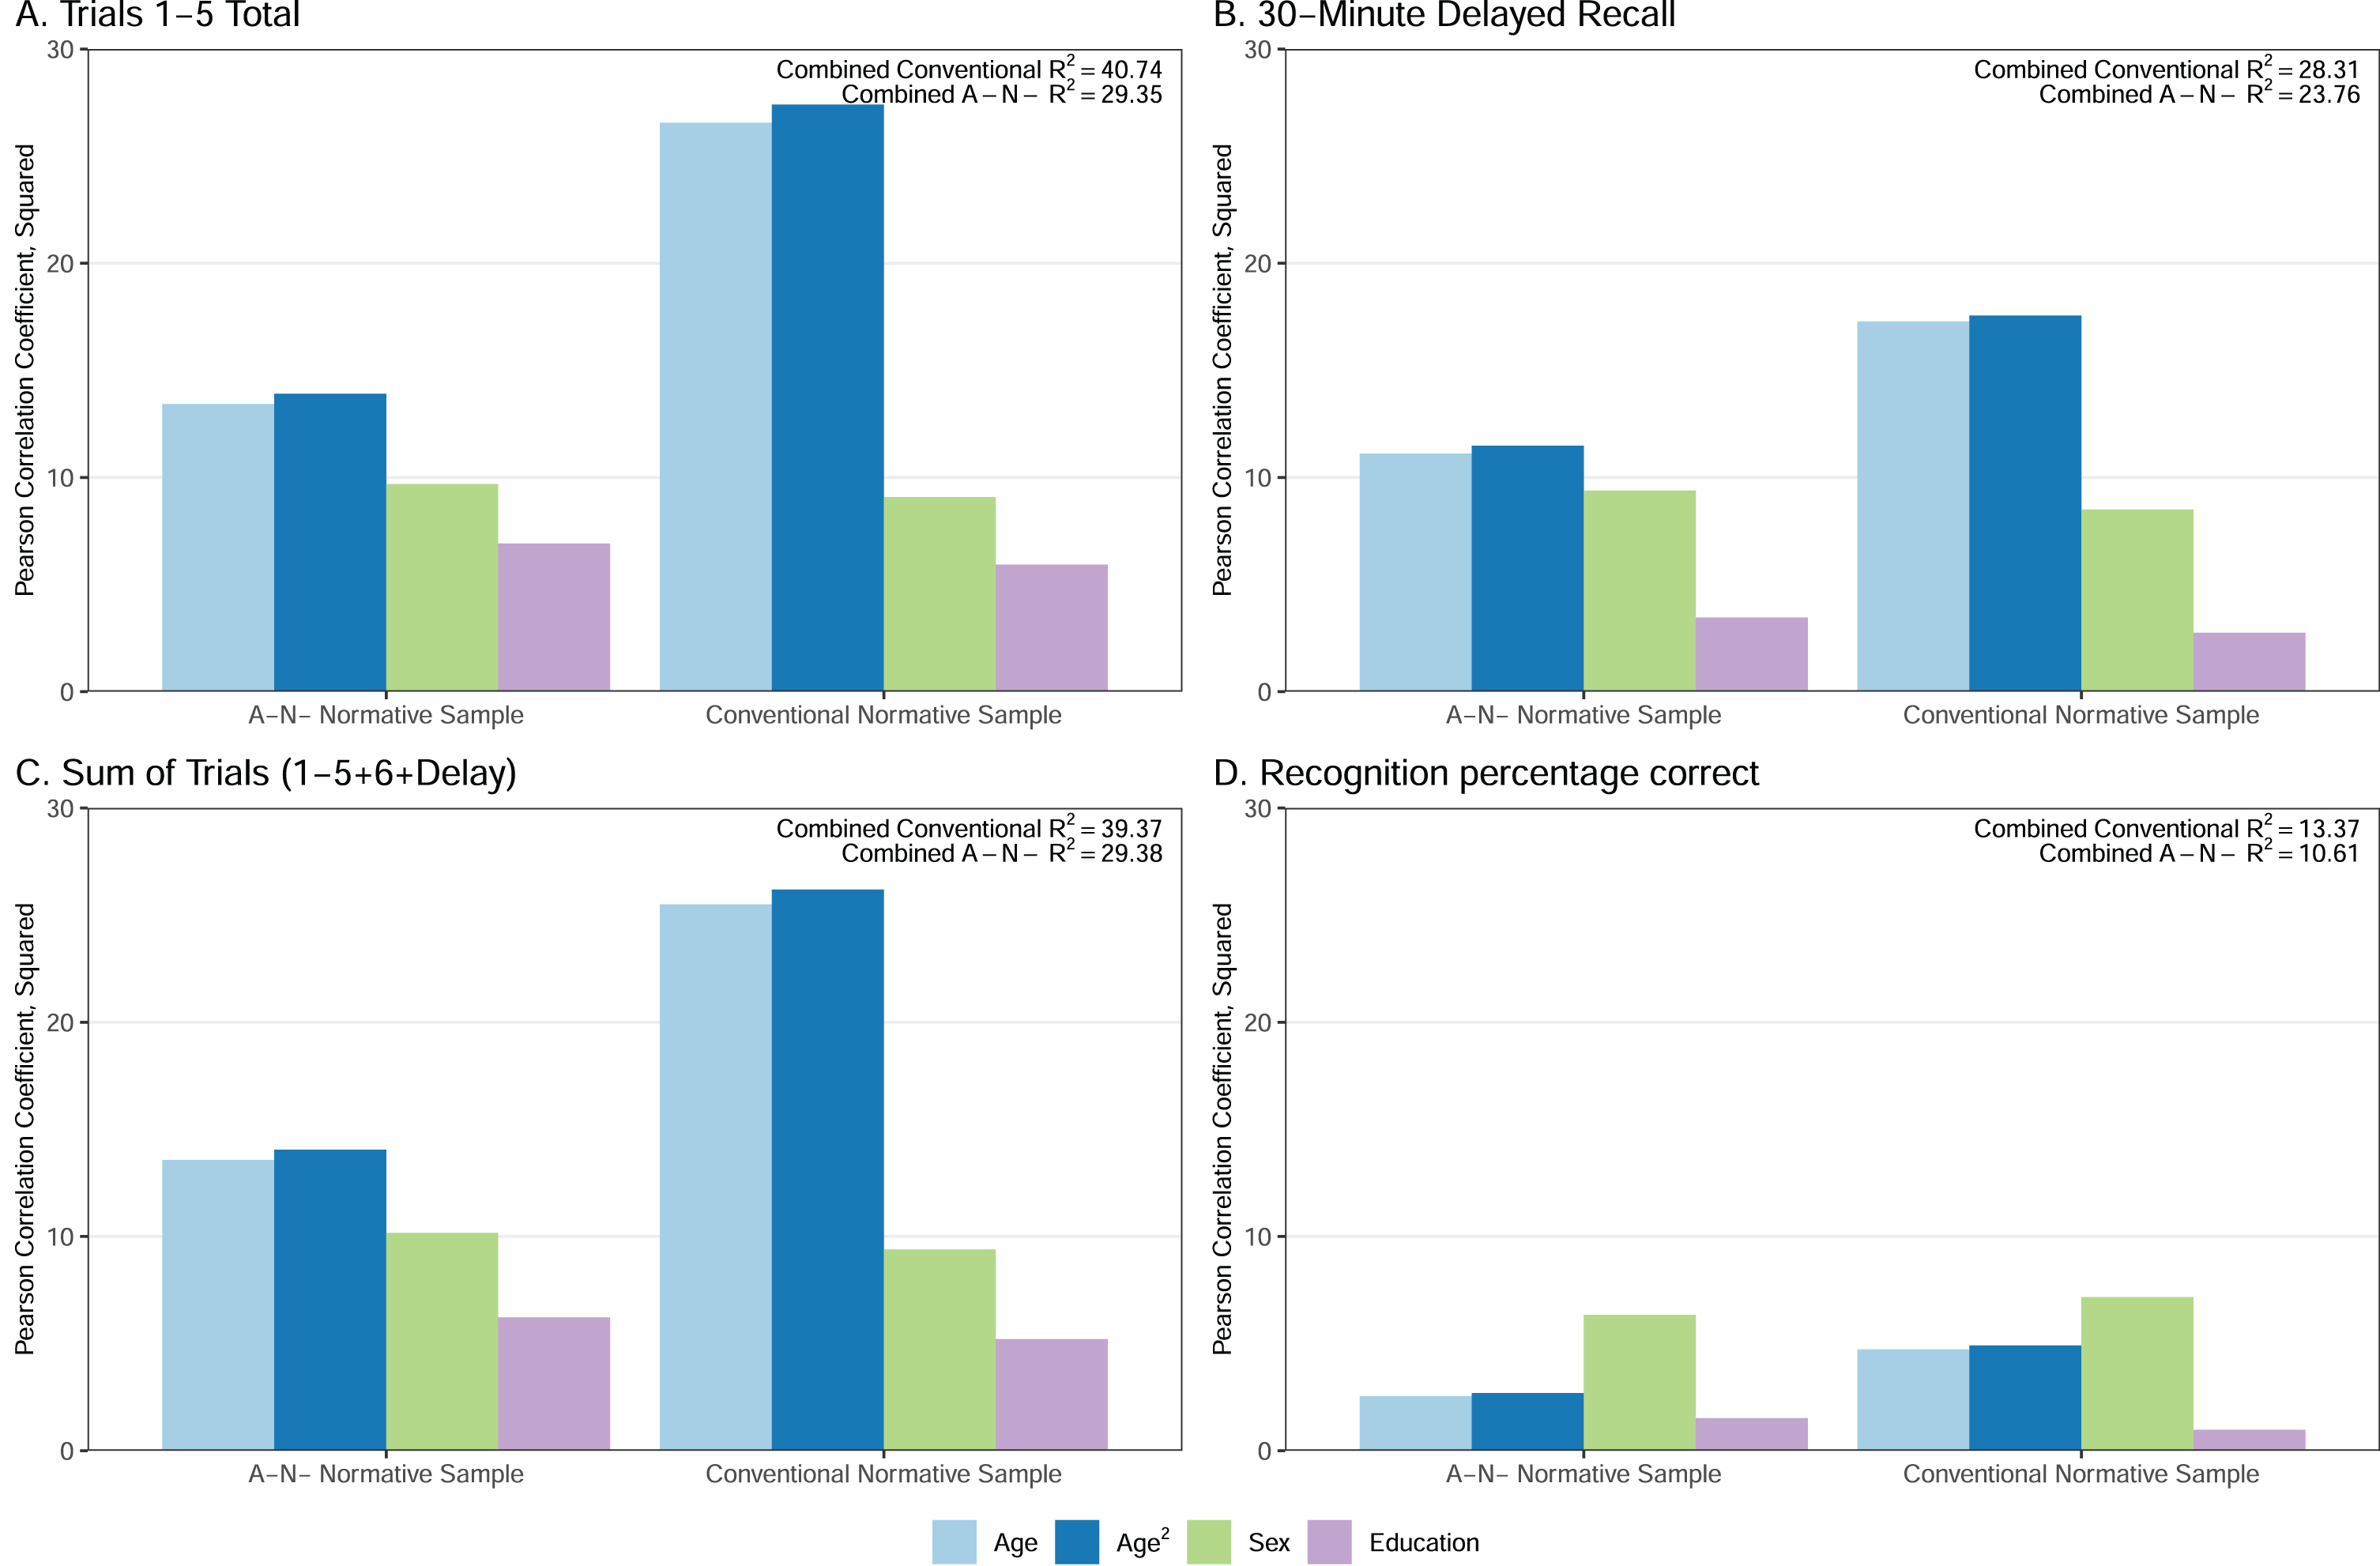
The amount of variance in AVLT performance explained by age and age-squared (i.e., Pearson’s correlation coefficient squared) showed a qualitatively smaller magnitude in the A–N– normative sample compared to the conventional normative sample (Fig. 1). Age accounted for approximately 1.5 to 2 times more variance in AVLT performance across all four AVLT variables in the conventional CU cohort relative to the A–N– normative cohort. In other words, there is less variability in cognition in younger people than older people; despite similar min and max ages in each sample, the A–N– sample is more heavily weighted toward younger ages since younger individuals are more likely to have A–N– status. The percentage of variance explained by sex and education was similar across normative cohorts.
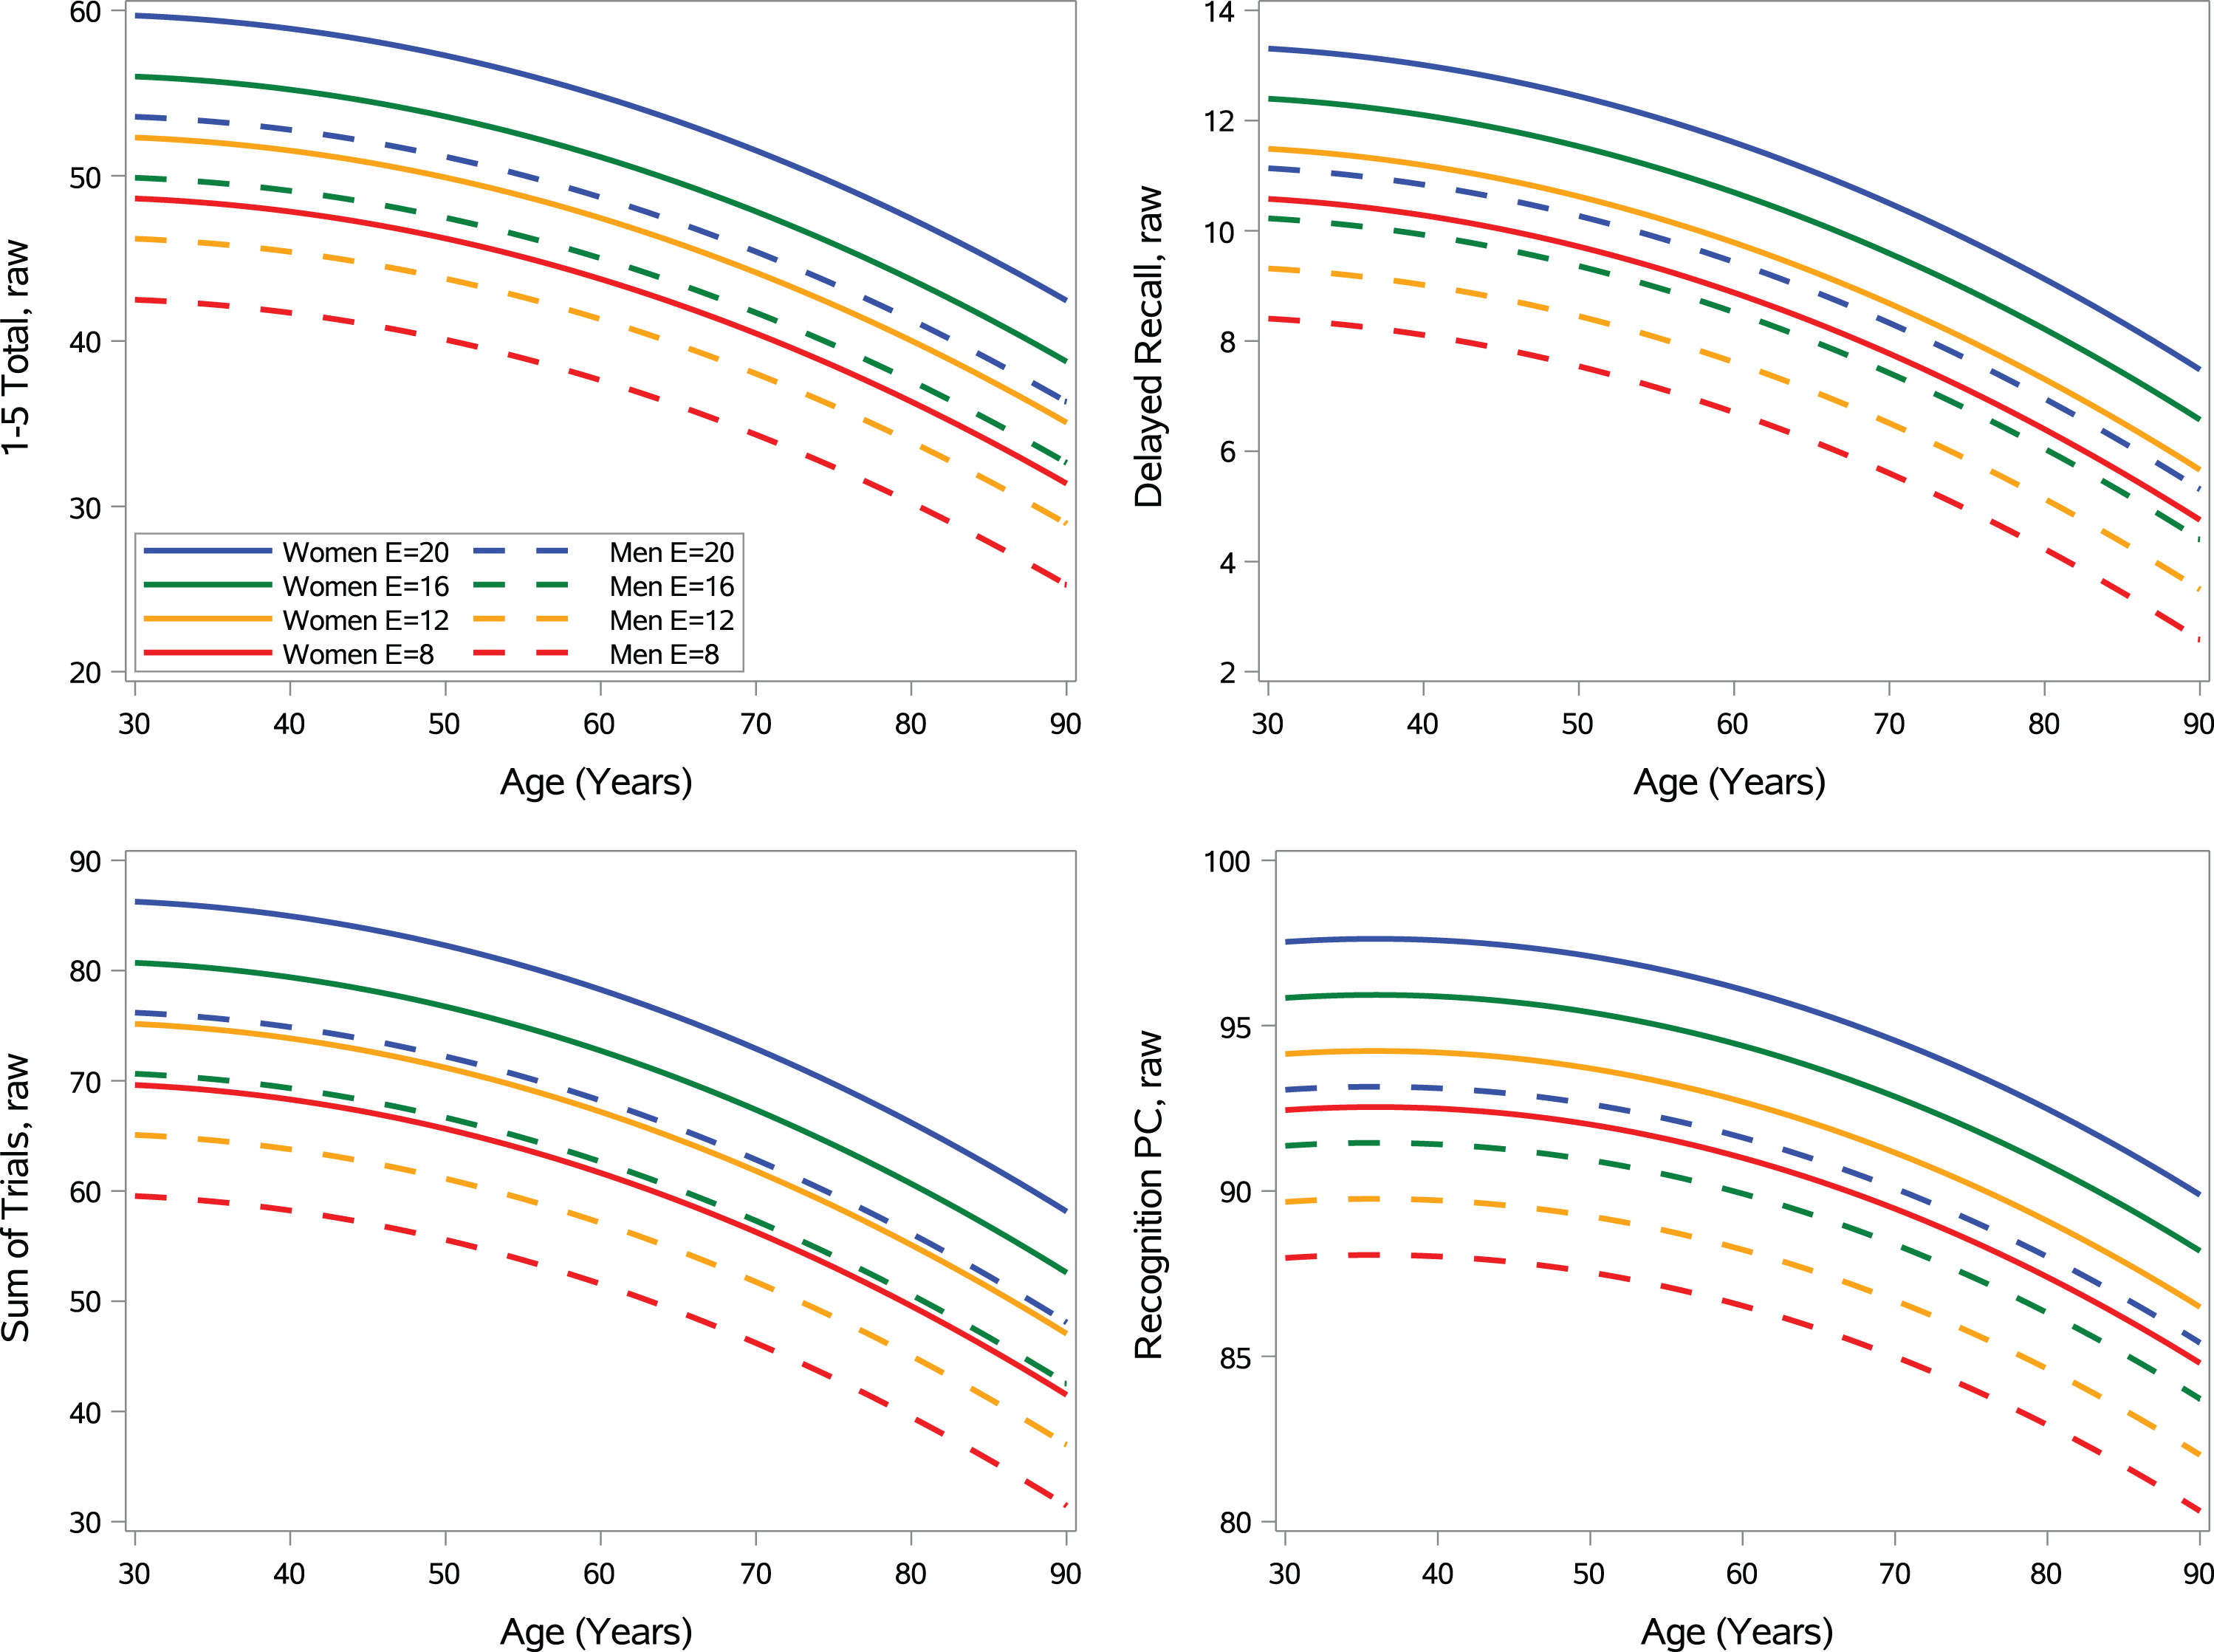
Figure 2 shows the model predicted performances across age, sex, and education. Supplementary Figure 2 series displays model generated data that illustrates that MNS A–N– fully-adjusted norms routinely offer a more stringent raw score cut-off when using the raw score equivalent of a < 40 T threshold at specified levels of age, sex, and education relative to MNS fully-adjusted conventional norms, as expected. There are only a few occurrences where an opposite (unexpected) pattern is displayed where conventional norms show a more stringent raw score cut-off than A–N– norms, and this is typically for individuals under 60 with low levels of education.
Fig. 2
Regression models showing the effect of age, age squared, sex (women = solid lines; men = dashed lines) and education for the A–N– normative cohort. Model predicted values displayed for all ages and both sex groups for set levels of education (8, 12, 16, and 20). Figure used with permission of Mayo Foundation for Medical Education and Research, all rights reserved.
MCI/dementia validation sample, all participants
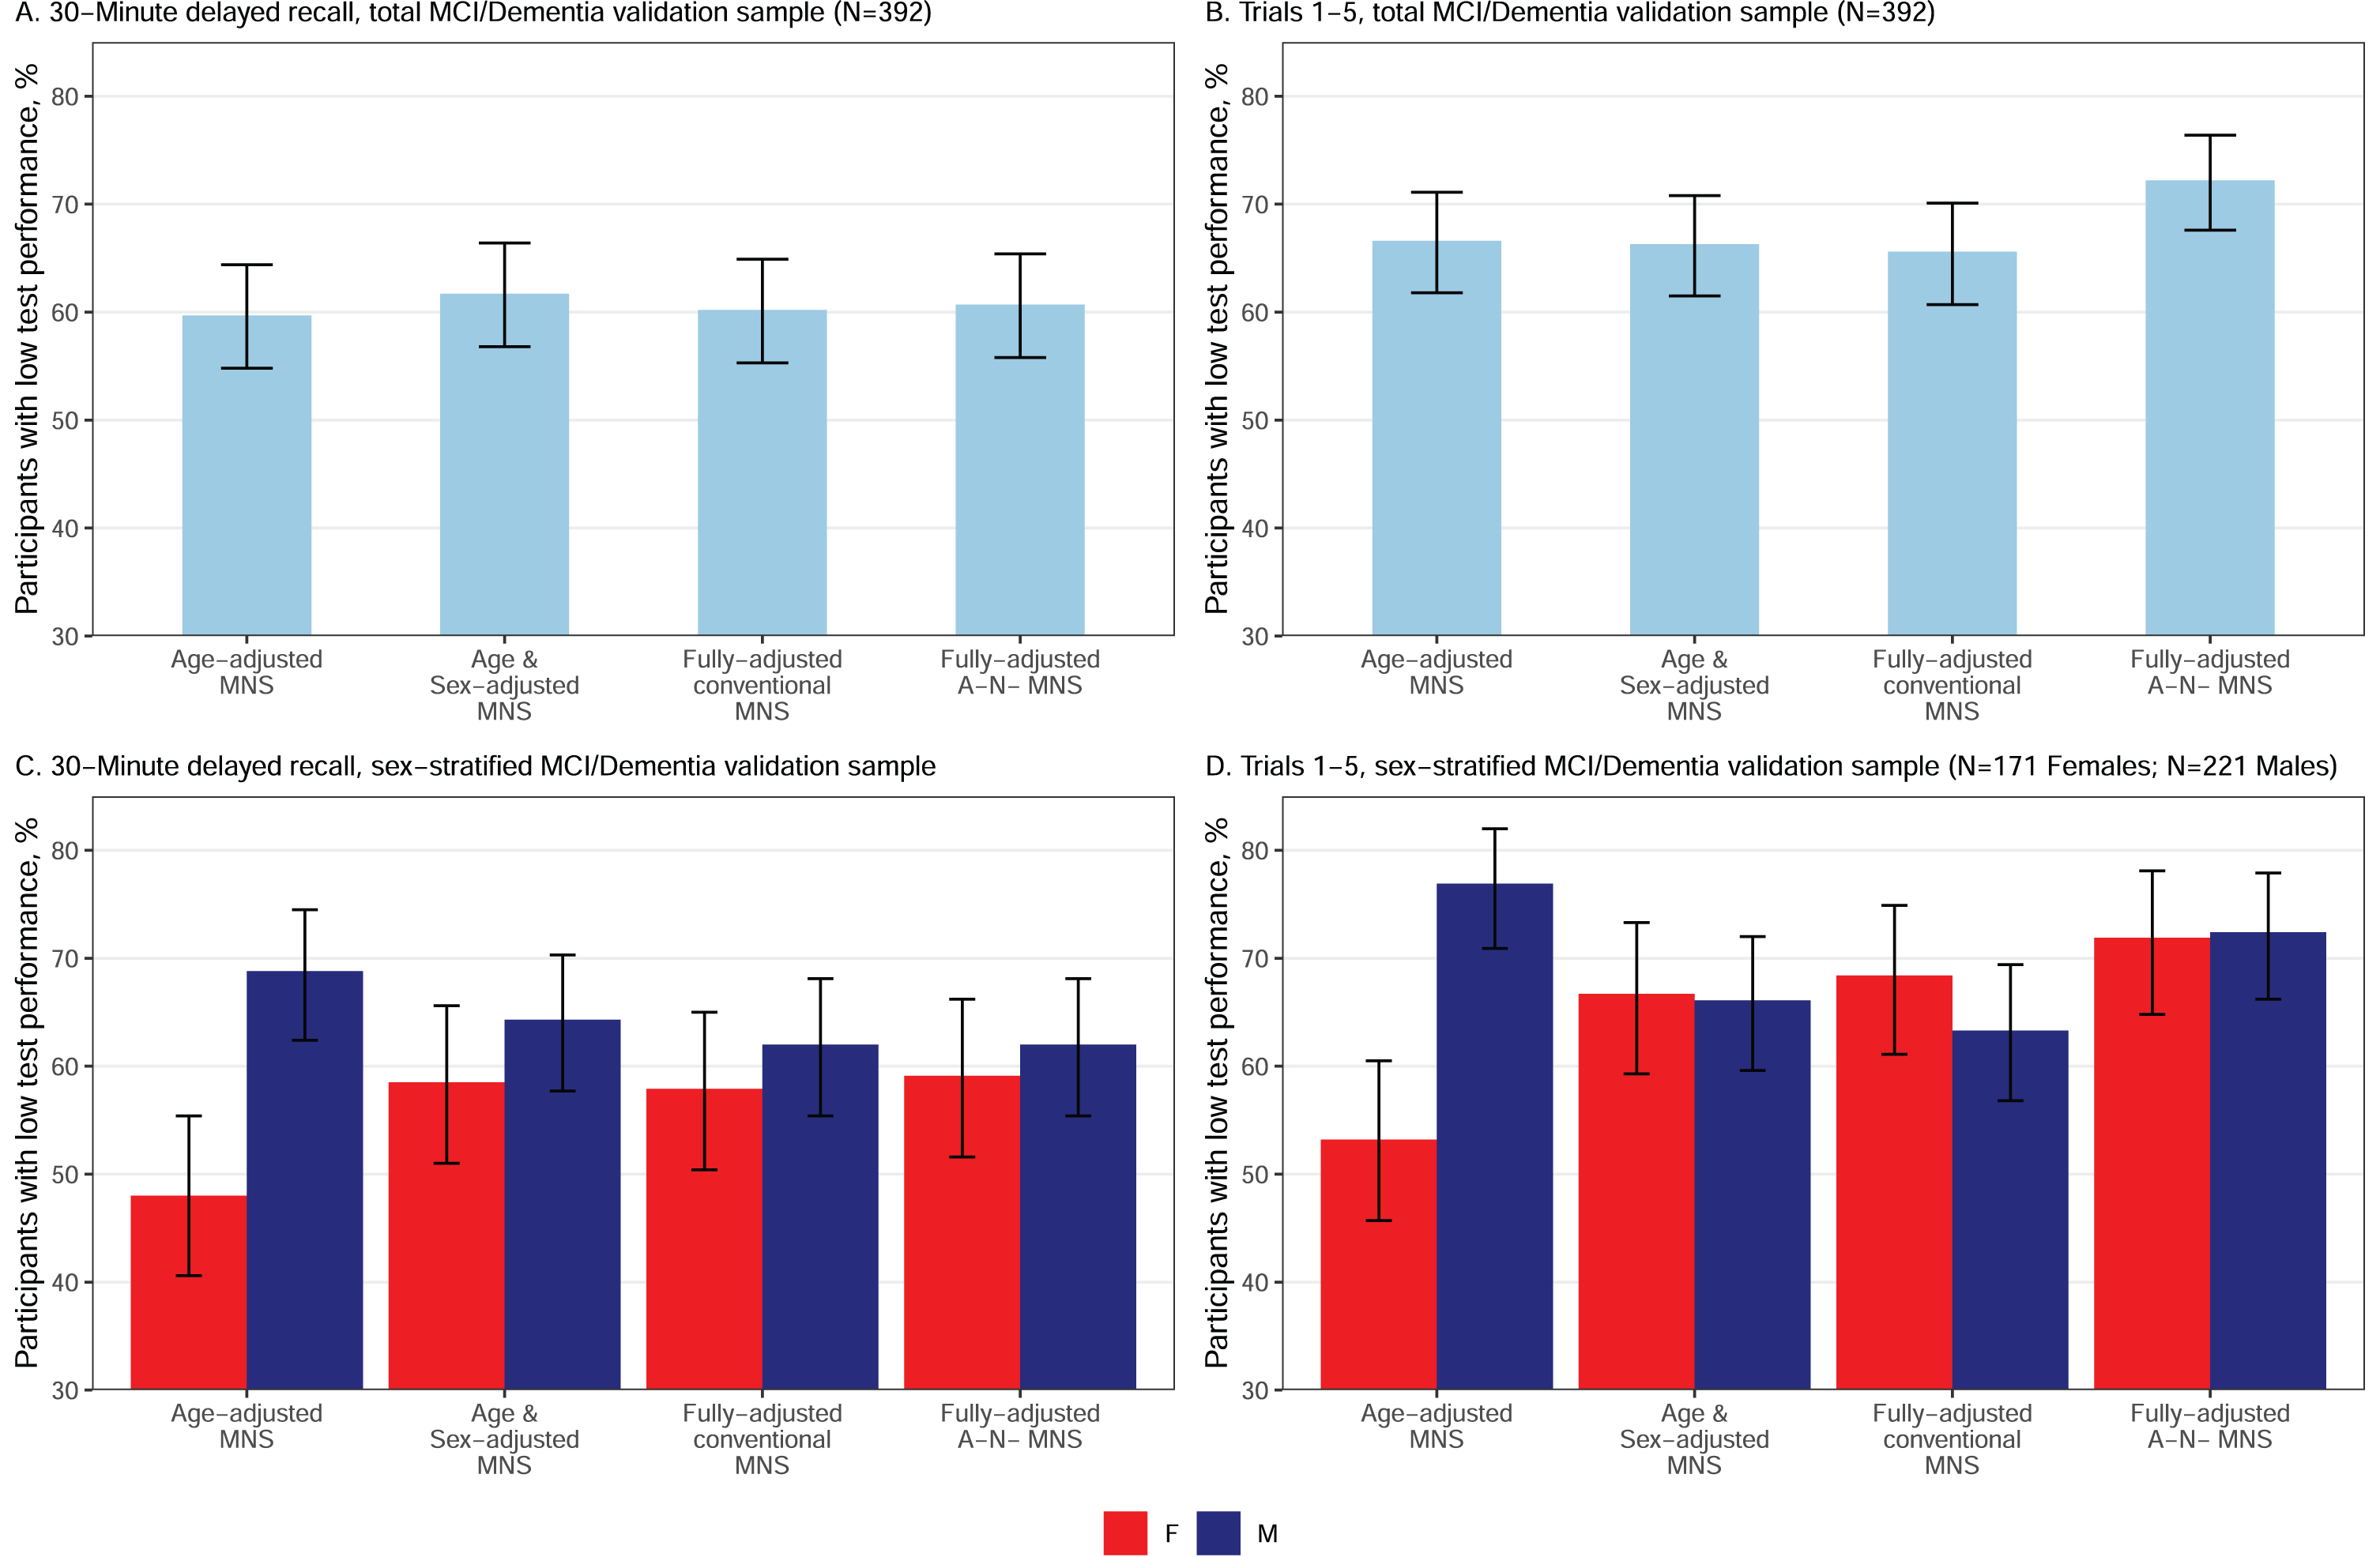
Comparison to conventional norms. The fully-adjusted A–N– MNS norms significantly increased sensitivity to MCI/dementia relative to fully-adjusted MNS conventional norms in the total (men and women combined) MCI/dementia sample for 1–5 total correct (Fig. 3B) and for sum of trials (ps < 0.05; Table 7), with 9% and 7% higher sensitivity for A–N– MNS norms, respectively. Sensitivity was comparable for fully-adjusted A–N– MNS norms and fully-adjusted conventional MNS norms for 30-minute delayed recall (Fig. 3A) and recognition PC (ps > 0.05). All MNS norms were significantly more sensitive to MCI/dementia than MOANS norms (ps < 0.05, Supplementary Table 3). Specifically, there was a 12% increase in sensitivity when comparing age-adjusted MOANS to age-adjusted MNS (p < 0.05).
Table 7
Sensitivity of different norms in MCI/Dementia: Proportion of participants with MCI/Dementia showing low test performance (< – 1 SD) on AVLT variables across normative adjustments
| MCI/Dementia sample (n = 392) % (CI) | |||
| Female (n = 171) | Male (n = 221) | Total (n = 392) | |
| 30-minute delayed recall | |||
| Age-adjusted conventional MNS† | 48.0 (40.6, 55.4)a,b,c | 68.8 (62.4, 74.5)a,b,c | 59.7 (54.8, 64.4) |
| Age & sex-adjusted convent. MNS | 58.5 (51.0, 65.6)a | 64.3 (57.7, 70.3)a | 61.7 (56.8, 66.4) |
| Fully-adjusted conventional MNS | 57.9 (50.4, 65.0)b | 62.0 (55.4, 68.1)b | 60.2 (55.3, 64.9) |
| Fully-adjusted A–N– MNS | 59.1 (51.6, 66.2)c | 62.0 (55.4, 68.1)c | 60.7 (55.8, 65.4) |
| Sum of trials | |||
| Age-adjusted conventional MNS† | 53.2 (45.7, 60.5)a,b,c | 76.9 (70.9, 82.0)a,b,c | 66.6 (61.8, 71.1)c |
| Age & sex-adjusted convent. MNS | 66.7 (59.3, 73.3)a,e | 66.1 (59.6, 72.0)a,e | 66.3 (61.5, 70.8)e |
| Fully-adjusted conventional MNS | 68.4 (61.1, 74.9)b,f | 63.3 (56.8, 69.4)b,f | 65.6 (60.7, 70.1)f |
| Fully-adjusted A–N– MNS | 71.9 (64.8, 78.1)c,e,f | 72.4 (66.2, 77.9)c,e,f | 72.2 (67.6, 76.4)c,e,f |
| 1–5 Total | |||
| Age-adjusted conventional MNS† | 49.1 (41.7, 56.6)a,b,c | 73.3 (67.1, 78.7)a,b | 62.8 (57.9, 67.4)c |
| Age & sex-adjusted convent. MNS | 63.2 (55.7, 70.0)a,e | 59.7 (53.1, 66.0)a,e | 61.2 (56.3, 65.9)e |
| Fully-adjusted conventional MNS | 62.6 (55.1, 69.5)b,f | 58.4 (51.8, 64.7)b,f | 60.2 (55.3, 64.9)f |
| Fully-adjusted A–N– MNS | 69.0 (61.7, 75.5)c,e,f | 68.8 (62.4, 74.5)e,f | 68.9 (64.1, 73.3)c,e,f |
| Recognition PC | |||
| Age-adjusted conventional MNS† | 35.1 (28.3, 42.5)a,b,c | 61.1 (54.5, 67.3)a,b,c | 49.7 (44.8, 54.7)b |
| Age & sex-adjusted convent. MNS | 45.6 (38.3, 53.1)a | 48.4 (41.9, 55.0)a | 47.2 (42.3, 52.1) |
| Fully-adjusted conventional MNS | 44.4 (37.2, 51.9)b | 46.6 (40.1, 53.2)b,f | 45.7 (40.8, 50.6)b |
| Fully-adjusted A–N– MNS | 43.9 (36.6, 51.4)c | 48.4 (41.9, 55.0)c,f | 46.4 (41.6, 51.4) |
We interpreted McNemar p-values < 0.05 as evidence of significantly different frequencies of low test scores for cross-norms comparisons (i.e., different sensitivity in the same individuals when different norms are applied); when the same letter appears for vertical comparisons within the table for a given AVLT variable, there is a significant difference; MCI, Mild Cognitive Impairment; AVLT, Auditory Verbal Learning Test; CU, Cognitively unimpaired; CI, Confidence Interval; MNS, Mayo Normative Studies; A–, amyloid negative; N–, neurodegeneration negative; Sum of Trials, Trials 1–5 total + trial 6 + 30-min recall; PC, Percent Correct. Fully-adjusted MNS adjust for age, age squared, sex, and education. Table used with permission of Mayo Foundation for Medical Education and Research, all rights reserved. †Chi-square comparison of females and males p < 0.05. Norms that did not adjust for sex showed significantly different (p < .05) sensitivity between females and males. aSignificantly different sensitivity observed for Age-adjusted MNS relative to Age & Sex-adjusted MNS. bSignificantly different sensitivity observed for Age-adjusted MNS relative to Fully-adjusted conventional MNS. cSignificantly different sensitivity observed for Age-adjusted MNS relative to Fully-adjusted A–N– MNS. dSignificantly different sensitivity observed for Age- & Sex-adjusted MNS relative to Fully-adjusted conventional MNS. This comparison is listed for comprehensiveness but none were significant. eSignificantly different sensitivity observed for Age- & Sex-adjusted MNS relative to Fully-adjusted A–N– MNS. fSignificantly different sensitivity observed for Fully-adjusted conventional MNS relative to Fully-adjusted A–N– MNS. Bolded in table because this is the primary comparison of interest.
Fig. 3
Sensitivity (percentage with T < 40) of 30-minute delayed recall and trials 1–5 total in MCI/Dementia for normative scores with varying levels of demographic and sample refinements in both the total MCI/Dementia validation sample (A and B) and by sex within the MCI/Dementia validation sample (C and D). MNS, Mayo Normative Studies. Figure used with permission of Mayo Foundation for Medical Education and Research, all rights reserved.
MCI/dementia validation sample, sex-stratified
Norms that adjust for age only (MNS conventional age-adjusted norms) showed significantly lower sensitivity to MCI/dementia in women compared to men across all AVLT variables for all outcomes (ps < 0.05; Table 7 and Fig. 3C and D present delayed recall and 1–5 total to help visualize results). Comparable sensitivity was seen for women and men for all norms that included an adjustment for sex (age and sex-adjusted conventional MNS; fully-adjusted conventional MNS; fully-adjusted A–N– MNS; ps > 0.05).
In women, sensitivity to MCI/dementia increased slightly with additional normative data refinement for 1–5 total, delayed recall and sum of trials (Table 7). Several of these within-group normative comparisons were statistically significant. All MNS norms that adjusted for sex showed significantly higher sensitivity than MNS age-adjusted conventional norms (that did not adjust for sex) for all AVLT variables in women (ps < 0.05). For the primary comparison of interest, the fully-adjusted A–N– norms significantly increased sensitivity to MCI/dementia relative to fully-adjusted MNS conventional norms for 1–5 total correct (Fig. 3D) and for sum of trials in women (ps < 0.05), with 3.5–6.4% higher sensitivity for A–N– norms (delayed recall and recognition PC did not reach significance for this comparison; Table 7).
In men, there was an unexpected pattern wherein age-adjusted MNS norms showed higher sensitivity than norms with additional demographic or normative sample refinements (e.g., age and sex-adjusted conventional MNS, fully-adjusted conventional MNS and fully-adjusted A–N– MNS) (Fig. 3C, D, Table 7). In other words, using sex-adjusted norms generally lowered sensitivity to MCI/dementia in men for MNS norms. However, sensitivity of fully-adjusted A–N– MNS was not statistically different from age-adjusted conventional MNS for 1–5 total or sum of trials; for these variables, the A–N– norms seemed to “make up” for the negative impact on sensitivity observed in men when adjusting for sex, although qualitatively sensitivity was still lower than for age-adjusted conventional MNS in men. For the primary comparison of interest, the fully-adjusted A–N– norms significantly increased sensitivity to MCI/dementia relative to fully-adjusted MNS conventional norms for sum of trials (9.1% increase), 1–5 total correct (10.4% increase; Fig. 3D), and more minimally for recognition PC (1.8% increase) (ps < 0.05); delayed recall showed no benefit from A–N– norms (p > 0.05; Table 7).
CU validation sample, all participants
Within the CU sample, the number of individuals showing T < 40 performance for fully-adjusted A–N– MNS norms was within expectation for delayed recall (CI included 14.7%), but slightly above expectations for all other variables (Table 8).
Table 8
Observed versus expected proportions (base rates) of low test performance (< – 1 SD) on AVLT indices across normative adjustments within the CU validation sample
| CU validation sample (n = 261) % (CI) | |||
| Female (n = 130) | Male (n = 131) | Total (n = 261) | |
| 30-minute delayed recall | |||
| Age-adjusted conventional MNS | 6.2 (3.2, 11.7)* | 22.9 (16.5, 30.8)* | 14.6 (10.8, 19.4) |
| Age & sex-adjusted convent. MNS | 13.1 (8.3, 19.9) | 13.0 (8.3, 19.8) | 13.0 (9.5, 17.7) |
| Fully-adjusted conventional MNS | 13.8 (8.9, 20.8) | 13.7 (8.9, 20.7) | 13.8 (10.1, 18.5) |
| Fully-adjusted A–N– MNS | 13.8 (8.9, 20.8) | 16.8 (11.4, 24.1) | 15.3 (11.5, 20.2) |
| Sum of trials | |||
| Age-adjusted conventional MNS | 5.4 (2.6, 10.7)* | 21.4 (15.2, 29.2)* | 13.4 (9.8, 18.1) |
| Age & sex-adjusted convent. MNS | 12.3 (7.7, 19.1) | 10.7 (6.5, 17.1) | 11.5 (8.2, 15.9) |
| Fully-adjusted conventional MNS | 16.9 (11.4, 24.3) | 14.5 (9.5, 21.5) | 15.7 (11.8, 20.6) |
| Fully-adjusted A–N– MNS | 23.1 (16.7, 31.0)* | 19.1 (13.3, 26.7) | 21.1 (16.6, 26.4)* |
| 1–5 Total | |||
| Age-adjusted conventional MNS | 6.2 (3.2, 11.7)* | 17.6 (12.0, 25.0) | 11.9 (8.5, 16.4) |
| Age & sex-adjusted convent. MNS | 13.8 (8.9, 20.8) | 9.2 (5.3, 15.3) | 11.5 (8.2, 15.9) |
| Fully-adjusted conventional MNS | 22.3 (16.0, 30.2)* | 11.5 (7.1, 18.0) | 16.9 (12.8, 21.9) |
| Fully-adjusted A–N– MNS | 25.4 (18.7, 33.5)* | 15.3 (10.1, 22.4) | 20.3 (15.9, 25.6)* |
| Recognition PC | |||
| Age-adjusted conventional MNS | 10.8 (6.5, 17.3) | 24.4 (17.9, 32.4)* | 17.6 (13.5, 22.7) |
| Age & sex-adjusted convent. MNS | 16.9 (11.4, 24.3) | 19.1 (13.3, 26.7) | 18.0 (13.8, 23.1) |
| Fully-adjusted conventional MNS | 16.9 (11.4, 24.3) | 19.1 (13.3, 26.7) | 18.0 (13.8, 23.1) |
| Fully-adjusted A–N– MNS | 21.5 (15.3, 29.4)* | 22.1 (15.9, 30.0)* | 21.8 (17.3, 27.2)* |
*Confidence intervals that do not contain the 14.7% expected base rate value are significantly different than expected. AVLT, Auditory Verbal Learning Test; CU, Cognitively Unimpaired; CI, Confidence Interval; MNS, Mayo Normative Studies; A–, amyloid negative; N–, without neurodegeneration; Sum of Trials, Trials 1–5 total + trial 6 + 30-min recall; PC, Percent Correct. Fully-adjusted MNS adjusts for age, age squared, sex, and education. Table used with permission of Mayo Foundation for Medical Education and Research, all rights reserved.
CU validation sample, sex-stratified
Within the CU sample, the number of men showing below cut-off performance for fully-adjusted A–N– MNS norms was within expectation for delayed recall, sum of trials, and 1–5 total correct, but slightly above expectations for recognition percent correct. The number of women showing below cut-off performance for fully-adjusted A–N– MNS norms was within expectation for delayed recall, but slightly above expectations for all other variables (Table 8).
DISCUSSION
We provide new A–N– MNS norms for AVLT on 1,059 CU participants aged 30–90 from the population-based MCSA. These normative data are intended to be used clinically alongside our updated conventional MNS norms for the AVLT [9]. The current study builds upon this previous work by examining sensitivity to MCI/dementia across varying levels of demographic adjustments and sample refinement. In the prior study, we examined frequency of low test performance in a CU validation sample only. In the current study, we examined the sensitivity of the updated conventional MNS norms and the newly derived fully-adjusted MNS A–N– norms in a cohort of MCI/dementia participants. These results allowed us to evaluate sensitivity across all normative approaches.
Cross-sectional associations between age and memory performance were greatly attenuated in an A–N– cohort relative to a conventional CU cohort. For trials 1–5 total, age explained approximately twice as much performance variance in the conventional CU cohort compared to the A–N– normative cohort. These results may suggest that up to two times the amount of variance in age-related memory decline is explained by undetected preclinical AD pathology. However, because so many individuals over 70 and 80 were excluded from the A–N– normative cohort due to biomarker positive status (A+, N+ or A+ N+), this rendered the sample more heavily weighted toward younger ages, which may contribute to this decreased association with age. These findings align with prior studies showing a reduction in age-associated variance in cognition after removing individuals with preclinical disease [18–20]. Borland et al. [19] found that the effect of age on memory performance nearly disappeared in a cohort without AD pathology (amyloid and tau), cerebrovascular pathology, and elevated neurofilament light. In a cohort specifically screened for amyloid and tau, however, age effects persisted despite A– status, similar to the continued age effects in our A–N– sample compared to the conventional normative sample [19]. Brugulat-Serrat and colleagues [20] developed regression-based, A– T– normative data and found only a marginal age effect for delayed recall, with stronger education and sex effects. However, the restricted age range of that sample (50–70 years) may have further decreased age effects.
Refining normative cohorts by biomarker status helps separate variance due to preclinical disease from variance due to age but is dependent on pathological exclusion. In the present study, despite attenuation, memory performance was still significantly associated with age after removing A+ and N+ individuals. This is not surprising, as we are only able to capture a small portion of neuropathological influences on cognition that increase in prevalence with age. For instance, we did not exclude based on tau pathology due to sample size considerations and our measure of N was limited to temporal cortical thickness. Boyle et al. [26] showed that AD pathology accounted for 30–36% of the variance in global cognitive decline. However, even when 11 AD and non-AD related pathological markers were considered concurrently, they accounted for only 43% of the variance in cognitive decline, with the remaining 57% of the variance unexplained. Given our population-based sample, the persistent associations between age and memory performance in our study may partially reflect inclusion of individuals with non-AD pathologies (e.g., limbic predominant age related TDP-43 pathology [LATE], Lewy bodies, cerebral amyloid angiopathy) and other, unexplained factors (e.g., structural and social determinants of health, other medical comorbidities).
Fully-adjusted A–N– MNS norms showed approximately 7–9% higher sensitivity to MCI/dementia compared to fully-adjusted MNS conventional norms for trials 1–5 total and sum of trials, but there was less to no notable benefit for delayed recall and recognition. The benefit of A–N– refinement on AVLT delayed recall was particularly small and could be the result of the typical floor effect observed on this measure in individuals with MCI and dementia. Both A–N– and conventional MNS norms showed significantly higher sensitivity to MCI/dementia relative to MOANS norms. This reinforces the importance of excluding individuals with MCI from normative samples (not done for MOANS as data collection predated the objective definition of MCI) and using normative data with updated inclusion criteria.
Our results also show the importance of stratifying results by sex. Norms that adjusted for age only were significantly less sensitive to MCI/dementia in women compared to men across all AVLT variables. In women, sensitivity to MCI/dementia also generally increased slightly with additional normative data refinement. In contrast, norms that adjusted for sex appeared to have a detrimental effect on sensitivity to MCI/dementia in men, which was an unexpected finding. We showed that age-adjusted MNS norms were generally more sensitive to MCI/dementia than norms with additional demographic or normative sample refinements in men. Both a physician and study coordinator were required to assign “CU” status for inclusion in the normative sample. The study coordinator’s diagnosis relied in part on information obtained through an informant (CDR); thus, it is possible that gender-related differences in informant reporting styles may have influenced the unexpected sex effects observed. An alternative explanation from a statistical basis is that because there are lifelong differences in verbal memory performance across men and women [9, 44, 45], by definition when men and women are combined into a single sample despite their different distributions of performance on the AVLT, men perform lower and thus an age-only adjustment is most sensitive to MCI/dementia in men because it is influenced by the higher performances observed in women. That is, since men perform lower than women on average, men receive lower T-scores when not including adjustment for sex, resulting in the increased sensitivity to MCI among men when applying MNS age-adjusted conventional norms. Conversely, women receive higher T-scores when applying norms that compare women to both men and women combined compared to norms that make sex-specific comparisons, resulting in the observed lower sensitivity to MCI/dementia for women seen with norms that only adjust for age.
Although comparison of AVLT indices was not a specific goal of this study, we note that some AVLT variables also offered more sensitivity to MCI/dementia relative to others. For example, sensitivity was 48% for delayed recall age-adjusted conventional MNS norms in women, and this increased to 58% with MNS fully-adjusted conventional norms. However, MNS fully-adjusted conventional norms offered an additional 10% sensitivity with sum of trials (i.e., 68%) and a further 4% increase (i.e., 72%) with the addition of A–N– norms. Taken together, sensitivity to MCI/dementia for women increased 24% when using A–N– fully-corrected MNS norms for sum of trials rather than MNS-age adjusted conventional norms for delayed recall (Table 7). This example illustrates the cumulative benefit of using refined norms and a more sensitive variable, especially for women.
Specificity is often negatively impacted when sensitivity increases, and this common trade-off is also observed in this study. While A–N– norms show some minor benefits regarding sensitivity to MCI/dementia, specificity is simultaneously lowered. For example, for AVLT sum of trials the A–N– norms increased sensitivity by 6.6% for all participants, while simultaneously lowering specificity by 5.4%. Put another way, A–N– norms showed slightly greater than expected base rates of low test performance in CU individuals, particularly in women. The increased rate of low performers may represent individuals at risk for MCI or transitioning to MCI. Higher rates in women may reflect the discrepancy in MCI diagnosis across sex, especially after accounting for similar rates of AD neuropathology in men and women [23]. Future work should apply A–N– norms to biomarker-characterized validation samples to understand what underlies these sex-specific results. Further, it will be important to examine whether A–N– norms improve identification of subtle cognitive changes and therefore better predict future cognitive decline. For example, Bos et al. [13] demonstrated that A– normative data improved predictive accuracy of conversion to dementia. Based on the AD pathological cascade model, amyloid deposition precedes an MCI diagnosis by several years [46]. More recent findings also show that there are cross sectional differences in cognitive performance in those considered A+ [10, 11]. By not including AD biomarker status in normative data, we may lower the threshold for “unimpaired” performance, obscuring detection of subtle, sub-clinical changes. Thus, finding elevated proportions of low performers in our CU sample may represent decline that would not be detected had biomarker-refined normative data notbeen used.
These results highlight the critical importance of the clinical neuropsychologist for interpreting complex normative data for an individual patient in the context of that individual’s history and presenting problems. For clinicians who may choose to apply these new A–N– norms, we recommend using them in conjunction with the MNS conventional norms. For example, there are some isolated instances where the conventional norms are more stringent than the A–N– norms (see Supplementary Figure 2). We provide an updated MNS calculation tool that allows consideration of these differing levels of normative adjustment simultaneously to best inform an overall clinical impression of impaired versus normal performance on the AVLT. Like robust norms that take a longitudinal approach to removing individuals with preclinical disease from the normative sample [14, 15], these A–N– norms reflect an alternative robust method of refining the normative sample to increase sensitivity of the norms. These norms do not require knowing biomarker status to be applied.
The current study is not without limitations. First, several factors impacted our decision to focus only on amyloid and neurodegeneration biomarker status for these norms. Notably, our biomarker-refined norms do not include tau status, which is a component of the ATN framework and associated with cognition [36]. The MCSA recently began collecting tau PET data around the time of the data freeze for the normative sample, but sample sizes were not sufficient for the current study to require tau negative status (A– T– N– CU, n = 126). Similarly, because A+ status alone confers elevated risk of future cognitive decline and dementia [47], an alternative approach may have been to generate separate biomarker-refined normative data based only on A– status, in addition to A–N– norms, to help examine the relative contributions of amyloid and neurodegeneration to biomarker-refined norms. We chose to require A–N– status because we previously demonstrated that N+ has a more deleterious effect on longitudinal cognitive trajectories than A+ in CU individuals [16], and other work by our group has suggested that elevated brain amyloid and neurodegeneration are independently and additively associated with declining memory [48, 49]. Also, we did not have reliable biomarkers for elevated cerebrovascular disease, which were still being validated at the time of these analyses. Inclusion of these biomarkers in the development of norms is an important future direction. Second, the sample was predominantly White and non-Hispanic with 12+ years of education, limiting generalizability of these norms to other groups. For more specific details about how the demographic characteristics of Olmsted County, Minnesota previously compared to the state of Minnesota, the Upper Midwest and the United States, please see St. Sauver et al. [50]. Third, the amyloid PET cut point we used in this manuscript has been updated since the time of the normative derivations from 1.42 as used in this study to 1.48 [51]. Fourth, the normative data for those aged 80+ is based on few participants because of the high rates of A+ and N+ in this group following our robust A–N– approach (n = 11, 7% of those with biomarker data available), and we see similarly low rates of A–N– status in the 70–79 age group (n = 129, 22% of those with biomarker data available). This highlights the question of “what is typical/normal?” for certain age groups in terms of biomarkers. The goal of normative data is to provide a measure of expected performance for typical individuals within a particular age group. It could be argued that using biomarker-refined normative data does not accomplish this goal, particularly with increasing age. For example, based on data presented by Jack and colleagues [12], about half of individuals in their 70 s (ages 70–79) are biomarker positive based on AN imaging status, and this exceeds 75% by aged 80+. For this reason, for clinical use we recommend consideration of these norms alongside our recently published conventional MNS AVLT norms [9], as also recommended by Bos et al. [13]. However, if the goal is to maximize sensitivity to potential early cognitive changes to inform prognosis or risk for future decline, then biomarker-refined normative data approaches or consideration of raw score cut-offs that inform risk may be preferred over conventional norms that include individuals with preclinical disease. Future application could include using conventional norms to anchor expectations for age while estimating risk of future biomarker positivity or cognitive decline based on a given cognitive performance and demographic data (i.e., generate a risk model). For example, an 85-year-old male with “average” memory performance could simultaneously be considered at elevated risk of biomarker positivity or future cognitive decline depending on the risk model results. This individual could be reassured that their performance is similar to others their age while also providing risk information that may motivate engagement in healthy behaviors or other interventions that may reduce the risk of further decline. Finally, because the neuropsychologist’s impression was not included in the CU diagnosis used for this study to reduce circularity, these participants may be better described as cognitively asymptomatic based on both brief mental status testing and examination by the study physician and by participant and caregiver interview by a study coordinator using the CDR. However, some participants did show difficulties on neuropsychological tests as reflected by the neuropsychologists’ independent diagnosis (see Table 5 for details). We retained the CU label to maintain consistency with our prior normative studies that used this same diagnostic approach that excludes use of neuropsychological data to avoid circularity [9,48], but it is important to note that 9.9% of these individuals were considered cognitively impaired (6.3% MCI, 0.1% dementia and 3.5% other unspecified cognitive impairment) based on neuropsychological testing data in isolation.
In summary, A–N– norms show some minor benefits in terms of sensitivity for MCI/dementia relative to traditional normative approaches. Given the relatively small incremental benefit of these A–N– refined norms in an already well-characterized sample that adjusts for several key demographic variables, it may be that a biomarker-refined normative approach may be more impactful when applied in convenience normative samples that are not well characterized clinically. In other words, when limited resources make ruling out mild cognitive impairment infeasible, biomarker-refined norms may have a larger benefit, particularly if reliable and valid cut-offs for plasma biomarkers of neurodegenerative disorders become available. This work represents an important step toward improving sensitivity of neuropsychological measures to clinical syndromes (MCI/dementia) caused by Alzheimer’s disease and other neurodegenerative etiologies.
AUTHOR CONTRIBUTIONS
Nikki Horne Stricker (Conceptualization; Funding acquisition; Investigation; Methodology; Project administration; Resources; Supervision; Writing – original draft; Writing – review & editing); Teresa J. Christianson (Data curation; Formal analysis; Visualization); Shehroo B. Pudumjee (Conceptualization; Writing – original draft; Writing – review & editing); Angelina J. Polsinelli (Conceptualization; Writing – original draft; Writing – review & editing); Emily S. Lundt (Formal analysis); Ryan D. Frank (Formal analysis; Writing – review & editing); Walter K. Kremers (Formal analysis; Resources; Supervision; Writing – review & editing); Mary M. Machulda (Conceptualization; Writing – review & editing); Julie A. Fields (Writing – review & editing); Clifford R. Jack, Jr (Conceptualization; Methodology; Resources; Writing – review & editing); David S. Knopman (Conceptualization; Resources; Writing – review & editing); Jonathan Graff-Radford (Resources; Writing – review & editing); Prashanthi Vemuri (Conceptualization; Resources; Writing – review & editing); Michelle M. Mielke (Resources; Writing – review & editing); Ronald C. Petersen (Funding acquisition; Resources; Supervision; Writing – review & editing).
ACKNOWLEDGMENTS
The authors wish to thank the participants and staff at the Mayo Clinic Study of Aging. We acknowledge Winnie Fan, M.S for her assistance with figure preparation.∥Portions of this manuscript were previously presented:∥Pudumjee, S. B., Christianson, T. J., Lundt, E. S., Machulda, M. M., Mielke, M. M., Kremers, W., Jack Jr., C., Knopman, D. S., Petersen, R. C., & Stricker, N. H. (2021). Mayo Clinic Normative Studies: amyloid and neurodegeneration negative (A– N– ) Auditory Verbal Learning Test normative data and preliminary validation. Paper presented at the Annual Conference of the International Neuropsychological Society, Virtual Conference.∥Polsinelli, A.J., Stricker, N.H., Christianson, T.J., Machulda, M.M., Kremers, W.K., Mielke, M.M., Jack, C.R., Knopman, D.S., & Peterson, R.C. (2019). Presence of preclinical AD pathology in cognitively unimpaired older adults may exacerbate age-related memory decline. Poster presented at the International Aging & Cognition Conference, Zurich, CH.
FUNDING
This work was supported by the Rochester Epidemiology Project (R01 AG034676), the National Institutes of Health (grant numbers P50 AG016574, U01 AG006786, R01 AG041851, R01 AG081955, RF1 AG55151, R21 AG073967, RF1AG 69052), the Robert Wood Johnson Foundation, The Elsie and Marvin Dekelboum Family Foundation, Alzheimer’s Association, and the Mayo Foundation for Education and Research.
CONFLICT OF INTEREST
Clifford R. Jack receives no personal compensation from any commercial entity. He receives research support from NIH, the GHR Foundation, and the Alexander Family Alzheimer’s Disease Research Professorship of the Mayo Clinic.
David Knopman is an Editorial Board Member of this journal but was not involved in the peer-review process nor had access to any information regarding its peer-review. He serves on a Data Safety Monitoring Board for the DIAN-TU study and was an investigator in clinical trials sponsored by Lilly Pharmaceuticals, Biogen, and the University of Southern California.
Ronald Petersen has served as a consultant for Roche, Inc.; Genentech, Inc.; Eli Lilly and Co.; Eisai, Inc.; and Nestle, Inc. He receives royalties from Oxford University Press and UpToDate.
Michelle Mielke is an Editorial Board Member of this journal but was not involved in the peer-review process nor had access to any information regarding its peer-review. She has served on scientific advisory boards and/or has consulted for Biogen, Eisai, LabCorp, Lilly, Merck, Novo Nordisk, Roche, Siemens Healthineers, and Sunbird Bio and receives grant support from the National Institute of Health, Department of Defense, and Alzheimer’s Association.
Nikki Stricker is an Editorial Board Member of this journal but was not involved in the peer-review process nor had access to any information regarding its peer-review. She receives no personal compensation from any commercial entity. She receives research support from NIH and the Mayo Clinic Kevin Merszei Career Development Award in Neurodegenerative Diseases Research IHO Janet Vittone, MD.
All other authors have no conflict of interest to report.
DATA AVAILABILITY
The data supporting the findings of this study are available upon reasonable request to the corresponding author and with approval from Mayo Clinic Study of Aging investigators.
SUPPLEMENTARY MATERIAL
[1] The supplementary material is available in the electronic version of this article: https://dx.doi.org/10.3233/JAD-240081.
REFERENCES
[1] | Delis DC , Kramer JH , Kaplan E , Ober BA ((2000) ) California Verbal Learning Test (2nd ed): Adult version, manual, Psychological Corporation, San Antonio, TX. |
[2] | Wechsler D ((2009) ) The Wechsler Memory Scale-Fourth Edition (WMS-IV) Technical and Interpretive Manual, Pearson Assessments, San Antonio, TX. |
[3] | Ivnik RJ , Malec JF , Smith GE , Tangalos E , Petersen RC , Kokmen E , Kurland LT ((1992) ) Mayo’s Older Americans Normative Studies: Updated AVLT norms for ages 56 to 97. Clin Neuropsychol 6: , 83–104. |
[4] | Petersen RC , Roberts RO , Knopman DS , Boeve BF , Geda YE , Ivnik RJ , Smith GE , Jack CR Jr. ((2009) ) Mild cognitive impairment: Ten years later. Arch Neurol 66: , 1447–1455. |
[5] | Salthouse T ((2010) ) Selective review of cognitive aging. J Int Neuropsychol Soc 16: , 754–760. |
[6] | Yu L , Boyle PA , Segawa E , Leurgans S , Schneider JA , Wilson RS , Bennett DA ((2015) ) Residual decline in cognition after adjustment for common neuropathologic conditions. Neuropsychology 29: , 335–343. |
[7] | Sliwinski MJ , Hofer SM , Hall C , Buschke H , Lipton RB ((2003) ) Modeling memory decline in older adults: The importance of preclinical dementia, attrition, and chronological age. Psychol Aging 18: , 658–671. |
[8] | Harrington KD , Schembri A , Lim YY , Dang C , Ames D , Hassenstab J , Laws SM , Rainey-Smith S , Robertson J , Rowe CC , Sohrabi HR , Salvado O , Weinborn M , Villemagne VL , Masters CL , Maruff P , AIBL Research Group ((2018) ) Estimates of age-related memory decline are inflated by unrecognized Alzheimer’s disease. Neurobiol Aging 70: , 170–179. |
[9] | Stricker NH , Christianson TJ , Lundt ES , Alden EC , Machulda MM , Fields JA , Kremers WK , Jack CR , Knopman DS , Mielke MM , Petersen RC ((2021) ) Mayo normative studies: Regression-based normative data for the auditory verbal learning test for ages 30-91 years and the importance of adjusting for sex. J Int Neuropsychol Soc 27: , 211–226. |
[10] | Baker JE , Lim YY , Pietrzak RH , Hassenstab J , Snyder PJ , Masters CL , Maruff P ((2017) ) Cognitive impairment and decline in cognitively normal older adults with high amyloid-beta: A meta-analysis. Alzheimers Dement (Amst) 6: , 108–121. |
[11] | Duke Han S , Nguyen CP , Stricker NH , Nation DA ((2017) ) Detectable neuropsychological differences in early preclinical Alzheimer’s disease: A meta-analysis. Neuropsychol Rev 27: , 305–325. |
[12] | Jack CR , Wiste HJ , Weigand SD , Rocca WA , Knopman DS , Mielke MM , Lowe VJ , Senjem ML , Gunter JL , Preboske GM , Pankratz VS , Vemuri P , Petersen RC ((2014) ) Age-specific population frequencies of cerebral B-amyloidosis and neurodegeneration among people with normal cognitive function aged 50-89 years: A cross-sectional study. Lancet Neurol 13: , 997–1005. |
[13] | Bos I , Vos SJB , Jansen WJ , Vandenberghe R , Gabel S , Estanga A , Ecay-Torres M , Tomassen J , den Braber A , Lleo A , Sala I , Wallin A , Kettunen P , Molinuevo JL , Rami L , Chetelat G , de la Sayette V , Tsolaki M , Freund-Levi Y , Johannsen P , Alzheimer’s Disease Neuroimaging Initiative, Novak GP , Ramakers I , Verhey FR , Visser PJ ((2018) ) Amyloid-beta, tau, and cognition in cognitively normal older individuals: Examining the necessity to adjust for biomarker status in normative data. Front Aging Neurosci 10: , 193. |
[14] | Clark LR , Koscik RL , Nicholas CR , Okonkwo OC , Engelman CD , Bratzke LC , Hogan KJ , Mueller KD , Bendlin BB , Carlsson CM , Asthana S , Sager MA , Hermann BP , Johnson SC ((2016) ) Mild cognitive impairment in late middle age in the Wisconsin Registry for Alzheimer’s Prevention Study: Prevalence and characteristics using robust and standard neuropsychological normative data. Arch Clin Neuropsychol 31: , 675–688. |
[15] | Sliwinski M , Lipton RB , Buschke H , Stewart W ((1996) ) The effects of preclinical dementia on estimates of normal cognitive functioning in aging. J Gerontol Psychol Sci 51B: , P217–P225. |
[16] | Machulda MM , Hagen CE , Wiste HJ , Mielke MM , Knopman DS , Roberts RO , Vemuri P , Lowe VJ , Jack CR Jr. , Petersen RC ((2017) ) Practice effects and longitudinal cognitive change in clinically normal older adults differ by Alzheimer imaging biomarker status. Clin Neuropsychol 31: , 99–117. |
[17] | Mormino EC , Betensky RA , Hedden T , Schultz AP , Amariglio RE , Rentz DM , Johnson KA , Sperling RA ((2014) ) Synergistic effect of β-amyloid and neurodegeneration on cognitive decline in clinically normal individuals. JAMA Neurol 71: , 1379–1385. |
[18] | Hassenstab J , Chasse R , Grabow P , Benzinger TL , Fagan AM , Xiong C , Jasielec M , Grant E , Morris JC ((2016) ) Certified normal: Alzheimer’s disease biomarkers and normative estimates of cognitive functioning. Neurobiol Aging 43: , 23–33. |
[19] | Borland E , Stomrud E , van Westen D , Hansson O , Palmqvist S ((2020) ) The age-related effect on cognitive performance in cognitively healthy elderly is mainly caused by underlying AD pathology or cerebrovascular lesions: Implications for cutoffs regarding cognitive impairment. Alzheimers Res Ther 12: , 30. |
[20] | Brugulat-Serrat A , Canas-Martinez A , Canals-Gispert L , Marne P , Gramunt N , Mila-Aloma M , Suarez-Calvet M , Arenaza-Urquijo EM , Grau-Rivera O , Gonzalez-de-Echavarri JM , Minguillon C , Fauria K , Kollmorgen G , Suridjan I , Zetterberg H , Blennow K , Gispert JD , Molinuevo JL , Sanchez-Benavides G , study A ((2021) ) Enhancing the sensitivity of memory tests: Reference data for the Free and Cued Selective Reminding Test and the Logical Memory Task from cognitively healthy subjects with normal Alzheimer’s disease cerebrospinal fluid biomarker levels. J Alzheimers Dis 84: , 119–128. |
[21] | Sundermann EE , Biegon A , Rubin LH , Lipton RB , Mowrey W , Landau S , Maki PM , Alzheimer’s Disease Neuroimaging Initiative ((2016) ) Better verbal memory in women than men in MCI despite similar levels of hippocampal atrophy. Neurology 86: , 1368–1376. |
[22] | Sundermann EE , Biegon A , Rubin LH , Lipton RB , Landau S , Maki PM , Alzheimer’s Disease Neuroimaging Initiative ((2017) ) Does the female advantage in verbal memory contribute to underestimating Alzheimer’s disease pathology in women versus men? J Alzheimers Dis 56: , 947–957. |
[23] | Jack CR Jr. , Therneau TM , Weigand SD , Wiste HJ , Knopman DS , Vemuri P , Lowe VJ , Mielke MM , Roberts RO , Machulda MM , Graff-Radford J , Jones DT , Schwarz CG , Gunter JL , Senjem ML , Rocca WA , Petersen RC ((2019) ) Prevalence of biologically vs clinically defined Alzheimer spectrum entities using the National Institute on Aging-Alzheimer’s Association Research Framework. JAMA Neurol 76: , 1174–1183. |
[24] | Petersen RC , Roberts RO , Knopman DS , Geda YE , Cha RH , Pankratz VS , Boeve B , Tangalos EG , Ivnik RJ , Rocca WA ((2010) ) Prevalence of mild cognitive impairment is higher in men: The Mayo Clinic Study of Aging. Neurology 75: , 889–897. |
[25] | Sundermann EE , Maki P , Biegon A , Lipton RB , Mielke MM , Machulda MM , Bondi MW , Alzheimer’s Disease Neuroimaging Initiative ((2019) ) Sex-specific norms for verbal memory tests may improve diagnostic accuracy of amnestic MCI. Neurology 93: , e1881–e1889. |
[26] | Boyle PA , Wang T , Yu L , Wilson RS , Dawe R , Arfanakis K , Schneider JA , Bennett DA ((2021) ) To what degree is late life cognitive decline driven by age-related neuropathologies? Brain 144: , 2166–2175. |
[27] | St Sauver JL , Grossardt BR , Yawn BP , Melton LJ 3rd , Pankratz JJ , Brue SM , Rocca WA ((2012) ) Data resource profile: The Rochester Epidemiology Project (REP) medical records-linkage system. Int J Epidemiol 41: , 1614–1624. |
[28] | St. Sauver JL , Grossardt BR , Yawn BP , Melton LJr , Rocca WA ((2011) ) Use of a medical records linkage system to enumerate a dynamic population over time: The Rochester Epidemiology Project. Am J Epidemiol 173: , 1059–1068. |
[29] | Roberts RO , Geda YE , Knopman DS , Cha RH , Pankratz VS , Boeve BF , Ivnik RJ , Tangalos EG , Petersen RC , Rocca WA ((2008) ) The Mayo Clinic Study of Aging: Design and sampling, participation, baseline measures and sample characteristics. Neuroepidemiology 30: , 58–69. |
[30] | Kokmen E , Smith GE , Petersen RC , Tangalos E , Ivnik RC ((1991) ) The short test of mental status: Correlations with standardized psychometric testing. Arch Neurol 48: , 725–728. |
[31] | Morris JC ((1993) ) The Clinical Dementia Rating (CDR): Current version and scoring rules. Neurology 43: , 2412–2414. |
[32] | Klunk WE , Koeppe RA , Price JC , Benzinger TL , Devous MD Sr. , Jagust WJ , Johnson KA , Mathis CA , Minhas D , Pontecorvo MJ , Rowe CC , Skovronsky DM , Mintun MA ((2015) ) The Centiloid Project: Standardizing quantitative amyloid plaque estimation by PET. Alzheimers Dement 11: , 1–15 e11-14. |
[33] | Jack CR Jr. , Wiste HJ , Weigand SD , Therneau TM , Lowe VJ , Knopman DS , Gunter JL , Senjem ML , Jones DT , Kantarci K , Machulda MM , Mielke MM , Roberts RO , Vemuri P , Reyes DA , Petersen RC ((2017) ) Defining imaging biomarker cut points for brain aging and Alzheimer’s disease. Alzheimers Dement 13: , 205–216. |
[34] | Schwarz CG , Gunter JL , Wiste HJ , Przybelski SA , Weigand SD , Ward CP , Senjem ML , Vemuri P , Murray ME , Dickson DW , Parisi JE , Kantarci K , Weiner MW , Petersen RC , Jack CR ((2016) ) A large-scale comparison of cortical thickness and volume methods for measuring Alzheimer’s disease severity. Neuroimage Clin 11: , 802–812. |
[35] | Jack CR , Therneau TM , Wiste HJ , Weigand SD , Knopman DS , Lowe VJ , Mielke MM , Vemuri P , Roberts RO , Machulda MM , Senjem ML , Gunter JL , Rocca WA , Petersen RC ((2016) ) Transition rates between amyloid and neurodegeneration biomarker states and to dementia: A population-based, longitudinal cohort study. Lancet Neurol 15: , 56–64. |
[36] | Jack CR Jr. , Bennett DA , Blennow K , Carrillo MC , Dunn B , Haeberlein SB , Holtzman DM , Jagust W , Jessen F , Karlawish J , Liu E , Molinuevo JL , Montine T , Phelps C , Rankin KP , Rowe CC , Scheltens P , Siemers E , Snyder HM , Sperling R , Contributors ((2018) ) NIA-AA Research Framework: Toward a biological definition of Alzheimer’s disease. Alzheimers Dement 14: , 535–562. |
[37] | Jack CR Jr. , Bennett DA , Blennow K , Carrillo MC , Feldman HH , Frisoni GB , Hampel H , Jagust WJ , Johnson KA , Knopman DS , Petersen RC , Scheltens P , Sperling RA , Dubois B ((2016) ) A/T/N: An unbiased descriptive classification scheme for Alzheimer disease biomarkers. Neurology 87: , 539–547. |
[38] | Rey A ((1964) ) L’ examen clinique en psychologie (2. éd. ed.), Presses universitaires de France., Paris. |
[39] | Ferman TJ , Lucas JA , Ivnik RJ , Smith GE , Willis FB , Petersen RC , Graff-Radford NR ((2005) ) Mayo’s Older African American Normative Studies: Auditory Verbal Learning Test norms for African American elders. Clin Neuropsychol 19: , 214–228. |
[40] | Heaton RK , Miller SW , Taylor MJ , Grant I ((2004) ) Revised Comprehensive Norms for an Expanded Halstead–ReitanBattery: Demographically Adjusted Neuropsychological Norms for African American and Caucasian Adults, Psychological Assessment Resources, Odessa, FL. |
[41] | Casaletto KB , Umlauf A , Beaumont J , Gershon R , Slotkin J , Akshoomoff N , Heaton RK ((2015) ) Demographically Corrected normative standards for the English Version of the NIH Toolbox Cognition Battery. J Int Neuropsychol Soc 21: , 378–391. |
[42] | Schmidt M ((1996) ) Rey Auditory-Verbal Learning Test, Western Psychological Services, Los Angeles. |
[43] | Delis DC , Kramer JH , Kaplan E , Ober BA ((2017) ) California Verbal Learning Test, 3rd ed. Manual, NCS Pearson, Inc., Bloomington, MN. |
[44] | Aartsen MJ , Martin M , Zimprich D , Longitudinal Aging Study Amsterdam ((2004) ) Gender differences in level and change in cognitive functioning. Results from the Longitudinal Aging Study Amsterdam. Gerontology 50: , 35–38. |
[45] | Kramer JH , Delis DC , Kaplan E , O’Donnell L , Prifitera A ((1997) ) Developmental sex differences in verbal learning. Neuropsychology 11: , 577–584. |
[46] | Jack CR Jr. , Knopman DS , Jagust WJ , Petersen RC , Weiner MW , Aisen PS , Shaw LM , Vemuri P , Wiste HJ , Weigand SD , Lesnick TG , Pankratz VS , Donohue MC , Trojanowski JQ ((2013) ) Tracking pathophysiological processes in Alzheimer’s disease: An updated hypothetical model of dynamic biomarkers. Lancet Neurol 12: , 207–216. |
[47] | Jack CR Jr. , Therneau TM , Lundt ES , Wiste HJ , Mielke MM , Knopman DS , Graff-Radford J , Lowe VJ , Vemuri P , Schwarz CG , Senjem ML , Gunter JL , Petersen RC ((2022) ) Long-term associations between amyloid positron emission tomography, sex, apolipoprotein E and incident dementia and mortality among individuals without dementia: Hazard ratios and absolute risk. Brain Commun 4: , fcac017. |
[48] | Knopman DS , Lundt ES , Therneau TM , Vemuri P , Lowe VJ , Kantarci K , Gunter JL , Senjem ML , Mielke MM , Machulda MM , Boeve BF , Jones DT , Graff-Radford J , Albertson SM , Schwarz CG , Petersen RC , Jack CR Jr. ((2019) ) Entorhinal cortex tau, amyloid-β, cortical thickness and memory performance in non-demented subjects. Brain 142: , 1148–1160. |
[49] | Knopman DS , Lundt ES , Therneau TM , Vemuri P , Lowe VJ , Kantarci K , Gunter JL , Senjem ML , Mielke MM , Machulda MM , Roberts RO , Boeve BF , Jones DT , Petersen RC , Jack CR Jr. ((2018) ) Joint associations of beta-amyloidosis and cortical thickness with cognition. Neurobiol Aging 65: , 121–131. |
[50] | St Sauver JL , Grossardt BR , Leibson CL , Yawn BP , Melton LJ 3rd , Rocca WA ((2012) ) Generalizability of epidemiological findings and public health decisions: An illustration from the Rochester Epidemiology Project. Mayo Clin Proc 87: , 151–160. |
[51] | Lowe VJ , Lundt ES , Albertson SM , Przybelski SA , Senjem ML , Parisi JE , Kantarci K , Boeve B , Jones DT , Knopman D , Jack CR Jr. , Dickson DW , Petersen RC , Murray ME ((2019) ) Neuroimaging correlates with neuropathologic schemes in neurodegenerative disease. Alzheimers Dement 15: , 927–939. |


