
Plasma pTau181 Predicts Clinical Progression in a Phase 2 Randomized Controlled Trial of the 11β-HSD1 Inhibitor Xanamem® for Mild Alzheimer’s Disease
Abstract
Background:
Blood biomarkers are proposed as a diagnostic alternative to amyloid PET or cerebrospinal fluid (CSF) analyses for the diagnosis of Alzheimer’s disease (AD). Relatively little is known of the natural history of patients identified by different blood biomarkers.
Objective:
To identify patients with elevated plasma phosphorylated tau (pTau)181 from a prior Phase 2a trial, and explore the natural histories of their clinical progression, and potential efficacy of Xanamem, a selective inhibitor of 11beta-hydroxysteroid dehydrogenase type 1 (11β-HSD1) in these patients.
Methods:
A prespecified, double-blind analysis was conducted in 72 participants with clinically diagnosed AD and available plasma samples from baseline and Week 12 of the “XanADu” Phase 2a trial of Xanamem versus placebo. The analysis prespecified plasma pTau181 > median to identify patients more likely to have AD (“H”, > 6.74 pg/mL, n = 34). Cohen’s d (d) of≥0.2 defined potential clinical significance.
Results:
In the placebo group, H patients showed greater clinical progression compared to L patients (pTau181≤median) on ADCOMS (d = 0.55, p < 0.001), CDR-SB (d = 0.63, p < 0.001), MMSE (d = 0.52, p = 0.12), and ADAS-Cog14 (d = 0.53, p = 0.19). In H patients, a potentially clinically meaningful Xanamem treatment effect compared to placebo was seen in the CDR-SB (LS mean difference 0.6 units, d = 0.41, p = 0.09) and Neuropsychological Test Battery (NTB; LS mean difference 1.8 units, d = 0.26, p = 0.48) but not ADCOMS or ADAS-Cog14.
Conclusions:
This trial demonstrates that elevated plasma pTau181 identifies participants more likely to have progressive AD and is a suitable method for enrichment in AD clinical trials. Xanamem treatment showed evidence of potential clinically meaningful benefits.
INTRODUCTION
In Alzheimer’s disease (AD), diagnosis and classification are now based on the underlying biological characteristics, and not solely on a clinical syndrome(s) [1]. AD exists as a continuum beginning with the appearance of brain pathology in presymptomatic patients and progresses in stages of increasing pathologic burden and worsening clinical symptoms. Amyloid-β (Aβ) plaques and tau tangles are the pathological hallmarks of AD and are typically measured by evaluation of cerebrospinal fluid (CSF) or amyloid PET. However, these methods are invasive, high cost, and have limited availability/scalability. The emergence of new technology to reliably measure blood-based biomarkers of AD holds potential to provide accurate diagnosis, efficiently select clinical trial participants, and monitor disease progression in scalable and low-burden tests [1, 2].
Phosphorylated tau (pTau) protein species are novel blood-based biomarkers with high diagnostic accuracy, disease sensitivity, and correlation with pathologically proven AD and the rate of future cognitive decline [3]. pTau181 distinguishes AD from cognitively unimpaired older adults (area under the curve [AUC] = 90.21%–98.24%), and other neurodegenerative diseases (AUC = 81.90%–100%) [4]. Evidence suggests plasma pTau181 is a useful tool in the staging of AD along the continuum of the disease [2]. However, prospective longitudinal studies are lacking and further examination of the relationship between plasma pTau181 concentration and clinical progression is warranted.
The recent FDA approval of the first anti-amyloid agents with potential disease-modifying benefits [5, 6] is a significant development in the treatment of AD. These therapies have modest clinical effects, and the disease continues to progress even though they have been shown to quantitatively remove amyloid [7]. Therefore, there remains a significant unmet need for additional pro-cognitive and disease-modifying therapeutics, ideally those targeting other non-amyloid pathophysiological pathways in AD.
Xanamem is a small-molecule selective inhibitor of 11-beta-Hydroxysteroid Dehydrogenase Type 1 (11β-HSD1; [8, 9])—the enzyme responsible for the reduction of inactive cortisone to active cortisol in the brain, liver, and adipose tissue, where it is highly expressed [8, 10, 11]. Xanamem displays high potency and selectivity for human 11β-HSD1. It is brain-penetrant and has an acceptable safety profile for use in elderly patients [8, 9]. Chronically elevated cortisol is a risk factor for AD [10, 12, 13], and is associated with aging (≥65 years) [14–16]. Corticosteroid administration has been shown to be associated with brain toxicity including hippocampal atrophy [17]. Clinically meaningful improvements in cognitive performance in an attentional composite (including working memory) of a Cogstate neuropsychological test battery (NTB) were seen at doses of 5, 10, and 20 mg Xanamem for 6 to 12 weeks in older, cognitively normal volunteers in 2 Phase 1 studies (Actinogen Medical, data on file).
The XanADu Phase 2 clinical trial evaluated the safety, and potential clinical and pro-cognitive effects of Xanamem in patients with mild dementia due to probable AD but failed to meet its primary and secondary endpoints. In this trial, the diagnosis of probable AD and subsequent enrollment was based on a clinical AD diagnosis alone. As has been shown [18], relying on a clinical diagnosis of AD is inexact and almost certainly led to significant heterogeneity in the trial population, as amyloid PET scans were not used as an inclusion criterion.
Retrospective classification of XanADu trial participants using elevated plasma pTau181 was intended to identify patients with pathologic AD and potentially enrich further for those more likely to have progressive disease.
The objective of this biomarker extension trial was to explore the natural history of clinically diagnosed AD patients with high pTau181 and the efficacy of Xanamem in these patients.
METHODS
Trial design
XanADu was a Phase 2a, multi-center, randomized, double-blind, placebo-controlled trial. Participants who provided written informed consent and met all eligibility criteria at screening were randomized in a 1 : 1 ratio during a baseline visit (Week 0) to receive either 10 mg Xanamem or matching placebo orally in the morning for 12 weeks. A dose level of 10 mg has been shown to have 60% to 80% occupancy of human brain 11β-HSD1 enzyme measured by PET imaging in various brain regions, and is considered adequate for full central nervous system effect [19].
A total of 185 males and females aged 50 years or older with a clinical diagnosis of mild dementia due to probable AD with increased level of clinical diagnostic certainty as defined by the National Institute of Aging-Alzheimer’s Association workgroups [20] were enrolled in the trial. Eligible participants had Mini-Mental State Examination (MMSE) scores of 20 to 26 (inclusive), 0.5 to 1.0 Clinical Dementia Rating (CDR) Global Score, and had an MRI or CT scan in the prior 12 months that was consistent with AD. See the clinicaltrials.gov listing (NCT02727699) for the trial protocol and complete results.
The XanADu biomarker trial analyzed a selection of AD biomarkers from stored plasma samples of participants who were enrolled into the original XanADu trial. All participants who were randomized to either Xanamem or placebo (or their legally authorized representative), and had appropriately stored samples (–80°C) from participating XanADu trial sites, were contacted and asked to consent to analysis of their existing stored pharmacokinetic (PK) samples for the additional biomarker analyses. All samples from baseline (before treatment) and Week 12, where available, were analyzed. Except for the provision of written informed consent to have their PK samples analyzed, no further involvement was required from the participants.
The objectives of the 12-week biomarker trial were to: 1) observe the natural history of disease progression in low (L; pTau181≤6.74 pg/mL) and high (H; pTau181 > 6.74 pg/mL) pTau181 groups over 12 weeks; 2) analyze the efficacy of Xanamem in the H pTau181 subgroup; and if possible, 3) examine the correlation of Xanamem efficacy with changes in plasma biomarker levels.
Plasma biomarker assays
Biomarkers included in the trial were pTau181, Aβ1–42, Aβ1–40, neurofilament light (NfL), and Glial fibrillary acidic protein (GFAP). Plasma Aβ1–42 and Aβ1–40 were measured using Euroimmune enzyme-linked immunosorbent assays (ELISA). Plasma pTau181, NfL, and GFAP were measured with the Simoa HD-X automated immunoassay analyzer (Quanterix, Billerica, MA, USA). In cases where samples had insufficient volume to analyze all analytes, the following order of priority was used: pTau181, Aβ1–42, Aβ1–40, GFAP, and NfL. All plasma biomarker assays were conducted at the Clinical Neurochemistry Laboratory, University of Gothenburg, Mölndal, Sweden and analytical laboratory personnel were blinded to treatment assignment.
Cognitive and clinical outcomes
The prespecified efficacy endpoints assessed in this trial were evaluated by the extent to which Xanamem improved performance from baseline to end of treatment (Week 12) compared to placebo. Efficacy variables assessed in the original XanADu trial included four clinical scales: AD Assessment Scales – Cognitive subscale version 14 (ADAS-Cog v14), AD COMposite Scores (ADCOMS; comprising weighted composite data derived from the ADAS-Cog v14, CDR-Sum of Boxes [SB], and MMSE [21]), CDR-SB, and MMSE. Other endpoints were the Rey Auditory Verbal Learning Test (RAVLT), Neuropsychiatric Inventory (NPI), NTB – Executive Domain (NTB-exec), and ADAS-Cog167 (a composite of ADAS-Cog items 1 [word recall], 6 [orientation], and 7 [word recognition]). The ADAS-Cog167 was included based on the observation that these subtests may be more sensitive to change in early AD [22].
Statistical methodology
Statistical analyses were performed using SAS version 9.4. This trial used a new protocol and a prespecified, prospective statistical analysis plan that was finalized prior to unblinding of biomarker results. The biomarker variables were analyzed in a descriptive manner and an efficacy comparison for each of the 8 endpoints was performed between the Xanamem and placebo for patients in the H pTau181 group. Any biomarker assay results with values less than or equal to the lower limit of quantitation were analyzed at the lower limit. For the efficacy analyses, the differences in change from baseline to Week 12 between treatment groups was assessed using analysis of covariance (ANCOVA). The ANCOVA model included change from baseline to Week 12 as the endpoint, the baseline value as a covariate, and treatment group as a factor. The analysis was designed to evaluate the benefit of Xanamem treatment and defined a potentially clinically meaningful improvement with a Cohen’s d (d) statistic≥0.2 (difference in mean change from baseline between treatment groups divided by the pooled standard deviation at baseline). Given the sample size, insufficient statistical power was expected for formal statistical hypothesis testing at a 0.05 level. There was no correction for multiple comparisons in this exploratory trial. Each of the 5 plasma biomarker analytes were summarized by treatment and baseline biomarker characteristic. The prespecified subgroup for efficacy analyses was pTau181 > pooled baseline median (H group, 6.74 pg/mL). Exploratory analyses were conducted with pTau181 > 10.2 pg/mL (VH group, published pTau181 cut-off for progressive disease [23]), Aβ42/Aβ40 < pooled baseline median (0.188 Units) and MMSE severity (20–23) for comparison. As this was a small dataset with the potential for skewed data, pooled baseline medians were used. To control for varying endpoint scoring properties and compare clinical progression across different endpoints, individual participant responses at baseline and Week 12 were z-transformed using the pooled baseline means and standard deviations (SD). The directionality of scores was reversed for the ADAS-Cog, ADCOMS, CDR-SB, NPI, and ADAS-Cog167, such that higher scores indicate better performance.
The z-score change from baseline was computed for each endpoint and analyzed by the ANCOVA model.
In addition to assessing effects of Xanamem on the prespecified outcomes, effects were examined post-hoc on a cognitive composite (CC) and an integrated cognitive-functional composite (CFC), which are validated composites proposed by Jutten and colleagues [24]. The CC comprised of standardized change from baseline scores of three ADAS-Cog subscales: the Word Recognition, Word Recall, and Orientation, the Controlled Oral Word Association Test (COWAT), and the category fluency test (CFT). For the integrated CFC, the standardized CDR-SB change from baseline was combined with the CC with equal weighting.
RESULTS
Disposition and demographics
A total of 72 participants (age = 70.6 years±8.3, 54.2% female) consented to participate in the trial, with 37 in the Xanamem group and 35 in the placebo group. A total of 45 participants (63.2%) were receiving an FDA-approved symptomatic therapy for AD. Baseline characteristics are summarized by treatment groups by baseline pTau181 median categorization (Table 1). Baseline characteristics were generally similar across treatment groups. There were slight differences in baseline clinical and biomarker characteristics between pTau181 categories with the H group having characteristics consistent with slightly more severe disease.
Table 1
Baseline demographics and clinical characteristics summarized by treatment groups by baseline pTau181 median categorization
| Characteristic | Xanamem | Placebo | All (n = 72*) | ||
| High pTau181 | Low pTau181 | High pTau181 | Low pTau181 | ||
| (n = 16) | (n = 18) | (n = 18) | (n = 16) | ||
| Age – mean (SD) | 71.4 (8.02) | 68.8 (9.18) | 71.4 (8.40) | 70.3 (7.45) | 70.6 (8.34) |
| Sex – No. (%) | |||||
| Male | 8 (50.0) | 11 (61.1) | 8 (44.4) | 5 (31.3) | 33 (45.8) |
| Female | 8 (50.0) | 7 (38.9) | 10 (55.6) | 11 (68.8) | 39 (54.2) |
| Race – No. (%) | |||||
| Asian | 0 | 0 | 1 (5.6) | 0 | 1 (1.4) |
| Black or African American | 1 (6.3) | 2 (11.1) | 1 (5.6) | 2 (12.5) | 6 (8.3) |
| White | 15 (93.8) | 16 (88.9) | 16 (88.9) | 13 (81.3) | 64 (88.9) |
| Other | 0 | 0 | 0 | 1 (6.3) | 1 (1.4) |
| Symptomatic Alzheimer’s Disease medication use – No. (%) | 10 (62.5) | 10 (55.6) | 14 (77.8) | 9 (56.3) | 45 (62.5) |
| MMSE score | |||||
| Mean (SD) | 22.3 (2.82) | 22.6 (3.33) | 22.7 (2.37) | 22.6 (3.03) | 22.4 (2.95) |
| Range | 16 to 26 | 14 to 27 | 19 to 27 | 17 to 28 | 14 to 28 |
| CDR-SB score | |||||
| Mean (SD) | 4.13 (1.232) | 3.58 (1.166) | 3.58 (1.611) | 3.53 (1.893) | 3.87 (1.61) |
| Range | 2.5 to 6.5 | 1.5 to 6.5 | 1.5 to 8.0 | 1.0 to 7.0 | 1.0 to 8.0 |
| ADAS-Cog | |||||
| Mean (SD) | 34.3 (4.92) | 30.4 (9.73) | 32.2 (7.65) | 32.2 (8.26) | 32.5 (7.76) |
| Range | 27 to 43 | 20 to 53 | 19 to 45 | 16 to 43 | 16 to 53 |
| ADCOMS | |||||
| Mean (SD) | 0.559 (0.125) | 0.465 (0.158) | 0.522 (0.193) | 0.483 (0.243) | 0.524 (0.195) |
| Range | 0.403 to 0.894 | 0.252 to 0.855 | 0.229 to 0.943 | 0.108 to 0.929 | 0.108 to 0.943 |
| NPI | |||||
| Mean (SD) | 7.5 (10.69) | 3.8 (5.82) | 8.1 (10.34) | 4.6 (9.24) | 6.4 (9.71) |
| Range | 0 to 41 | 0 to 19 | 0 to 30 | 0 to 36 | 0 to 41 |
| NTB – Executive domain | |||||
| Mean (SD) | 49.1 (12.40) | 57.3 (15.71) | 52.8 (14.21) | 55.2 (20.45) | 53.5 (15.52) |
| Range | 25 to 70 | 30 to 86 | 31 to 79 | 24 to 85 | 24 to 86 |
| Plasma biomarker concentrations – mean (SD) [n]† | |||||
| Aβ1 - 40 pg/mL | 146.13 (26.62) [15] | 117.19 (60.29) [14] | 134.36 (34.50) [15] | 128.92 (39.25) [12] | 130.61 (45.60) |
| Aβ1 - 42 pg/mL | 27.01 (3.77) [15] | 24.94 (9.54) [14] | 24.67 (5.79) [15] | 23.98 (6.70) [12] | 24.97 (6.71) |
| Aβ42/40 ratio | 0.188 (0.029) [15] | 0.247 (0.102) [14] | 0.187 (0.029) [15] | 0.190 (0.031) [12] | 0.219 (0.155) |
| pTau181 pg/mL | 9.32 (2.56) [16] | 4.71 (1.37) [18] | 11.90 (11.64) [18] | 4.67 (1.11) [16] | 7.69 (6.82) |
| GFAP pg/mL | 132.26 (77.42) [12] | 67.39 (26.41) [10] | 136.26 (95.41) [12] | 131.78 (43.00) [8] | 117.86 (73.06) |
| NfL pg/mL | 19.65 (5.94) [8] | 13.64 (8.15) [6] | 29.95 (12.05) [6] | 14.33 (3.76) [7] | 19.22 (9.68) |
*4 missing values due to unanalyzable pTau181. †n for individual analytes by treatment and pTau181 categorization (high pTau181 > 6.74 pg/mL, low pTau181≤6.74 pg/mL). Aβ, amyloid-beta; ADAS-Cog, Alzheimer’s Disease Assessment Scales – Cognitive subscale; ADCOMS, Alzheimer’s Disease COMposite Score; CDR-SB, Clinical Dementia Rating Scale Sum of Boxes; GFAP, Glial fibrillary acidic protein; MMSE, Mini-Mental Status Examination; NfL, neurofilament light chain; No., number; NPI, Neuropsychiatric Inventory; NTB, Neuropsychological Test Battery; pTau, phosphorylated tau; SD, standard deviation.
Elevated plasma pTau181 predicts clinical progression
Standardized change from baselines scores were compared in the H pTau181 subgroup and L pTau181 subgroup (Fig. 1). In the H pTau181 placebo group, participants exhibited significant clinical worsening over 12 weeks compared to the L pTau181 subgroup on the CDR-SB and the ADCOMS with a z-score least squares (LS) mean difference of –0.76 Units (95% CI –1.15 to –0.37 Units, d = 0.63, p < 0.001) and –0.71 Units (95% CI –1.10 to –0.32 Units, d = 0.55, p < 0.001), respectively. There also was potential clinical worsening on the MMSE and ADAS-Cog in the H pTau181 subgroup compared to L pTau181 with z-score LS mean differences of –0.51 Units (95% CI –1.17 to 0.14 Units, d = 0.52, p = 0.12) and –0.42 Units (95% CI –1.10 to 0.22 Units, d = 0.53, p = 0.19), respectively.
Fig. 1
Elevated plasma pTau181 (> median of 6.7 pg/mL) predicts clinical progression over 12 weeks in the placebo group ( n = 34). Standardized change from baseline scores (Least Squares mean ± Standard Error) were compared in the pTau181 > pooled baseline median subgroup (“H”, 6.74 pg/mL) and the pTau181≤pooled baseline median subgroup (“L”) on the a) Clinical Dementia Rating Scale – Sum of Boxes (Cohen’s d [d] = 0.63, ***p < 0.001), b) Mini Mental Status Examination (d = 0.52, p = 0.12), c) AD Assessment Scales – Cognitive subscale version 14 (d = 0.53, p = 0.19), and d) AD COMposite Score (d = 0.55, ***p < 0.001).
![Elevated plasma pTau181 (> median of 6.7 pg/mL) predicts clinical progression over 12 weeks in the placebo group ( n = 34). Standardized change from baseline scores (Least Squares mean ± Standard Error) were compared in the pTau181 > pooled baseline median subgroup (“H”, 6.74 pg/mL) and the pTau181≤pooled baseline median subgroup (“L”) on the a) Clinical Dementia Rating Scale – Sum of Boxes (Cohen’s d [d] = 0.63, ***p < 0.001), b) Mini Mental Status Examination (d = 0.52, p = 0.12), c) AD Assessment Scales – Cognitive subscale version 14 (d = 0.53, p = 0.19), and d) AD COMposite Score (d = 0.55, ***p < 0.001).](https://content.iospress.com:443/media/jad/2024/100-1/jad-100-1-jad231456/jad-100-jad231456-g001.jpg)
There was no observed correlation of other baseline characteristics including low Aβ42/Aβ40 or lower MMSE with clinical decline over 12 weeks.
Xanamem exhibits a pattern of clinical benefit in the high pTau181 subgroup
In the H pTau181 subgroup, Xanamem displayed clinical benefit on the CDR-SB of LS mean difference of 0.62 points (95% CI: –1.32 to 0.09, d = –0.41, p = 0.09) and potentially on the NTB-exec with a LS mean difference of 2.75 points (95% CI: –4.98 to 10.48 points, d = 0.26, p = 0.48) compared to placebo (Table 2 and Fig. 2). While there were no clinically meaningful treatment differences observed in other efficacy endpoints, most moved in the direction favoring Xanamem (range of d –0.13 to 0.18) (Fig. 2).
Table 2
Cognitive and clinical efficacy outcomes for Xanamem versus placebo at Week 12 in the pTau181 > median subgroup (> 6.74 pg/mL)
| Endpoint | High pTau181 | ||
| Xanamem (n = 16) | Placebo (n = 18) | Desired directional change | |
| Change from baseline to Week 12 in the ADAS-Cog14 | |||
| LS mean change (SE) | 1.46 (1.429) | 0.80 (1.330) | ↓ |
| Mean difference versus placebo (95% CI) | 0.66 (–3.24, 4.55) | ||
| Cohen’s d for difference | 0.00 | ||
| p-value for difference | 0.74 | ||
| Change from baseline to Week 12 in the ADCOMS | |||
| LS mean change (SE) | 0.07 (0.027) | 0.09 (0.025) | ↓ |
| Mean difference versus placebo (95% CI) | –0.02 (–0.09, 0.05) | ||
| Cohen’s d | –0.13 | ||
| p-value for difference | 0.573 | ||
| Change from baseline to Week 12 in the CDR-SB score | |||
| LS mean change (SE) | 0.36 (0.257) | 0.98 (0.240) | ↓ |
| Mean difference versus placebo (95% CI) | –0.62 (–1.32, 0.09) | ||
| Cohen’s d | –0.41 | ||
| p-value for difference | 0.085 | ||
| Change from baseline to Week 12 in the MMSE score | |||
| LS mean change (SE) | –0.91 (0.705) | –1.16 (0.664) | ↑ |
| Mean difference versus placebo (95% CI) | 0.25 (–1.69, 2.19) | ||
| Cohen’s d | 0.16 | ||
| p-value for difference | 0.80 | ||
| Change from baseline to Week 12 in the RAVLT | |||
| LS mean change (SE) | 0.71 (1.665) | 0.45 (1.587) | ↑ |
| Mean difference versus placebo (95% CI) | 0.25 (–4.28, 4.79) | ||
| Cohen’s d | 0.02 | ||
| p-value for difference | 0.91 | ||
| Change from baseline to Week 12 in the NPI | |||
| LS mean change (SE) | 1.26 (1.551) | –0.47 (1.468) | ↓ |
| Mean difference versus placebo (95% CI) | 1.73 (-2.52, 5.98) | ||
| Cohen’s d | 0.18 | ||
| p-value for difference | 0.42 | ||
| Change from baseline to Week 12 in the NTB score | |||
| LS mean change (SE) | 0.48 (2.834) | –2.27 (2.646) | ↑ |
| Mean difference versus placebo (95% CI) | 2.75 (–4.98, 10.48) | ||
| Cohen’s d | 0.26 | ||
| p-value for difference | 0.48 | ||
| Change from baseline to Week 12 in the ADAS-Cog14 167 | |||
| LS mean change (SE) | 1.02 (0.820) | 0.92 (0.762) | ↓ |
| Mean difference versus placebo (95% CI) | 0.10 (–2.12, 2.32) | ||
| Cohen’s d | –0.06 | ||
| p-value for difference | 0.93 | ||
ADAS-Cog, Alzheimer’s Disease Assessment Scales – Cognitive subscale; ADCOMS, Alzheimer’s Disease COMposite Score; CDR-SB, Clinical Dementia Rating Scale – Sum of Boxes; CI, Confidence interval; LS, Least squares; MMSE, Mini-Mental Status Examination; NPI, Neuropsychiatric Inventory; NTB, Neuropsychological Test Battery; RAVLT, Rey Auditory Verbal Learning Test; pTau, phosphorylated tau; SE, standard error.
Fig. 2
Xanamem versus placebo Z-score change from baseline score in the pTau181 > median (“H”) subgroup for all pre specified clinical endpoints. Z-score change from baseline to Week 12 scores (Least Squares mean ± Standard Error) on the Mini-Mental Status Examination (MMSE), AD Assessment Scales – Cognitive subscale (ADAS-Cog), Clinical Dementia Rating Scale – Sum of Boxes (CDR-SB), AD COMposite Score (ADCOMS), Rey Auditory Verbal Learning Test (RAVLT), Neuropsychiatric Inventory (NPI), Neuropsychological Test Battery (NTB), and ADAS-Cog167 (composite of ADAS-Cog items 1, 6, and 7).
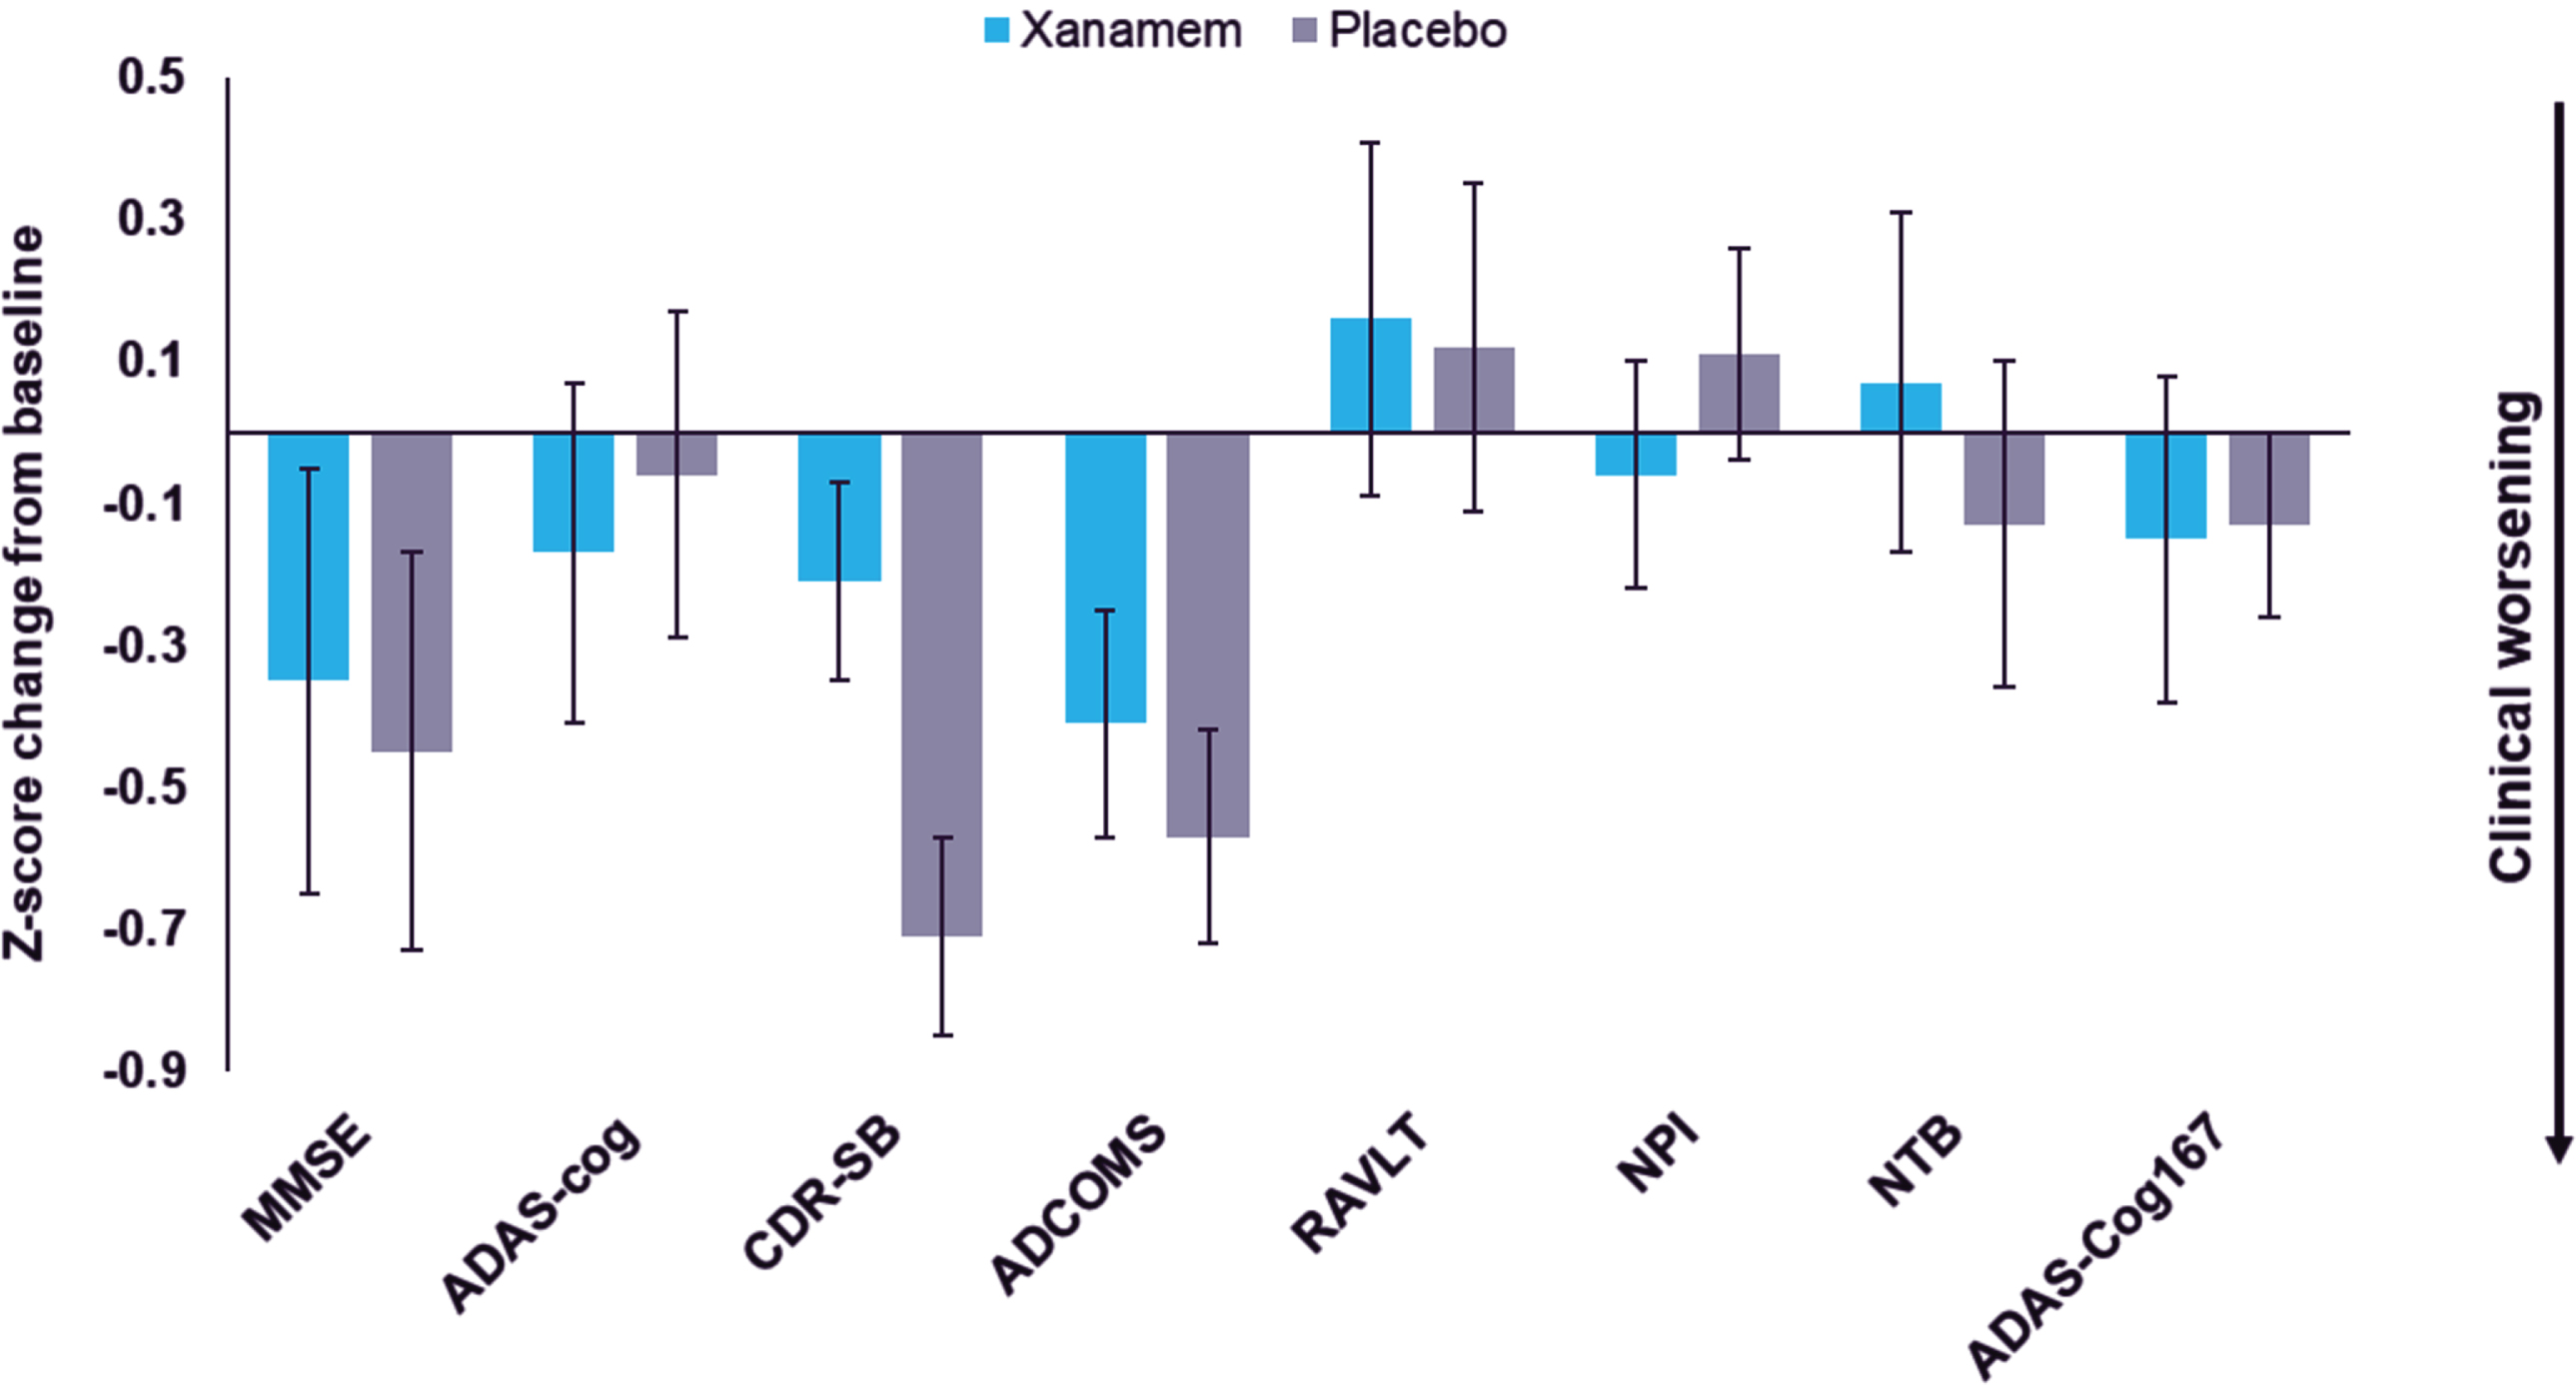
In the VH pTau181 subgroup (n = 9), a similar effect was observed on the CDR-SB with Xanamem potentially displaying clinical benefit compared to placebo (LS mean difference: 0.78, 95% CI: –2.18 to 0.75, d = 0.6, p = 0.33; data not shown).
In the Aβ42/Aβ40≤median and lower MMSE subgroups there were no consistent patterns of treatment effect.
There were no observed differences in change from baseline in plasma biomarkers between Xanamem and placebo. It was noted that the baseline plasma concentrations of pTau181 and Aβ42/Aβ40 were relatively low for a mild AD cohort compared to other cohorts that have confirmation of AD with amyloid PET [25], suggesting the original trial’s population may have included a substantial number of participants with non-AD-type dementia.
Exploratory analysis of Xanamem efficacy on a cognitive-functional composite
In the H pTau181 subgroup Xanamem tended to potentially preserve cognitive function on the CC compared to placebo over 12 weeks. The LS mean change from baseline standardized composite z-score was –0.03 units for Xanamem treatment, compared to –0.15 units for placebo (LS mean difference: 0.122, 95% CI: –0.18 to 0.43 units, d = 0.20, p = 0.42; Fig. 3a).
Fig. 3
Xanamem versus placebo Z-score change from baseline score in the pTau181 > median (“H”) subgroup for exploratory Cognitive and Cognitive-Functional composites. a) Z-score change from baseline scores (Least Squares [LS] mean+/– Standard Error [SE]) on a Cognitive Composite (CC) comprising selected tests from the AD Assessment Scales – Cognitive subscale ([ADAS-Cog] Word Recall, Word Recognition, and Orientation), the Category Fluency Test (CFT), and the Controlled Oral Word Association Test (COWAT; Cohen’s d [d] = 0.2). b) Z-score change from baseline scores (LS mean+/-SE) on the integrated Cognitive-Functional Composite (CFC) comprising the z-score Clinical Dementia Rating Scale – Sum of Boxes (CDR-SB) combined with the CC with equal weighting. (d = 0.38). **p = 0.01.
![Xanamem versus placebo Z-score change from baseline score in the pTau181 > median (“H”) subgroup for exploratory Cognitive and Cognitive-Functional composites. a) Z-score change from baseline scores (Least Squares [LS] mean+/– Standard Error [SE]) on a Cognitive Composite (CC) comprising selected tests from the AD Assessment Scales – Cognitive subscale ([ADAS-Cog] Word Recall, Word Recognition, and Orientation), the Category Fluency Test (CFT), and the Controlled Oral Word Association Test (COWAT; Cohen’s d [d] = 0.2). b) Z-score change from baseline scores (LS mean+/-SE) on the integrated Cognitive-Functional Composite (CFC) comprising the z-score Clinical Dementia Rating Scale – Sum of Boxes (CDR-SB) combined with the CC with equal weighting. (d = 0.38). **p = 0.01.](https://content.iospress.com:443/media/jad/2024/100-1/jad-100-1-jad231456/jad-100-jad231456-g003.jpg)
In the H pTau181 subgroup, the integrated CFC LS mean change from baseline was –0.10 units in those treated with Xanamem compared to –0.45 units treated with placebo (LS mean difference: 0.34 units, 95% CI: 0.08 to 0.60 units, d = 0.38, p = 0.01; Fig. 3b).
Safety and tolerability of Xanamem
The incidence of treatment-emergent adverse events (TEAEs) was 83.8% (31/37) in the Xanamem group and 57.1% (20/35) in the placebo group. The incidence of TEAEs assessed as related to trial treatment was 13.5% in the Xanamem group and 22.9% in the placebo group. The majority of TEAEs were mild to moderate in severity. The types and incidence of TEAEs experienced were similar for the two treatment groups (Table 3). The most commonly observed TEAEs were diarrhea (8.1% Xanamem, 8.6% placebo), headache (10.8% Xanamem, 5.7% placebo), arthralgia (8.1% Xanamem, 5.7% placebo), fall (5.4% Xanamem, 8.6% placebo), back pain (8.1% Xanamem, 2.8% placebo), and nerve conduction abnormal (2.7% Xanamem, 8.6% placebo).
Table 3
Summary of adverse events (AEs) by treatment group
| Event | Xanamem (n = 37) | Placebo (n = 35) | All (n = 72) |
| Overview of AEs – No. (%) | |||
| Treatment-emergent AEs (TEAEs) | 31 (83.8) | 20 (57.1) | 51 (70.8) |
| Serious TEAEs | 1 (2.7) | 2 (5.7) | 3 (4.2) |
| Severe TEAEs | 1 (2.7) | 1 (2.8) | 2 (2.8) |
| Drug-related TEAEs | 5 (13.5) | 8 (22.9) | 13 (18.1) |
| AEs of special interest (AESI) | 1 (2.7) | 2 (5.7) | 3 (4.2) |
| Treatment discontinuations due to AEs | 0 | 0 | 0 |
| Trial discontinuations due to AEs | 0 | 0 | 0 |
| Participants with≥1 TEAE | 22 (59.5) | 12 (34.3) | 34 (47.2) |
| TEAEs by preferred term ≥ 5% incidence, No. (%) | |||
| Diarrhea | 3 (8.1) | 3 (8.6) | 6 (8.3) |
| Headache | 4 (10.8) | 2 (5.7) | 6 (8.3) |
| Arthralgia | 3 (8.1) | 2 (5.7) | 5 (6.9) |
| Fall | 2 (5.4) | 3 (8.6) | 5 (6.9) |
| Back Pain | 3 (8.1) | 1 (2.8) | 4 (5.6) |
| Nerve conduction abnormal | 1 (2.7) | 3 (8.6) | 4 (5.6) |
| Depression | 0 | 3 (8.6) | 3 (4.2) |
| Dizziness | 2 (5.4) | 1 (2.8) | 3 (4.2) |
| Musculoskeletal pain | 1 (2.7) | 2 (5.7) | 3 (4.2) |
| Orthostatic hypotension | 1 (2.7) | 2 (5.7) | 3 (4.2) |
| Paresthesia | 2 (5.4) | 1 (2.8) | 3 (4.2) |
| Urinary tract infection | 1 (2.7) | 2 (5.7) | 3 (4.2) |
| Upper Respiratory tract infection | 3 (8.1) | 0 | 3 (4.2) |
| Vomiting | 1 (2.7) | 2 (5.7) | 3 (4.2) |
| Anemia | 2 (5.4) | 0 | 2 (2.8) |
| Balance disorder | 2 (5.4) | 0 | 2 (2.8) |
| Decreased appetite | 2 (5.4) | 0 | 2 (2.8) |
| Fatigue | 2 (5.4) | 0 | 2 (2.8) |
| Nausea | 0 | 2 (5.7) | 2 (2.8) |
Three (3) serious AEs (SAEs) were reported (1/37 [2.7%] in the Xanamem group, vibration test abnormal, and 2/35 [5.7%] in the placebo group, myocardial infarction, and transient ischemic attack), as summarized in Table 3. There were no withdrawals due to SAEs in either treatment group. None of the SAEs were related to trial treatment or trial procedure. The incidence and severity of AEs in the biomarker extension trial were similar to the main Phase 2 clinical trial (NCT02727699).
DISCUSSION
In this trial H pTau181 was associated with clinical progression over 12 weeks, but lower MMSE score or lower Aβ42/Aβ40 ratio were not. This association was observed for commonly used clinical endpoints in AD clinical trials including ADCOMS, CDR-SB, ADAS-Cog, and MMSE. To the authors’ knowledge, these longitudinal data are the first to describe the natural history of a mild AD population with elevated pTau181. These findings suggest plasma pTau181 may be suitable as a patient enrichment strategy to identify individuals with clinically diagnosed mild AD to both confirm underlying AD pathology and select for those that are more likely to progress during the trial observation period.
Blood-based biomarkers of AD are emerging as valuable tools for the evaluation of AD. Plasma pTau concentrations are highly specific to underlying amyloid pathology and correlate with cognitive impairment as well as brain atrophy [26–28]. While this is also true for the Aβ42/Aβ40 ratio, there are significant sensitivity to change limitations in plasma that may make it unsuitable for use to as a patient selection criterion or to monitor progression [29, 30]. For this reason, plasma pTau species may be more useful. The clear difference in clinical progression of the H pTau181 group compared to L pTau in the XanADu biomarker trial suggests pTau181 may be a good candidate biomarker for the purpose of enhancing diagnostic specificity and trial power.
In the context of other contemporary AD trials, the H pTau181 placebo group decline of 0.98 points on the CDR-SB observed was quite pronounced. The Clarity Phase 3 trial of lecanemab enrolled milder participants with mild cognitive impairment (MCI) or mild AD confirmed by amyloid PET scan or CSF analyses [31]. Over the 18-month treatment period, the placebo group had a 1.66-point decline on the CDR-SB. TRAILBLAZER-ALZ 2 was an 18-month, Phase 3 trial of donanemab in a similar MCI/mild AD population. In those participants with low/medium tau (defined by visual inspection of Tau-PET), the placebo decline over 18 months was 1.84 CDR-SB points [32], whereas in high tau patients it was 80% higher at 3.3 CDR-SB points. Thus, the findings observed in this trial for H pTau patients are likely to be explained by both more advanced tau pathology and more advanced AD disease in general. Importantly, all these data support the use of pTau181 to select participants for clinical trials.
The pattern of potential clinical benefits of Xanamem observed in the high pTau181 group demonstrates the potential utility of targeting 11β-HSD1 for the treatment of AD (Figs. 2 and 3). Chronically elevated cortisol levels and dysregulation of the hypothalamic-pituitary-adrenal (HPA) axis have been associated with an increased risk of dementia and AD [33, 14]. Cortisol levels are regulated by the HPA axis, which responds to physical and environmental stress by increasing cortisol levels in the blood. In humans, 11β-HSD1 is highly expressed in brain regions associated with cognition and memory, including the hippocampus, frontal cortex, and cerebellum [10, 11, 13]. Evidence from studies in both rodents and humans demonstrates that 11β-HSD1 overexpression may be associated with cognitive decline, and that regulation of cortisol levels via inhibition of 11β-HSD1 may provide a disease-modifying therapeutic strategy for treating AD [10, 11, 34–36].
The cognitive and functional endpoints commonly used in clinical trials may lack adequate sensitivity to change over time in mild AD [37]. Indeed, the FDA have indicated that AD trials should use sensitive neuropsychological measures that have high internal and external validity [38]. This has led to the development of novel composite measures that utilize the most sensitive and reliable subtests from well used cognitive and functional AD assessments, such as the CC and CFC used by Jutten and colleagues [24]. Indeed in this trial, both the CC and CFC were shown to be sensitive to the potential treatment effects of Xanamem in a mild AD population (Fig. 3).
There are some limitations of this trial. First, the biomarker trial had a relatively small sample size. Second, the observation period of 12 weeks is short compared to contemporary AD trials. Third, although this was a prespecified and double-blind trial, participants were not re-randomized for the analysis. Fourth, the original XanADu trial did not examine the presence of amyloid in the brain by PET or CSF and so other methods to validate a pTau181 cutoff internally in this trial were not available. Therefore, the median pTau181 concentration was pre-specified to define the H and L pTau181 groups. However, this pTau181 level was also justified by other data including: 1) the sensitivity analysis performed which showed similar results with a ‘very high’ pTau181 at baseline subgroup that used a published cut-off of >10.2 pg/mL [23], and 2) a previous Actinogen analysis of pTau181 in cognitively normal, older volunteers prior to treatment which found a mean±SD of 3.4±1.3 pg/mL with the same assay, suggesting a cutoff for “normal”, based on mean + 2SD, of around 6 pg/mL (Actinogen data on file). Finally, while the observations of the exploratory CC and CFC support that Xanamem holds potential as a cognitive enhancing agent in patients with AD, these analyses were conducted post hoc. Notwithstanding these limitations, these data serve as a simulation for a future, larger trial of longer duration whereby elevated plasma pTau181 will be used to enrich the population for progressive AD and in which the most sensitive clinical endpoints will be utilized (NCT06125951).
Taken together, these results suggest elevated plasma pTau181 may have utility for patient enrichment in future AD trials of patients with mild AD. Enrichment in this way may reduce sample size, cost, and duration of clinical trials. Xanamem showed evidence of potentially clinically meaningful benefits in these patients that will be further explored.
AUTHOR CONTRIBUTIONS
Jack Taylor (Conceptualization; Data curation; Visualization; Writing – original draft); Mark Jaros (Formal analysis; Software; Validation; Writing – review & editing); John Harrison (Conceptualization; Methodology; Writing – review & editing); Christopher Chen (Conceptualization; Writing – review & editing); Dana Hilt (Conceptualization; Supervision; Writing – review & editing).
ACKNOWLEDGMENTS
The authors would like to acknowledge Kaj Blennow, Henrik Zetterberg, and the Clinical Neurochemistry Laboratory, University of Gothenburg, Mölndal, Sweden for their expertise and guidance in the selection of the plasma biomarker panel. Lee Bergman, Actinogen Medical Ltd, provided editorial assistance.
FUNDING
The XanADu biomarker trial was funded by Actinogen Medical.
CONFLICT OF INTEREST
Dr. Taylor and Dr. Hilt report they are employees of Actinogen Medical Limited.
Dr. Harrison reports personal fees from AbbVie, Actinogen Medical Limited, Alto Pharma, AlzeCure, ADvantage, Astra Zeneca, Athira Therapeutics, Bial Biotech, Biogen Idec, Boehringer Ingelheim, Brands2life, Cerecin, Cognition Therapeutics, Compass Pathways, Corlieve, Curasen, EIP Pharma, EQT Life, GfHEU, Heptares, ImPACT, Lundbeck, Lysosome Therapeutics, Neurotrack, the NHS, Novartis, Novo Nordisk, Nutricia, Prothena, Recognify, reMYND, Roche, Shionogi, Signant, Stoke Therapeutics, Syndesi Therapeutics, Takeda, Vivoryon Therapeutics and Winterlight Labs. Additionally, he holds stock options in Neurotrack Inc. and is a joint holder of patents with My Cognition Ltd. Outside the submitted work, Dr Harrison is a full-time employee of Scottish Brain Sciences.
Dr. Jaros reports personal fees from Actinogen Medical Limited, during the conduct of the trial; and is a full-time employee of Summit Analytical, outside the submitted work.
Dr. Chen reports personal fees from Actinogen Medical Limited, Eisai, Cerecin, and research grant funding from National Medical Research Council of Singapore, outside the submitted work.
DATA AVAILABILITY
The data supporting the findings of this trial are available on request from the corresponding author. The data are not publicly available due to privacy or ethical restrictions.
REFERENCES
[1] | Alzheimer’s Association International Conference ((2023) ) The National Institute on Aging and the Alzheimer’s Association (NIA-AA) Revised Criteria: A Biological Definition of Alzheimer’s Disease. https://aaic.alz.org/nia-aa.asp |
[2] | Karikari TK , Benedet AL , Ashton NJ , Lantero Rodriguez J , Snellman A , Suárez-Calvet M , Saha-Chaudhuri P , Lussier F , Kvartsberg H , Rial AM , Pascoal TA , Andreasson U , Schöll M , Weiner MW , Rosa-Neto P , Trojanowski JQ , Shaw LM , Blennow K , Zetterberg H ((2021) ) Diagnostic performance and prediction of clinical progression of plasma phospho-tau181 in the Alzheimer’s Disease Neuroimaging Initiative. Mol Psychiatry 26: , 429–442. |
[3] | Karikari TK , Pascoal TA , Ashton NJ , Janelidze S , Benedet AL , Rodriguez JL , Chamoun M , Savard M , Kang MS , Therriault J , Schöll M , Massarweh G , Soucy JP , Höglund K , Brinkmalm G , Mattsson N , Palmqvist S , Gauthier S , Stomrud E , Zetterberg H , Hansson O , Rosa-Neto P , Blennow K ((2020) ) Blood phosphorylated tau 181 as a biomarker for Alzheimer’s disease: A diagnostic performance and prediction modelling study using data from four prospective cohorts. Lancet Neurol 19: , 422–433. |
[4] | Thijssen EH , La Joie R , Strom A , Fonseca C , Iaccarino L , Wolf A , Spina S , Allen IE , Cobigo Y , Heuer H , VandeVrede L , Proctor NK , Lago AL , Baker S , Sivasankaran R , Kieloch A , Kinhikar A , Yu L , Valentin MA , Jeromin A , Zetterberg H , Hansson O , Mattsson-Carlgren N , Graham D , Blennow K , Kramer JH , Grinberg LT , Seeley WW , Rosen H , Boeve BF , Miller BL , Teunissen CE , Rabinovici GD , Rojas JC , Dage JL , Boxer AL ; Advancing Research and Treatment for Frontotemporal Lobar Degeneration investigators ((2021) ) Plasma phosphorylated tau 217 and phosphorylated tau 181 as biomarkers in Alzheimer’s disease and frontotemporal lobar degeneration: A retrospective diagnostic performance study. Lancet Neurol 20: , 739–752. |
[5] | Biogen ((2022) ) USA Prescribing Information for ADUHELM (aducanumab-avwa). https://www.biogencdn.com/us/aduhelm-pi.pdf. Accessed September 23, 2023. |
[6] | Eisai Inc. ((2023) ) USA Prescribing Information for LEQEMBI™ (lecanemab-irmb). https://www.accessdata.fda.gov/drugsatfda_docs/label/2023/761269s000lbl.pdf. Accessed September 27, 2023. |
[7] | Karran E , De Strooper B ((2022) ) The amyloid hypothesis in Alzheimer disease: New insights from new therapeutics. Nat Rev Drug Discov 21: , 306–318. |
[8] | Webster SP , Ward P , Binnie M , Craigie E , McConnell KM , Sooy K , Vinter A , Seckl JR , Walker BR ((2007) ) Discovery and biological evaluation of adamantyl amide 11β-HSD1 inhibitors. Bioorg Med Chem Lett 17: , 2838–2843. |
[9] | Webster SP , McBride A , Binnie M , Sooy K , Seckl JR , Andrew R , Pallin TD , Hunt HJ , Perrior TR , Ruffles VS , Ketelbey JW , Boyd A , Walker BR ((2017) ) Selection and early clinical evaluation of the brain-penetrant 11β-hydroxysteroid dehydrogenase type 1 (11β-HSD1) inhibitor UE2343 (Xanamem™). Br J Pharmacol 174: , 396–408. |
[10] | Yau JL , Noble J , Kenyon CJ , Hibberd C , Kotelevtsev Y , Mullins JJ , Seckl JR ((2001) ) Lack of tissue glucocorticoid reactivation in 11β-hydroxysteroid dehydrogenase type 1 knock-out mice ameliorates age-related learning impairments. U S A 98: , 4716–4721. |
[11] | Yau JLW , Seckl JR ((2012) ) Local amplification of glucocorticoids in the aging brain and impaired spatial memory. Front Aging Neurosci 4: , article 24. |
[12] | Sandeep TC , Yau JL , MacLullich AM , Noble J , Deary IJ , Walker BR , Seckl JR ((2004) ) 11β-hydroxysteroid dehydrogenase inhibition improves cognitive function in healthy elderly men and type 2 diabetics. U S A 101: , 6734–6739. |
[13] | Pietrzak RH , Laws SM , Lim YY , Bender SJ , Porter T , Doecke J , Ames D , Fowler C , Masters CL , Milicic L , Rainey-Smith S , Villemagne VL , Rowe CC , Martins RN , Maruff P ((2017) ) Plasma cortisol, brain amyloid-beta, and cognitive decline in preclinical Alzheimer’s disease: A 6-year prospective cohort study. Biol Psychiatry Cogn Neurosci Neuroimaging 2: , 45–52. |
[14] | Oanes S , Popp J ((2019) ) High cortisol and the risk of dementia and Alzheimer’s disease: A review of the literature. Front Aging Neurosci 11: , 43. |
[15] | Sapolsky RM ((2000) ) Glucocorticoids and hippocampal atrophy in neuropsychiatric disorders. Arch Gen Psychiatry 10: , 925–935. |
[16] | Stuart KE , King AE, Fernandez-Martos CM , Summers MJ , Vickers JC ((2017) ) Environmental novelty exacerbates stress hormones and Aβ pathology in an Alzheimer’s model. Sci Rep 7: , 2764–2771. |
[17] | Sapolsky RM , Uno H , Rebert CS , Finch CE ((1990) ) Hippocampal damage associated with prolonged glucocorticoid exposure in primates. J Neurosci 10: , 2897–2902. |
[18] | Beach TG, Monsell SE, Phillips LE, Kukull W ((2012) ) Accuracy of the clinical diagnosis of Alzheimer disease at National Institute on Aging Alzheimer Disease Centers, 2005–2010. J Neuropathol Exp Neurol 71: , 266–273. |
[19] | Villemagne VL , Doré V , Chong L , Kassiou M , Mulligan R , Feizpour A , Taylor J , Roesner M , Miller T , Rowe CC ((2024) ) Brain 11β-hydroxysteroid dehydrogenase type 1 occupancy by Xanamem™ assessed by PET in Alzheimer’s disease and cognitively normal individuals. J Alzheimers Dis 97: , 1463–1475. |
[20] | McKhann GM , Knopman DS , Chertkow H , Hyman BT , Jack CR Jr , Kawas CH , Klunk WE , Koroshetz WJ , Manly JJ , Mayeux R , Mohs RC , Morris JC , Rossor MN , Scheltens P , Carrillo MC , Thies B , Weintraub S , Phelps CH ((2011) ) The diagnosis of dementia due to Alzheimer’s disease: Recommendations from the National Institute on Aging – Alzheimer’s Association workgroup on diagnostic guidelines for Alzheimer’s disease. Alzheimers Dement 7: , 263–269. |
[21] | Wang J , Logovinsky V , Hendrix SB , Stanworth SH , Perdomo C , Xu L , Dhadda S , Do I , Rabe M , Luthman J , Cummings J , Satlin A ((2016) ) ADCOMS: A composite clinical outcome for prodromal Alzheimer’s disease trials. J Neurol Neurosurg Psychiatry 87: , 993–999. |
[22] | Grundman M , Petersen RC , Ferris SH , Thomas RG , Aisen PS , Bennett DA , Foster NL , Jack CR Jr , Galasko DR , Doody R , Kaye J , Sano M , Mohs R , Gauthier S , Kim HT , Jin S , Schultz AN , Schafer K , Mulnard R , van Dyck CH , Mintzer J , Zamrini EY , Cahn-Weiner D , Thal LJ , Alzheimer’s Disease Cooperative Study ((2004) ) Mild cognitive impairment can be distinguished from Alzheimer disease and normal aging for clinical trials. Arch Neurol 61: , 59–66. |
[23] | Gerards M , Schild AK , Meiberth D , Rostamzadeh A , Vehreschild JJ , Wingen-Heimann S , Johannis W , Martino Adami P , Onur OA , Ramirez A , Karikari TK , Ashton NJ , Zetterberg H , Blennow K , Maier F , Jessen F ((2022) ) Alzheimer’s disease plasma biomarkers distinguish clinical diagnostic groups in memory clinic patients. Dement Geriatr Cogn Disord 51: , 182–192. |
[24] | Jutten RJ , Harrison JE , Lee Meeuw Kjoe PR , Ingala S , Vreeswijk R , van Deelen RAJ , de Jong FJ , Opmeer EM , Aleman A , Ritchie CW , Scheltens P , Sikkes SAM ((2019) ) Assessing cognition and daily function in early dementia using the cognitive-functional composite: Findings from the Catch-Cog study cohort. Alzheimers Res Ther 11: , 45. |
[25] | Benedet AL , Milà-Alomà M , Vrillon A , Ashton NJ , Pascoal TA , Lussier F , Karikari TK , Hourregue C , Cognat E , Dumurgier J , Stevenson J , Rahmouni N , Pallen V , Poltronetti NM , Salvadó G , Shekari M , Operto G , Gispert JD , Minguillon C , Fauria K , Kollmorgen G , Suridjan I , Zimmer ER , Zetterberg H , Molinuevo JL , Paquet C , Rosa-Neto P , Blennow K , Suárez-Calvet M , Translational Biomarkers in Aging and Dementia (TRIAD) study, Alzheimer’s and Families (ALFA) study, and BioCogBank Paris Lariboisière cohort ((2021) ) Differences between plasma and cerebrospinal fluid glial fibrillary acidic protein levels across the Alzheimer disease continuum. JAMA Neurol 78: , 1471–1483. |
[26] | Ashton NJ , Brum WS , Di Molfetta G , Benedet AL , Arslan B , Jonatis E , Langhough RE , Cody K , Wilson R , Carlsson CM , Vanmechelen E , Montoliu-Gaya L , Lantero-Rodriguez J , Rahmouni N , Tissot C , Stevenson J , Servaes S , Therriault J , Pascoal T , Lleó A , Alcolea D , Fortea J , Rosa-Neto P , Johnson S , Jeromin A , Blennow K , Zetterberg H ((2023) ) Diagnostic accuracy of the plasma ALZpath pTau217 immunoassay to identify Alzheimer’s disease pathology. medRxiv, doi: https://doi.org/10.1101/2024.01.21.24301570. Posted January 22, 2024. |
[27] | Ashton NJ , Janelidze S , Mattsson-Carlgren N , Binette AP , Strandberg O , Brum WS , Karikari TK , González-Ortiz F , Di Molfetta G , Meda FJ , Jonaitis EM , Koscik RL , Cody K , Betthauser TJ , Li Y , Vanmechelen E , Palmqvist S , Stomrud E , Bateman RJ , Zetterberg H , Johnson SC , Blennow K , Hansson O ((2022) ) Differential roles of Aβ42/40, p-tau231 and p-tau217 for Alzheimer’s trial selection and disease monitoring. Nat Med 28: , 2555–2562. |
[28] | Pichet Binette A , Franzmeier N , Spotorno N , Ewers M , Brendel M , Biel D ; Alzheimer’s Disease Neuroimaging Initiative; Strandberg O, , Janelidze S , Palmqvist S , Mattsson-Carlgren N , Smith R , Stomrud E , Ossenkoppele R , Hansson O ((2022) ) Amyloid-associated increases in soluble tau relate to tau aggregation rates and cognitive decline in early Alzheimer’s disease. Nat Commun 13: , 6635. |
[29] | Hansson O ((2021) ) Biomarkers for neurodegenerative diseases. Nat Med 27: , 954–963. |
[30] | Janelidze S , Teunissen CE , Zetterberg H , Allué JA , Sarasa L , Eichenlaub U , Bittner T , Ovod V , Verberk IMW , Toba K , Nakamura A , Bateman RJ , Blennow K , Hansson O ((2021) ) Head-to-head comparison of 8 plasma amyloid-beta 42/40 assays in Alzheimer disease. JAMA Neurol 78: , 1375–1382. |
[31] | van Dyck CH , Swanson CJ , Aisen P , Bateman RJ , Chen C , Gee M , Kanekiyo M , Li D , Reyderman L , Cohen S , Froelich L , Katayama S , Sabbagh M , Vellas B , Watson D , Dhadda S , Irizarry M , Kramer LD , Iwatsubo T ((2023) ) Lecanemab in early Alzheimer’s disease. N Engl J Med 388: , 9–21. |
[32] | Sims JR , Zimmer JA , Evans CD , Lu M , Ardayfio P , Sparks J , Wessels AM , Shcherbinin S , Wang H , Monkul Nery ES , Collins EC , Solomon P , Salloway S , Apostolova LG , Hansson O , Ritchie C , Brooks DA , Mintun M , Skovronsky DM ((2023) ) Donanemab in early symptomatic Alzheimer disease: The TRAILBLAZER-ALZ 2 randomized clinical trial. JAMA 330: , 512–527. |
[33] | Lupien SJ , Nair NP , Briere S , Maheu F , Tu MT , Lemay M , McEwen BS , Meaney MJ ((1999) ) Increased cortisol levels and impaired cognition in human aging: Implication for depression and dementia in later life. Rev Neurosci 10: , 117–139. |
[34] | Holmes MC , Carter RN , Noble N , Chitnis S , Dutia A , Paterson JM , Mullins JJ , Seckl JR , Yau JL ((2010) ) 11β-hydroxysteroid dehydrogenase type 1 expression is increased in the aged mouse hippocampus and parietal cortex and causes memory impairments. J Neurosci 30: , 6916–6920. |
[35] | Mohler EG , Browman KE , Roderwald VA , Cronin EA , Markosyan S , Scott Bitner R , Strakhova MI , Drescher KU , Hornberger W , Rohde JJ , Brune ME , Jacobson PB , Rueter LE ((2011) ) Acute inhibition of 11β-hydroxysteroid dehydrogenase type-1 improves memory in rodent models of cognition. J Neurosci 31: , 5406–5413. |
[36] | Sooy K , Webster SP , Noble J , Binnie M , Walker BR , Seckl JR , Yau JL ((2010) ) Partial deficiency of short-term inhibition of 11β-hydroxysteroid dehydrogenase type 1 improves cognitive function in aging mice. J Neurosci 30: , 13867–13872. |
[37] | Karin A , Hannesdottir K , Jaeger J , Annas P , Segerdahl M , Karlsson P , Sjögren N , von Rosen T , Miller F ((2014) ) Psychometric evaluation of ADAS-Cog and NTB for measuring drug response. Acta Neurol Scand 129: , 114–122. |
[38] | U.S. Food and Drug Administration ((2020) ) Guidance Document: Alzheimer’s Disease: Developing Drugs for Treatment Guidance for Industry. https://www.fda.gov/regulatory-information/search-fda-guidance-documents/alzheimers-disease-developing-drugs-treatment-guidance-industy. Accessed September 22, 2023. |


