
Mild Behavioral Impairment and Cerebrovascular Profiles Are Associated with Early Cognitive Impairment in a Community-Based Southeast Asian Cohort
Abstract
Background:
Mild behavioral impairment (MBI) is one of the earliest observable changes when a person experiences cognitive decline and could be an early manifestation of underlying Alzheimer’s disease neuropathology. Limited attention has been given to investigating the clinical applicability of behavioral biomarkers for detection of prodromal dementia.
Objective:
This study compared the prevalence of self-reported MBI and vascular risk factors in Southeast Asian adults to identify early indicators of cognitive impairment and dementia.
Methods:
This cohort study utilized baseline data from the Biomarkers and Cognition Study, Singapore (BIOCIS). 607 participants were recruited and classified into three groups: cognitively normal (CN), subjective cognitive decline (SCD), and mild cognitive impairment (MCI). Group comparisons of cognitive-behavioral, neuroimaging, and blood biomarkers data were applied using univariate analyses. Multivariate logistic regression analyses were conducted to investigate the association between cerebrovascular disease, vascular profiles, and cognitive impairment.
Results:
SCD had significantly higher depression scores and poorer quality of life (QOL) compared to CN. MCI had significantly higher depression scores; total MBI symptoms, MBI-interest, MBI-mood, and MBI-beliefs; poorer sleep quality; and poorer QOL compared to CN. Higher Staals scores, glucose levels, and systolic blood pressure were significantly associated with MCI classification. Fasting glucose levels were significantly correlated with depression, anxiety, MBI-social, and poorer sleep quality.
Conclusions:
The results reflect current research that behavioral changes are among the first symptoms noticeable to the person themselves as they begin to experience cognitive decline. Self-reported questionnaires may aid in early diagnoses of prodromal dementia. Behavioral changes and diabetes could be potential targets for preventative healthcare for dementia.
INTRODUCTION
It is an optimistic time in the field of cognition and dementia. While the prevalence of dementia is rising due to global aging and longevity, success of non-pharmacological and pharmacological interventions is increasing the hopes of slowing cognitive decline [1–3]. With increasing success of early interventions for cognitive decline, there is growing interest in the transitional state between normal aging and dementia: subjective cognitive decline (subjective decline in cognition, without objective cognitive impairment; SCD) and mild cognitive impairment (cognitive disturbance that occur before clinical diagnoses of dementia; MCI). However, the predominant emphasis in dementia biomarker research lies in the realms of fluid and neuroimaging studies, with limited attention given to investigating the clinical applicability of behavioral biomarkers for early dementiadetection.
Progressive cognitive impairment, behavioral changes, changes in brain imaging, and blood biomarkers pathology are detectable decades before clinical diagnoses of Alzheimer’s disease (AD) are made [4]. Behavioral changes, also known as mild behavioral impairments (MBI), may be one of the early observable changes in AD and dementia [5]. MBI is associated with dementia biomarkers [6], and has been shown to be associated with cognitive impairment [7, 8] as well as risk of progression to dementia [9], and is a potential preclinical manifestation of underlying AD neuropathology [10]. In patients with SCD and MCI, MBI is characterized by neuropsychiatric symptoms (NPS)—“noncognitive behavioral and psychological symptoms of dementia” [11, 12]. To systematically evaluate MBI, the Mild Behavioral Impairment Checklist (MBI-C) was developed to assess five domains of NPS: decreased motivation, emotional dysregulation, impulse control, social inappropriateness, and abnormal beliefs/perceptions [13]. A recent study Creese et al. by has reported that the MBI-C was able to detect cognitive decline at the MCI stage [14]. Additionally, the combination of MBI and SCD have been found to be associated with the greatest risk of decline in a cognitively normal cohort [15].
NPS are present in Western and Asian cohorts and include psychosocial and lifestyle factors such as depression, anxiety, stress, and sleep issues [16]. Issues with mood, motivation, inhibition, sleep, and overall quality of life could be precursors to cognitive decline and dementia. Additionally, unlike brain imaging or blood biomarkers, behavioral changes can be observed and detected by the individual, caregiver, and laypersons around them. Therefore, being aware of mild behavioral changes in healthy adults can be a practical, cost-saving, and effective method for the detection of early cognitive decline in older adults. Early management of NPS could minimize devastating consequences for patients, caregivers, and society, and lead to more successful outcomes in pharmacological and non-pharmacological treatments for cognitive impairment. However, literature in a southeast Asian cohort such as Singapore is lacking.
In addition to behavioral changes, cerebrovascular disease (CVD) and vascular factors such as diabetes, hypertension, and hyperlipidemia are linked to cognitive impairment as well [17, 18]. There is increasing evidence suggesting that vascular burden and CVD is more prevalent in Asians [19–21] and is significantly associated with cognitive impairment [22, 23]. It is therefore worthwhile to account for cerebrovascular and vascular factors when studying risk factors to cognitive impairment in our Southeast Asian cohort.
Early, accurate diagnosis of SCD and MCI represents an important opportunity for intervention, as prompt access to the right treatments improves prognoses. This study aims to investigate if the prevalence of self-reported mood, NPS, and behavioral impairments in a community-based Singaporean cohort have early clinical implications for cognitive impairment. Behavioral changes are compared across three subgroups (cognitively normal (CN), SCD or MCI) to capture early behavioral manifestations in the cognitive continuum. MCI participants are hypothesized to report more mood and behavioral impairments compared to CN participants. Neuroimaging and vascular factors were further examined to explore factors related to cognitive impairment.
METHODS
Study design and participants
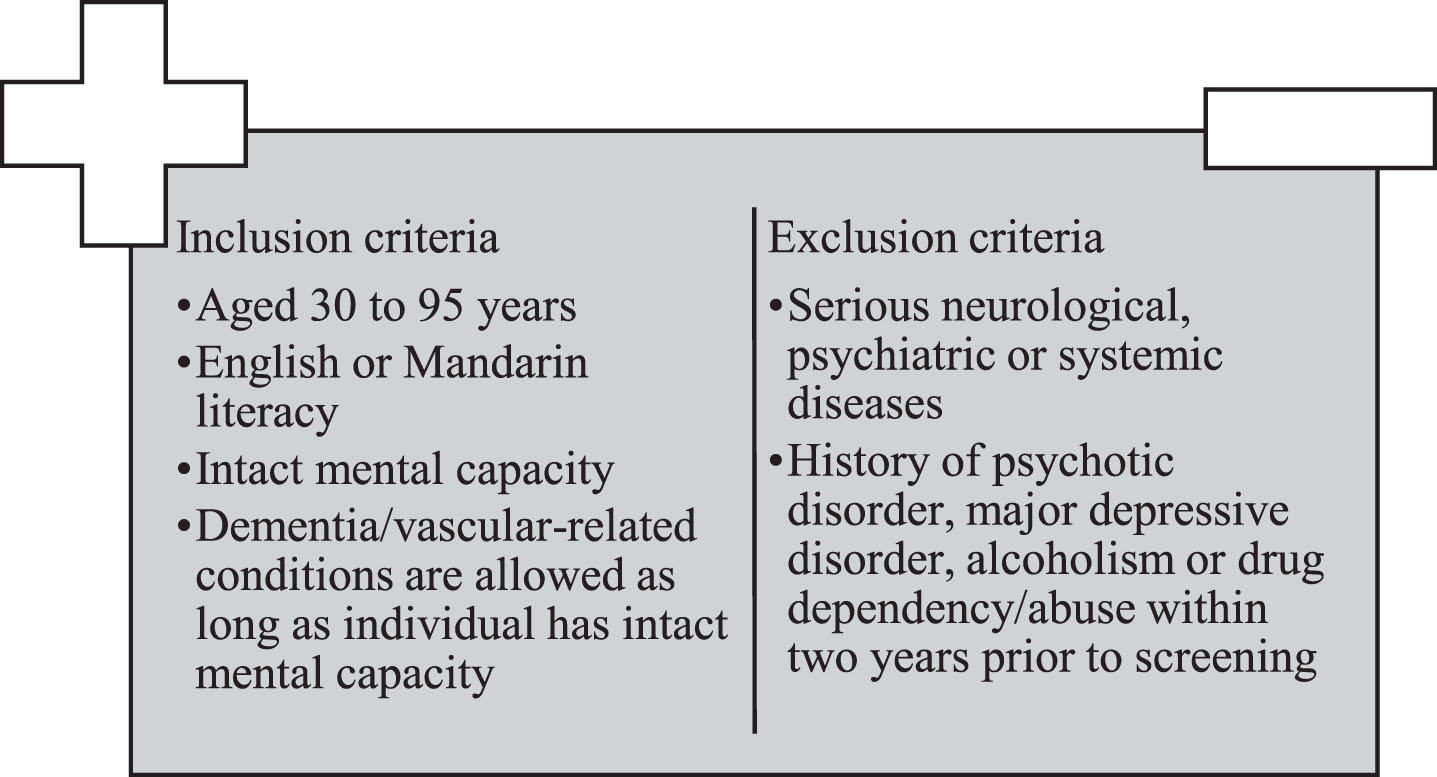
This cross-sectional study utilized baseline data from the Biomarkers and Cognition Study, Singapore (BIOCIS) at the Dementia Research Centre (Singapore). BIOCIS is a 5-year longitudinal cohort study where research participants are assessed annually. BIOCIS aims to further the understanding of AD and vascular cognitive impairment by characterizing biomarker profiles, disease progression, neuropsychological and clinical outcomes in a multi-ethnic Southeast Asian population. Lower limits of population were set at 30 years old, to research early-onset cognitive issues, conduct risk factor analyses such as lifestyle, environmental factors, and genetics, as well as provide longitudinal insights into cognitive health. Participants were recruited from the community living in Singapore from February 2022 to February 2023. All participants completed a comprehensive neuropsychological assessment, behavioral and lifestyle questionnaires, fasting blood tests, and 412 eligible participants completed detailed Three-tesla magnetic resonance imaging (MRI). Figure 1 presents the inclusion and exclusioncriteria.
Fig. 1
Inclusion and exclusion criteria of Biomarkers and Cognition Study, Singapore.
Informed consent was obtained from all patients according to the Declaration of Helsinki and local clinical research regulations, and procedures used in the study were in accordance with ethical guidelines. This study has been approved by the NTU Institutional Review Board (NTU-IRB-2021-1036).
Study variables
Cognitive and neuropsychological assessments
Cognitive performance was evaluated by trained raters using a standardized neuropsychological battery including the Clinical Dementia Rating (CDR) and tests of: global cognition (Montreal Cognitive Assessment (MoCA) and Visual Cognitive Assessment Test); memory (Rey Auditory Verbal Learning Test Delayed, Logical Memory immediate and delayed, Rey Complex Figure Test); executive function (Trial Making Test B; Processing speed – Color trials 1, Symbol Digit Modalities); language (Semantic fluency); visuospatial skills (Block Design, Rey Complex Figure Test Copy); attention (Digit Span Backwards).
Demographic data
Demographics data including age, sex, housing type, employment status, and years of education were collected via self-report.
Behavior profiles
The self-reported standardized lifestyle and behavioral questionnaires included: Depression Anxiety Stress Scales [24]; MBI-C [13]; Dementia-Quality of Life Instrument [25]; International Physical Activity Questionnaire [26]; Fried Phenotype Frailty [27]; Pittsburgh Sleep Quality Index [28]; Subjective Memory Complaints Questionnaire (SMCQ) [29].
Classifications of participants
Participants were classified as CN, SCD, and MCI according to published criteria [30] and the National Institute on Aging-Alzheimer’s Association (NIA-AA) criteria. Participants with CDR of 0, SMCQ below 5, and MoCA above 26 were classified as CN; Participants who self-reported cognitive symptoms and had cognitive scores 1.5 standard deviations (SD) below the CN mean, with no functional deficits were classified as MCI; Participants who did not meet these criteria for CN, MCI were classified as SCD. Participants who had CDR of 1 were classified as Dementia and excluded from the analyses.
Neuroimaging protocols and quantification
Participants underwent neuroimaging assessments using a 3T Siemens Prisma Fit (Siemens, Erlangen, Germany). The T1-weighted MPRAGE sequence was acquired with repetition time of 2000 ms, echo time 2.26 ms, inversion time 800 ms, flip angle 8, 1 mm slice thickness, 176 slices, and 1×1×1 mm voxel size. The T2-weighted FLAIR MRI sequence was acquired with repetition time of 7000 ms, echo time 394 ms, inversion time 210 0 ms, flip angle 120, 1.56 mm slice thickness, 192 slices, 0.8×0.8×1 mm voxel size. The SWI sequence was acquired with repetition time 28 ms, echo time 20 ms, flip angle 15, 2 mm slice thickness, ROW encoding direction, 72 slices, 0.625×0.625×1 mm voxel size. To quantify the STAALS, Fazekas white matter hyperintensity, medial temporal atrophy (MTA), microhemorrhages, lacunes, and perivascular spaces (PVS) scores, MRI visual ratings were performed on T1 and FLAIR MRI sequences by two trained raters blinded to diagnosis according to methods previously published [31–33]. The average MTA rating was used to classify abnormal MTA [34] and the Staals scores were assigned to white matter hyperintensity, PVS, microbleed, and lacunes ratings based on the Staals criteria [35].
Vascular history and fluid biomarkers
Clinical history of diabetes, hypertension, and hyperlipidemia, as confirmed by a formal diagnosis from a medical professional, were collected by self-report. Blood pressure was measured twice, and averages recorded. Cholesterol was measured using fasting lipids (total Cholesterol in mmol/L) and diabetes was measured using fasting (8 h) glucose blood tests in mmol/L. Tests assessing fluid biomarkers for AD pathology are carried out for the BIOCIS study; however, as biomarker quantification is on-going, individuals within this cohort were not tested for AD pathology.
Statistical analysis
Continuous variables were reported as mean and standard deviation, while categorical variables are presented as frequency and percentages. Group comparisons of demographics, cognitive, behavioral, neuroimaging, and blood biomarkers data were applied separately using univariate analyses including χ2 test or Fisher’s exact test and analysis of variance (ANOVA). Group comparisons of behavioral data were applied separately using analysis of covariance (ANCOVA) with age and education as covariates, followed by Sidak post hoc test correcting for multiple comparisons. To investigate the association between CVD, vascular risk factors, and MCI, multivariate logistic regression analysis with Forward Wald method was conducted to identify brain imaging and vascular history factors that have the strongest influence on MCI classification. Pearson’s correlation coefficient was performed to evaluate the relationship between vascular factors and behavioral outcomes. All statistical analyses were performed using IBM SPSS Statistics for Windows, Version 23.0. Armonk, NY: IBM Corp. Statistical significance was set to p < 0.05.
RESULTS
Participant demographics
Data from 607 participants (mean age 61.99±10.19, 31.1% males) were analyzed. 126 (20.8%) was classified as CN, 156 (25.7%) as SCD, and 325 (53.5%) as MCI. Table 1 presents demographic, cognitive, brain imaging visual ratings, vascular risk factors of the BIOCIS cohort, and Table 2 presents the behavioral phenotype profiles with post-hoc comparisons. Participants classified as SCD and MCI were significantly older (p < 0.001), with fewer years of education (p < 0.001), had lower global cognitive scores (p < 0.001), higher Staals scores (p = 0.021) and higher prevalence of diabetes (0.026), hypertension (0.024), and hyperlipidemia (0.014) compared to CN.
Table 1
Descriptives of demographic, cognitive, brain imaging visual ratings, and vascular profiles
| Overall | CN | SCD | MCI | Overall | |
| n = 607 | n = 126 | n = 156 | n = 325 | p2 | |
| Age† | 61.99±10.19 | 60±10.03 | 59.2±9.62 | 64.54±9.71 | <0.0013 |
| Sex (Male)1 | 230 (42.4%) | 24 (45.45%) | 77 (39.69%) | 129 (43.88%) | 0.0223 |
| Education† | 14.06±3.49 | 14.62±3.16 | 14.76±2.88 | 13.5±3.78 | <0.0013 |
| Ethnicity | 0.717 | ||||
| Chinese1 | 556 (91.6%) | 117 (92.1%) | 147 (94.2%) | 292 (89.8%) | |
| Malay1 | 7 (1.2%) | 2 (1.6%) | 1 (0.6%) | 4 (1.2%) | |
| Indian1 | 28 (4.6%) | 4 (3.2%) | 5 (3.2%) | 19 (5.8%) | |
| Eurasian1 | 16 (2.6%) | 3 (2.4%) | 3 (1.9%) | 10 (3.1%) | |
| ∧MoCA† | 25.84±2.7 | 28.21±1.03 | 26.33±2.16 | 24.69±2.71 | <0.0013 |
| ∧VCAT | 25.96±3.21 | 26.86±2.31 | 26.97±3.33 | 25.12±3.62 | <0.0013 |
| Brain Imaging Visual Ratings | |||||
| Staals Score | 1.1±1.05 | 0.86±0.93 | 1.07±1.04 | 1.23±1.05 | 0.021 |
| Fazekas | 4.12±2.81 | 3.74±2.69 | 3.93±3 | 4.41±2.75 | 0.108 |
| MTA | 2.58±1.16 | 2.48±1.02 | 2.53±1.11 | 2.67±1.24 | 0.357 |
| MB | 0.2±0.52 | 0.21±0.57 | 0.23±0.56 | 0.18±0.47 | 0.782 |
| Lacunes | 0.99±2.29 | 0.61±1.29 | 0.99±2.89 | 1.17±2.31 | 0.139 |
| PVS | 2.08±0.89 | 1.99±0.75 | 2.09±0.96 | 2.12±0.94 | 0.506 |
| Vascular history | |||||
| Diabetes | 91 (18.09%) | 16 (12.7%) | 13 (8.33%) | 62 (19.07%) | 0.026 |
| HTN | 175 (28.82%) | 30 (23.8%) | 38 (24.36%) | 107 (32.92%) | 0.024 |
| HLD | 252 (41.52%) | 38 (30.16%) | 62 (39.74%) | 152 (46.77%) | 0.014 |
p values significant at ≤0.05 are bolded. †mean±Standard Deviation; 1Frequency (percentages); ∧higher value indicates better scores; ∨lower value indicates better scores; 2adjusted for age, gender, and education; 3non-adjusted. CN, cognitively normal; MCI, mild cognitive impairment; SCD, subjective cognitive decline; MoCA, Montreal Cognitive Assessment; VCAT, Visual Cognitive Assessment Test.
Table 2
Demographic, cognitive, brain imaging visual ratings, vascular risk factors, and behavioral phenotype characteristics by cognitive function
| Overall | CN | SCD | MCI | Overall | CN versus | CN versus | SCD versus | |
| n = 607 | n = 126 | n = 156 | n = 325 | p2 | SCD p2 | MCI p2 | MCI p2 | |
| DASS | ||||||||
| Depression† | 3.65±5.44 | 2.27±3.41 | 4.21±5.46 | 3.85±5.98 | 0.008 | 0.019 | 0.012 | 0.993 |
| Anxiety† | 4.33±4.9 | 3.92±4.04 | 4.66±4.81 | 4.33±5.25 | 0.46 | 0.521 | 0.885 | 0.805 |
| Stress† | 6.22±6.54 | 5.64±5.27 | 7.19±7.13 | 5.97±6.65 | 0.149 | 0.158 | 0.761 | 0.379 |
| MBI-C | ||||||||
| ∧Total† | 2.52±4.54 | 1.33±2.53 | 2.3±3.86 | 3.08±5.31 | <0.001 | 0.204 | <0.001 | 0.106 |
| ∧Interest† | 0.58±1.42 | 0.31±1.12 | 0.50±1.20 | 0.72±1.60 | 0.006 | 0.570 | 0.006 | 0.133 |
| ∧Mood† | 0.81±1.68 | 0.27±0.76 | 0.91±1.63 | 0.97±1.91 | <0.001 | 0.004 | <0.001 | 0.860 |
| ∧Control† | 0.94±1.93 | 0.63±1.28 | 0.91±1.84 | 1.08±2.16 | 0.155 | 0.184 | 0.068 | 0.836 |
| ∧Social† | 0.14±0.492 | 0.08±0.397 | 0.08±0.37 | 0.18±0.569 | 0.077 | 1 | 0.222 | 0.163 |
| ∧Beliefs† | 0.08±0.34 | 0.0±0 | 0.06±0.3 | 0.12±0.39 | 0.033 | 0.517 | 0.05 | 0.124 |
| IPAQ1 (high) | 309 (50.9%) | 64 (50.79%) | 76 (48.72%) | 169 (53.65%) | 0.930 | 0.976 | 0.988 | 0.999 |
| ∧Fried† | 0.36±0.66 | 0.36±0.66 | 0.42±0.61 | 0.59±0.89 | 0.183 | 0.937 | 0.224 | 0.576 |
| ∧PSQI† | 5.12±3.09 | 4.45±2.50 | 5.33±3 | 5.31±3.32 | 0.022 | 0.081 | 0.025 | 1 |
| ∨DemQOL† | 99.70±11.09 | 102.77±8.47 | 99.15±11.38 | 98.65±11.73 | <0.001 | 0.023 | <0.001 | 0.435 |
p values significant at ≤0.05 are bolded. †mean±standard deviation; 1Frequency (percentages); ∨higher value indicates better scores; ∧lower value indicates better scores; 2adjusted for age, gender, and education; 3non-adjusted. CN, cognitively normal; MCI, mild cognitive impairment; SCD, subjective cognitive decline; MoCA, Montreal Cognitive Assessment; VCAT, Visual Cognitive Assessment Test; WMH, white matter hyperintensity; MTA, medial temporal atrophy; MB, microhemorrhages; PVS, perivascular spaces; HTN, hypertension; HLD, hyperlipidemia; DASS, Depression Anxiety Stress Scales; MBI-C, Mild Behavioral Impairment-Checklist; IPAQ, International Physical Activity Questionnaire; Fried, Fried Phenotype Frailty; PSQI, Pittsburgh Sleep Quality Index; DemQOL, Dementia-Quality of Life Instrument.
Behavioral findings
After adjusting for age and education, SCD participants were significantly more likely to report symptoms of depression (p = 0.019) and poorer quality of life outcomes (p = 0.023) compared to CN participants. MCI participants, after adjusting for age and education, were significantly more likely to report symptoms of depression (p = 0.012); MBI-C total (p < 0.001), MBI-C interest (p = 0.006), mood (p < 0.001), and beliefs (p = 0.05) subdomains; poorer sleep quality (p = 0.025); poorer quality of life outcomes (p < 0.001) compared to CN participants.
Cerebrovascular and vascular risk factors associated with being classified as SCD and MCI
Logistic regression was performed to ascertain the effects of CVD and vascular risk factors on the likelihood of being classified as SCD and MCI. Fasting glucose, lipids, and systolic blood pressure readings were entered as predictors for the vascular risk model. Staals score, Fazekas, MTA, number of microbleeds and lacunes, and PVS scores were entered as predictors for the CVD model. Higher systolic blood pressure (OR = 1.017, 95% CI, 1.006–1.028; p = 0.002) were significantly associated with the likelihood of being classified as SCD. Elevated glucose test scores (OR = 1.314, 95% CI, 1.11–1.56; p = 0.002) and higher systolic blood pressure (OR = 1.012, 95% CI, 1–1.02; p = 0.011) were significantly associated with the likelihood of being classified as MCI. Staals score was significantly associated with the likelihood of being classified as MCI (OR = 0.785, 95% CI, 0.650–0.947; p = 0.012).
Relationship between vascular risk factors and behavioral outcomes
Pearson’s correlation was performed with vascular variables and behavioral scores. Glucose levels were significantly correlated with depression (p = 0.013), anxiety (p < 0.001), MBI-social (p < 0.001), and poorer quality of sleep (p = 0.004). Table 3 presents the correlation matrix.
Table 3
Correlation matrix of vascular risk factors and behavioral outcomes
| DASS | MBI-C | PSQI | |||||||
| Depression | Anxiety | Stress | Interest | Mood | Control | Social | Beliefs | Sleep | |
| Vascular History | |||||||||
| Diabetes | 0.102* | 0.157** | 0.074 | 0.010 | 0.044 | 0.067 | 0.176** | 0.058 | 0.123** |
| HTN | –0.046 | –0.006 | –0.080 | 0.011 | –0.009 | 0.005 | –0.024 | 0.058 | –0.041 |
| HLD | –0.016 | –0.071 | –0.070 | –0.042 | –0.013 | –0.038 | 0.036 | 0.005 | –0.048 |
***p < 0.001, **p < 0.01, *p < 0.05. HTN, hypertension; HLD, hyperlipidemia; DASS, Depression Anxiety Stress Scales; MBI-C, Mild Behavioral Impairment-Checklist; PSQI, Pittsburgh Sleep Quality Index.
DISCUSSION
This study examined self-reported NPS in a community-based Singaporean cohort. The principal findings include the significant differences in behavioral profiles in adults with SCD and MCI compared to cognitively unimpaired adults. The construct of MBI describes the relationship between NPS and cognitive decline, and this is reflected in our study as MCI participants reported significantly worse NPS symptoms than SCD and CN participants.
SCD and MCI participants reported higher depression scores and poorer sleep quality, which is congruent with current research. Depression confers a higher rate of progression along the neurodegenerative spectrum in cognitive impairment and is one of the most common behavioral manifestation in older adults with MCI [36, 37] and shown to be a risk factor to dementia [38]. Sleep is a risk factor for cognitive impairment [39] as well as a possible early manifestation of cognitive decline [40]. Beyond depression and sleep issues being risk factors or an early manifestation of dementia, there is a possibility of both symptoms occurring in tandem with cognitive decline. Brain regions such as the hippocampus and anterior cingulate gyrus are implicated in memory, sleep and emotional processes, and atrophy in these areas could affect all three domains [41]. Longitudinal analyses of our cohort will identify if depression and sleep quality are significant risk factors for progression to dementia in a Southeast Asian cohort.
Interestingly, MCI participants reported more mild behavioral impairments (decreased interest, lower mood, and abnormal beliefs) as well as poorer overall quality of life compared to SCD and CN participants. The SCD group did not differ significantly from the MCI group on behavioral profiles. This could suggest that as the progression along the dementia spectrum continues, the shift from CN to MCI begins with more behavioral manifestations, which affects the person’s overall quality of life. Additionally, the shift from SCD to MCI is not marked by significant behavioral manifestations, suggesting behavioral manifestations could begin before the person begins to experience cognitive decline. However, this is speculative and requires furthers investigation.
CVD, blood glucose profiles, and systolic blood pressure readings were shown to be associated with cognitive impairment in our cohort of Southeast Asians. Vascular risk factors have been increasingly shown to a significant risk factor for cognitive decline in Asians, compared to Caucasians [20]. Our results show that cerebrovascular burden and vascular history could potentially be a useful means to assess vascular cognitive impairment. This study adds to the increasing research literature that vascular cognitive impairment is highly prevalent in Asians. Vascular history is readily available in a patients’ medical history, and therefore could be a target for development of precision medicine for the diagnosis, prevention, and treatment strategies of CVD to reduce the risk of vascular cognitive decline. In addition, elevated glucose levels were shown to be significantly correlated with depression, anxiety, social inappropriateness, and poorer sleep quality. Even though the correlation was small, this could suggest that insulin resistance is associated with a person’s emotional and behavioral outcomes. Rasgon and Kenna [42] suggested that inefficient glucose utilization from insulin resistance leads to neuronal changes in brain regions including the limbic system, resulting in neurodegeneration and ultimately behavioral changes. Further research investigating the mechanisms of insulin’s resistance and behavioral impairment is needed.
Our results carry clinical and therapeutic implications and is in keeping with the strong evidence that behavioral changes are among the first symptoms noticeable to the person themselves, as they begin to experience cognitive decline. As current research indicates that MBI is associated with the greatest risk of decline in a cognitively normal cohort, a person presenting with MCI and NPS should be considered a high-risk group for progression to dementia and recommended early intervention. Furthermore, our results have important real-world relevance, as behavioral questionnaires can be administered easily and conveniently anywhere. These low-cost assessments will enhance the chance of an early diagnosis. In today’s post-pandemic world, any tools that reduces strain on healthcare systems are of national importance.
The limitations of this study include the lack of informant behavioral data and longitudinal data. Current research indicates that NPS in MCI confer a greater risk for conversion to dementia in comparison to MCI patients without NPS, and longitudinal follow-up with informant interviews may confirm this elevated conversion risk in our BIOCIS cohort. The incomplete profiles for the a etiology of cognitive impairment, particularly concerning AD pathology, is an additional notable limitation of this study. The strengths of the study are the relatively large sample size, comprehensive behavioral and lifestyle questionnaires, and the inclusion of blood and neuroimaging data.
Conclusions
We demonstrated that behavioral impairments are associated with early cognitive impairment and diabetes. Our study supports current research that NPS constitutes an early manifestation of cognitive impairment. Therefore, behavioral changes and diabetes should be considered when a person presents with memory complaints as it could be indicative of higher risk for progression to dementia. Future directions could include development of a risk algorithm validated in Southeast Asians to identify undiagnosed adults at higher risk of cognitive decline and put into motion the early intervention paradigm for prevention of dementia.
ACKNOWLEDGMENTS
The authors have no acknowledgments to report.
FUNDING
This project was funded by the Strategic Academic Initiative (SAI) Grant (SP1CLNT900-NTU-A630-PJ-03INP001400A630OOE01) from Lee Kong Chian School of Medicine, Nanyang Technological University, Singapore, Singapore Ministry of Education (MOE) Academic Research Fund (AcRF) Tier 3 Award MOE2017-T3-1-002 and National Medical Research Council, Singapore under its Clinician Scientist Award (MOH-CSAINV18nov-0007).
CONFLICT OF INTEREST
Nagaendran Kandiah is an Editorial Board Member of this journal but was not involved in the peer-review process nor had access to any information regarding its peer-review.
All other authors have no conflict of interest to report.
DATA AVAILABILITY
Data is not publicly available and may be made available by the corresponding author upon reasonable request.
REFERENCES
[1] | Ngandu T , Lehtisalo J , Solomon A , Levälahti E , Ahtiluoto S , Antikainen R , Bäckman L , Hänninen T , Jula A , Laatikainen T , Lindström J , Mangialasche F , Paajanen T , Pajala S , Peltonen M , Rauramaa R , Stigsdotter-Neely A , Strandberg T , Tuomilehto J , Soininen H , Kivipelto M ((2015) ) A 2 year multidomain intervention of diet, exercise, cognitive training, and vascular risk monitoring versus control to prevent cognitive decline in at-risk elderly people (FINGER): A randomised controlled trial. Lancet 385: , 2255–2263. |
[2] | Rosenberg A , Ngandu T , Rusanen M , Antikainen R , Bäckman L , Havulinna S , Hänninen T , Laatikainen T , Lehtisalo J , Levälahti E , Lindström J , Paajanen T , Peltonen M , Soininen H , Stigsdotter-Neely A , Strandberg T , Tuomilehto J , Solomon A , Kivipelto M ((2018) ) Multidomain lifestyle intervention benefits a large elderly population at risk for cognitive decline and dementia regardless of baseline characteristics: The FINGER trial. Alzheimers Dement 14: , 263–270. |
[3] | Swanson CJ , Zhang Y , Dhadda S , Wang J , Kaplow J , Lai RYK , Lannfelt L , Bradley H , Rabe M , Koyama A , Reyderman L , Berry DA , Berry S , Gordon R , Kramer LD , Cummings JL ((2021) ) A randomized, double-blind, phase 2b proof-of-concept clinical trial in early Alzheimer’s disease with lecanemab, an anti-Aβ protofibril antibody. Alzheimers Res Ther 13: , 80. |
[4] | Dubois B , Hampel H , Feldman HH , Scheltens P , Aisen P , Andrieu S , Bakardjian H , Benali H , Bertram L , Blennow K , Broich K , Cavedo E , Crutch S , Dartigues JF , Duyckaerts C , Epelbaum S , Frisoni GB , Gauthier S , Genthon R , Gouw AA , Habert MO , Holtzman DM , Kivipelto M , Lista S , Molinuevo JL , O’Bryant SE , Rabinovici GD , Rowe C , Salloway S , Schneider LS , Sperling R , Teichmann M , Carrillo MC , Cummings J , Jack CR Jr ; Proceedings of the Meeting of the International Working Group (IWG) and the American Alzheimer’s Association on “The Preclinical State of AD”; July 23, 2015; Washington DC, USA ((2016) ) Preclinical Alzheimer’s disease: Definition, natural history, and diagnostic criteria. Alzheimers Dement 12: , 292–323. |
[5] | Cozza M , Boccardi V ((2023) ) A narrative review on mild behavioural impairment: An exploration into its scientific perspectives. Aging Clin Exp Res 35: , 1807–1821. |
[6] | Ismail Z , Leon R , Creese B , Ballard C , Robert P , Smith EE ((2023) ) Optimizing detection of Alzheimer’s disease in mild cognitive impairment: A 4-year biomarker study of mild behavioral impairment in ADNI and MEMENTO. Mol Neurodegener 18: , 50. |
[7] | Sanderlin AH , Lockhart SN , Hayden KM , Craft S , Yang M , Sachs BC , Cleveland M , Williams BJ , Williamson JD , Bateman JR ((2022) ) Mild behavioral impairment is associated with sleep apnea, insomnia and brain white matter hyperintensity burden. Alzheimers Dement 18: , e069378. |
[8] | Sun Y , Xu W , Chen KL , Shen XN , Tan L , Yu JT ; Alzheimer’s Disease Neuroimaging Initiative ((2021) ) Mild behavioral impairment correlates of cognitive impairments in older adults without dementia: Mediation by amyloid pathology. Transl Psychiatry 11: , 577. |
[9] | Mallo SC , Patten SB , Ismail Z , Pereiro AX , Facal D , Otero C , Juncos-Rabadán O ((2020) ) Does the neuropsychiatric inventory predict progression from mild cognitive impairment to dementia? A systematic review and meta-analysis. Ageing Res Rev 58: , 101004. |
[10] | Jack CR Jr , Bennett DA , Blennow K , Carrillo MC , Dunn B , Haeberlein SB , Holtzman DM , Jagust W , Jessen F , Karlawish J ((2018) ) NIA-AA research framework: Toward a biological definition of Alzheimer’s disease. Alzheimers Dement 14: , 535–562. |
[11] | Lyketsos CG , Lopez O , Jones B , Fitzpatrick AL , Breitner J , DeKosky S ((2002) ) Prevalence of neuropsychiatric symptoms in dementia and mild cognitive impairment: Results from the cardiovascular health study. JAMA 288: , 1475–1483. |
[12] | Eikelboom WS , van den Berg E , Singleton EH , Baart SJ , Coesmans M , Leeuwis AE , Teunissen CE , van Berckel BNM , Pijnenburg YAL , Scheltens P , van der Flier WM , Ossenkoppele R , Papma JM ((2021) ) Neuropsychiatric and cognitive symptoms across the Alzheimer disease clinical spectrum. Neurology 97: , e1276–e1287. |
[13] | Ismail Z , Agüera-Ortiz L , Brodaty H , Cieslak A , Cummings J , Fischer CE , Gauthier S , Geda YE , Herrmann N , Kanji J , Lanctôt KL , Miller DS , Mortby ME , Onyike CU , Rosenberg PB , Smith EE , Smith GS , Sultzer DL , Lyketsos C ((2017) ) The Mild Behavioral Impairment Checklist (MBI-C): A rating scale for neuropsychiatric symptoms in pre-dementia populations. J Alzheimers Dis 56: , 929–938. |
[14] | Creese B , Brooker H , Ismail Z , Wesnes KA , Hampshire A , Khan Z , Megalogeni M , Corbett A , Aarsland D , Ballard C ((2019) ) Mild behavioral impairment as a marker of cognitive decline in cognitively normal older adults. Am J Geriatr Psychiatry 27: , 823–834. |
[15] | Ismail Z , Smith EE , Geda Y , Sultzer D , Brodaty H , Smith G , Agüera-Ortiz L , Sweet R , Miller D , Lyketsos CG ((2016) ) Neuropsychiatric symptoms as early manifestations of emergent dementia: Provisional diagnostic criteria for mild behavioral impairment. Alzheimers Dement 12: , 195–202. |
[16] | Monastero R , Mangialasche F , Camarda C , Ercolani S , Camarda R ((2009) ) A systematic review of neuropsychiatric symptoms in mild cognitive impairment. J Alzheimers Dis 18: , 11–30. |
[17] | Lo JW , Crawford JD , Desmond DW , Godefroy O , Jokinen H , Mahinrad S , Bae HJ , Lim JS , Köhler S , Douven E , Staals J , Chen C , Xu X , Chong EJ , Akinyemi RO , Kalaria RN , Ogunniyi A , Barbay M , Roussel M , Lee BC , Srikanth VK , Moran C , Kandiah N , Chander RJ , Sabayan B , Jukema JW , Melkas S , Erkinjuntti T , Brodaty H , Bordet R , Bombois S , Hénon H , Lipnicki DM , Kochan NA , Sachdev PS , Stroke ft , Collaboration C ((2019) ) Profile of and risk factors for poststroke cognitive impairment in diverse ethnoregional groups. Neurology 93: , e2257–e2271. |
[18] | Prasad K , Wiryasaputra L , Ng A , Kandiah N ((2011) ) White matter disease independently predicts progression from mild cognitive impairment to Alzheimer’s disease in a clinic cohort. Dementia Geriatr Cogn Disord 31: , 431–434. |
[19] | Singh V , Dhamoon MS , Alladi S ((2018) ) Stroke risk and vascular dementia in South Asians. Curr Atheroscler Rep 20: , 43. |
[20] | Hilal S , Mok V , Youn YC , Wong A , Ikram MK , Chen CL ((2017) ) Prevalence, risk factors and consequences of cerebral small vessel diseases: Data from three Asian countries. J Neurology Neurosurg Psychiatry 88: , 669–674. |
[21] | Lam BYK , Yiu B , Ampil E , Chen CL , Dikot Y , Dominguez JC , Ganeshbhai PV , Hilal S , Kandiah N , Kim S , Lee JY , Ong AP , Senanarong V , Leung KT , Wang H , Yang YH , Yong T , Arshad F , Alladi S , Wong S , Ko H , Lau AYL , Mok VCT ((2021) ) High burden of cerebral white matter lesion in 9 Asian cities. Sci Rep 11: , 11587. |
[22] | Yatawara C , Ng KP , Lim L , Chander R , Zhou J , Kandiah N ((2019) ) Cerebrovascular disease is a risk for getting lost behavior in prodromal dementia. Am J Alzheimers Dis Other Dement 34: , 344–352. |
[23] | Park JH , Seo SW , Kim C , Kim SH , Kim GH , Kim ST , Jeon S , Lee JM , Oh SJ , Kim JS , Choe YS , Lee KH , Shin JS , Kim CH , Noh Y , Cho H , Yoon CW , Kim HJ , Ye BS , Ewers M , Weiner MW , Lee JH , Werring DJ , Na DL ((2014) ) Effects of cerebrovascular disease and amyloid beta burden on cognition in subjects with subcortical vascular cognitive impairment. Neurobiol Aging 35: , 254–260. |
[24] | Lovibond PF , Lovibond SH ((1995) ) The structure of negative emotional states: Comparison of the Depression Anxiety Stress Scales (DASS) with the Beck Depression and Anxiety Inventories. Behav Res Ther 33: , 335–343. |
[25] | Smith SC , Lamping DL , Banerjee S , Harwood RH , Foley B , Smith P , Cook JC , Murray J , Prince M , Levin E , Mann A , Knapp M ((2007) ) Development of a new measure of health-related quality of life for people with dementia: DEMQOL. Psychol Med 37: , 737–746. |
[26] | Craig CL , Marshall AL , Sjöström M , Bauman AE , Booth ML , Ainsworth BE , Pratt M , Ekelund U , Yngve A , Sallis JF , Oja P ((2003) ) International physical activity questionnaire: 12-country reliability and validity. Med Sci Sports Exerc 35: , 1381–1395. |
[27] | Fried LP , Tangen CM , Walston J , Newman AB , Hirsch C , Gottdiener J , Seeman T , Tracy R , Kop WJ , Burke G , McBurnie MA ; Cardiovascular Health Study Collaborative Research Group ((2001) ) Frailty in older adults: Evidence for a phenotype. J Gerontol A Biol Sci Med Sci 56: , M146–M156. |
[28] | Buysse DJ , Reynolds CF , Monk TH , Berman SR , Kupfer DJ ((1989) ) The Pittsburgh sleep quality index: A new instrument for psychiatric practice and research. Psychiatry Res 28: , 193–213. |
[29] | Youn JC , Kim KW , Lee DY , Jhoo JH , Lee SB , Park JH , Choi EA , Choe JY , Jeong JW , Choo IH , Woo JI ((2009) ) Development of the subjective memory complaints questionnaire. Dement Geriatr Cogn Disord 27: , 310–317. |
[30] | Petersen RC ((2004) ) Mild cognitive impairment as a diagnostic entity. J Intern Med 256: , 183–194. |
[31] | Fazekas F , Ropele S , Enzinger C , Gorani F , Seewann A , Petrovic K , Schmidt R ((2005) ) MTI of white matter hyperintensities. Brain 128: , 2926–2932. |
[32] | Visser PJ , Verhey FR , Hofman PA , Scheltens P , Jolles J ((2002) ) Medial temporal lobe atrophy predicts Alzheimer’s disease in patients with minor cognitive impairment. J Neurol Neurosurg Psychiatry 72: , 491–497. |
[33] | Wardlaw JM , Smith EE , Biessels GJ , Cordonnier C , Fazekas F , Frayne R , Lindley RI , T O’Brien J , Barkhof F , Benavente OR ((2013) ) Neuroimaging standards for research into small vessel disease and its contribution to ageing and neurodegeneration. Lancet Neurol 12: , 822–838. |
[34] | Claus JJ , Staekenborg SS , Holl DC , Roorda JJ , Schuur J , Koster P , Tielkes CEM , Scheltens P ((2017) ) Practical use of visual medial temporal lobe atrophy cut-off scores in Alzheimer’s disease: Validation in a large memory clinic population. Eur Radiol 27: , 3147–3155. |
[35] | Staals J , Makin SD , Doubal FN , Dennis MS , Wardlaw JM ((2014) ) Stroke subtype, vascular risk factors, and total MRI brain small-vessel disease burden. Neurology 83: , 1228–1234. |
[36] | Mourao RJ , Mansur G , Malloy-Diniz LF , Castro Costa E , Diniz BS ((2016) ) Depressive symptoms increase the risk of progression to dementia in subjects with mild cognitive impairment: Systematic review and meta-analysis. Int J Geriatr Psychiatry 31: , 905–911. |
[37] | Apostolova LG , Cummings JL ((2007) ) Neuropsychiatric manifestations in mild cognitive impairment: A systematic review of the literature. Dement Geriatr Cogn Disord 25: , 115–126. |
[38] | Wallensten J , Ljunggren G , Nager A , Wachtler C , Bogdanovic N , Petrovic P , Carlsson AC ((2023) ) Stress, depression, and risk of dementia – a cohort study in the total population between 18 and 65 years old in Region Stockholm. Alzheimers Res Ther 15: , 161. |
[39] | Sabia S , Fayosse A , Dumurgier J , van Hees VT , Paquet C , Sommerlad A , Kivimäki M , Dugravot A , Singh-Manoux A ((2021) ) Association of sleep duration in middle and old age with incidence of dementia. Nat Commun 12: , 2289. |
[40] | Bubu OM , Brannick M , Mortimer J , Umasabor-Bubu O , Sebastião YV , Wen Y , Schwartz S , Borenstein AR , Wu Y , Morgan D , Anderson WM ((2016) ) Sleep, cognitive impairment, and Alzheimer’s disease: A systematic review and meta-analysis. Sleep 40: , doi: 10.1093/sleep/zsw032. |
[41] | McEwen BS , Gianaros PJ ((2010) ) Central role of the brain in stress and adaptation: Links to socioeconomic status, health, and disease. Ann N Y Acad Sci 1186: , 190–222. |
[42] | Rasgon NL , Kenna HA ((2005) ) Insulin resistance in depressive disorders and Alzheimer’s disease: Revisiting the missing link hypothesis. Neurobiol Aging 26: , 103–107. |


