
The Case of the Cookie Jar: Differences in Typical Language Use in Dementia
Abstract
Background:
Findings from language sample analyses can provide efficient and effective indicators of cognitive impairment in older adults.
Objective:
This study used newly automated core lexicon analyses of Cookie Theft picture descriptions to assess differences in typical use across three groups.
Methods:
Participants included adults without diagnosed cognitive impairments (Control), adults diagnosed with Alzheimer’s disease (ProbableAD), and adults diagnosed with mild cognitive impairment (MCI). Cookie Theft picture descriptions were transcribed and analyzed using CLAN.
Results:
Results showed that the ProbableAD group used significantly fewer core lexicon words overall than the MCI and Control groups. For core lexicon content words (nouns, verbs), however, both the MCI and ProbableAD groups produced significantly fewer words than the Control group. The groups did not differ in their use of core lexicon function words. The ProbableAD group was also slower to produce most of the core lexicon words than the MCI and Control groups. The MCI group was slower than the Control group for only two of the core lexicon content words. All groups mentioned a core lexicon word in the top left quadrant of the picture early in the description. The ProbableAD group was then significantly slower than the other groups to mention a core lexicon word in the other quadrants.
Conclusions:
This standard and simple-to-administer task reveals group differences in overall core lexicon scores and the amount of time until the speaker produces the key items. Clinicians and researchers can use these tools for both early assessment and measurement of change over time.
Speech and language abilities are important factors in detecting cognitive impairments in older adults.1–5 They are especially important given that evaluation of speech and language can be simple, convenient, and non-invasive compared with many other diagnostic procedures.6 Traditionally, using discourse-level language to investigate the lexical/semantic system in this group has been challenging due to the time and expertise required to collect, transcribe, and analyze large numbers of discourse samples.7,8 However, shared databases and advances in computer technology, natural language processing, and machine learning procedures have vastly improved our ability to use connected speech as an efficient and non-invasive classification and measurement tool.9,10
Automatic detection of dementia from connected speech has achieved varying degrees of accuracy depending on which classifiers and features are used. Most studies report accuracies ranging from mid-70% to mid-80%, and the best performing analyses reach close to 90% accuracy (see reviews).6,11–13 Many of these studies analyze Cookie Theft picture descriptions from the Pitt corpus in DementiaBank1.14,15 These techniques use various speech and language features (e.g., lexical, acoustic, temporal) from relatively short language samples to produce algorithms that can successfully detect dementia. It would be advantageous to find ways to translate some of that machine learning knowledge and expertise to the clinic.
Core lexicon is a discourse analysis tool developed from large, shared databases that use standard elicitation protocols, standard transcription formats (CHAT, https://talkbank.org/manuals/CHAT.pdf), and automated language analysis programs (CLAN, https://dali.talkbank.org/clan/).16 Core lexicon analysis measures the “typicality” of words used in discourse based on normative data (words produced by 50% or more of controls who did the task).17 It has the advantage of being straightforward and low-tech for busy clinicians. In fact, core lexicon can be reliably scored without transcription, alleviating one of the primary barriers to discourse analysis in clinical practice.18 Core lexicon may be particularly useful in dementia, since adults with Alzheimer’s disease (AD) and mild cognitive impairment (MCI) often use less precise language than adults without cognitive impairments and would likely score lower on the total number of core lexicon items produced. The lexical/semantic system is most vulnerable to cognitive impairment in dementia, and language is often described as “empty”.19–21 Thus, early indications of impairment from a simple language task could facilitate early intervention such as clinical drug trials, external memory aid treatments, counseling, or lifestyle changes.
Slegers et al. conducted a systematic review of connected speech features from picture descriptions by individuals with Alzheimer’s disease across languages and reported that 61% used the Cookie Theft picture.22 A core lexicon checklist for this task was developed by Dalton et al. using transcripts from 45 healthy controls in the Pitt corpus in DementiaBank.23 The list consists of 26 words, including 12 function words (determiners, pronouns, prepositions, etc.) and 14 content words (nouns, verbs). Croisile et al. created a list of 23 information units created for the Cookie Theft picture based on the four categories of subjects, place, objects, and actions that has been used to analyze differences between groups with and without dementia.20 Another list of 23 information units was derived from Swedish and English speakers’ Cookie Theft picture descriptions using cluster models.24 The difference between these lists and the core lexicon list is that the core lexicon list contains additional function words.
Core lexicon scoring is straightforward, with 1 point given for each word produced from the checklist, regardless of the number of times it is produced. Importantly, inflected forms of core lexicon items receive credit (e.g., if wash is a core lexicon item, wash, washing, and washed are acceptable forms), but synonyms do not (e.g., scrub would not receive credit for the item wash, woman would not receive credit for the item mother). Therefore, core lexicon scores should not be interpreted as a measure of overall informativeness of a discourse sample. In this regard, core lexicon analysis may be even more sensitive to language changes in MCI and AD, because in the early stages of dementia onset, overall informativeness is likely still relatively intact. Additionally, the inclusion of function words in core lexicon scores may give insight into the status of grammar and syntax.
Fraser et al. (2019) reviewed speech and language findings for the Cookie Theft picture task in this population, focusing specifically on measures of information content, which are consistently reported to be reduced in AD.24 Previous studies have shown that groups with and without dementia differ in the production of information units on the Cookie Theft description task, with AD groups producing fewer information units.20,25,26 Bschor et al. found that German-speaking individuals with MCI did not differ significantly from the control group on the number of persons and objects, localizations, and actions mentioned.27 Measures of efficiency (e.g., information units per second) are also reported to be reduced in AD, as individuals with AD use more time to produce fewer relevant words.3,25,28,29 Fraser et al. (2019) reported that MCI group participants produced relevant information units at a significantly slower rate than controls, while not differing significantly in overall speaking rate.24 The analysis was based on computing information efficiency (number of relevant information units, divided by the total time). Newly available automated word alignment analyses may allow for a related temporal measure of the elapsed time until essential lexical information is produced. This measure would give clinicians an additional tool to use when assessing individuals with complaints of cognitive impairments.30 Recent work on pauses in connected speech reinforces the use of temporal features in early diagnosis of AD.31
The analysis of core lexicon (both word production and timing) can also incorporate visuospatial aspects of the picture to explore dementia-related changes such as figure-ground analysis, agnosia, and visual perceptual organization.32–34 Quadrants and methods such as spatio-semantic graphs and various eye-tracking and image-text alignment procedures have been used in conjunction with linguistic analyses of the Cookie Theft picture in this population.35–43 These studies have reported significant differences between cognitively impaired and unimpaired groups as well as improved results for automatic classification when adding visual processing features.
The goals for this project were to better understand the linguistic behaviors that underlie the performance of these automated classification models. To accomplish this, we asked the following questions:
1. Do the groups differ in total number of core lexicon words produced?
2. Do the groups differ in the elapsed time before core lexicon content words (nouns, verbs) are produced?
3. In terms of visuospatial processing, do the groups differ in elapsed time before core lexicon content words are produced for each quadrant of the picture?
METHODS
Participants
Participants with diagnoses of ProbableAD2 (n = 122), MCI (n = 48), and no cognitive impairment (n = 90) were drawn from the Pitt corpus (https://dementia.talkbank.org/access/English/Pitt.html) and the Delaware corpus (https://dementia.talkbank.org/access/English/Lanzi.html) in the DementiaBank database.15,44 Diagnosis of MCI was done according to the diagnostic guidelines of 1) concern regarding a change in cognition, 2) impairment in one or more cognitive domains, and 3) preservation of independence in functional abilities.46 Diagnosis of ProbableAD in the Pitt corpus (described fully in Becker et al.15) was done by a study team following an extensive neuropsychiatric evaluation including medical history and physical examination, neurologic history and examination, psychiatric interview, neuropsychological assessment, and various laboratory studies (e.g., hematologic studies, liver and thyroid function tests), EEGs, and CT scans. The ProbableAD diagnosis was based on a history of progressive cognitive and functional decline and an abnormal mental status examination. The procedures involving collection of language samples were done in accord with the ethical standards of the Institutional Review Boards at the University of Pittsburgh and the University of Delaware, where the work was done. All participants with those diagnoses who completed the Cookie Theft picture description task from the Boston Diagnostic Aphasia Exam were included.14 The Pitt corpus is the largest publicly available speech corpus including individuals with and without dementia and has been used in over 300 scientific publications. Severity of dementia was measured using the Mini-Mental Status Exam.47 Though the Pitt corpus is from a longitudinal study, only participants’ first visits were included in this study. The Delaware corpus is the newest shared database in DementiaBank. Data collection is ongoing, using a standard discourse protocol and elicitation methods to further the study of speech and language in older adults at risk for dementia. Severity of dementia was measured using the Montreal Cognitive Assessment (MoCA).48 Demographic data are provided in Table 1.
Table 1
Participant demographics and language sample data
| ProbableAD | MCI | Control | |
| Pitt | n = 122 | n = 15 | n = 70 |
| Delaware | NA | n = 33 | n = 20 |
| Age – mean (SD) | 71.41 (4.4) | 72.23 (4.9) | 64.86 (4.2) |
| Sex | 30% M, 70% F | 50% M, 50% F | 36% M, 64% F |
| Education – mean (SD) | 11.83 (2.7) | 16.23 (2.2) | 14.51 (2.6) |
| MMSE – mean (SD) | 19.40 (2.3) | 28.00 (0.7) | 29.09 (0.55) |
| MoCA – mean (SD) | NA | 24.03 (1.1) | 27.55 (0.8) |
| Total words – mean (SD) | 96 (51.8) | 102 (60.1) | 108 (54.75) |
| Time (s) – mean (SD) | 69.8 (40.2) | 49.9 (31.8) | 56.3 (26.79) |
Procedures
Language samples were transcribed in CHAT format and analyzed using automated commands from the CLAN program. CLAN is freely downloadable software (https://dali.talkbank.org/clan/) that includes the CHAT editor and allows for automated analysis of linguistic and discourse structures.49 Two new CLAN commands were used: 1) the basic CORELEX command, which searches for lemmas on the morphological tier of the CHAT transcript (% mor) to compute the total number of Cookie Theft core lexicon words (see the Supplementary Material) produced in the sample at least once;17 and 2) a modified version of the basic CORELEX command that searches on the word alignment tier of the transcript (% wor) to compute the time until a given word from the core lexicon was used. The example below shows a Participant’s (PAR) utterance from a CHAT transcript. The main speaker tier, *PAR, shows the speaker’s output with the utterance time stamp (in ms); the % wor tier has timestamps for each word; and the % mor tier has part-of-speech and morphological tagging for the utterance. Once a language sample is transcribed and linked to the media file, the % wor tier is created automatically using an automated Batchalign command and the % mor tier is created automatically with the MOR command in CLAN.30
1 *PAR: mom &-uh washing or drying dishes. •9650_13350•
2 % wor: mom •9650_10260•&-uh •10260_10660•washing •11400_11810•or
3 •11810_12010•drying •12010_12570•dishes •12570_13350•.
4 % mor: n|mom part|wash-PRESP coord|or part|dry-PRESP n|dish-PL.
For this utterance, the CORELEX command would score one point each for the production of mom, dry, and dish, which are three of the 26 words in the Cookie Theft core lexicon checklist. As described in Dalton et al., three CLAN commands were used to acquire the basic core lexicon results for the full dataset.17
1 chstring +q1 *.cha was used on the original CHAT transcripts to remove revision codes and underscores (e.g., all_of_a_sudden) and replace target replacements for paraphasias (e.g., chair [: stool]) with double colons (chair [:: stool]). These changes allowed the revised words and each element of the underscored words to be parsed on the % mor tier where the CORELEX command looks for lemmas. The double colon, on the other hand, prevents the target replacement word from being parsed on the % mor tier, and instead uses whatever word was spoken by the participant.
2 mor *.chstr.cex was run on the new files created from step 1 so that: a) any core lexicon words that may have been spoken but then revised would be counted; and b) any target replacement words that actually had not been spoken (e.g., stool if the speaker actually said chair) would NOT be counted.
3 corelex +lcookie +t*par *.chstr. cex was run on the new files created from step 2, producing a spreadsheet showing which words from the core lexicon checklist were used.
Timing data were computed in msec from the beginning of the participant’s description of the picture until the time when each content word was first produced using this command: corelex +lcookie-short +t*par +w *.cha. Looking at the % wor tier for the sentence in the example above, if this is the participant’s first production of dry (at 12,010 ms) and the participant began describing the picture at 4,389 ms into the transcript (after Investigator prompts and such), the CLAN program would subtract 4,389 from 12,010 and report that the participant first said a word containing the lemma dry at 7,621 ms. While the full core lexicon checklist includes function words and content words, this timing analysis used only content words from the core lexicon list (the ones with an asterisk in the Supplementary Material). It was considered less interesting to determine, for example, when the first a or and appeared in the transcript. (Note: The % wor tier does not require any preliminary steps, as it includes revised words and excludes target replacement words from the main speaker tier.)
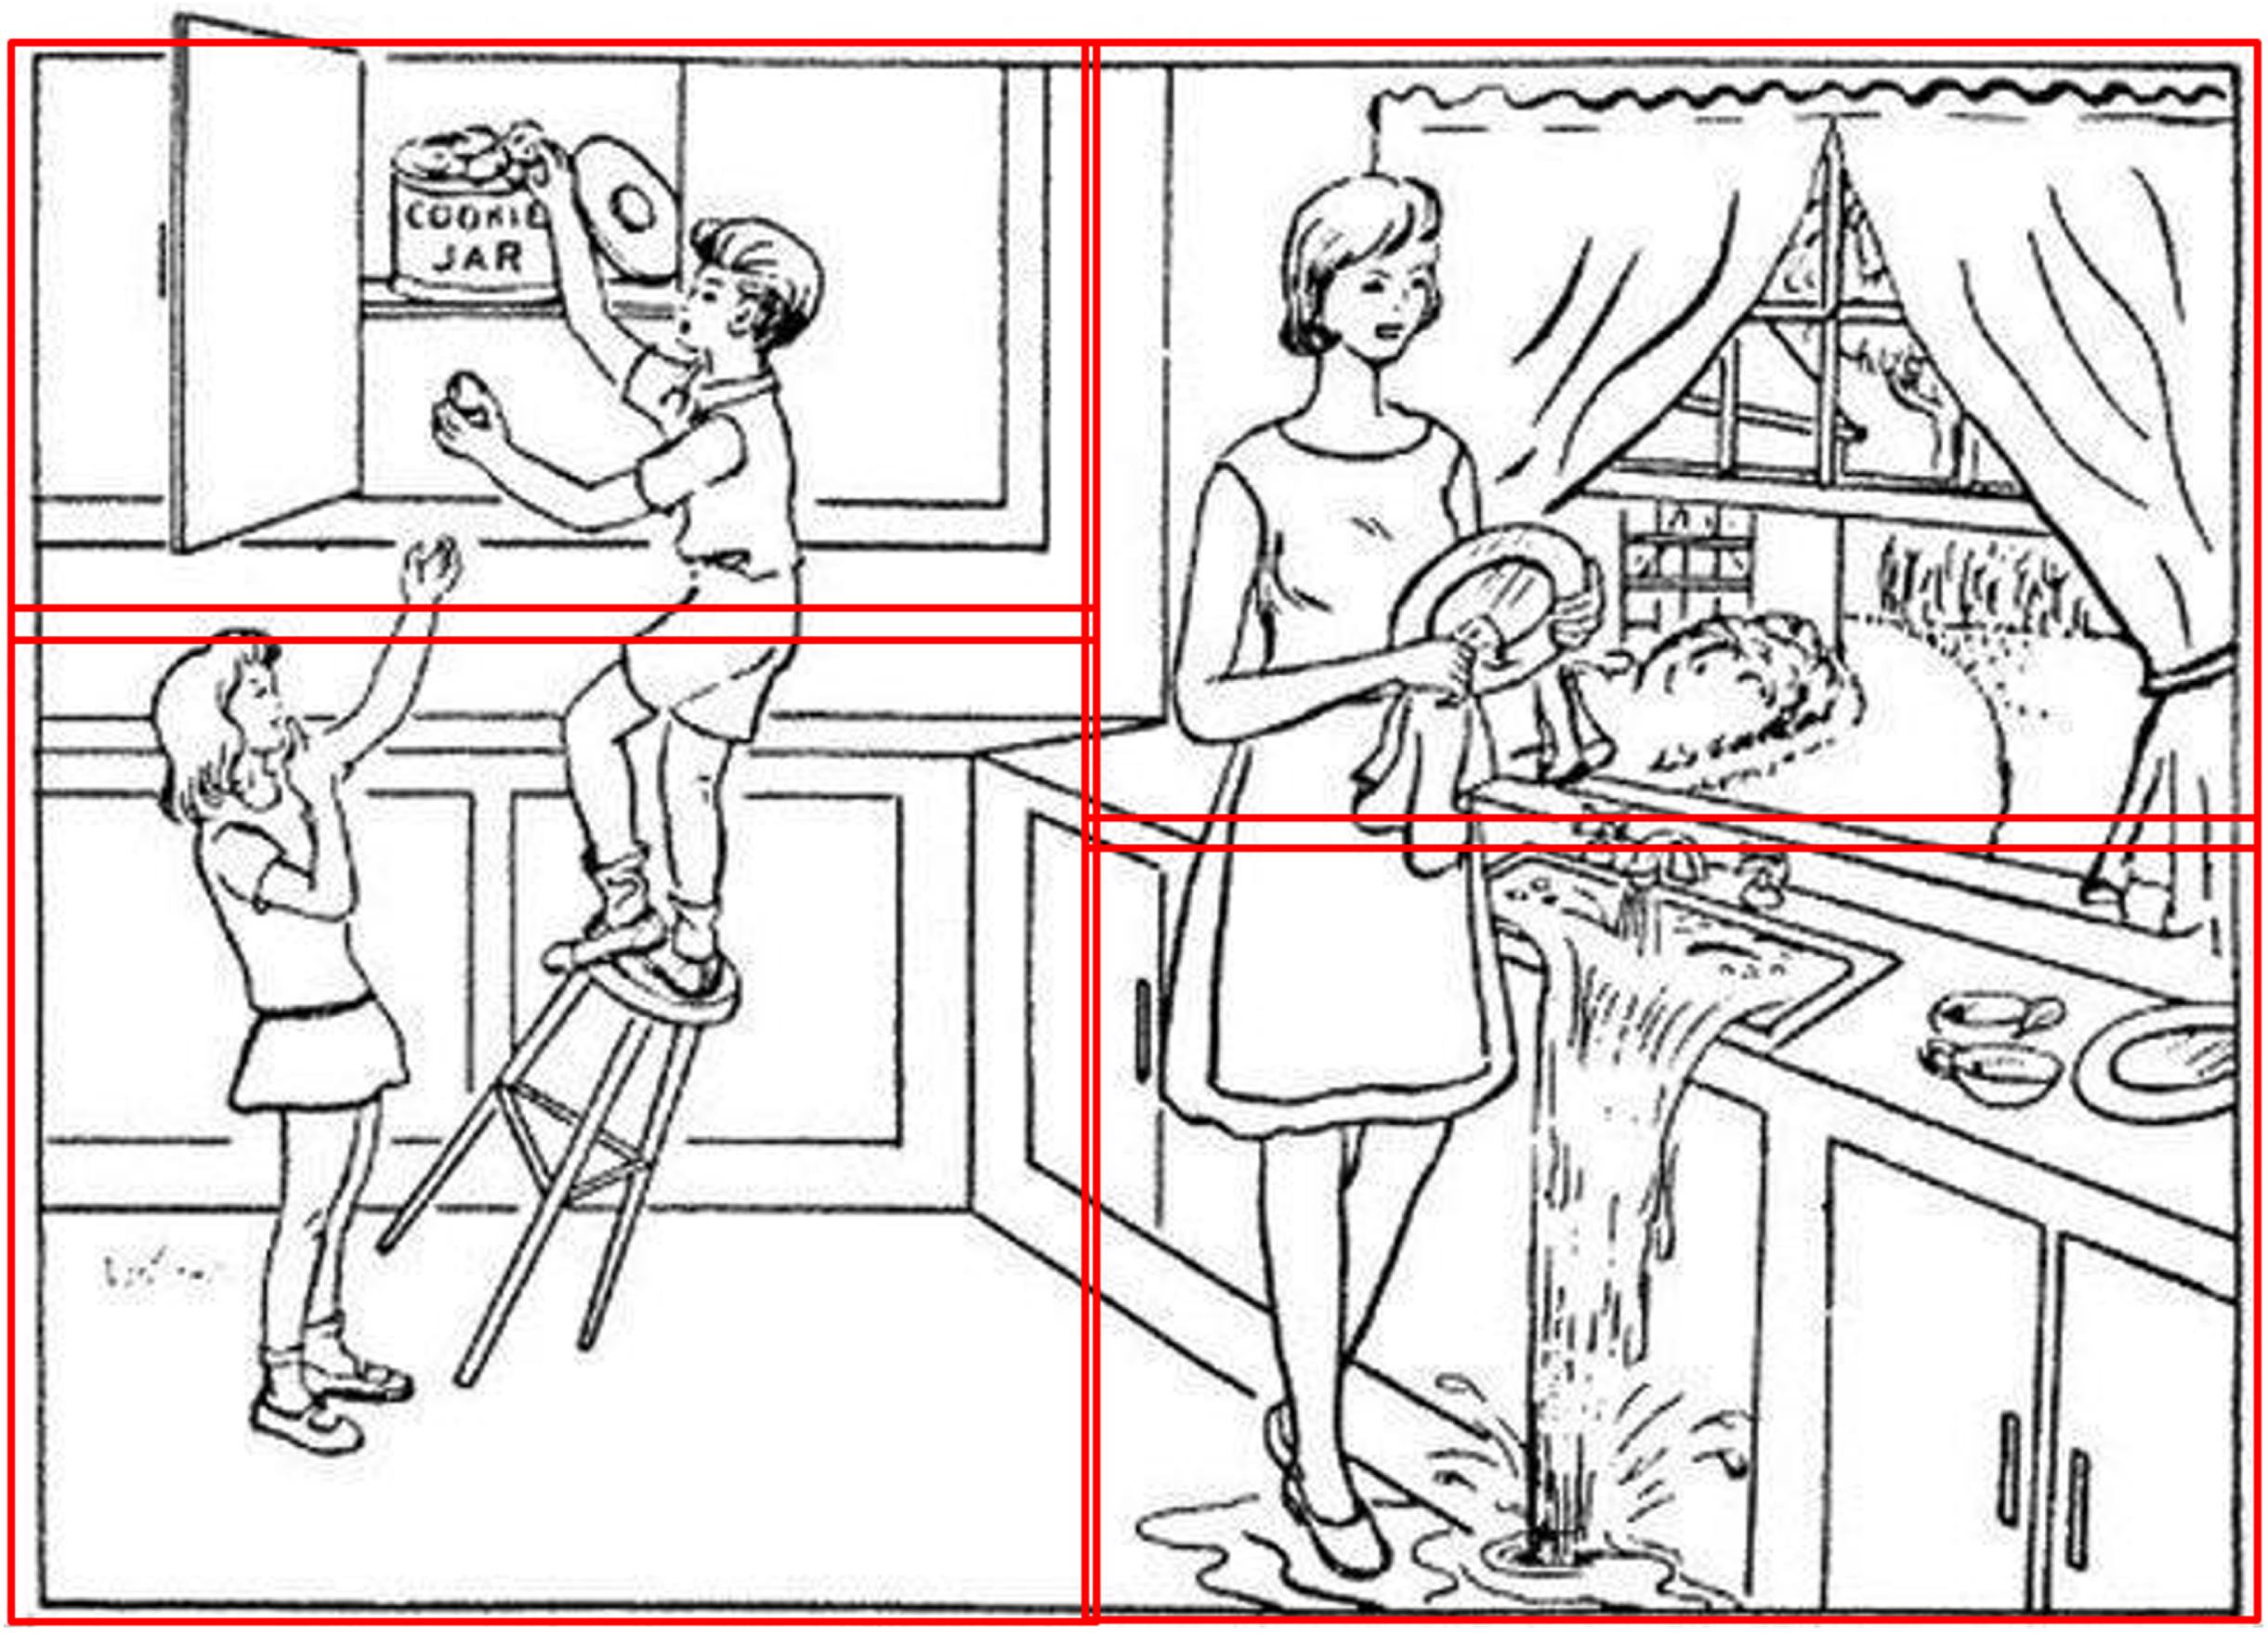
Finally, the content words were broken into quadrants, such that each word unambiguously belonged to a particular quadrant, as can be seen in the Cookie Theft picture in Fig. 1: Top Left included cookie, jar, boy; Top Right included mom, window, dish, dry; Bottom Left included fall, stool, girl; and Bottom Right included run, sink, water, flow. To accommodate the quadrant analyses, the content words excluded the copula be and the light verb get, as those could not be reliably attached to a specific action.
Fig. 1
Cookie Theft picture quadrants.
Statistical analysis
ANOVA was used to determine if there was a difference in the means of total number of core lexicon words produced at least once by each group. We used survival analysis to investigate the rate at which each core lexicon word was expressed by a given point in time (i.e., the hazard rate) and used the survival curve, a function of the hazard rate, to display the distribution of the time until a core lexicon word was said. Kaplan-Meier estimates of the survival curves were used to visualize the distribution of the time (t) until each core lexicon word is said across the different groups of subjects.50 We display the complement of the usual Kaplan-Meier curve, plotting the percentage of people in each group who by time t have said a specific word of interest. For ease of reference, we also refer to these complement curves as Kaplan-Meier curves. By comparing the curves, one can see how the groups differed in the time elapsed before they said the word in question. The log-rank statistical test was used to compare the time distributions and determine whether the differences in time elapsed among the three groups were statistically significant; that is, testing the null hypothesis of no difference in the rate at which each core lexicon word was expressed among the groups. The Cox proportional hazards model was used to assess differences in the time distributions between the groups controlling for age, sex, and education.50
RESULTS
Analysis of group differences
ANOVA tests and Tukey post-hoc analyses revealed that the control group was significantly different (younger) in age from the MCI and ProbableAD groups (p < 0.001), but the MCI and ProbableAD groups did not differ significantly from each other. All groups differed significantly (p < 0.001) in years of education, with the ProbableAD group having the least and the MCI group having the most. The groups did not differ significantly in proportion of males and females (p > 0.05).
The average number of words used by each group in the picture description task and the average number of seconds spent on the task appear in Table 1. For number of words, the groups were not significantly different (F = 2.33486, p = 0.99). However, for duration, groups differed (F = 7.17405, p = 0.000929), with the MCI group spending the least amount of time, the ProbableAD group spending the most, and the Control group in between. Post-hoc testing revealed a significant difference between the MCI and ProbableAD groups (Q = 4.98, p = 0.00148). The average words per minute on this task were 120 (SD = 33.4) for the Control group, 128 (SD = 33) for the MCI group, and 89 (SD = 30.7) for the ProbableAD group.
Overall core lexicon differences across groups
Figure 2 shows the empirical cumulative distribution function (cdf) of the total number of unique core lexicon words (max = 26) produced by each group. The horizontal axis shows the number of core lexicon words produced, x, and the vertical axis shows the cumulative proportion of participants who expressed x-number of words or less. This graph allows us to visually compare the proportions of the distributions of total number of core lexicon words produced for each group. Visual inspection of the figure, for example, indicates that whereas about 50% of the controls produced around x = 20 words or fewer, 50% of the MCI and ProbableAD subjects produced about x = 18 words or fewer. Interestingly, the 75th percentile for both the MCI and Probable AD groups was about x = 20 words, the median for the distribution of the Controls. In sum, the distribution of the total number of core lexicon words produced for the Controls is shifted to the right of the respective distributions for the MCI and Probable AD groups. Formally, a one-way ANOVA test with 3 levels (Control, MCI, and ProbableAD) indicated a statistically significant difference in the number of unique core lexicon words said across the three groups (F = 7.62; p < 0.001). Tukey pairwise tests confirmed a significant difference between the Control and ProbableAD groups (p < 0.001) and no statistically significant differences between the Control and MCI groups (p = 0.159) or the MCI and ProbableAD groups (p = 0.438).
Fig. 2
Cumulative distribution of core lexicon words produced.
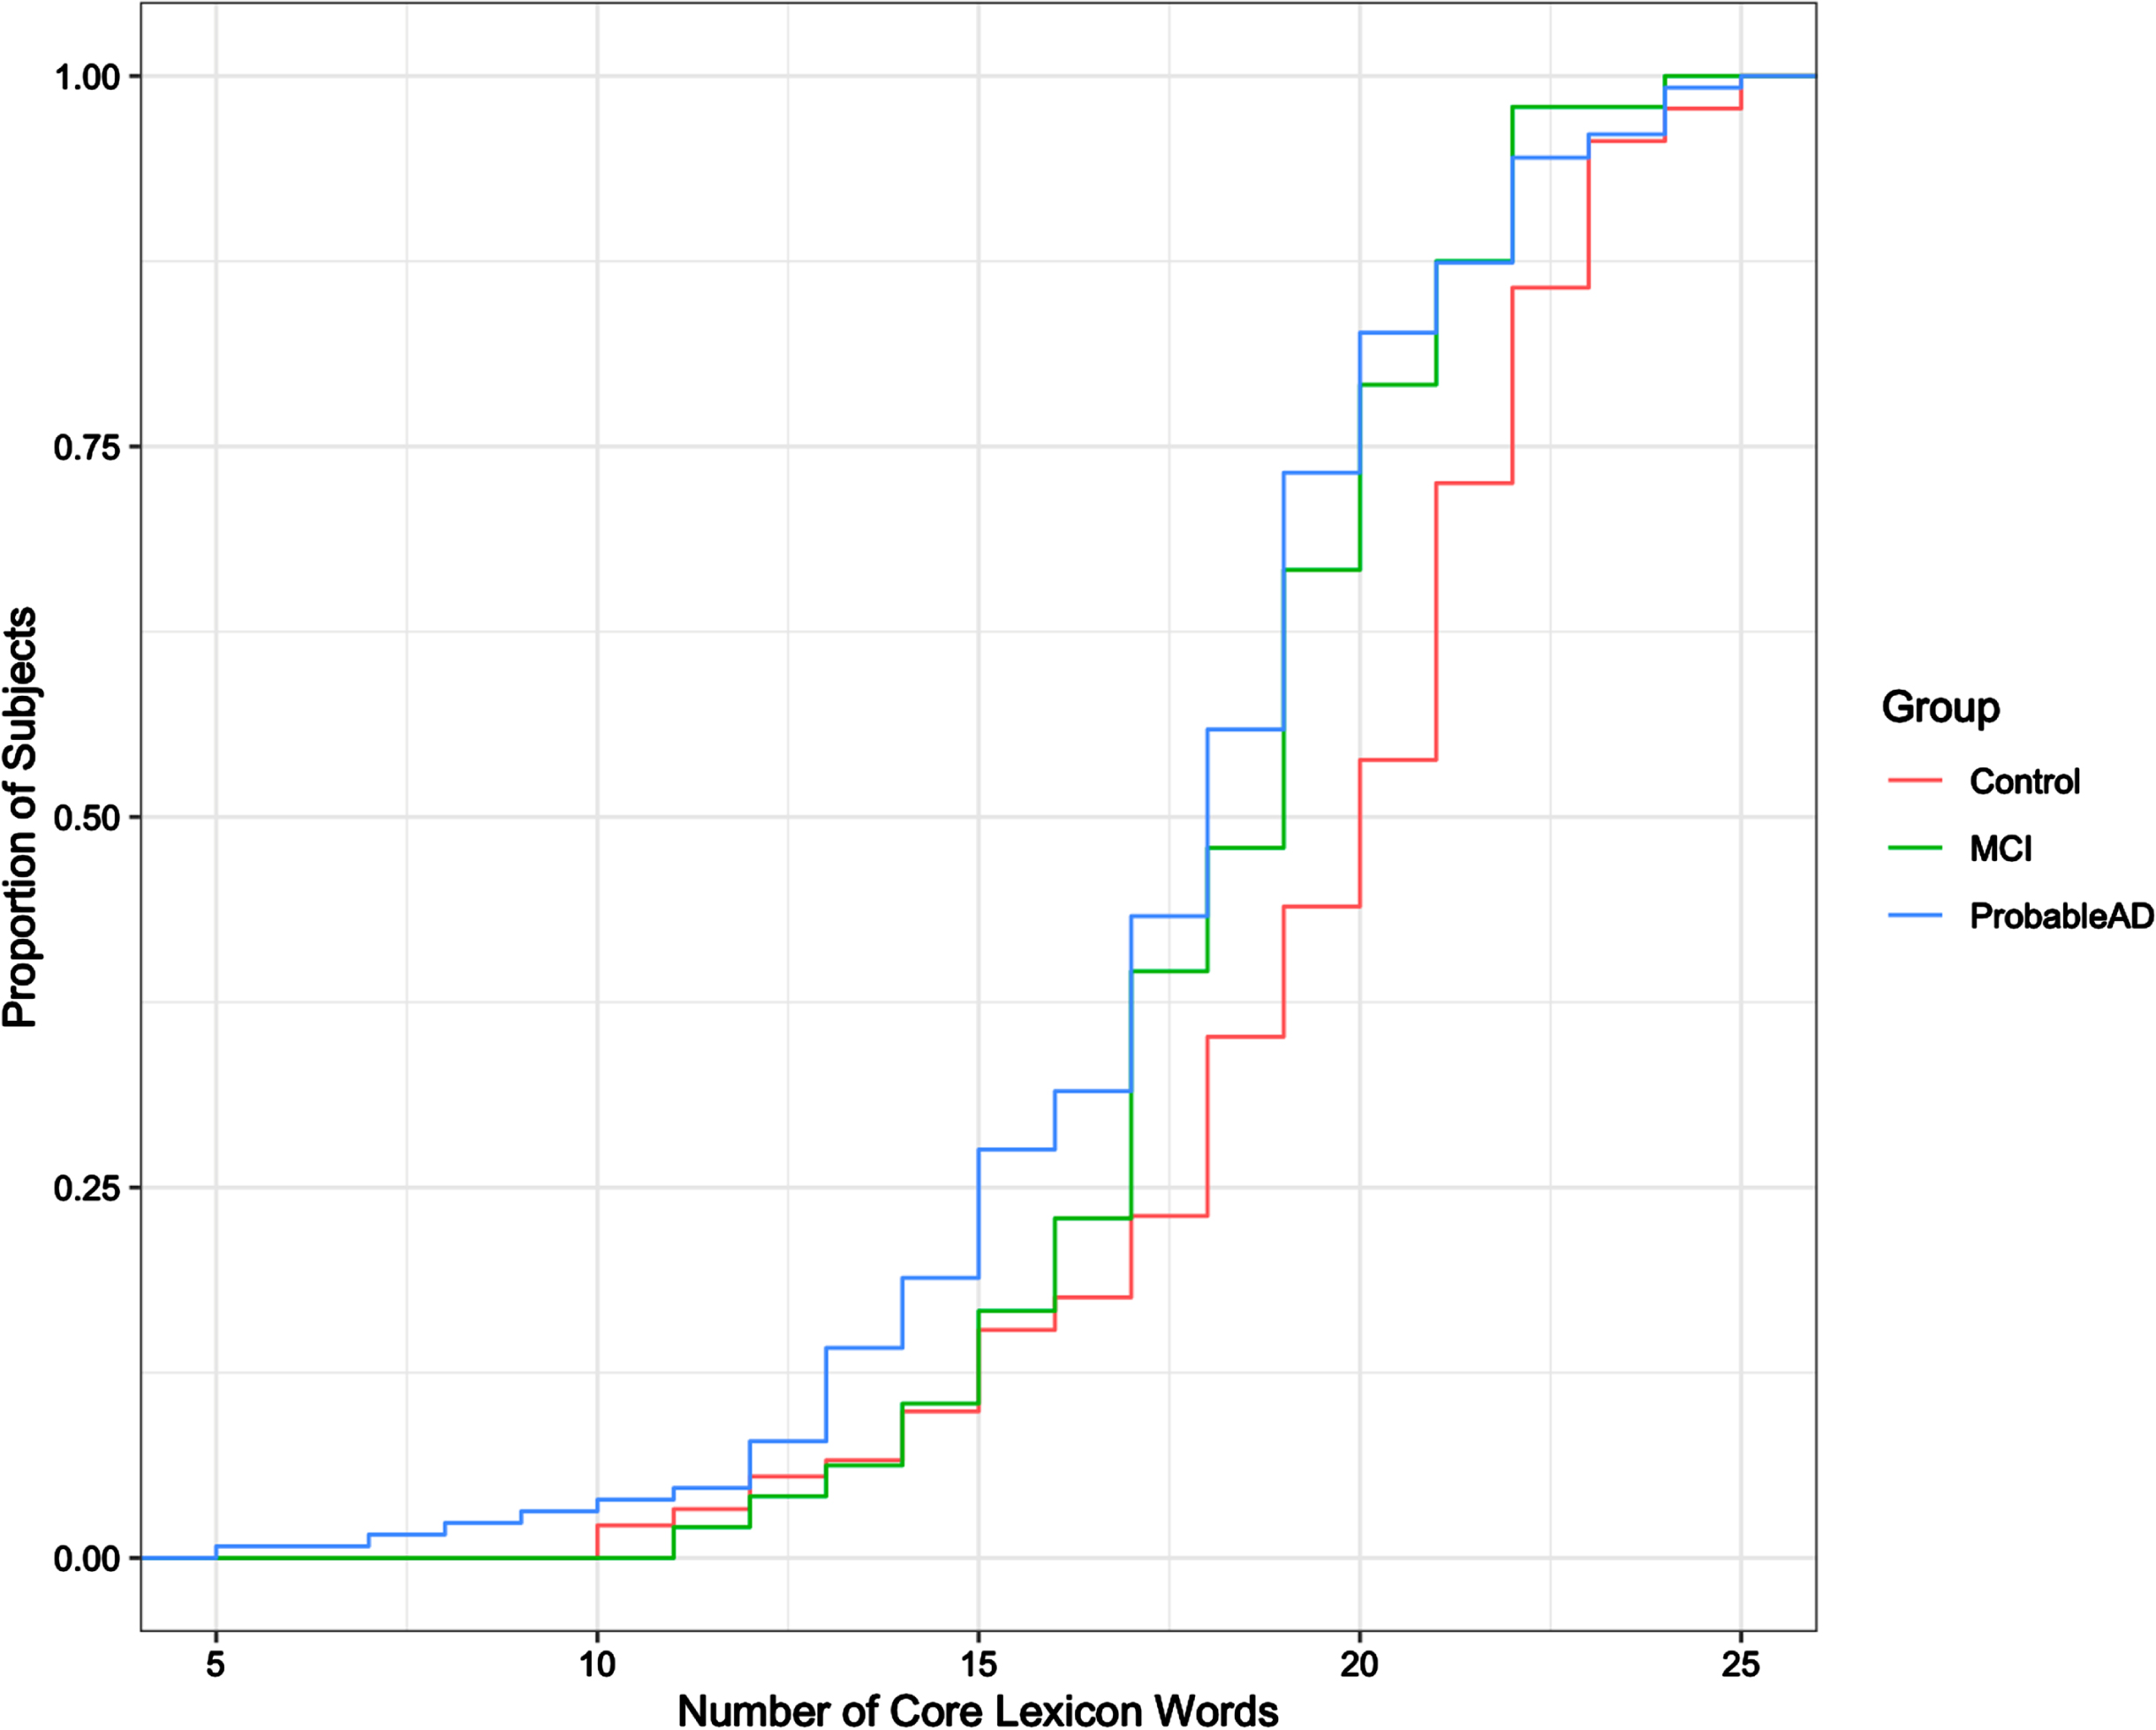
Figure 2 reveals another interesting feature about the performance of these groups. After about 17 or 18 words, the MCI group’s cdf curve begins to look more like the ProbableAD group and less like the Control group, suggesting that the MCI group may be a mixture of individuals, some of whom performed more like the ProbableAD group. A one-way ANOVA test was conducted to analyze this feature. Participants from each of the three groups were divided into two subgroups based on the number of unique core lexicon words they produced: subgroup 1 included participants who produced 18 or fewer core lexicon words; subgroup 2 included those who produced more than 18 core lexicon words. For subgroup 1, no significant difference was found across participant groups in the number of core lexicon words produced (F = 0.861; p = 0.425). For subgroup 2, however, the number of core lexicon words produced was significantly different across participant groups (F = 5.171; p = 0.007). Follow-up pairwise comparisons, via a Tukey test, showed that the Control group differed significantly from the MCI (p = 0.029) and ProbableAD groups (p = 0.018), and there was no significant difference between the MCI and ProbableAD groups (p = 0.907). Thus, a significant difference emerged when the MCI group was subdivided based on the cdf, suggesting that the proportion of individuals in the MCI group who produced more than 18 core lexicon words was, in fact, more like that of the ProbableAD group. For participants who produced fewer than 18 core lexicon words, the groups could not be differentiated, as can be seen by the close overlapping lines on the cdf graph to the left of 18 on the horizontal axis.
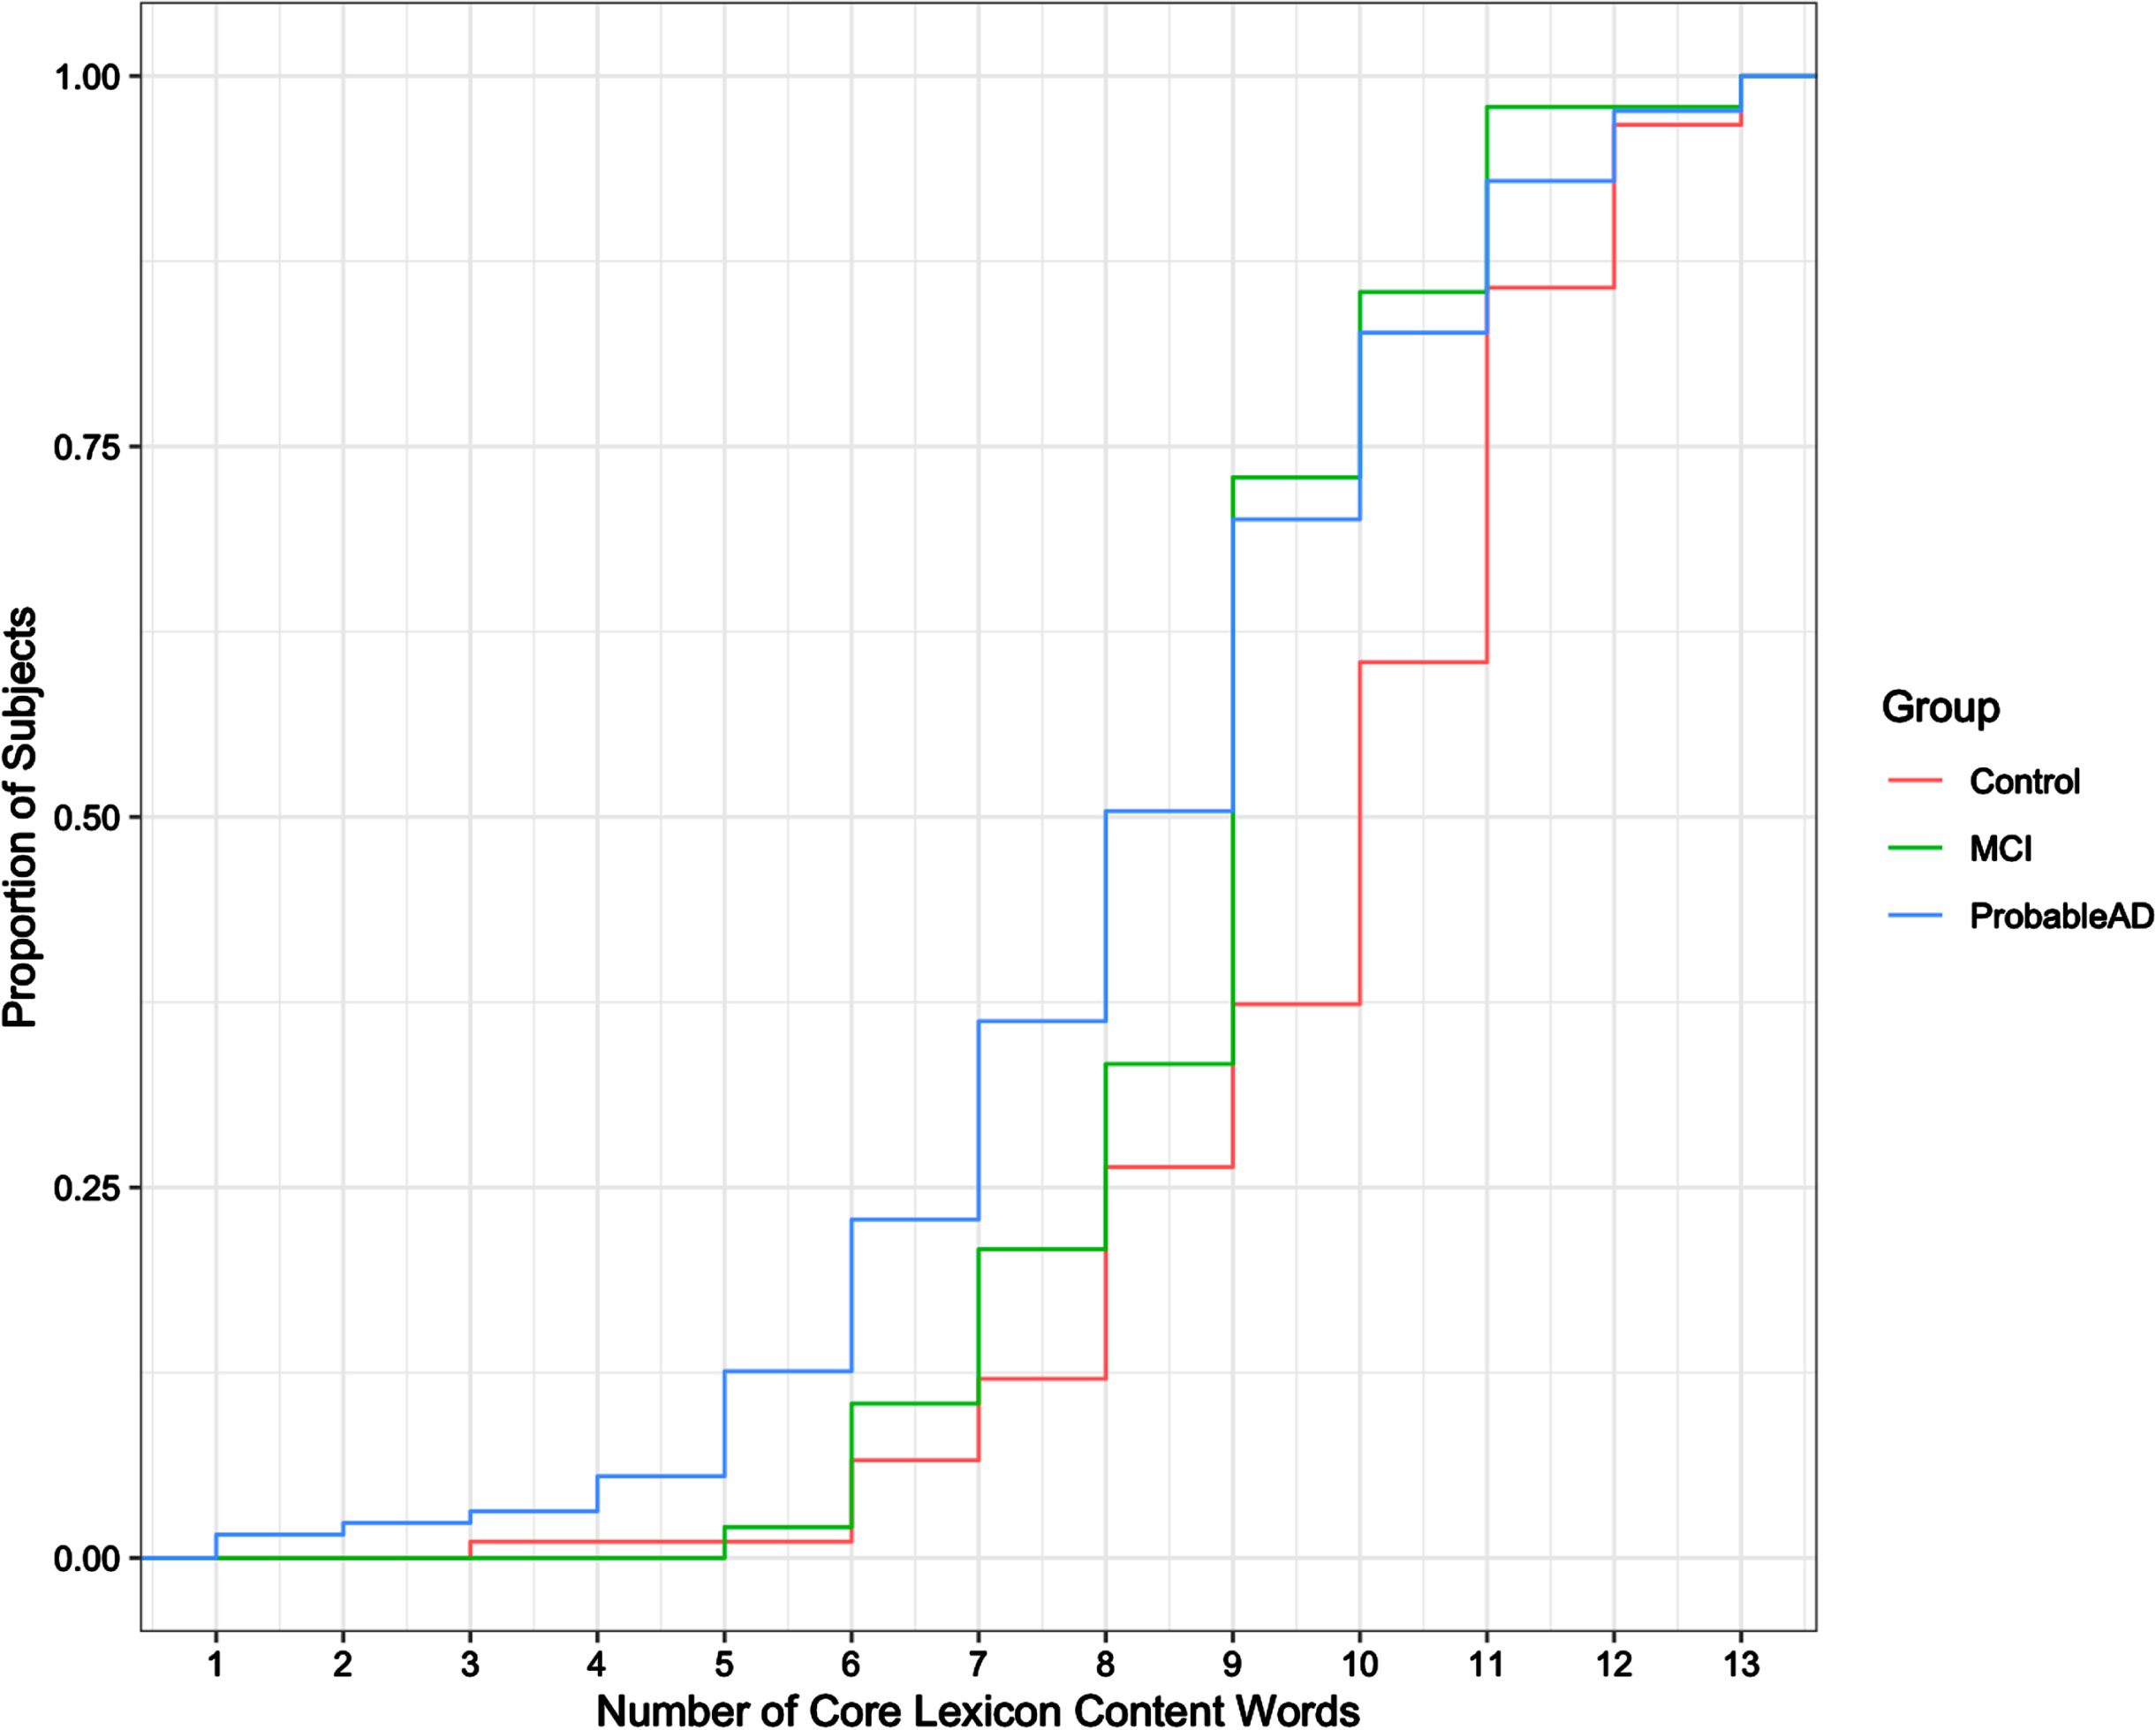
To explore these results further, we examined the function words and the content words separately. Figure 3 shows the cdf of the total number of unique core lexicon function words (max = 12) produced by each of the groups. A one-way ANOVA test with 3 levels indicated no significant difference among the groups (F = 0.763, p = 0.467) for function words. Figure 4 shows the cdf of the total number of unique core lexicon content words (max = 14) produced by each group. As the cdf suggests, the difference for content words was significant (F = 13.33, p < 0.001). Tukey pairwise tests confirmed that the Control group differed significantly from both the ProbableAD group (p < 0.001) and the MCI group (p < 0.05) for core lexicon content words. The difference between the MCI and ProbableAD groups for content words, however, was not significant (p = 0.248).
Fig. 3
Cumulative distribution of core lexicon function words produced.
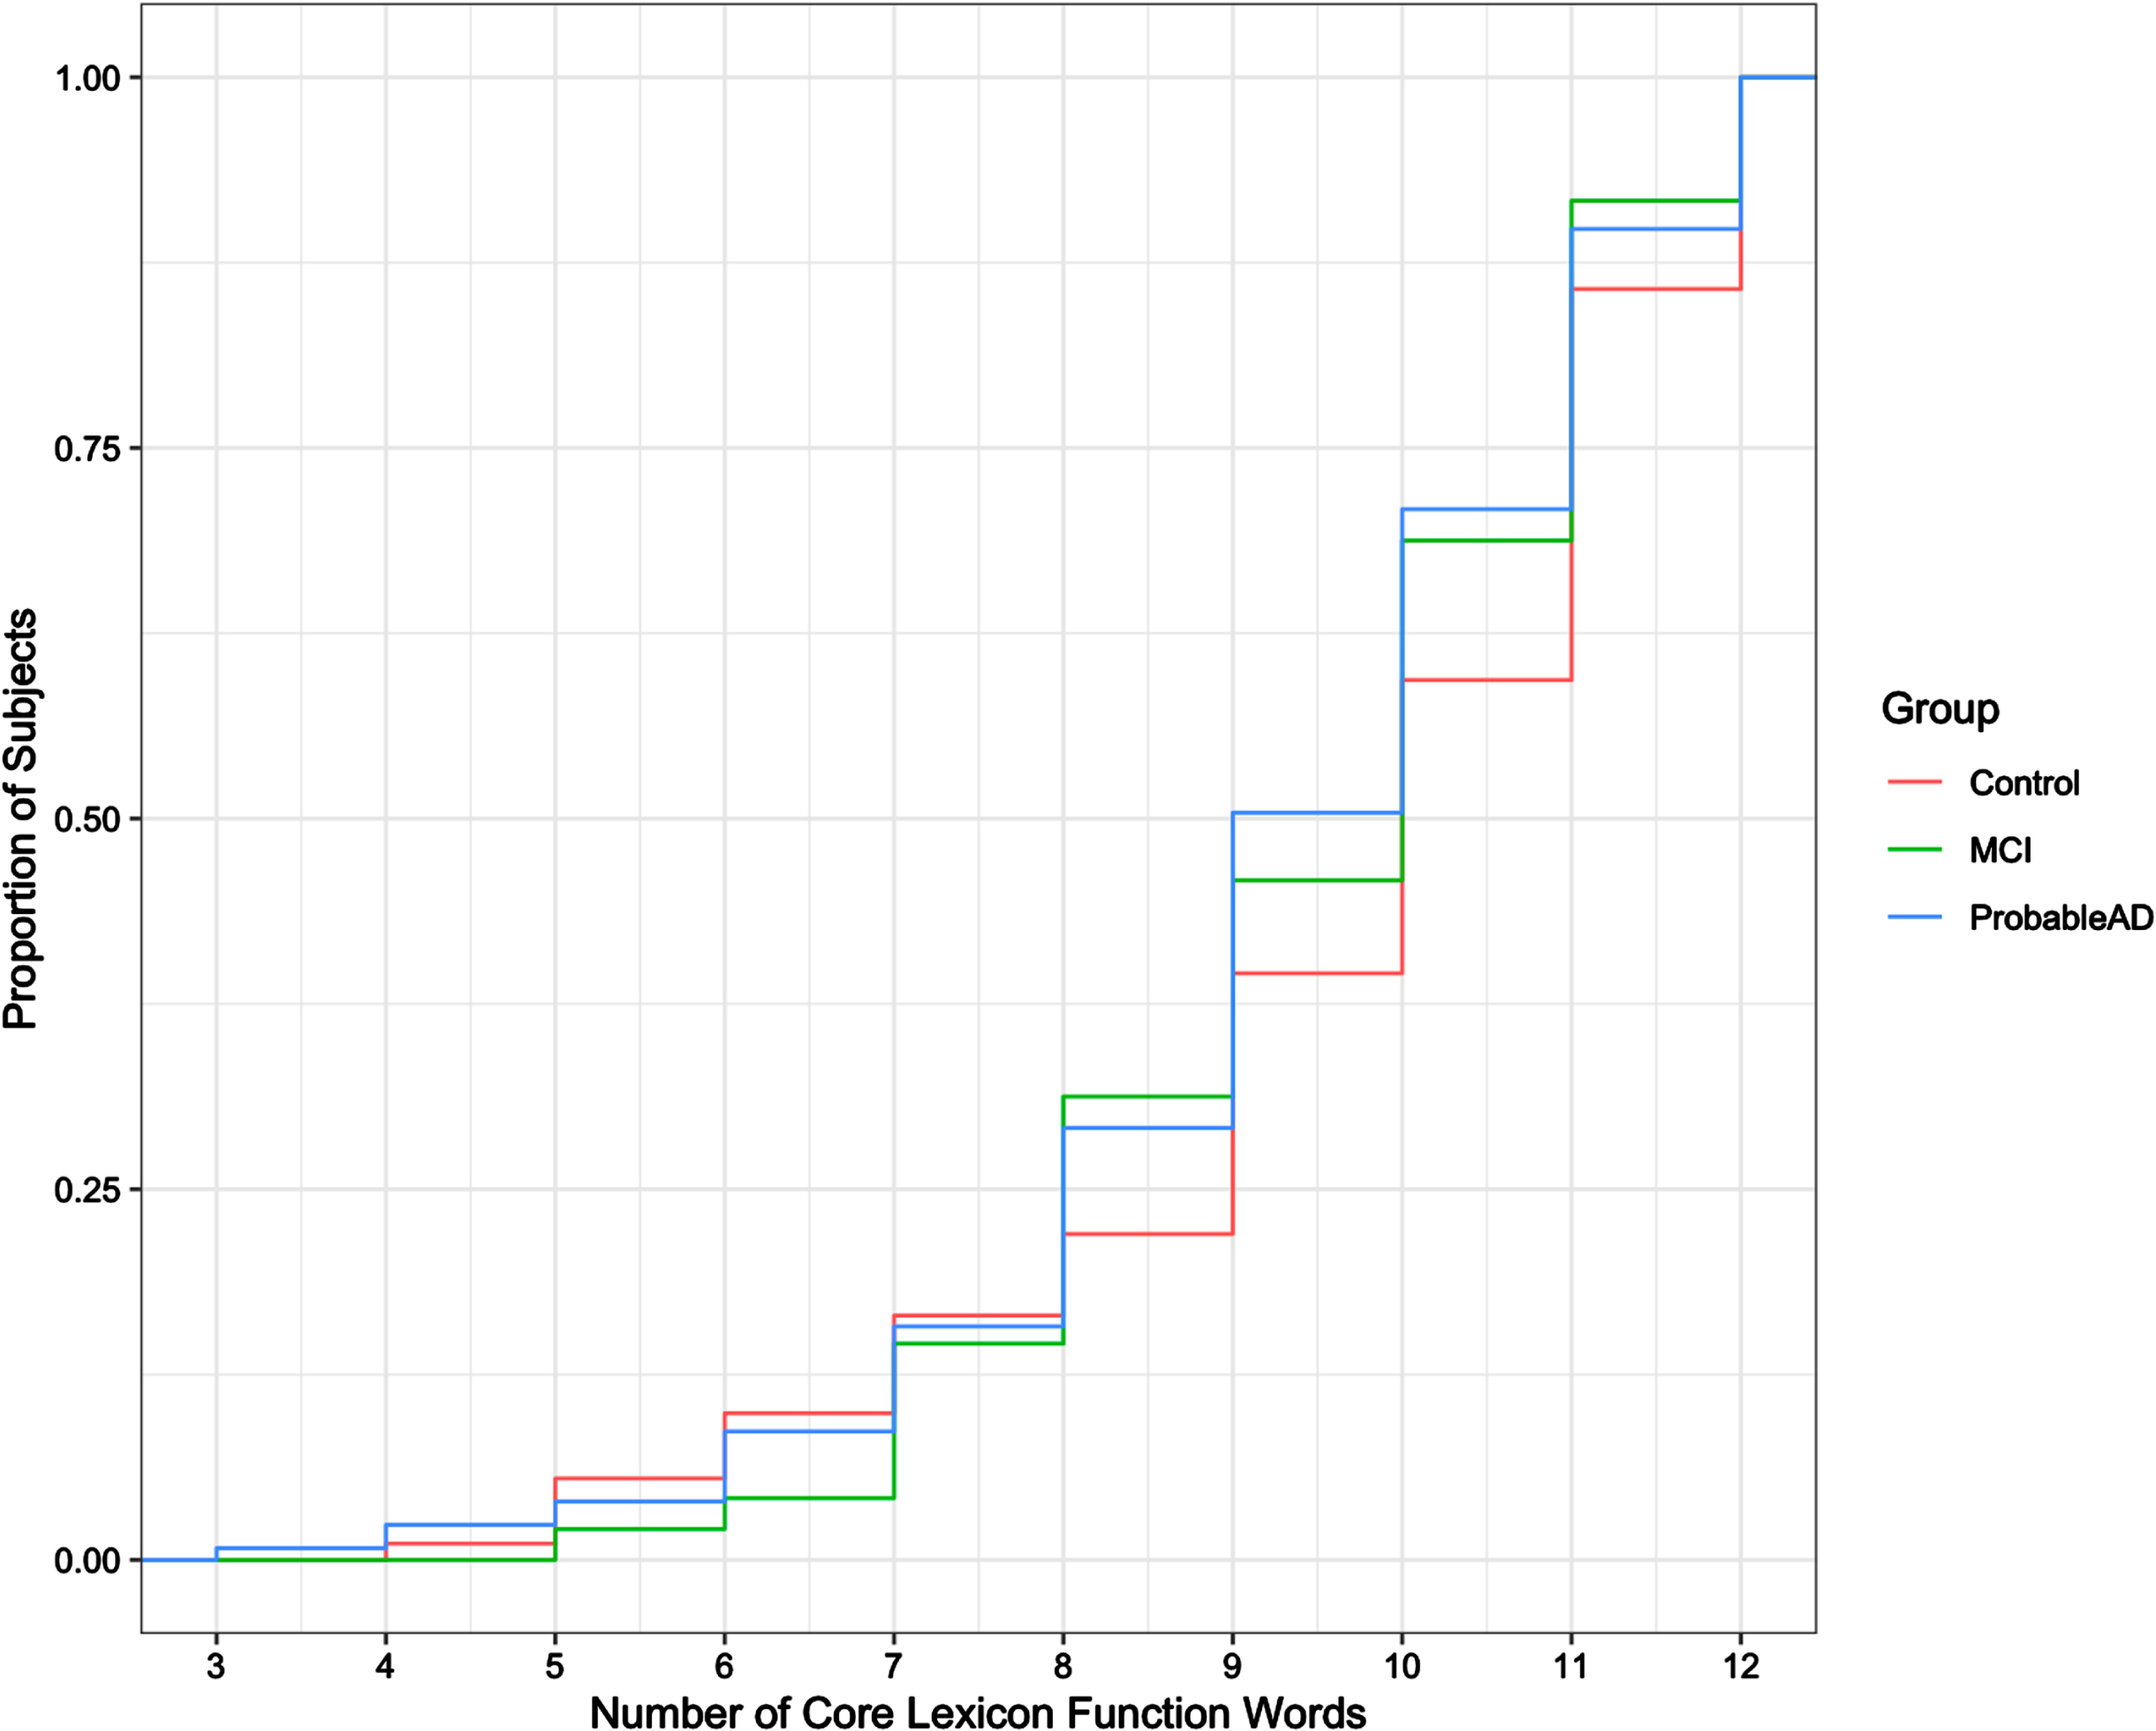
Fig. 4
Cumulative distribution of core lexicon content words produced.
Timing of core lexicon word production
For each core lexicon content word, Kaplan-Meier survival curves were used to visualize the proportion of individuals who produced the word by a given time. The curves appear in Figs. 5–8, grouped by where they appear in the picture. For each curve, the x-axis shows time in seconds beginning at time 0, and the y-axis shows the proportion of individuals in each group who produced the core lexicon word. At time t = 0 no one has produced a core lexicon word. As time passes, the proportion of individuals who produced the word increases, until all participants said the core lexicon word and the plot is at 1.0 (100%) on the y-axis or the curve asymptotes at a value less than 100% if not everyone in a group expressed that word. The slope of the line indicates the rate at which a group produced a given core lexicon word, with steeper slopes indicating earlier production.
Fig. 5
Elapsed time until core lexicon content word from Top Left quadrant is produced.
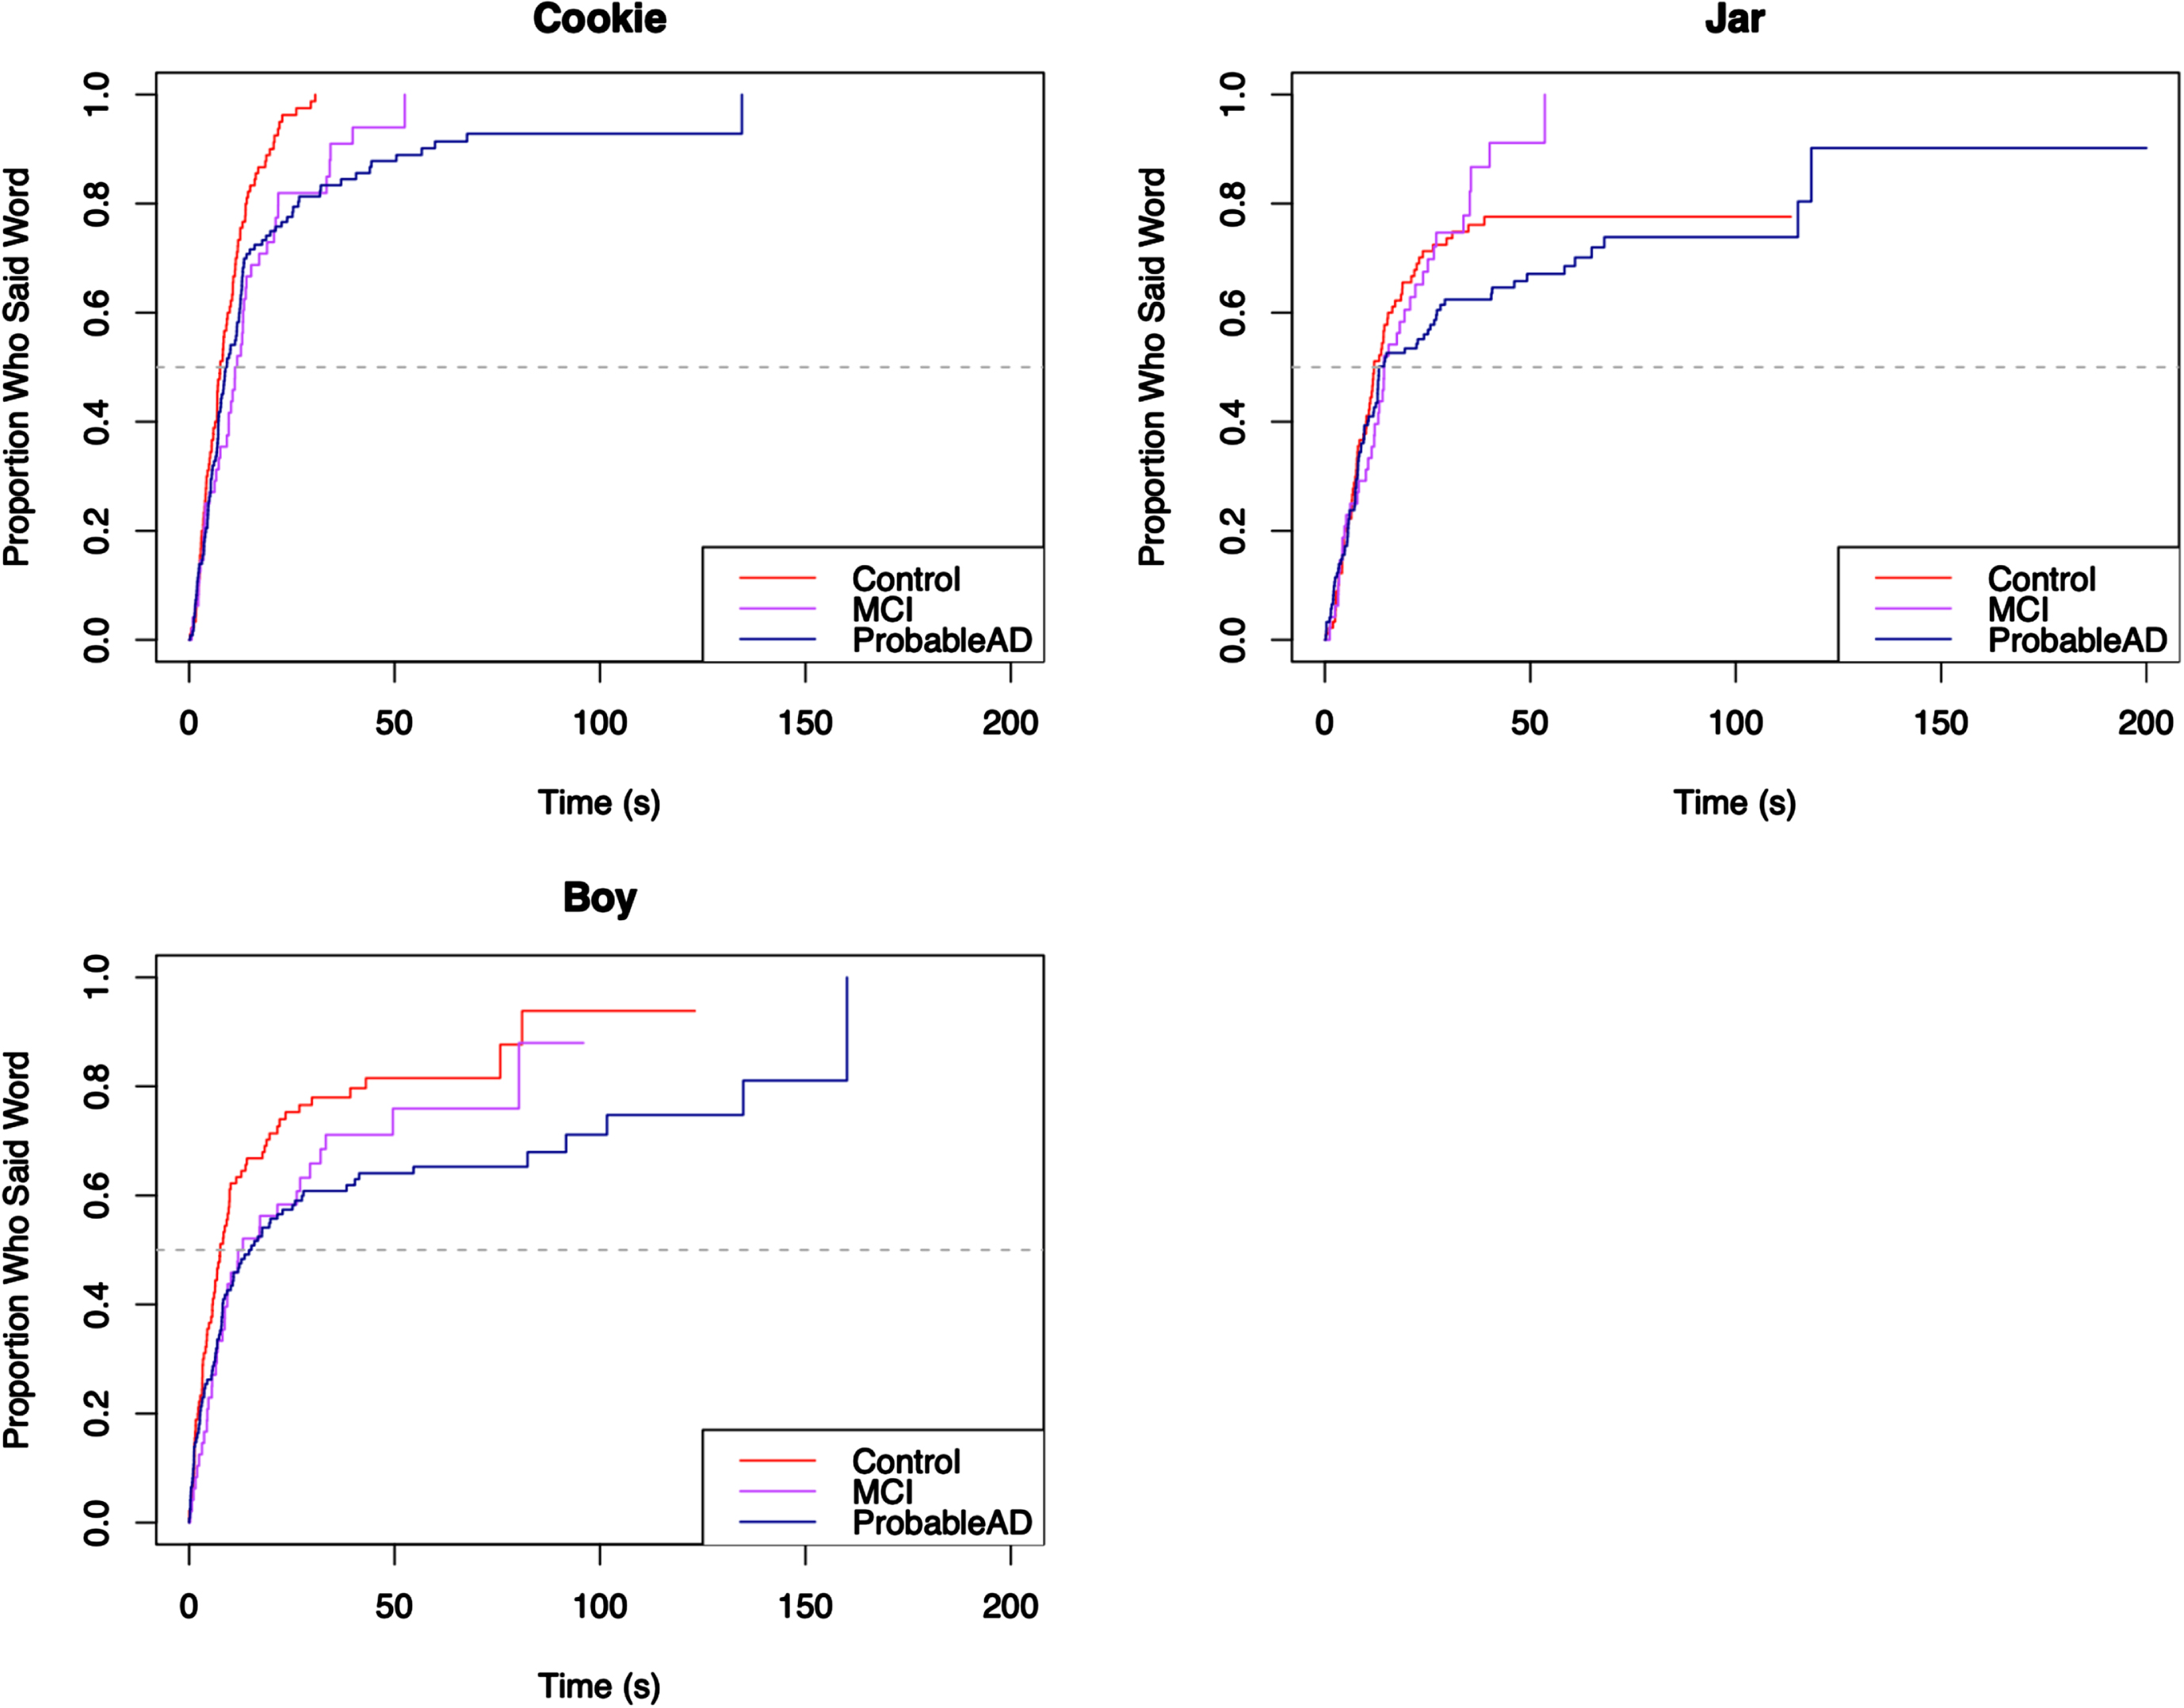
Fig. 6
Elapsed time until core lexicon content word from Top Right quadrant is produced.
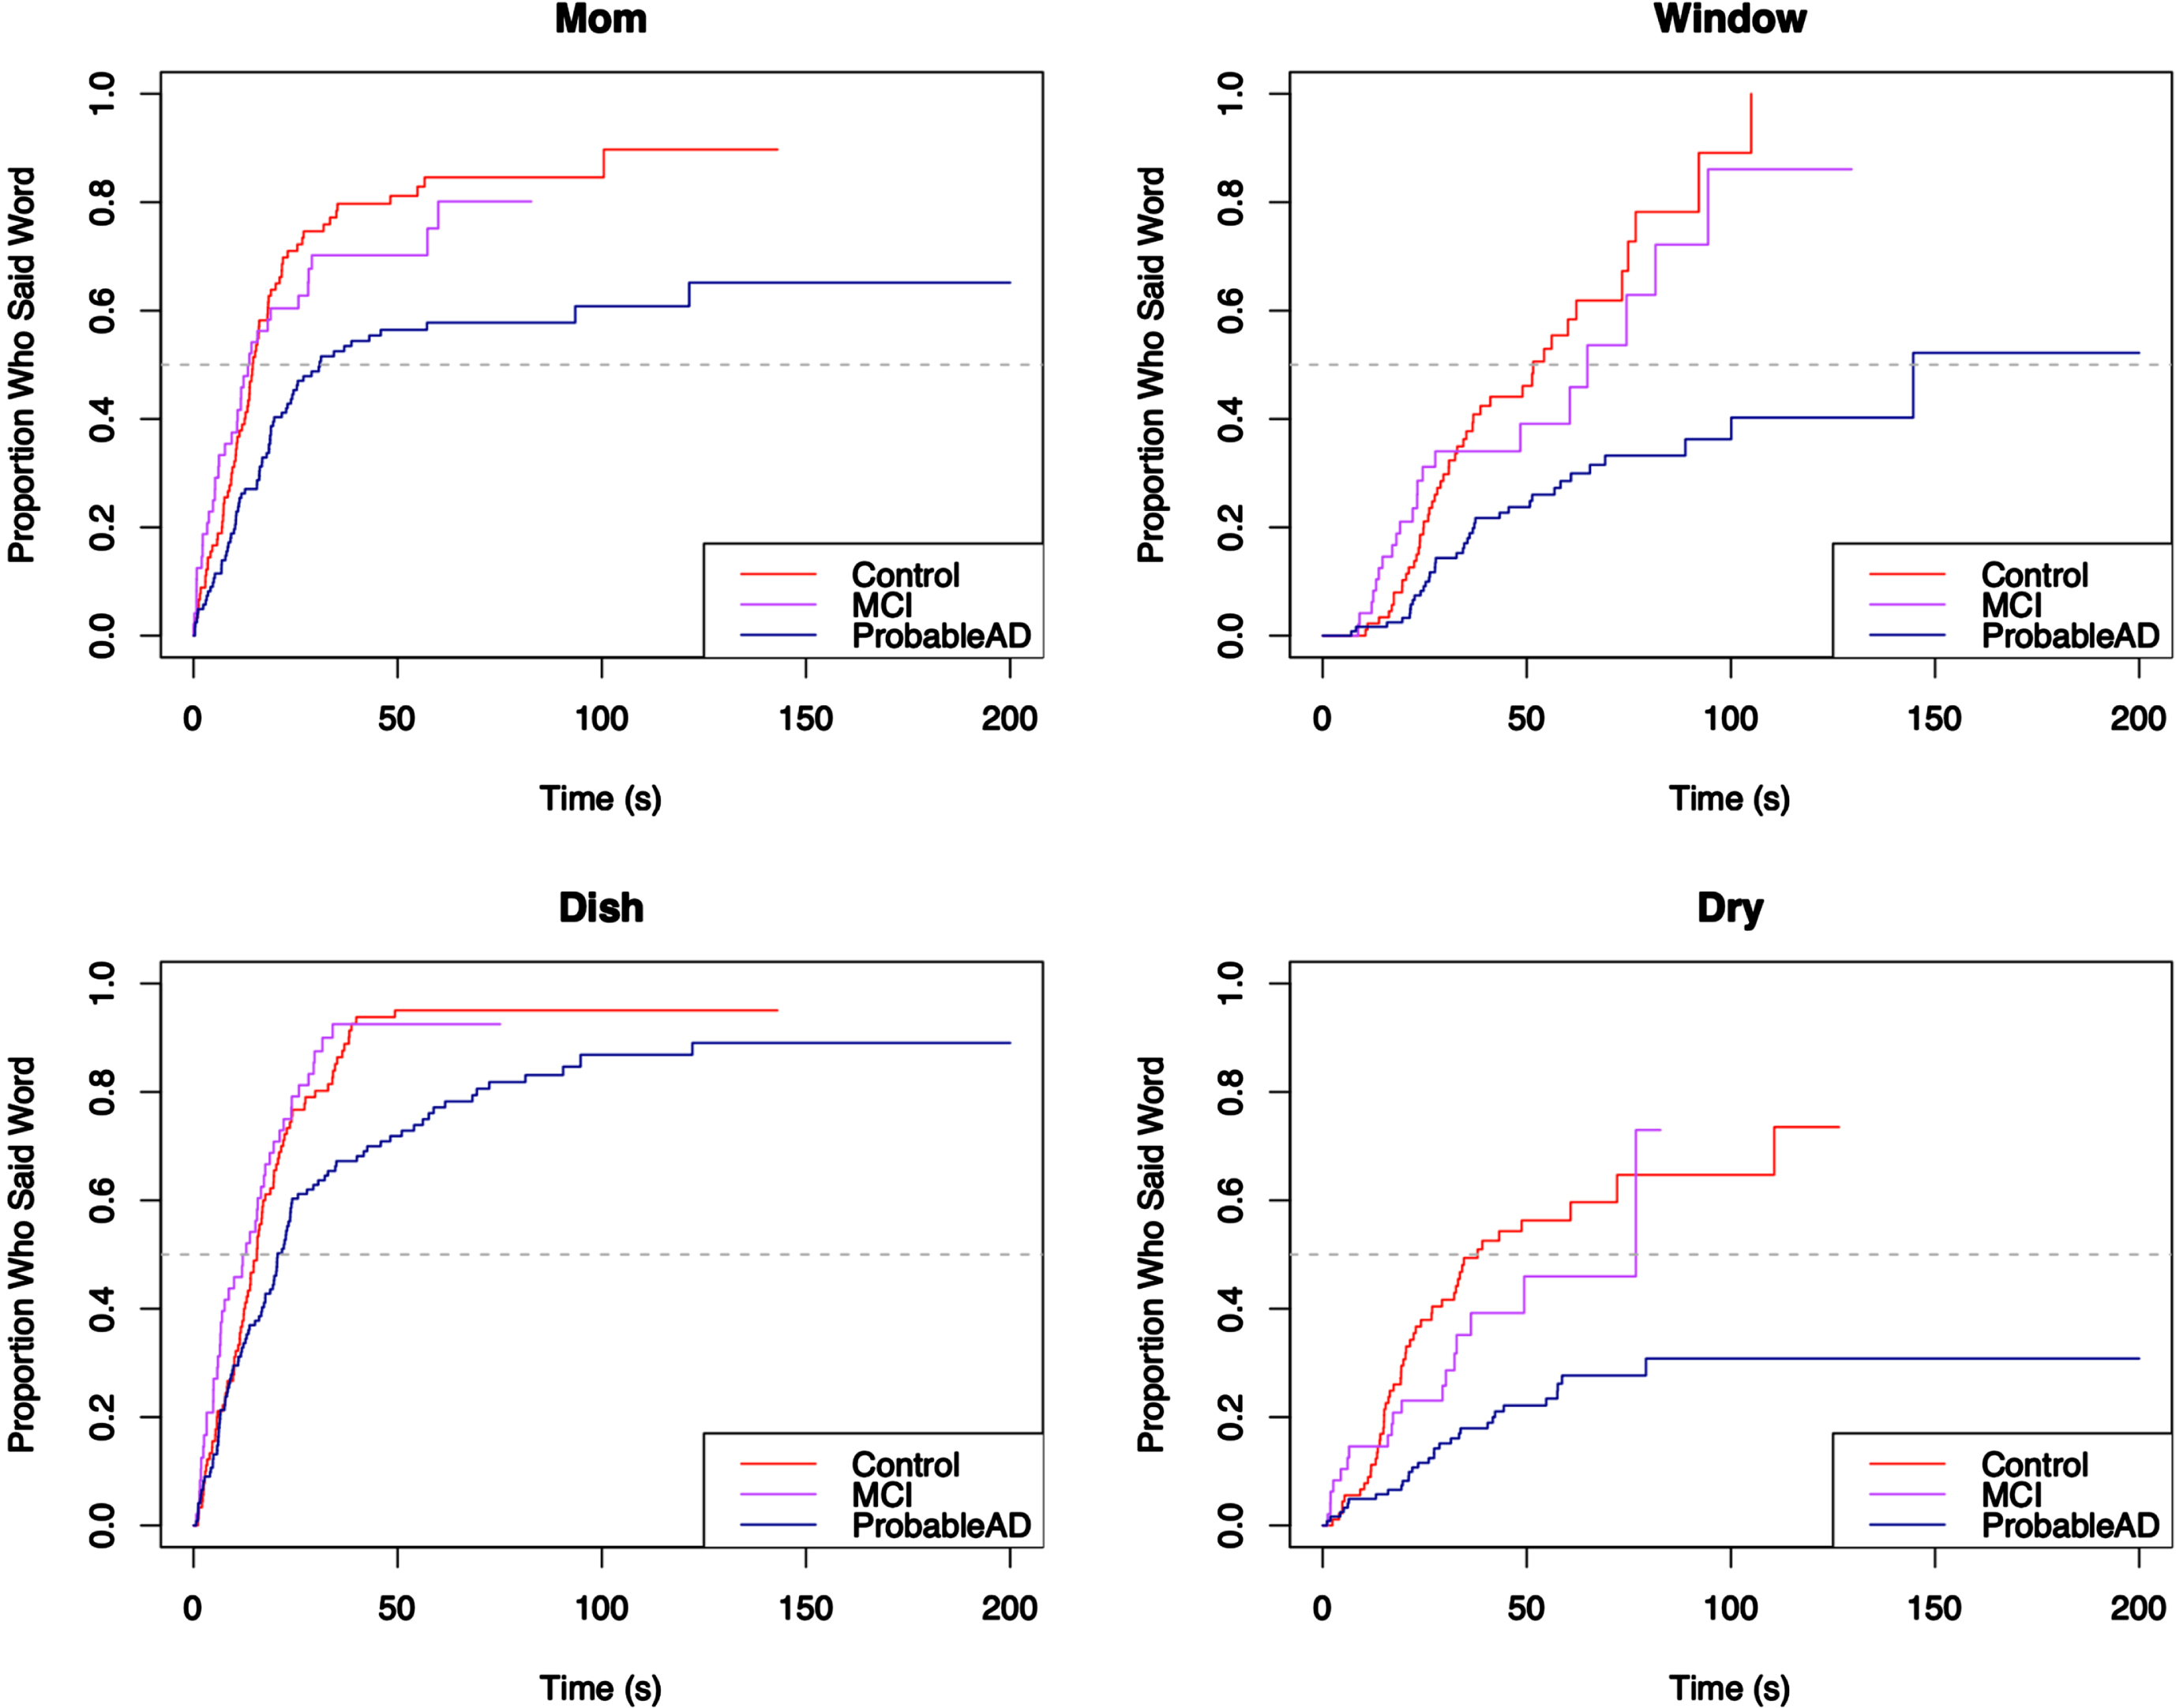
Fig. 7
Elapsed time until core lexicon content word from Bottom Left quadrant is produced.
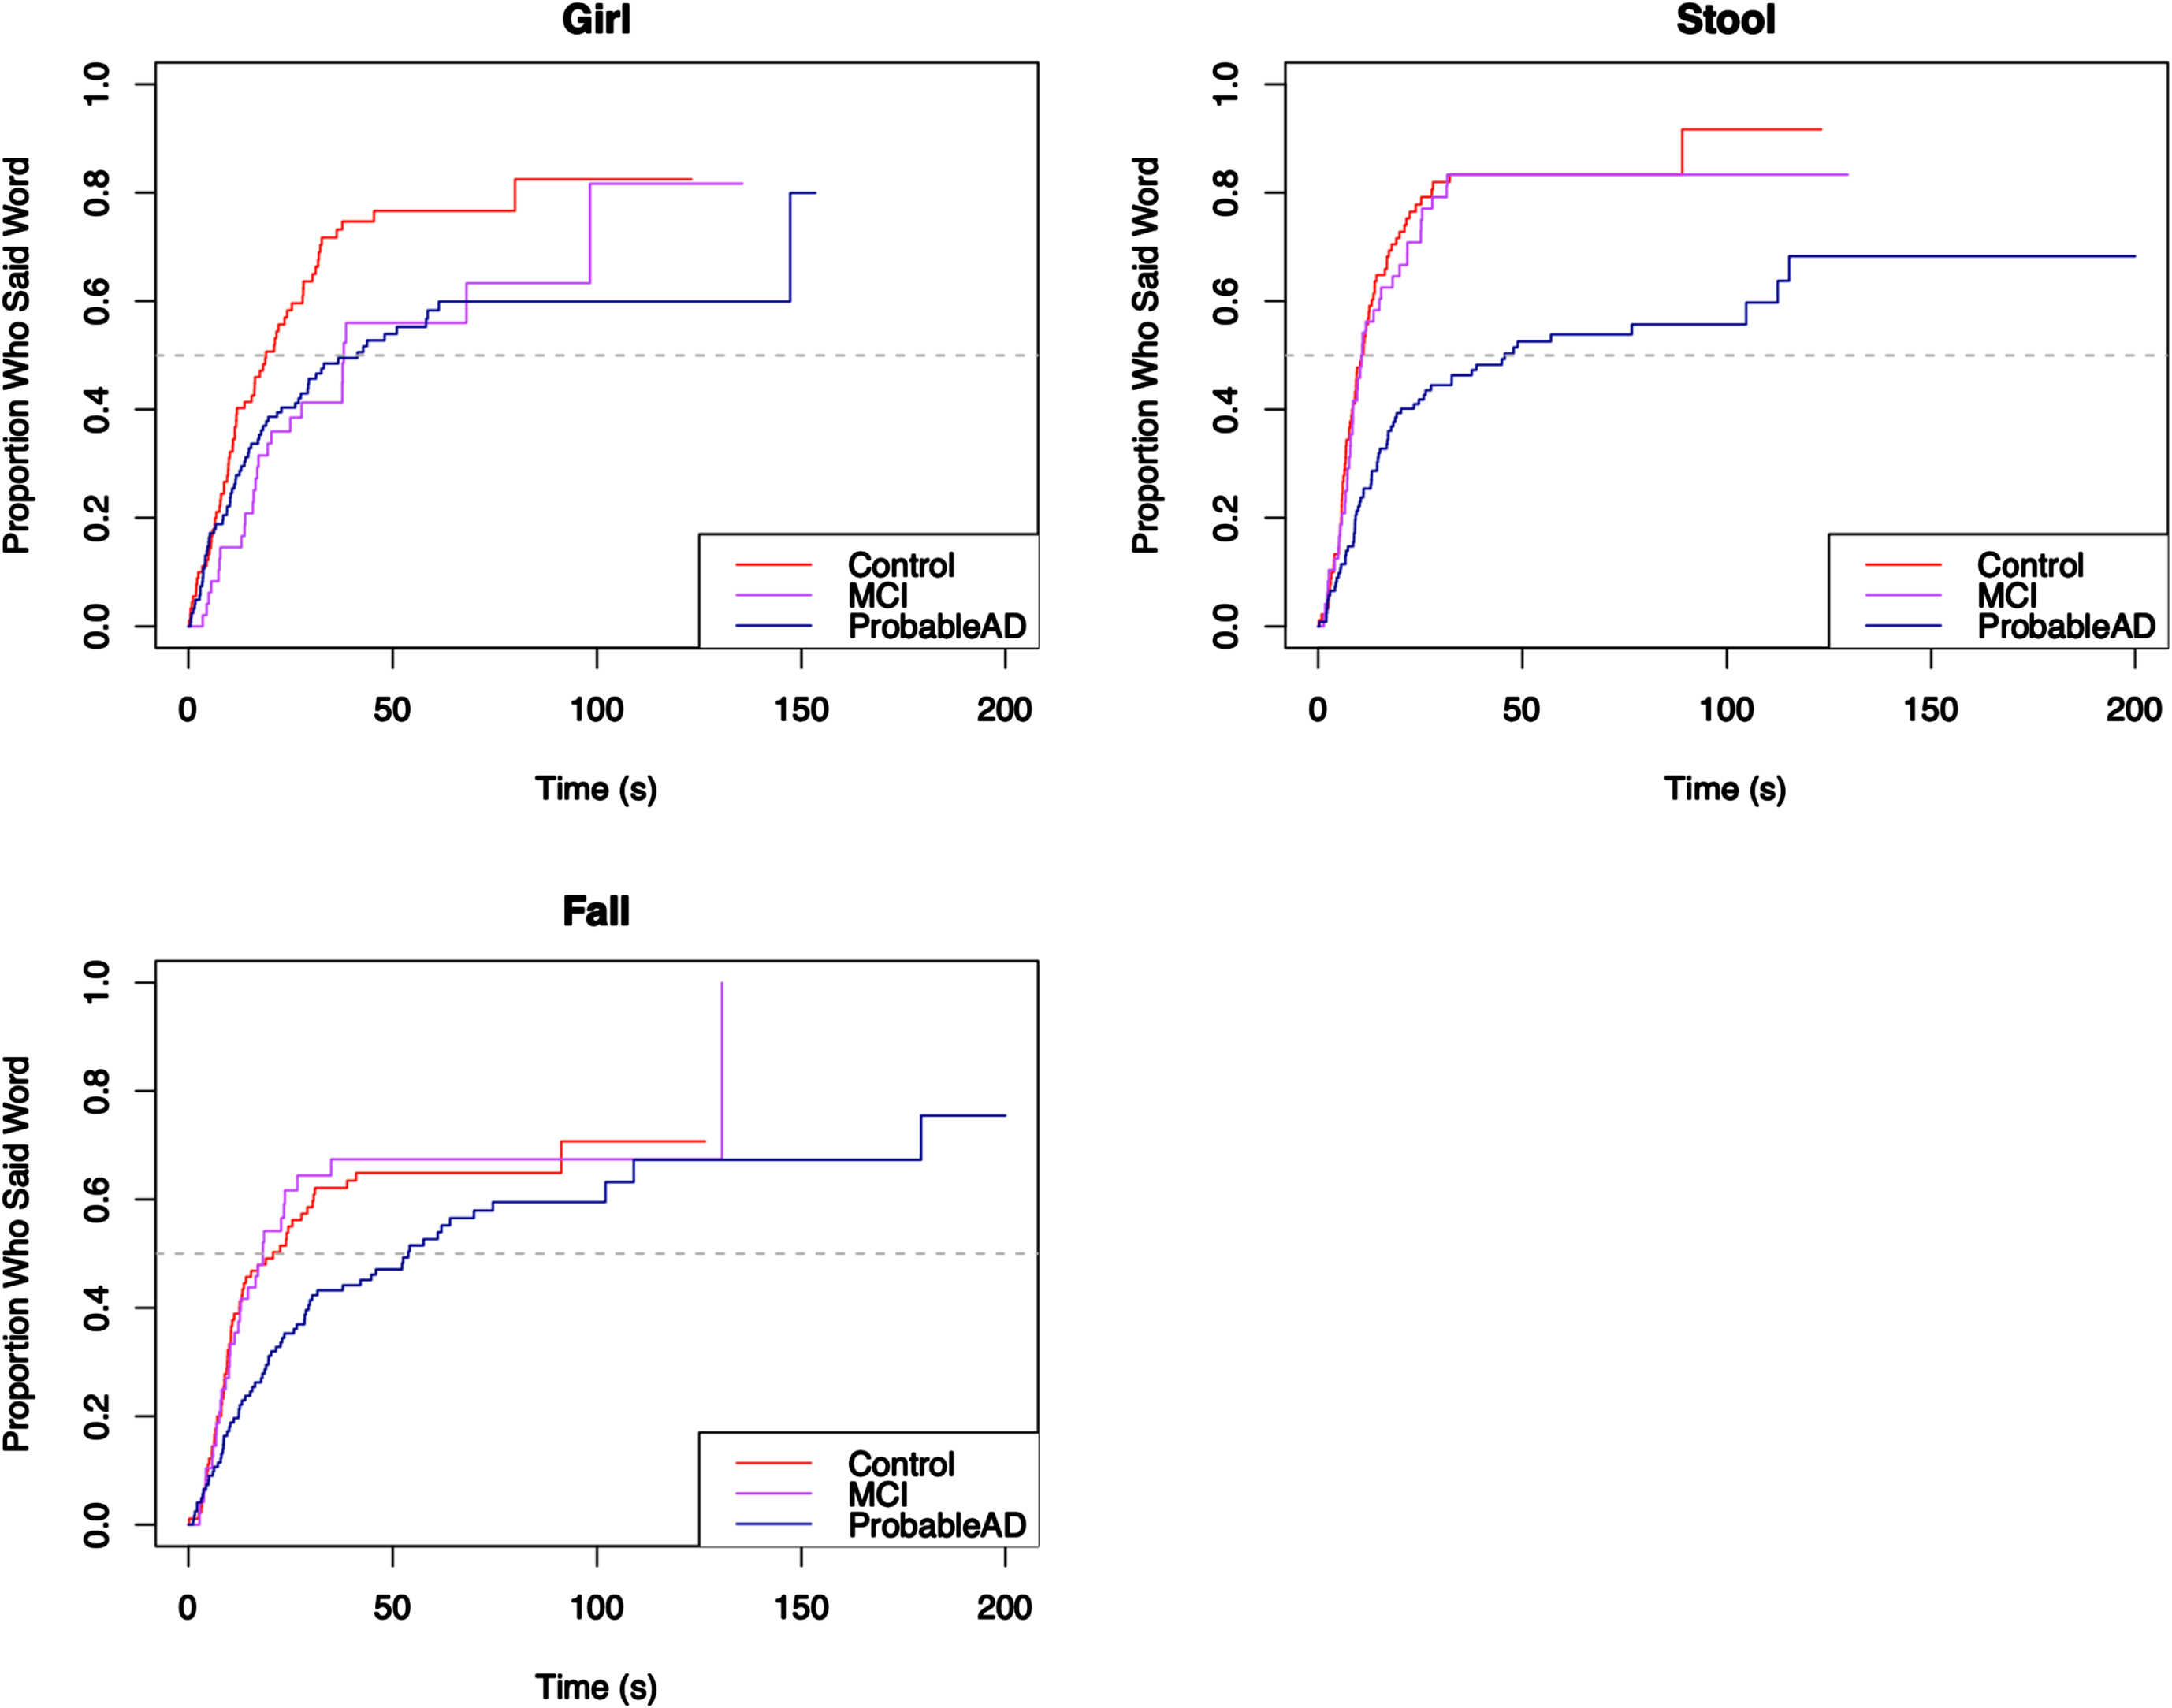
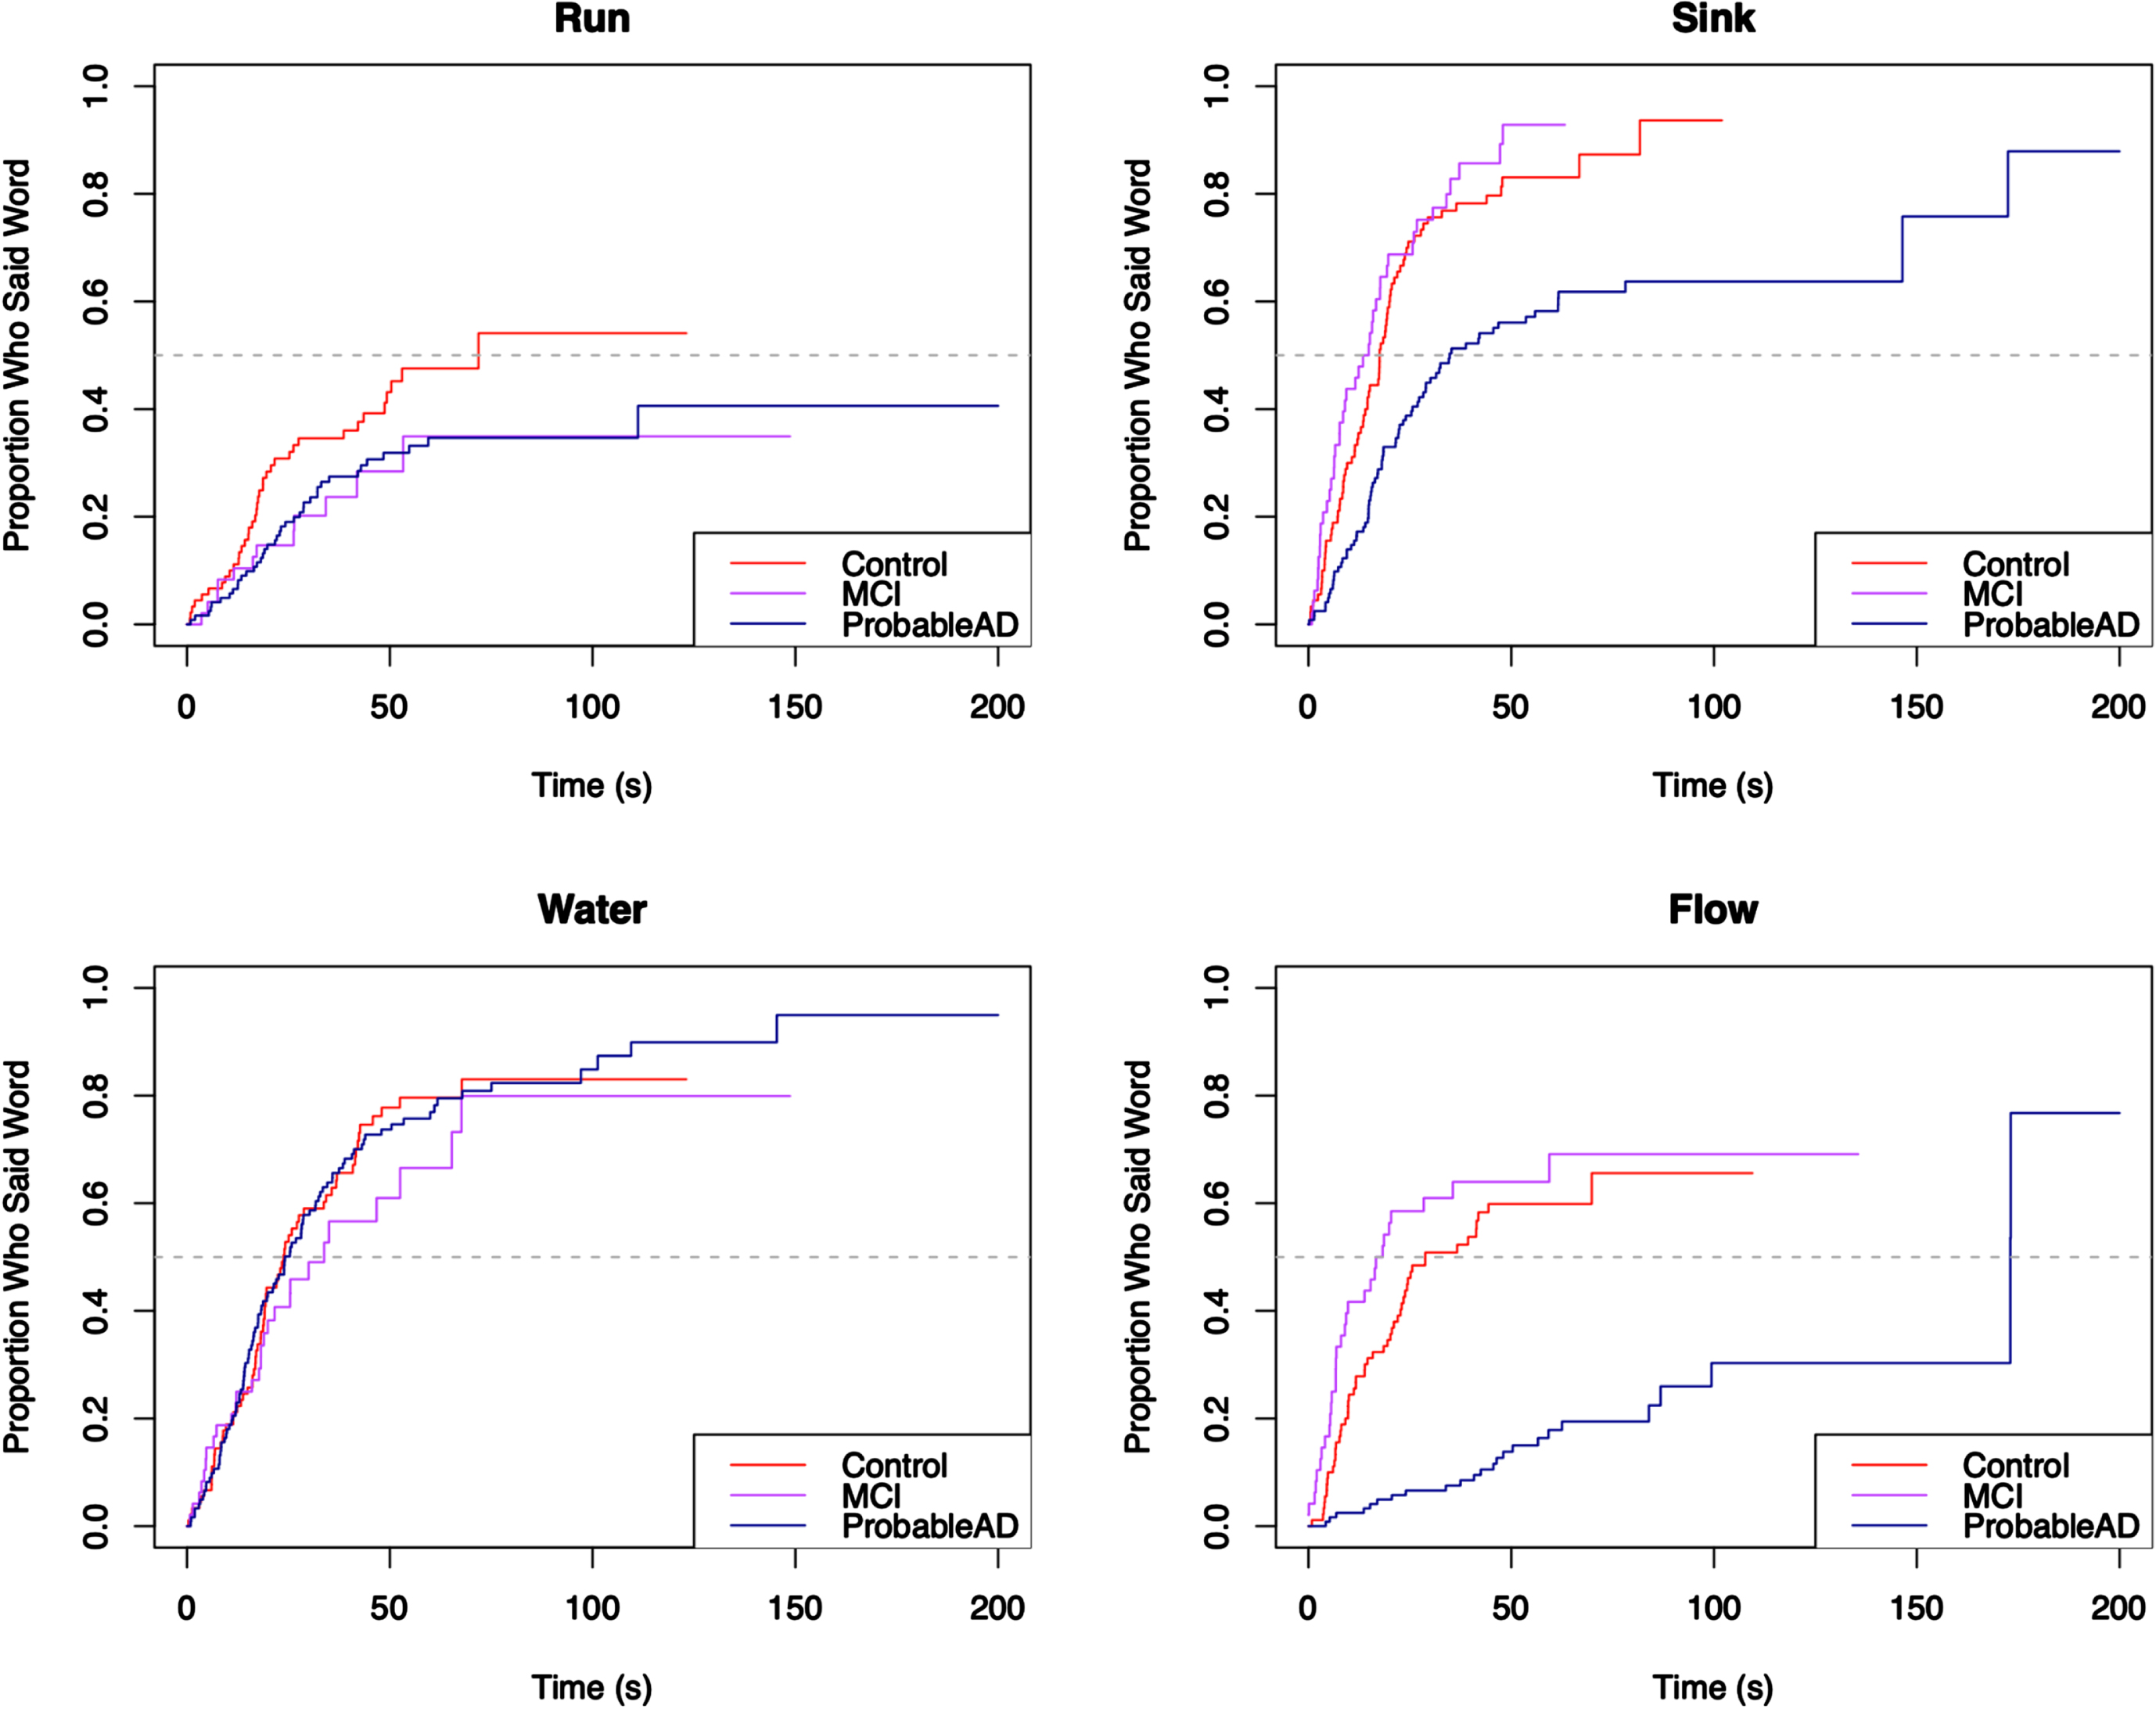
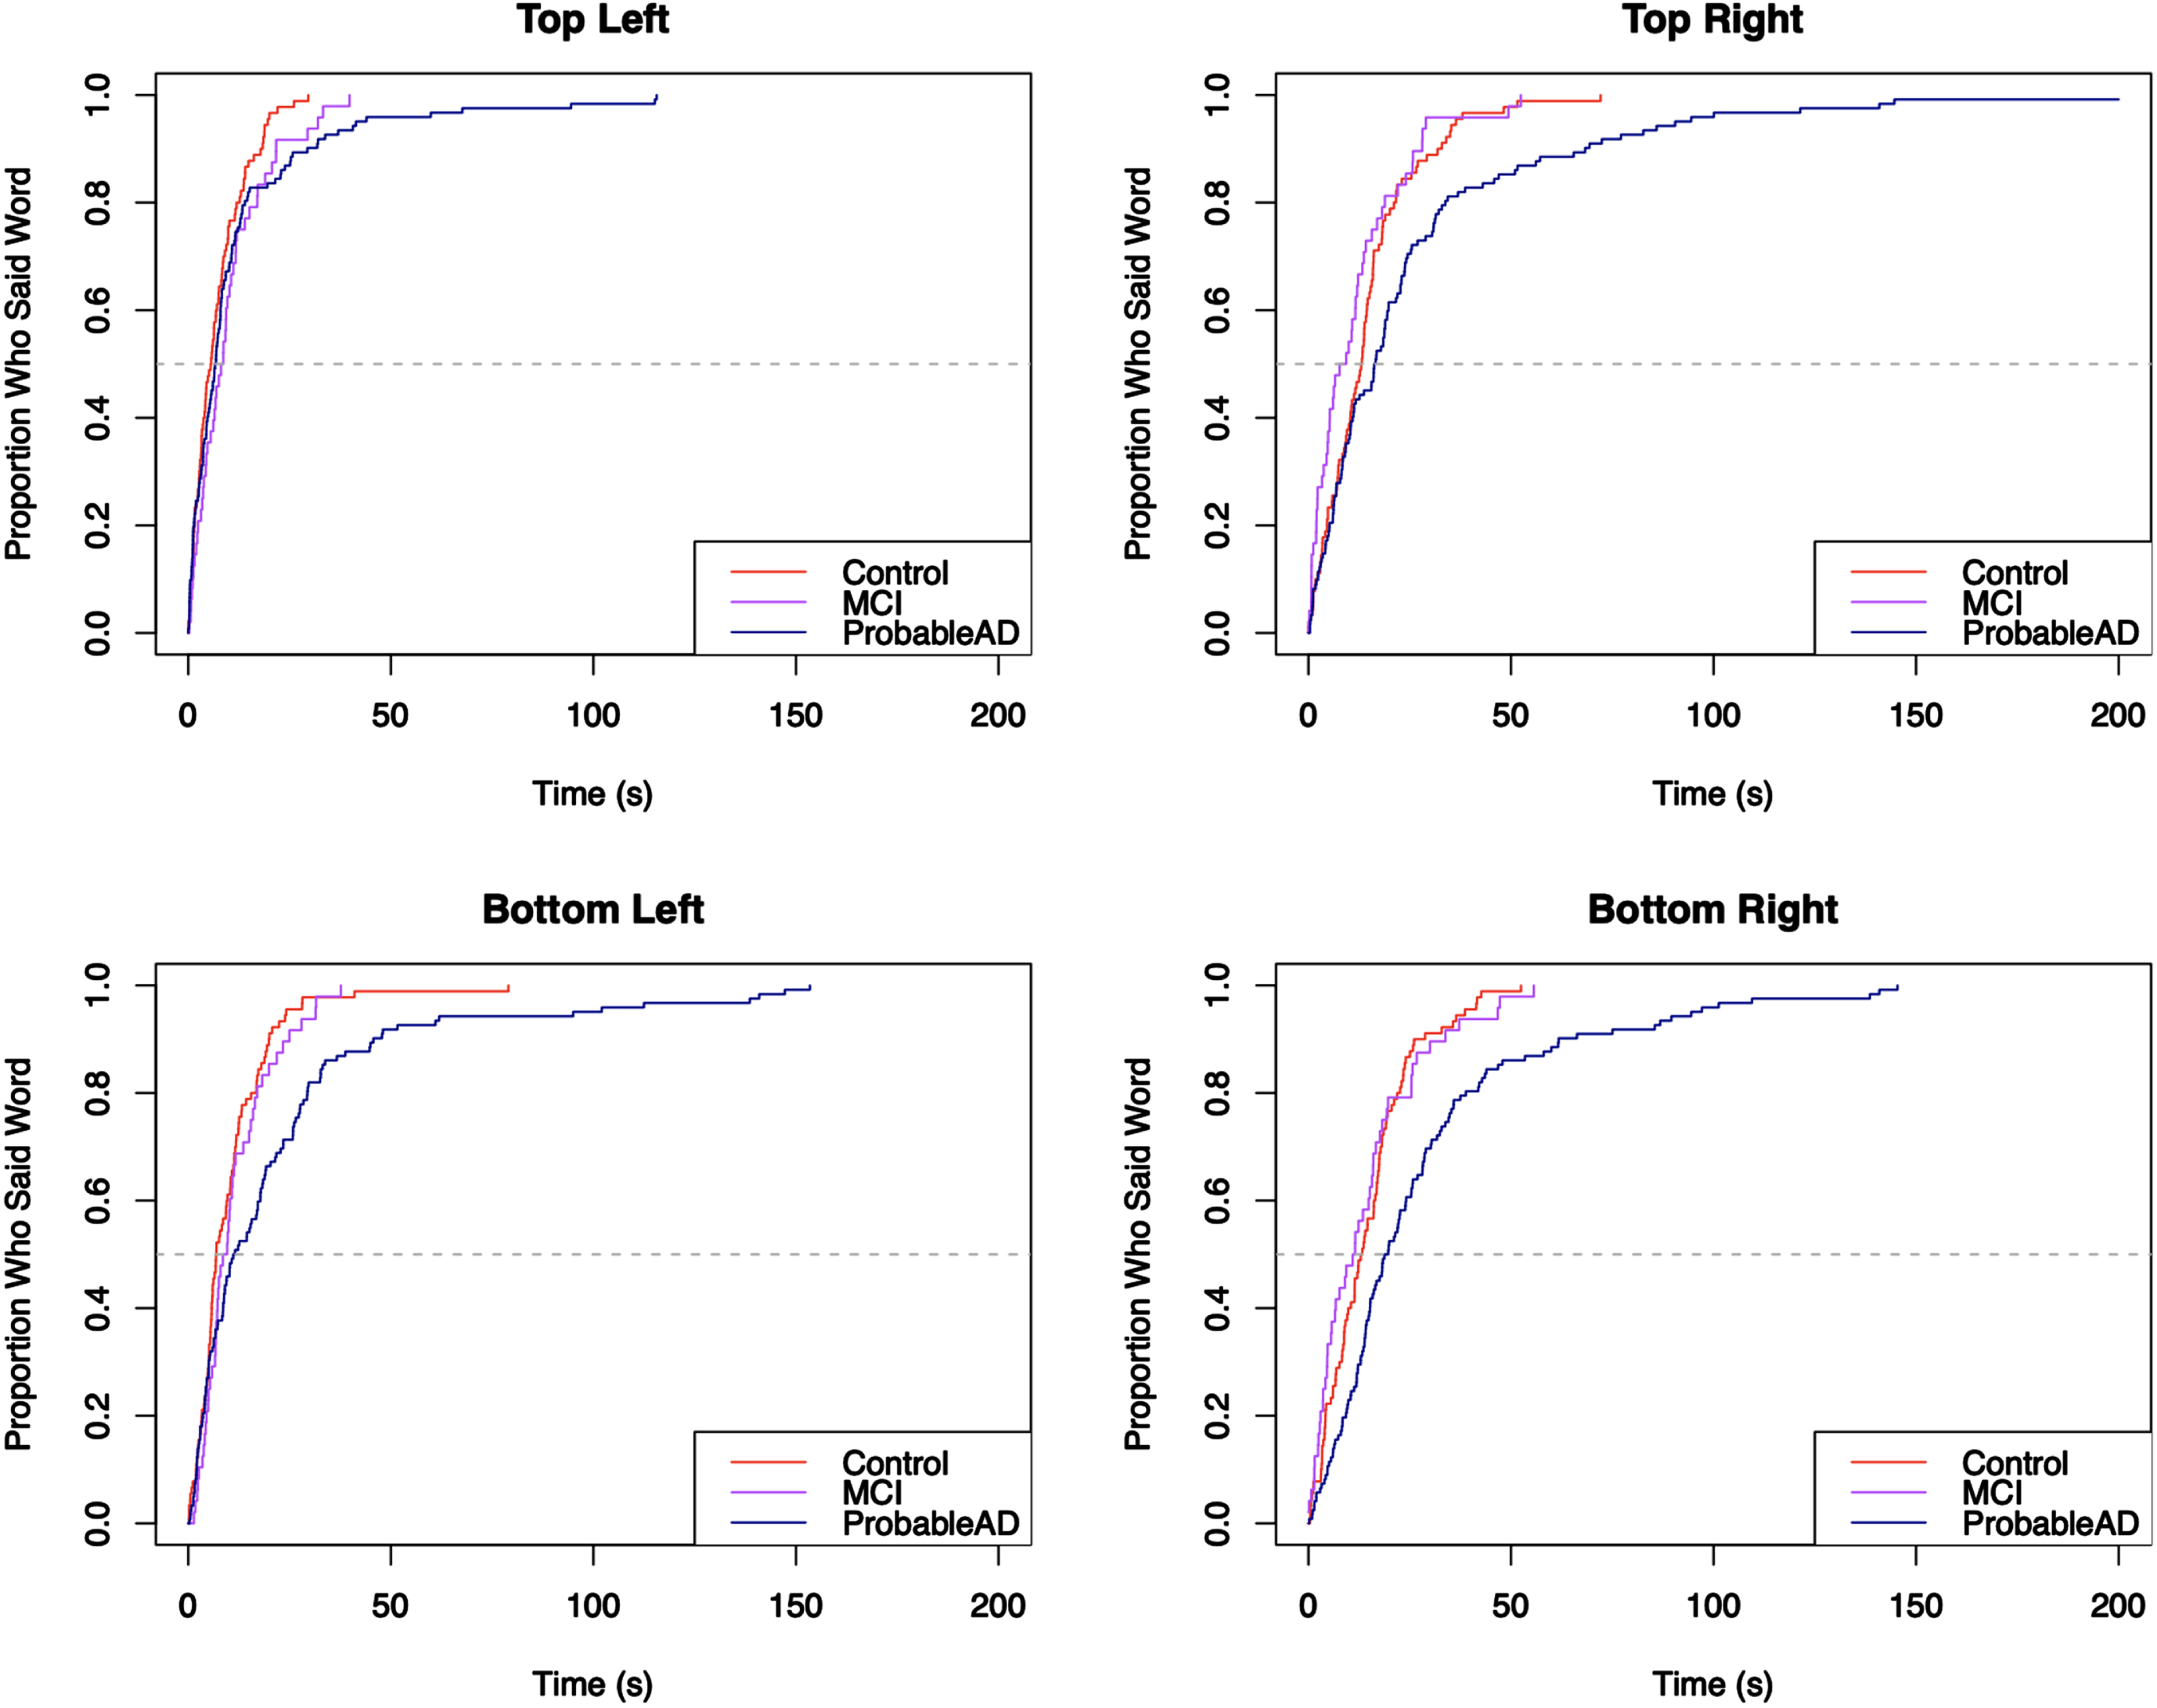
Fig. 8
Elapsed time until core lexicon content word from Bottom Right quadrant is produced.
The Kaplan-Meier survival curves make it easy to visualize the elapsed time until the groups produced the core lexicon content words. As an example, the first graph in Fig. 5 shows the distribution of the time it took participants in each group to say the word cookie. The curves show that the three groups all said the word cookie very quickly (within about 20 s). They stayed mostly aligned until about 75% of each group said the word, at which point the curves began to separate, with the MCI group slowing down and looking more like the ProbableAD group. Notably, the ProbableAD group slowed substantially, the MCI group slowed more gradually, and the Control group continued at basically the same rate.
Figure 6 shows a pattern where the ProbableAD group is slower to produce three of the four words (mom, window, dry) than the other groups. For mom, 60% of the MCI and Control groups produced the word by about 25 seconds, at which point the remainder of the MCI group was slower than the Control group but faster than the ProbableAD group. In Fig. 7, the first graph shows that the three groups said the word girl at roughly the same pace initially. Fairly quickly, however, at the point where approximately 20% of each group said the word, the ProbableAD and MCI groups started slowing down in the time until they said girl compared to the Control group. In this plot, all three curves start aligned with each other, but the slope of the ProbableAD group’s curve is less steep than those of the Control and MCI groups, indicating that individuals in the ProbableAD group did not say this word as early in their picture descriptions as individuals in the other groups. Additionally, along the path that the MCI and Control groups take, the MCI group’s slope flattens compared to the Control group right after 50% of the MCI group participants said the word (at the dashed line, the median), indicating that they took longer to say girl than the Control group.
For the majority of the core lexicon content words the same trend occurred, with the ProbableAD group differentiating itself early and the MCI and Control groups displaying varying differences of a lesser degree. A dramatic example is the word flow (or flowed, flowing, flows, overflowed, overflowing, overflows) in Fig. 8, where only 30% of the ProbableAD group said the word by about 100 s into the task, while 50% of the Control and MCI groups said it within about the first half minute. Similarly, dry (Fig. 6), was produced by only about 30% of the ProbableAD group over the entire time, but was produced by 50% of the Control group by about 40 s and 45% of the MCI group by about 50 s. The word stool (Fig. 7) is an example of a specific word that was more difficult for the ProbableAD group to produce, sometimes substituting the word chair instead, which would not have counted. Less than 50 s into the task, 80% of the Control and MCI groups and barely 50% of the ProbableAD group said stool.
Table 2 displays the results of the log-rank test for differences in the elapsed time to production for each of the 14 core lexicon content words, respectively. The groups differed significantly in the time it took to produce 11 of these words. The only words that showed no difference in time to produce were water, run and jar. Table 3 presents the results of the Cox proportional hazards regression analysis comparing the hazard ratio between the groups for each of the 14 core lexicon content words, controlling for sex, age, and education. The table presents the hazard ratio for each of the pairwise comparisons between the groups, the 95% confidence interval for the hazard ratio, and the p-value to test the hypothesis that there is no difference in the hazard ratio between the comparison groups for the time to production of each of the core lexicon content words. Columns 2 and 3 compare the time to production of the core lexicon word given in the first column of the MCI and ProbableAD groups, respectively, to the Control group (the reference group). Column 4 compares the MCI group to the ProbableAD group (the reference group). Values of the hazard ratio less than 1 indicate that the comparison group produced the core lexicon word at a slower rate (longer elapsed time until production) than the reference group; values of the hazard ratio greater than 1 indicate that the comparison group produced the core lexicon word at a faster rate than the reference group. If there is no statistical difference between groups, then the 95% confidence interval for the hazard ratio will contain the value 1 and the p-value will be greater than 0.05.
Table 2
Global test for differences in the elapsed time to production of core lexicon word among groups
| Word | Log-rank χ2 | p |
| Boy | 9 | 0.01 |
| Cookie | 13.6 | 0.001 |
| Dish | 18.17 | <0.001 |
| Dry | 26.64 | <0.001 |
| Fall | 8.39 | 0.02 |
| Flow | 66.63 | <0.001 |
| Girl | 11.54 | 0.003 |
| Jar | 3.66 | 0.2 |
| Mom | 20.01 | <0.001 |
| Run | 5.21 | 0.07 |
| Sink | 35.32 | <0.001 |
| Stool | 36.2 | <0.001 |
| Water | 1.5 | 0.5 |
| Window | 25.62 | <0.001 |
Table 3
Results of the Cox proportional hazards regression model: Differences between groups in the time to production of core lexicon content words controlling for age, sex, and education
| Word/Quadrant | MCI vs Control | ProbableAD vs Control | MCI vs ProbableAD |
| Hazard Ratio* | Hazard Ratio* | Hazard Ratio* | |
| (95% CI), p | (95% CI), p | (95% CI), p | |
| Boy | 0.77 (0.50, 1.18) | 0.72 (0.49, 1.06) | 1.07 (0.667, 1.71) |
| p = 0.233 | p = 0.095 | p = 0.79 | |
| Cookie | 0.62 (0.42, 0.923) | 0.62 (0.44, 0.86) | 1.02 (0.67, 1.56) |
| p = 0.020 | p = 0.004 | p = 0.93 | |
| Dish | 1.18 (0.79, 1.76) | 0.60 (0.43, 0.85) | 1.95 (1.24, 3.05) |
| p = 0.427 | p = 0.004 | p = 0.004 | |
| Dry | 0.84 (0.47, 1.49) | 0.274 (0.16, 0.47) | 3.06 (1.53, 6.09) |
| p = 0.551 | p < 0.001 | p = 0.001 | |
| Fall | 1.22 (0.76, 1.95) | 0.58 (0.39, 0.88) | 2.08 (1.22, 3.54) |
| p = 0.419 | p = 0.010 | p = 0.007 | |
| Flow | 1.29 (0.79, 2.12) | 0.26 (0.15, 0.46) | 4.92 (2.63, 9.23) |
| p = 0.308 | p < 0.001 | p < 0.001 | |
| Girl | 0.62 (0.38, 1.03) | 0.61 (0.41, 0.91) | 1.02 (0.59, 1.78) |
| p = 0.063 | p = 0.015 | p = 0.933 | |
| Jar | 0.96 (0.63, 1.46) | 0.82 (0.57, 1.20) | 1.16 (0.73, 1.85) |
| p = 0.840 | p = 0.307 | p = 0.525 | |
| Mom | 1.03 (0.67, 1.57) | 0.52 (0.36, 0.77) | 1.97 (1.21, 3.21) |
| p = 0.900 | p < 0.001 | p = 0.006 | |
| Run | 0.54 (0.26, 1.10) | 0.63 (0.37, 1.06) | 0.86 (0.40, 1.88) |
| p = 0.090 | p = 0.082 | p = 0.693 | |
| Sink | 1.21 (0.80, 1.85) | 0.50 (0.34, 1.72) | 2.45 (1.55, 3.85) |
| p = 0.369 | p < 0.001 | p < 0.001 | |
| Stool | 0.89 (0.58, 1.36) | 0.38 (0.26, 0.56) | 2.34 (1.46, 3.74) |
| p = 0.583 | p < 0.001 | p < 0.001 | |
| Water | 1.0 (0.62, 1.63) | (0.69, 1.45) | 1.00 (0.60, 1.66) |
| p = 0.996 | p = 0.990 | p = 0.997 | |
| Window | 0.79 (0.44, 1.41) | 0.36 (0.21, 0.60) | 2.20 (1.14, 4.26) |
| p = 0.42 | p < 0.001 | p = 0.019 | |
| Top-Left Quadrant | 1.39 (0.50, 1.05) | 0.77 (0.56, 1.07) | 0.94 (0.63, 1.40) |
| p = 0.089 | p = 0.118 | p = 0.750 | |
| Top-Right Quadrant | 1.23 (0.85, 1.80) | 0.63 (0.45, 0.87) | 1.97 (1.30, 2.98) |
| p = 0.273 | p = 0.005 | p = 0.001 | |
| Bottom-Left Quadrant | 0.88 (0.60, 1.30) | 0.51 (0.37, 0.71) | 1.74 (1.14, 2.65) |
| p = 0.527 | p < 0.001 | p = 0.012 | |
| Bottom-Right Quadrant | 1.10 (0.74, 1.63) | 0.48 (0.35, 0.68) | 2.28 (1.50, 3.47) |
| p = 0.628 | p < 0.001 | p < 0.001 |
*Hazard ratio estimate with 95% confidence interval and p-value for differences in the between group comparisons, respectively, from the Cox proportional hazards model adjusting for sex, age, and education.
Pairwise comparisons revealed that the ProbableAD group produced 10 of the 14 words more slowly (longer elapsed time until production) than the Control group, and the MCI group produced 1 word more slowly than the Control group. The MCI group produced 8 of the words more quickly than the ProbableAD group. It was never the case that MCI or Control groups produced any words more slowly than ProbableAD, or that the Control group produced any words more slowly than the MCI group.
Analysis of picture quadrants
To analyze where the individuals in each group were looking, we analyzed the elapsed time until the first word for each quadrant was said for each group. Figure 9 shows the survival curves for all four quadrants of the picture. With the exception of the Top Left (log-rank χ2 = 4.42, p = 0.05), the curves for all quadrants were significantly different (p < 0.001; χ2 = 11.16 for Top Right, 17.51 for Bottom Left, and 23.69 for Bottom Right). In all three cases, the pairwise comparison showed significant differences between the ProbableAD group and the other two groups, but no significant differences between the Control and MCI groups. In all quadrants, the Control and MCI groups’ curves stayed near each other throughout and were not significantly different (see Table 3). In the Top Left, all three curves stayed very near each other, until about 80% of the people in each group said a word in the quadrant and were not significantly different. This may be due to a combination of factors including the action taking place in the quadrant, the comparative simplicity of that segment of the picture, the written word labels on the cookie jar, and the fact that the top left is a reasonable place for English speakers to look first. The other curves show an increasing gap between the ProbableAD group and the other groups. In the Top Right and Bottom Left, the curves split after 40% of individuals in the group said a word in that quadrant. In the Bottom Right, the ProbableAD group diverges from the MCI and Control groups from the very beginning, indicating that individuals from the ProbableAD group said none of the words from that quadrant at a rate similar to that of individuals from the other two groups.
Fig. 9
Elapsed time until any quadrant content word is produced.
DISCUSSION
Overall, the data suggest that the measure of total number of unique core lexicon words may distinguish individuals with ProbableAD from controls but may not necessarily identify whether an individual has MCI. However, when the core lexicon content words were examined separately (main nouns and verbs), the number produced by the Controls was significantly larger than both the ProbableAD and MCI groups. Additionally, the measurement of time to production for content words revealed differences among the three groups. In the quadrant analysis, the Control and MCI groups’ performance was more similar, whereas it took longer for individuals in the ProbableAD group to produce the words in all quadrants, but mostly the Top Right, Bottom Left, and Bottom Right quadrants.
The finding of significantly lower core lexicon scores in the ProbableAD group compared to Controls was expected, given the vast literature on word-finding problems in this population.19–21 More specifically, the results are consistent with reports of fewer information units in AD groups than control groups in both English and French speakers for the same Cookie Theft picture description task.20,25 Information unit scoring differs slightly from core lexicon scoring in that it includes synonyms (e.g., plate for dish), and scoring may be for an action unit like falling off or go on the floor rather than an individual word. Advantages to using the core lexicon scoring are that it is based on normative data from controls, can be done with or without transcription, and requires minimal training or linguistic expertise for reliable results.18 Using CLAN, it can also be done automatically. A recent study of 12 participants with dementia of the Alzheimer’s type found that core lexicon scores were significantly correlated with dementia severity as well as with mean length of utterance, category fluency scores, and naming test scores.51 In that study, language samples were elicited using a wordless picture book, and the core lexicon was based on the 25 most frequent lemmas produced in each of five syntactic categories.
Although core lexicon is a measure of typicality rather than informativeness, it seems likely that the underlying basis for the observed group differences reported here and in previous research is the same. It is generally accepted that reduced informativeness in MCI and AD groups compared to Controls is a result of degradations in the semantic network that impede lexical access. This would be supported by the significant difference found between the Controls and both groups in the total number of unique core lexicon content words produced. It is likely that reduced typicality of word usage is driven by some degree of lexical access impairment. However, it is also possible to imagine a scenario in which typicality is maintained while informativeness is impaired (e.g., reduced overall output, but intact typicality of words). Therefore, future research should investigate the extent to which informativeness and typicality represent shared or distinct mechanisms of lexical and semantic access.
The MCI group’s performance resembled that of the Control group until about 17 of the 26 core lexicon words were produced, at which point they began to resemble the ProbableAD group. Though not quantitatively dramatic, the difference was significant and identified a clear shift in the MCI group’s performance. This shift likely reflects the variability among individuals in the MCI group, which is consistent with many reports in the literature, such as the “mixed evidence” (p. 926) described by Mueller et al. in their review of picture description tasks in this population and Fraser et al.’s description of MCI as a “heterogeneous condition with varying etiologies” (p. 15).2,52 A good way to learn more about this group’s behavior would be to increase sample sizes and follow the groups longitudinally. Given that some proportion of the MCI group is likely to convert to a diagnosis of dementia, further analyses may show that core lexicon analysis could be a potentially simple diagnostic and predictive tool.53–55
Another consideration regarding the shift in the curve after the production of 17 core lexicon words likely involves the relatively intact syntax in individuals with MCI and dementia on picture description tasks.1,56 Though grammatical complexity may be reduced, such that sentences are simpler and include fewer clauses, the simple function words from the core lexicon list such as the conjunction (and), determiners (a, the), prepositions (in, on), and pronouns (he, she) are likely to be present even if core lexicon nouns (stool) and verbs (overflow) are not. In fact, the analysis of core lexicon function words revealed no significant difference across the groups. The preservation of these basic function words may serve to cushion the core lexicon score as the percentage of verbs, specifically those associated with more arguments, for example, decreases.57 Thus, the core lexicon content word scores appear to sharpen the important diagnostic identification of early cognitive decline.
The new word alignment tier in CHAT files allowed for the analysis of elapsed time until a core lexicon word was produced. This analysis measures an aspect of efficiency slightly differently from the way it has been reported in the literature for this task: dividing the total number of information units produced by the total sample time, yielding a result like 0.30 information units per second. Those studies report significant differences between AD and control groups in efficiency and even early MCI and control groups. However, that computation does not necessarily reflect the actual timing of the production of the information units.3,28,53 In this study, the Control group produced most of the core lexicon content words (10/14) in significantly less time than the Probable AD group, as did the MCI group (8/14). Compared with the MCI group, the Control group produced one core lexicon content word in significantly less time. The MCI group’s curves for these 14 words can be seen to either fall between the other two groups (e.g., for boy, dry) or, more commonly, overlap with or at least more closely resemble the Control group (e.g., dish, mom, window, fall). One very interesting exception is the word jar where the MCI group outperforms the Control group both in how many people in the group say the word and how quickly. More of the ProbableAD group produced this word than Controls as well but not at a faster rate. Given that the words “Cookie jar” appear in the picture, it may be that the individuals with MCI are taking advantage of this information in describing the picture. Only about 80% of the Control group ever say the word, with perhaps some considering it obvious and not essential to “everything you see happening in the picture”.
It is important to consider these results in light of the fact that rate of speech differs across these three groups. If the results were simply due to the ProbableAD group’s slower rates of speech (average of 89 words per minute versus 128 and 120 in the MCI and control groups, respectively), the Kaplan-Meier curves would show similar curves for each group shifted slightly to the right for the speakers with slower rates. As this was not a timed task, individuals had as much time as they needed to describe the picture. Instead, the curves show different patterns across words, where sometimes, as in the word water, there is no difference in elapsed time across the groups. Other times, as in the word girl, the difference in elapsed time between the ProbableAD and Control groups does not begin to appear until after approximately 40% of them have said the word. Finally, for the word dry, the entire ProbableAD group is, in fact, slower from the start and only reaches the point where about 30% of the group says the word at all. Ultimately, the elapsed time measure for individual words allows more fine-grained analyses about the production of these core lexicon content words that may inform future work in prediction and detection.
Finally, Kaplan-Meier curves were created to show the time until any word in a given quadrant was said, using this automated temporal analysis as a low-tech way to track visual processing of the picture. Eye tracking data using a variety of devices has proven to be effective in automatic dementia detection using the Cookie Theft picture, with better classification accuracy occurring with the addition of language features.36,37,39 In this study, the goal was to find visuospatial patterns based on word alignment analyses that could be used clinically to differentiate the groups. All groups were quickest to mention a core lexicon content word in the Top Left. From there, the Control and MCI groups were quite similar in their time to each quadrant, moving mostly down to the Bottom Left, then Top Right and Bottom Right, which makes sense given the actions and layout of the picture. For example, the boy’s face, arms, and action are all in the Top Left, with his lower body in the Bottom Left. The same is true of the mother in the Upper and Lower Right. The only real connection between the left and right sides of the picture is that of the children’s devious behavior (left) being missed by the otherwise distracted mother (right). The ProbableAD group was significantly slower than the other two groups in the time it took them to get to each of those other three quadrants. The slower rate for the ProbableAD group on the specific, individual words as well as any word in a quadrant is consistent with many reports about the importance of temporal features of connected speech (e.g., hesitations and pauses) for dementia detection and diagnosis.22,31,41,58,59
The core lexicon analysis method is a straightforward, accessible tool for clinicians and researchers to use with this population for both early assessment and measurement of change in lexical skills over time. Results of these analyses provide benchmarks for performance on a picture description task commonly used to elicit discourse in these populations and shed light on the lexical deficits encountered in MCI and AD. The need for large, shared datasets cannot be overstated. Fraser et al. made a strong case for data sharing, and plenty of review articles have summarized the small sample sizes in studies and the need for international databases.1,6,11,61,62 A next direction for research should include using these kinds of results in a novel, large dataset to assess their accuracy in using changes in core lexicon as a diagnostic biomarker to predict group classification.
Limitations of the present study should be taken into consideration in interpreting the results and helping to guide future work in this area. For instance, the size of the study sample, which for the MCI group specifically was only 48, is relatively small. Furthermore, the MCI group comprised groups from two datasets that were collected almost 40 years apart. While state-of-the-art diagnostic guidelines were used for each corpus, and the guidelines did not change in any meaningful way during that time period, it is worth raising as a caution.
AUTHOR CONTRIBUTIONS
Davida Fromm (Conceptualization; Data curation; Investigation; Methodology; Project administration; Resources; Supervision; Validation; Writing – original draft; Writing – review & editing); Sarah Grace Dalton (Methodology; Writing – original draft; Writing – review & editing); Alexander Brick (Investigation; Methodology; Validation; Visualization); Gbenuola Olaiya (Formal analysis; Methodology; Validation; Visualization); Sophia Hill (Formal analysis; Methodology); Joel Greenhouse, Ph.D. (Formal analysis; Investigation; Methodology; Supervision; Validation; Visualization; Writing – original draft; Writing – review & editing); Brian MacWhinney (Funding acquisition; Resources; Software; Supervision; Writing – original draft; Writing – review & editing).
ACKNOWLEDGMENTS
The authors wish to thank the participants whose data were used in this study and the researchers who collected and contributed the data to the shared DementiaBank database.
FUNDING
This work was supported in part by an NIA DementiaBank supplement to the NIDCD AphasiaBank grant DC008524. Original acquisition of the Pitt corpus was supported by NIA grants AG005133 and AG003705 to the University of Pittsburgh.
CONFLICT OF INTEREST
The authors have no conflict of interest to report.
DATA AVAILABILITY
The data reported here are available to members of the DementiaBank consortium – https://dementia.talkbank.org/. Established researchers and clinicians working with dementia who are interested in joining the consortium should read the Ground Rules (https://talkbank.org/share/) and then send email to with contact information, affiliation, and a brief statement explaining reasons for joining.
SUPPLEMENTARY MATERIAL
{ label (or @symbol) needed for fn } The supplementary material is available in the electronic version of this article: https://dx.doi.org/10.3233/JAD-230844.
REFERENCES
1. | Filiou RP , Bier N , Slegers A , et al. Connected speech assessment in the early detection of Alzheimer’s disease and mild cognitive impairment: a scoping review. Aphasiology. (2020) ; 34: : 723–755. |
2. | Mueller KD , Hermann B , Mecollari J , et al. Connected speech and language in mild cognitive impairment and Alzheimer’s disease: a review of picture description tasks. J Clin Exp Neuropsychol. (2018) ; 40: : 917–939. |
3. | Mueller KD , Koscik RL , Hermann BP , et al. Declines in connected language are associated with very early mild cognitive impairment: results from the Wisconsin Registry for Alzheimer’s Prevention. Front Aging Neurosci. (2018) ; 9: : 437. |
4. | Taler V and Phillips NA . Language performance in Alzheimer’s disease and mild cognitive impairment: a comparative review. J Clin Exp Neuropsychol. (2008) ; 30: : 501–556. |
5. | Mestach M , Hartsuiker RJ and Pistono A . Can we track the progression of Alzheimer’s disease via lexical-semantic variables in connected speech? J Neurolinguist. (2024) ; 70: : 101189. |
6. | Vigo I , Coelho L and Reis S . Speech-and language-based classification of Alzheimer’s disease: a systematic review. Bioengineering. (2022) ; 9: : 27. |
7. | Bryant L , Spencer E and Ferguson A . Clinical use of linguistic discourse analysis for the assessment of language in aphasia. Aphasiology. (2017) ; 31: : 1105–1126. |
8. | Stark BC , Dutta M , Murray LL , et al. Spoken discourse assessment and analysis in aphasia: an international survey of current practices. J Speech Lang Hear Res. (2021) ; 64: : 4366–4389. |
9. | Beltrami D , Gagliardi G , Rossini Favretti R , et al. Speech analysis by natural language processing techniques: a possible tool for very early detection of cognitive decline? Front Aging Neurosci. (2018) ; 10: : 369. |
10. | Fraser KC , Lundholm Fors K , et al. Improving the sensitivity and specificity of MCI screening with linguistic information. In Proceedings of the LREC 2018 Workshop “Resources and processing of linguistic, para-linguistic and extra-linguistic data from people with various forms of cognitive/psychiatric impairments (RaPID-2)” (2015). (2018) , pp. 19–26. |
11. | de la Fuente Garcia S , Ritchie CW and Luz S . Artificial intelligence, speech, and language processing approaches to monitoring Alzheimer’s disease: a systematic review. J Alzheimers Dis. (2020) ; 78: : 1547–1574. |
12. | Pulido ML , Hernández JB , Ballester MÁ , et al. Alzheimer’s disease and automatic speech analysis: a review. Expert Syst Appl. (2020) ; 150: : 113213. |
13. | Thaler F and Gewald H . Language characteristics supporting early Alzheimer’s diagnosis through machine learning–a literature review. Health Inform Int J. (2021) ; 10: : 5–23. |
14. | Goodglass H , Kaplan E and Barresi B . BDAE- 3: Boston Diagnostic Aphasia Examination—Third edition. Philadelphia: Lippincott Williams & Wilkins, (2001) . |
15. | Becker JT , Boller F , Lopez OL , et al. The natural history of Alzheimer’s disease: description of study cohort and accuracy of diagnosis. Arch Neurol. (1994) ; 51: : 585–594. |
16. | Dalton SG , Hubbard HI and Richardson JD . Moving toward non-transcription based discourse analysis in stable and progressive aphasia. Semin Speech Lang. (2020) ; 41: : 32–44. |
17. | Dalton SG , Stark BC , Fromm D , et al. Validation of an automated procedure for calculating core lexicon from transcripts. J Speech Lang Hear Res. (2022) ; 65: : 2996–3003. |
18. | Kim H and Wright HH . Concurrent validity and reliability of the core lexicon measure as a measure of word retrieval ability in aphasia narratives. Am J Speech Lang Pathol. (2020) ; 29: : 101–110. |
19. | Bourgeois M , Fried-Oken M and Rowland C . AAC strategies and tools for persons with dementia. ASHA Lead. (2010) ; 15: : 8–11. |
20. | Croisile B , Ska B , Brabant MJ , et al. Comparative study of oral and written picture description in patients with Alzheimer’s disease. Brain Lang. (1996) ; 53: : 1–19. |
21. | Ross GW , Cummings JL and Benson DF . Speech and language alterations in dementia syndromes: Characteristics and treatment. Aphasiology. (1990) ; 4: : 339–352. |
22. | Slegers A , Filiou RP , Montembeault M , et al. Connected speech features from picture description in Alzheimer’s disease: A systematic review. J Alzheimers Dis. (2018) ; 65: : 519–542. |
23. | Dalton SG , AL Harbi M , Berube S , et al. Development of main concept and core lexicon checklists for the original and modern Cookie Theft stimuli. Aphasiology. (2024) ; doi: 10.1080/02687038.2024.2340794. |
24. | Fraser KC , Fors KL and Kokkinakis D . Multilingual word embeddings for the assessment of narrative speech in mild cognitive impairment. Comput Speech Lang. (2019) ; 53: : 121–139. |
25. | Ahmed S , de Jager CA , Haigh AM , et al. Semantic processing in connected speech at a uniformly early stage of autopsy-confirmed Alzheimer’s disease. Neuropsychol. (2013) ; 27: : 79. |
26. | Yancheva M and Rudzicz F . Vector-space topic models for detecting Alzheimer’s disease. In Proceedings of the 54th Annual Meeting of the Association for Computational Linguistics (Volume 1: Long Papers).. (2016) , pp. 2337–2346. |
27. | Bschor T , Kühl KP and Reischies FM . Spontaneous speech of patients with dementia of the Alzheimer type and mild cognitive impairment. Int Psychogeriatr. (2001) ; 13: : 289–298. |
28. | Giles E , Patterson K and Hodges JR . Performance on the Boston Cookie Theft picture description task in patients with early dementia of the Alzheimer’s type: missing information. Aphasiology. (1996) ; 10: : 395–408. |
29. | Smith SR , Chenery HJ and Murdoch BE . Semantic abilities in dementia of the Alzheimer type. II. Grammatical semantics. Brain Lang. (1989) ; 36: : 533–542. |
30. | Liu H , MacWhinney B , Fromm D , et al. Automation of language sample analysis. J Speech Lang Hearing Res. (2023) ; 66: : 2421–2433. |
31. | Vincze V , Szatlóczki G , Tóth L , et al. Telltale silence: temporal speech parameters discriminate between prodromal dementia and mild Alzheimer’s disease. Clin Linguist Phon. (2021) ; 35: : 727–742. |
32. | Kurylo DD , Allan WC , Collins TE , et al. Perceptual organization based upon spatial relationships in Alzheimer’s disease. Behav Neurol. (2003) ; 14: : 19–28. |
33. | Mendez MF , Mendez MA , Martin R , et al. Complex visual disturbances in Alzheimer’s disease. Neurology. (1990) ; 40: (3_part_1): 439. |
34. | Uhlhaas PJ , Pantel J , Lanfermann H , et al. Visual perceptual organization deficits in Alzheimer’s dementia. Dement Geriatr Cogn Disord. (2008) ; 25: : 465–475. |
35. | Ambadi PS , Basche K , Koscik RL , et al. Spatio-semantic graphs from picture description: applications to detection of cognitive impairment. Front Neurology. (2021) ; 12: : 795374. |
36. | Barral O , Jang H , Newton-Mason S , et al. Non-invasive classification of Alzheimer’s disease using eye tracking and language. In Machine Learning for Healthcare Conference. (2020) , pp. 813–841. |
37. | Field TS , Masrani V , Murray G , et al. Improving diagnostic accuracy of Alzheimer’s disease from speech analysis using markers of hemispatial neglect. Alzheimers Dement. (2017) ; 13: (7S_Part_3): 157–158. |
38. | Mirheidari B , Pan Y , Walker T , et al. Detecting Alzheimer’s disease by estimating attention and elicitation path through the alignment of spoken picture descriptions with the picture prompt. arXiv, arXiv:1910.00515 [Preprint]. Posted October 1. (2019) . |
39. | Sheng Z , Guo Z , Li X , et al. Dementia detection by fusing speech and eye-tracking representation. In ICASSP 2022–2022 IEEE International Conference on Acoustics, Speech and Signal Processing (ICASSP). (2022) , pp. 6457–6461. |
40. | Stoppa E , Di Donato GW , Parde N , et al. Computer-aided dementia detection: How informative are your features? In IEEE 7th Forum on Research and Technologies for Society and Industry Innovation (RTSI) (2022) , pp. 55–61. |
41. | Heidarzadeh N and Ratté S . ‘Eye-Tracking’with Words for Alzheimer’s disease detection: Time alignment of words enunciation with image regions during image description tasks. J Alzheimers Dis. (2023) ; 95: : 855–868. |
42. | Bouazizi M , Zheng C , Yang S , et al. Dementia detection from speech: What if language models are not the answer? Information (2023) ; 15: : 2. |
43. | Zhu Y , Lin N , Liang X , et al. Evaluating picture description speech for dementia detection using image-text alignment. arXiv, arXiv:2308.07933 [Preprint]. Posted August 11. (2023) . |
44. | Lanzi AM , Saylor AK , Fromm D , et al. DementiaBank: Theoretical rationale, protocol, and illustrative analyses. Am J Speech Lang Pathol. (2023) ; 32: : 426–438. |
45. | Knopman DS , Petersen RC and Jack Jr CR . A brief history of “Alzheimer disease” multiple meanings separated by a common name. Neurology. (2019) ; 92: : 1053–1059. |
46. | Albert MS , DeKosky ST , Dickson D , et al. The diagnosis of mild cognitive impairment due to Alzheimer’s disease: recommendations from the National Institute on Aging-Alzheimer’s Association workgroups on diagnostic guidelines for Alzheimer’s disease. Alzheimers Dement. (2011) ; 7: : 270–279. |
47. | Folstein MF , Folstein SE and McHugh PR . “Mini-mental state”: a practical method for grading the cognitive state of patients for the clinician. J Psychiatr Res. (1975) ; 12: : 189–198. |
48. | Nasreddine ZS , Phillips NA , Bédirian V , et al. The Montreal Cognitive Assessment, MoCA: a brief screening tool for mild cognitive impairment. J Am Geriatr Soc. (2005) ; 53: : 695–699. |
49. | McWhinney B . The CHILDES project: Tools for analyzing talk. Mahwah, NJ: Erlbaum, (2000) . |
50. | Collett D . Modelling survival data in medical research. Chapman and Hall/CRC, (2023) . |
51. | Kintz S , Kim H and Wright HH . A preliminary investigation on core lexicon analysis in dementia of the Alzheimer’s type. Int J Lang Commun Disord. (2024) ; doi: 10.1111/1460-6984.12999. |
52. | Fraser KC , Lundholm Fors K , Eckerström M , et al. Predicting MCI status from multimodal language data using cascaded classifiers. Front Aging Neurosci. (2019) ; 11: : 205. |
53. | Ahmed S , Haigh AM , de Jager CA , et al. Connected speech as a marker of disease progression in autopsy-proven Alzheimer’s disease. Brain. (2013) ; 136: : 3727–3737. |
54. | Chen Y , Qian X , Zhang Y , et al. Prediction models for conversion from mild cognitive impairment to Alzheimer’s disease: a systematic review and meta-analysis. Front Aging Neurosci. (2022) ; 14: : 840386. |
55. | Mueller KD , Koscik RL , Turkstra LS , et al. Connected language in late middle-aged adults at risk for Alzheimer’s disease. J Alzheimers Dis. (2016) ; 54: : 1539–1550. |
56. | Hier DB , Hagenlocker K and Shindler AG . Language disintegration in dementia: effects of etiology and severity. Brain Lang. (1985) ; 25: : 117–133. |
57. | Kim M and Thompson CK . Verb deficits in Alzheimer’s disease and agrammatism: implications for lexical organization. Brain Lang. (2004) ; 88: : 1–20. |
58. | Hoffmann I , Nemeth D , Dye CD , et al. Temporal parameters of spontaneous speech in Alzheimer’s disease. Int J Speech Lang Pathol. (2010) ; 12: : 29–34. |
59. | Martínez-Nicolás I , Llorente TE , Martínez-Sánchez F , et al. Ten years of research on automatic voice and speech analysis of people with Alzheimer’s disease and mild cognitive impairment: a systematic review article. Front Psychol. (2021) ; 12: : 620251. |
60. | Yuan J , Cai X , Bian Y , et al. Pauses for detection of Alzheimer’s disease. Front Comput Sci. (2021) ; 2: : 624488. |
61. | Fraser KC , Linz N , Lindsay H , et al. The importance of sharing patient-generated clinical speech and language data. In CLPsyc 2019-Sixth Workshop on Computational Linguistics and Clinical Psychology. (2019) , pp. 55–61. |
62. | Li Y , Lin Y , Ding H , et al. Speech databases for mental disorders: a systematic review. Gen Psychiatry. (2019) ; 32: : e100022. |
Notes
1 DementiaBank – https://dementia.talkbank.org/ – is part of the TalkBank system, currently the world’s largest repository of shared databases for spoken language, and is freely open to researchers, educators, and clinicians.
2 The term probableAD is used here to reflect the specific diagnosis made at the clinical consensus meetings for the Pitt corpus in the 1980s. See Knopman et al. for a brief history of the diagnostic terminology.45


