
Impact of Eating a Carbohydrate-Restricted Diet on Cortical Atrophy in a Cross-Section of Amyloid Positive Patients with Alzheimer’s Disease: A Small Sample Study
Abstract
Background:
A carbohydrate-restricted diet aimed at lowering insulin levels has the potential to slow Alzheimer’s disease (AD). Restricting carbohydrate consumption reduces insulin resistance, which could improve glucose uptake and neural health. A hallmark feature of AD is widespread cortical thinning; however, no study has demonstrated that lower net carbohydrate (nCHO) intake is linked to attenuated cortical atrophy in patients with AD and confirmed amyloidosis.
Objective:
We tested the hypothesis that individuals with AD and confirmed amyloid burden eating a carbohydrate-restricted diet have thicker cortex than those eating a moderate-to-high carbohydrate diet.
Methods:
A total of 31 patients (mean age 71.4±7.0 years) with AD and confirmed amyloid burden were divided into two groups based on a 130 g/day nCHO cutoff. Cortical thickness was estimated from T1-weighted MRI using FreeSurfer. Cortical surface analyses were corrected for multiple comparisons using cluster-wise probability. We assessed group differences using a two-tailed two-independent sample t-test. Linear regression analyses using nCHO as a continuous variable, accounting for confounders, were also conducted.
Results:
The lower nCHO group had significantly thicker cortex within somatomotor and visual networks. Linear regression analysis revealed that lower nCHO intake levels had a significant association with cortical thickness within the frontoparietal, cingulo-opercular, and visual networks.
Conclusions:
Restricting carbohydrates may be associated with reduced atrophy in patients with AD. Lowering nCHO to under 130 g/day would allow patients to follow the well-validated MIND diet while benefiting from lower insulin levels.
INTRODUCTION
Due to a lack of effective pharmacological treatments for Alzheimer’s disease (AD), patients at risk for AD and those with cognitive impairment (CI) are seeking non-pharmacological approaches to reduce symptoms and disease progression. There is significant evidence from epidemiological studies that diet can protect against cognitive decline and neurodegeneration [1–6].
The rationale behind restricting carbohydrate intake in patients with CI is to reduce insulin levels. Brain cells rely on the insulin signaling through insulin receptors to transport and metabolize glucose [7, 8]. Cerebral glucose hypometabolism, an early sign of AD-related etiology, is linked to insulin resistance, which increases with age and is prevalent in AD [9, 10]. AD and type 2 diabetes have shared, underlying molecular mechanisms such as impaired insulin signaling and mitochondrial dysfunction [11, 12]. Both are strongly associated with cognitive decline [13] and lead to amyloid-β (Aβ) and neurofibrillary tangle formation [14]. Lowering blood glucose and insulin levels may also facilitate the clearance of Aβ peptides [15], which form plaques that disrupt brain cell signaling [10, 16].
Individuals consuming a carbohydrate-restricted diet may experience lower levels of insulin resistance compared to older adults who eat the standard American diet, which typically consists of 900 calories (225 g) from carbohydrate intake per day in a 2000 calorie diet, as reported by the National Center for Health Statistics [17]. This level of carbohydrate intake would be considered moderate. In contrast, intake of approximately 100–130 g of net carbohydrates (nCHO), or total carbohydrate intake minus fiber intake per day [18] would be considered within the low nCHO range. Evidence from a randomized controlled trial (RCT) conducted at Framingham State University showed that that a carbohydrate-restricted diet led to lowered insulin secretion and improved insulin resistance in adults [19]. Additionally, a recent meta-analysis of twenty-three trials studying the efficacy of a carbohydrate-restricted diet on type 2 diabetes found that patients had higher rates of remission when eating a carbohydrate-restricted diet (defined as < 130 g/day) [20]. There is little research on the effects of nCHO intake on brain atrophy. A recent study found that higher carbohydrate intake was associated with thinner cortex within the medial temporal lobe [21]. However, there are no RCTs registered on clinicaltrials.gov or peer-reviewed publications researching carbohydrate-restricted diets with this threshold in patients with AD or with confirmed AD-related neuropathology.
Adherence to Mediterranean-style (MeDi) and MIND diets, rich in nutrient-dense carbohydrates like whole grains, fruits, and vegetables, is linked with improved cognitive [22, 23] and neurodegenerative outcomes [5, 6, 10, 22]. A 100–130 g nCHO cutoff allows individuals to follow MIND diet guidelines, and incorporates well into a carbohydrate-restricted nutrition program.
The goal of this small sample, observational study is to explore the neurological benefits of a carbohydrate-restricted diet in a cross-section of patients with AD and confirmed amyloid burden. In this study, we defined the threshold for a carbohydrate-restricted diet as less than 130 g nCHO/day [22]. This particular cutoff was selected based on evidence from the diabetes and obesity literature, which indicates that maintaining carbohydrate intake below this level effectively reduces insulin resistance [19, 20, 24, 25]. Additionally, research in older adults indicates that insulin resistance is associated with cortical thickness and is likely one of the earliest modifiable risk factors for AD [6]. We hypothesized that participants with a history of eating lower nCHO levels would have thicker cerebral cortices compared to those with higher nCHO intake. Widespread cortical thinning is a hallmark neurological feature of AD [26], and we expected to find preservation of cortical gray matter in the lower nCHO group, especially within brain regions commonly associated with AD [27–30], particularly within the default mode [31] and dorsal attention networks [32, 33], which are functionally impaired in AD. Understanding the impact of diet on gray matter is important because AD-associated cortical atrophy is linked to clinical symptoms of AD such as aphasia and dementia [27–30].
MATERIALS AND METHODS
Participants
All participants evaluated in this study were recruited as part of a larger study detailed in recent work using the inclusion/exclusion criteria detailed in [34]. Study approval was obtained from the WIRB-Copernicus Group Institutional Review Board (WCG® IRB) (Protocol # 20190583) with informed consent obtained from each of the participants. This research was conducted in accordance with the Helsinki Declaration of 1975. Eligibility criteria include: aged at least 50 years old, FAST [35] Stage 2–4 (subjective cognitive decline (SCD), MCI or early AD no functional impairment, amyloid positivity, English fluency, possess and ability to operate a computer, ability to converse with a coach telephonically, normal or corrected visual and hearing acuity, answers “no” to all items of the PAR-Q+ [36] or provides physician clearance to participate in a moderately intensive exercise program. Exclusion criteria: non-AD neurodegenerative disorder (e.g., Lewy body dementia, frontotemporal dementia), existing diagnosis of cerebrovascular disease as the primary cause of cognitive impairment, participant or immediate family members with known AD mutation in the PSEN or APP genes, MMSE below 19 or Clinical Dementia Rating Scale > 2, as evidenced in their patient medical history.
Screening of individuals for the study for biomarker evidence of Alzheimer’s disease [37] was done by either PET imaging with Florbetapir (18F) [38] or CSF amyloid [39]. Briefly, 42 individuals were evaluated at the Pacific Brain Health Center (PBHC), located in Santa Monica, California at Providence St. John’s Health Center as part of a larger clinical trial [34]. PBHC promotes healthy brain aging through a combination of multidisciplinary team medical management and patient education encouraging a healthy lifestyle. All individuals enrolled in the study prior to our data freeze (June 1, 2022) were included if they provided a Food Frequency Questionnaire (FFQ) and received T1-weighted structural magnetic resonance imaging (sMRI). Two participants were excluded due to having contraindications for receiving sMRI. We excluded 9 participants because they were unable to complete their FFQ. A total of 31 participants were analyzed for this study.
Participants or their care partners provided a detailed medical history along with demographic information, including sex, date of birth, handedness, ethnicity, and race. See Table 1 for participant demographics. Medical history was confirmed through manual review of patient medical records through an Electronic Medical Record (EMR) system.
Table 1
Demographic, clinical, and lifestyle characteristics
| Lower nCHO | Higher nCHO | Total | p | |
| (n = 18) | (n = 13) | (n = 31) | ||
| Sex (% female) | 9 (50.0) | 8 (61.5) | 17 (54.8) | 0.81 |
| Age (y) | 0.16 | |||
| Mean (SD) | 69.9 (7.4) | 73.5 (6.1) | 71.4 (7.0) | |
| Range (min-max) | 57.0–83.8 | 63.6–82.3 | 57.0–83.8 | |
| Education (y) | 0.99 | |||
| Mean (SD) | 16.8 (2.2) | 16.8 (2.3) | 16.8 (2.2) | |
| Range (min-max) | 13.0–20.0 | 12.0–20.0 | 12.0–20.0 | |
| Handedness (% right) | 94.4 | 76.9 | 87.1 | 0.56 |
| FAST Stage | 0.59 | |||
| Mean (SD) | 3.1 (0.5) | 3.2 (0.4) | 3.1 (0.4) | |
| Range (min-max) | 2–4 | 3–4 | 2–4 | |
| Ethnicity (% Hispanic or Latino) | 5.6 | 0 | 3.2 | – |
| Race (% Asian or Native Hawaiian or Pacific Islander) | 11.1 | 23.1 | 16.1 | 0.65 |
| Race (% White) | 88.9 | 76.9 | 83.9 | 0.24 |
| APOE ɛ4 carrier (n) | 17 | 11 | 28 | 0.25 |
| % | 70.6 | 63.6 | 67.9 | |
| BMI (kg2/m) | 0.55 | |||
| Mean (SD) | 23.8 (3.8) | 23.0 (3.2) | 23.4 (3.5) | |
| Range (min-max) | 17.5–31.4 | 17.0–27.9 | 17.0–31.4 | |
| MoCA | 0.60 | |||
| Mean (SD) | 21.9 (3.23) | 21.2 (4.4) | 21.6 (3.7) | |
| Range (min-max) | 15.0–29.0 | 14.0–28.0 | 14.0–29.0 | |
| MESA without CAC (% 10-y risk) | 0.37 | |||
| Mean (SD) | 5.8 (3.5) | 7.0 (3.9) | 6.3 (3.7) | |
| Range (min-max) | 1.4–12.3 | 2.6–15.4 | 1.4–15.4 | |
| QUICKI (n) | 17 | 10 | 27 | 0.32 |
| Mean (SD) | 0.36 (0.05) | 0.35 (0.03) | 0.36 (0.04) | |
| Range (min-max) | 0.30–0.45 | 0.30–0.41 | 0.30–0.45 | |
| Kcal | 0.96 | |||
| Mean (SD) | 1515.2 (601.4) | 1506.8 (383.6) | 1511.7 (513.7) | |
| Range (min-max) | 578.6–2495.8 | 1111.8–2200.5 | 578.6–2495.8 | |
| Activity level (METs) | 0.92 | |||
| n | 18 | 13 | 31 | |
| Mean (SD) | 2633.3 (1576.0) | 2568.0 (1787.9) | 2606.3 (1635.9) | |
| Range (min-max) | 219.0–6041.0 | 888.0–5970.0 | 219.0–6041.0 |
Group differences are indicated by p values from two-tailed t-tests for numerical variables and chi-squared tests for categorical variables. Carbohydrate intake groups are based on Food Frequency Questionnaires (FFQ) scored using the FFQ EPIC Tool for Analysis (FETA). nCHO, estimated daily carbohydrate intake (g) –estimated daily fiber intake (g); Lower nCHO group, intake of ≤130 g; Higher nCHO group, intake of > 130 g; CAC, coronary artery calcification; % 10-y risk, risk of coronary heart disease; kcal, estimated daily kilocalorie intake. METs are collected using the International Physical Activity Questionnaire. A MET-minute is computed by multiplying the MET score by the minutes performed.
Clinical characteristics
Clinical blood labs were conducted on all participants [34]. Cardiovascular risk was calculated using the Multi-Ethnic Study of Atherosclerosis (MESA) 10-year coronary heart disease risk [40–42], without coronary artery calcification (https://github.com/vcastro). The Functional Assessment Staging Tool for Dementia (FAST), also known as the Reisberg Functional Assessment Staging Scale, was assessed by a study clinician [35]. Apolipoprotein (APOE) genotype was assessed in 28 participants. Additionally, we collected height and weight. From these measures, body mass index (BMI) in kg/m2 was calculated in all individuals. Insulin sensitivity was calculated using the Quantitative Insulin Sensitivity Check Index (QUICKI) in 27 participants [43]. See Table 1 for detailed clinical characteristics.
Lifestyle information
Lifestyle information including diet and physical activity were collected with the assistance of care partners as needed. In instances where patients experienced minor memory complaints, they independently completed the assessments. If a patient was unable to provide questionnaire responses and lacked a care partner who could supply their lifestyle information, those data were not collected. It should be noted that these assessments primarily captured recent habits rather than lifetime behaviors, thereby limiting the ability to establish typical behaviors prior to the onset of the disease. A FFQ adapted by the University of Cambridge for the EPIC (European Prospective Investigation into Cancer) Norfolk study [44] was collected to assess diet. This version of the FFQ utilizes food list items derived from an FFQ used widely in the United States [45, 46]. To complete an FFQ, individuals describe their typical diet over the past year by reporting on the frequency and sometimes portion size of a variety of food and beverage items based on a context-specific food list. For example, patients were asked about the number of medium servings of bacon they consumed on average over the past year. They were provided with several frequency options to choose from, including, but not limited to, the following: never or less than once per month, 1–3 per month, 5–6 per week, and 2–3 per day. Estimated daily total carbohydrate, fiber, and calorie intake were computed using FFQ data as input to the validated FFQ EPIC Tool for Analysis (FETA) [47]. The following formula was used to calculate nCHO intake:
International Physical Activity Questionnaire (IPAQ), which estimates Metabolic Equivalent of Task (MET-min/week) for the past week from a series of questions related to an individual’s level of low, moderate, and high intensity physical activity [36, 48] was completed by 27 of these participants (see Table 1 for lifestyle measures).
Neurocognitive measures
The neurocognitive assessment battery was previously described [34]. Global cognitive assessment was collected using the Montreal Cognitive Assessment (MoCA) [49].
Quantitative magnetic resonance imaging
Brain MRI scans were done on a 3T General Electric Discovery MR 750 Scanner. Acquisitions included a T1-weighted fast spoiled gradient echo (FSPGR) scan. Scan parameters were as follows: repetition time, 7.91 ms; echo time, 2.96 ms, flip angle, 8°; field of view, 240×240; image voxel size, 1×1×1 mm; acquisition time, 2.53 min.
Cortical reconstruction was performed using the FreeSurfer image analysis suite (https://surfer.nmr.mgh.harvard.edu/) [50–62]. Briefly, this processing included motion correction [61], removal of non-brain tissue using a hybrid watershed/surface deformation procedure [60], automated Talairach transformation, segmentation of the subcortical white matter and deep gray matter volumetric structures [55, 56], intensity normalization [63], tessellation of the gray matter white matter boundary, automated topology correction [54, 64], and surface deformation following intensity gradients to optimally place the gray/white and gray/cerebrospinal fluid borders [50, 51, 53].
Cortical models were followed by surface inflation [52], registration to a spherical atlas which was based on individual cortical folding patterns to match cortical geometry across subjects [57], and creation of surface-based maps of cortical thickness. Procedures for the measurement of cortical thickness have been validated against histological analysis [65] and manual measurements [66,67]. FreeSurfer morphometric procedures have been demonstrated to show good test-retest reliability across scanner manufacturers and across field strengths [58,62].
Statistical analysis
We divided our participants in two groups based on the average daily number of nCHO, where the lower nCHO group consumed nCHO < 130 g and the higher nCHO group reported eating nCHO ≥ 130 g [18]. Study data were collected and managed using Research Electronic Data Capture (REDCap) tools hosted at Providence Health & Services [68]. All statistical analyses were conducted within SYSTAT 13 [69].
Prior to analyses, data were inspected for outliers and homogeneity of variance to ensure appropriateness of parametric statistical tests. Lower and higher nCHO groups were compared on demographics, clinical characteristics, and lifestyle measures using a two-tailed two-sample t-test or a χ2 test, where appropriate, with an alpha level of 0.05. We also assessed the relationship between common confounders (age and sex), our primary independent variable (nCHO), and our dependent variable (mean cortical thickness) with an alpha level of 0.10.
All cortical surface-based analyses were conducted within the FreeSurfer statistical software package. Analyses looking at the differences between our two groups were conducted using a two-tailed two-independent sample t-test with a voxel-wise alpha level of 0.05 (uncorrected) and cluster-wise probability (CWP) correction for multiple comparisons of 0.05. We also conducted a secondary cortical surface-based analysis evaluating the linear association between nCHO intake, as a continuous variable, and cortical thickness controlling for age at an alpha level of 0.05 (for both voxel-wise and CWP).
Significant clusters obtained from FreeSurfer results were further analyzed using SYSTAT 13 [69]. Cortical thickness of the clusters resulting from primary analysis were examined with respect to nCHO group, controlling for age, sex, education, and BMI. Cortical thickness of the clusters resulting from secondary analysis were examined with respect to continuous nCHO intake, controlling for same covariates. These additional linear regression models were conducted to ensure that the observed findings were not caused by common confounders.
RESULTS
Participants
See Table 1 for participant demographics and clinical and lifestyle characteristics. Of the 31 participants, 58% (18) were classified into the lower and 42% (13) into the higher nCHO group. We found no significant or trend differences between groups in demographic, clinical, or lifestyle characteristics (average daily kcal consumption or weekly activity level). Mean cortical gray matter thickness was not associated with age (β= –0.06, SE = 0.003, t = –0.25, p = 0.8) or sex (β= –0.06, SE = 0.04, t = –0.31, p = 0.8). Continuous nCHO showed a trend association with age (β= 0.31, SE = 1.66, t = 1.73, p = 0.095) but not sex (β= –0.09, SE = 24.09, t = –0.50, p = 0.6).
Quantitative image analysis
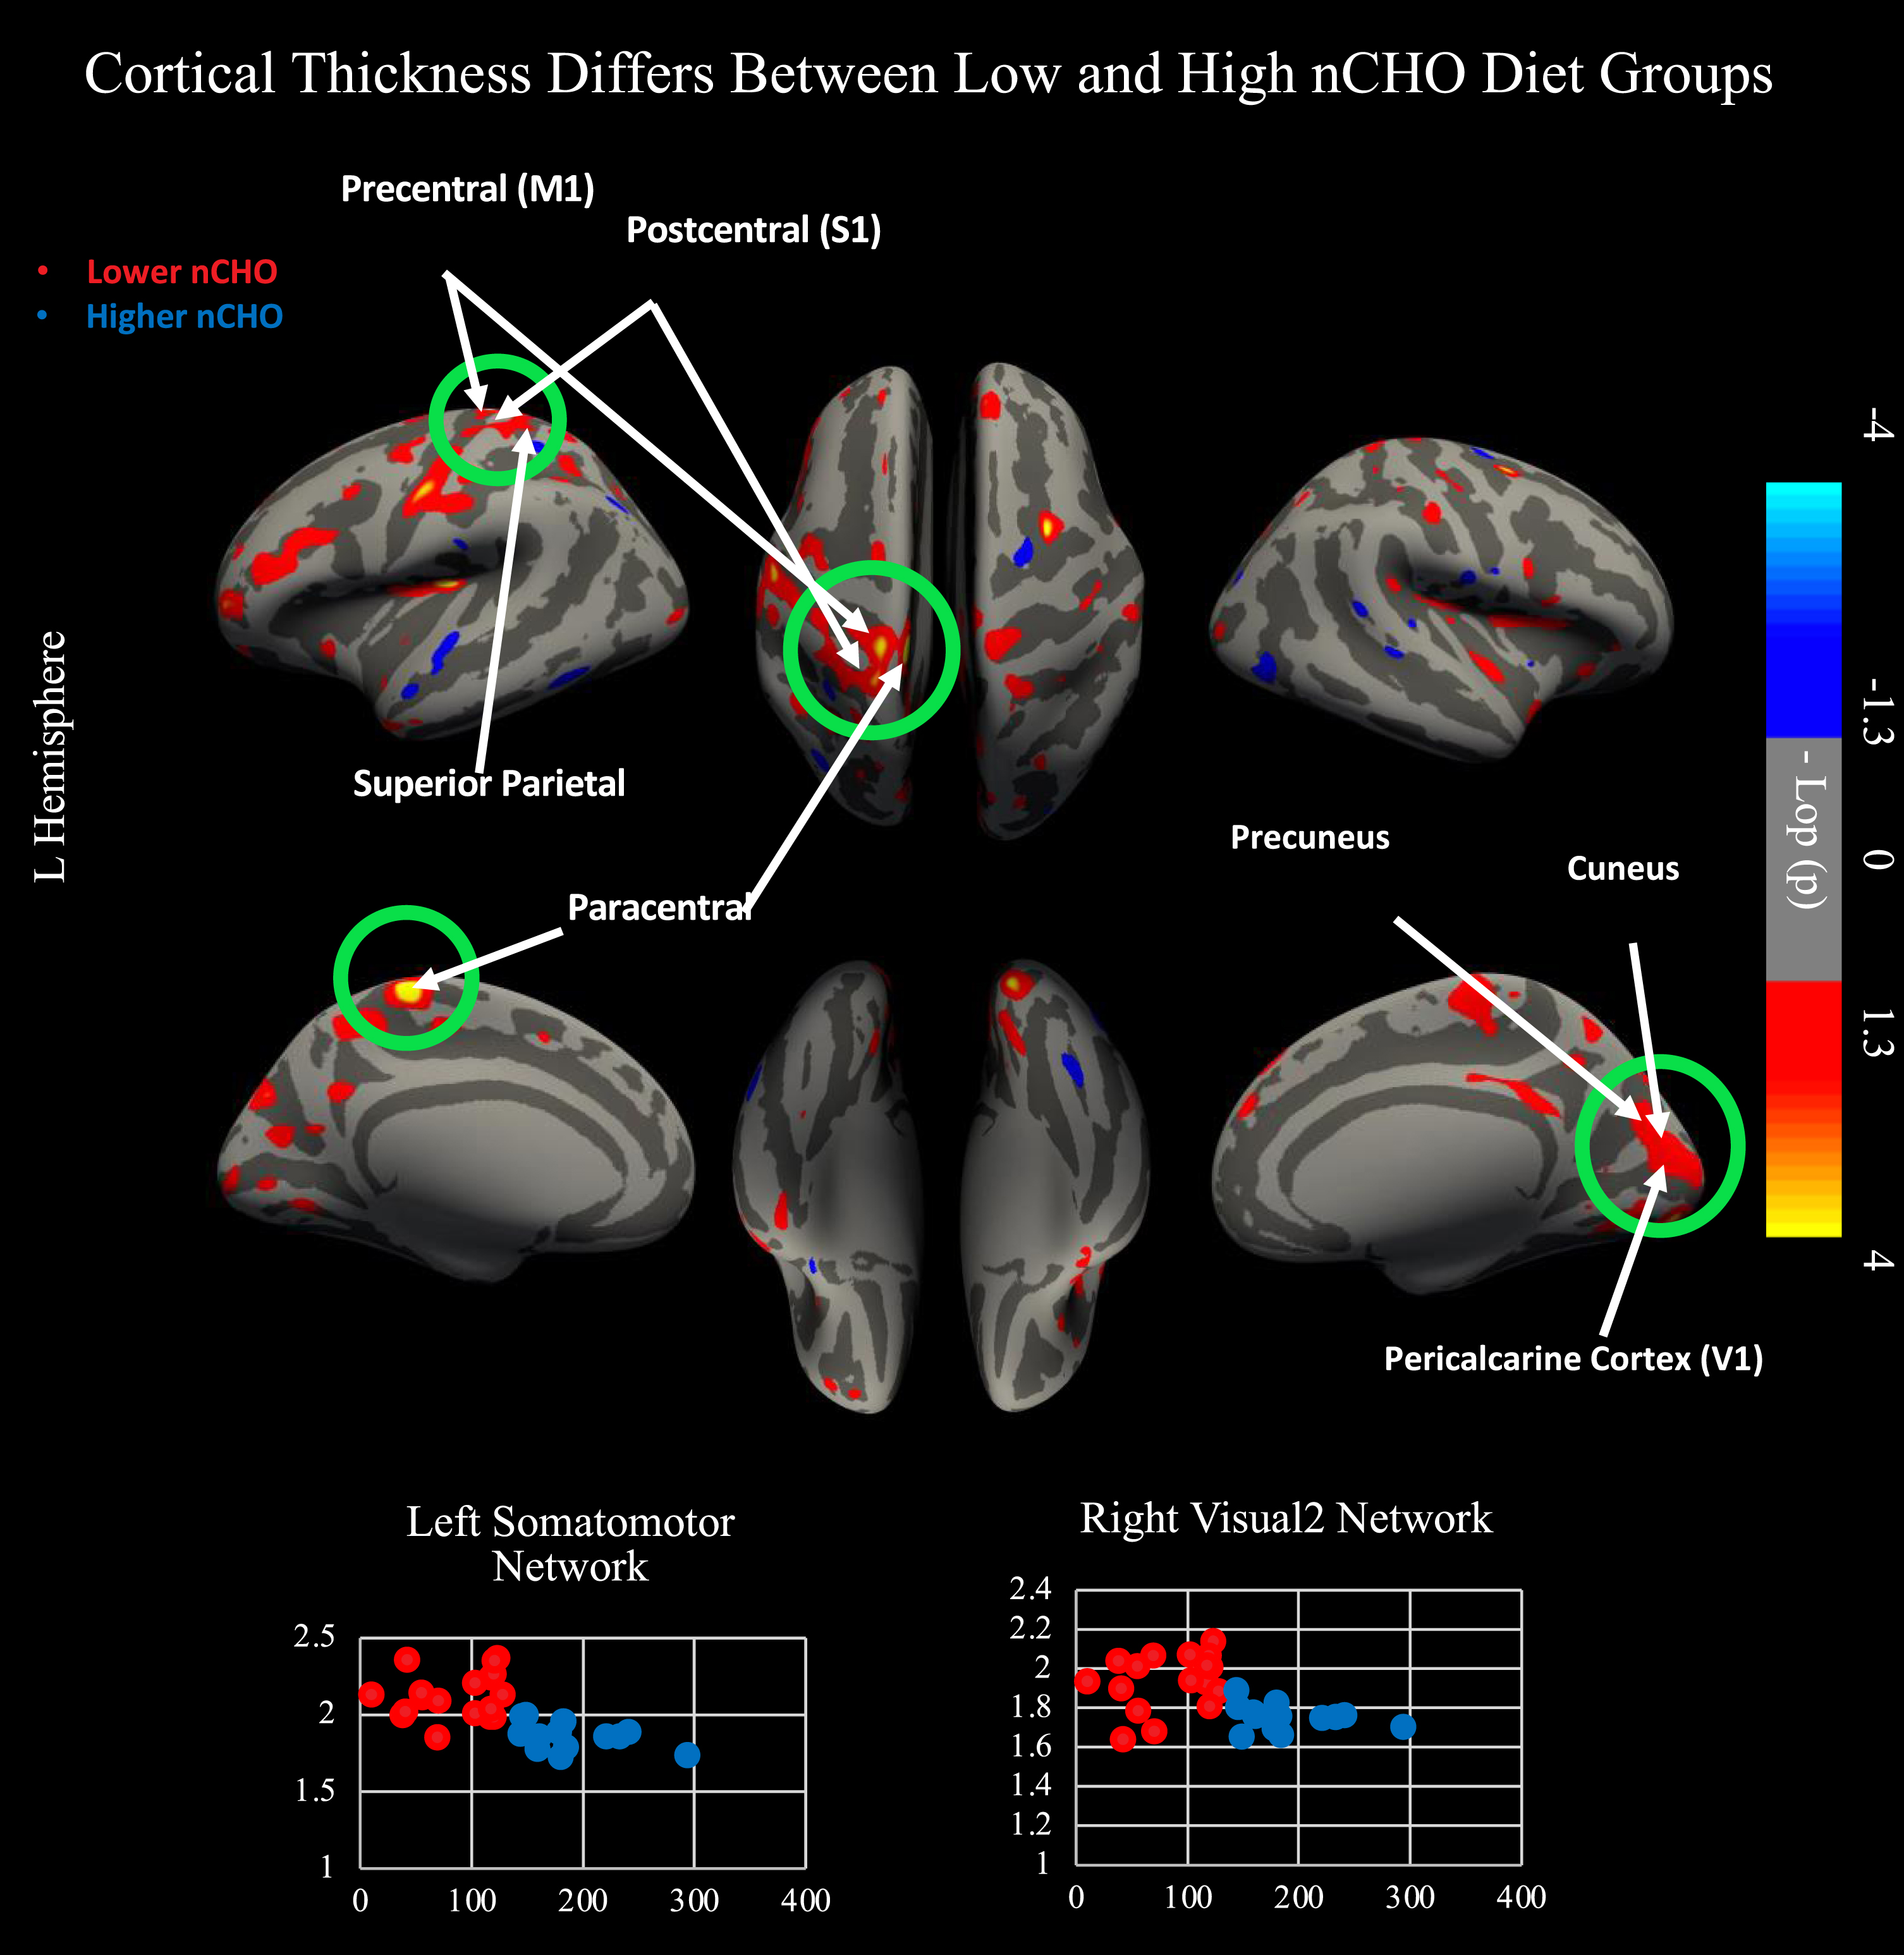
There was a significant effect after CWP correction of nCHO group on cortical thickness within primary and secondary visual and somatomotor networks (Fig. 1). Specifically, we found significant clusters included voxels from primary sensory cortex (1, 2, 3a, 3b), primary motor cortex, area 5 m, primary visual cortex (V1), second, third, and sixth visual areas (V2, V3, V6), and the dorsal transitional visual area (DVT), with cluster peaks located in primary motor (mean difference = 0.266 mm2; Cohen’s d = 2.1; CWP = 0.001; cluster size = 1343 mm2) and secondary visual cortices (mean difference = 0.188 mm2; Cohen’s d = 1.65; CWP = 0.005; cluster size = 1154 mm2). Results within these clusters remained significant after controlling for age, sex, education, and BMI (p < 0.0001).
Fig. 1
Results from two independent sample, two-tailed t-test comparing lower - higher net carbohydrate (nCHO) diet groups. Top of figure shows results from cortical surface analysis. Green circles indicate regions that survived correction for multiple comparisons using CWP <0.05. White arrows point to highlighted anatomical regions. Warmer colors represent voxels with significantly thicker cortex in the lower than higher nCHO diet group. Bottom of figure contains scatterplots displaying results extracted from the peak voxel in the network indicated. Lower nCHO individuals are plotted in red. Higher nCHO individuals are plotted in blue. Regions plotted include the left primary motor cortex (4) within the somatomotor network and V2 within the right secondary visual network. Regions significant after CWP correction include primary sensory cortex (1, 2, 3a, 3b), primary motor cortex, area 5 m, primary visual cortex (V1), second, third, and sixth visual areas (V2, V3, V6), and the dorsal transitional visual area (DVT). Network and regional definitions were taken from the Human Connectome Project Multi-Modal Parcellation (HCP-MMP) Atlas.
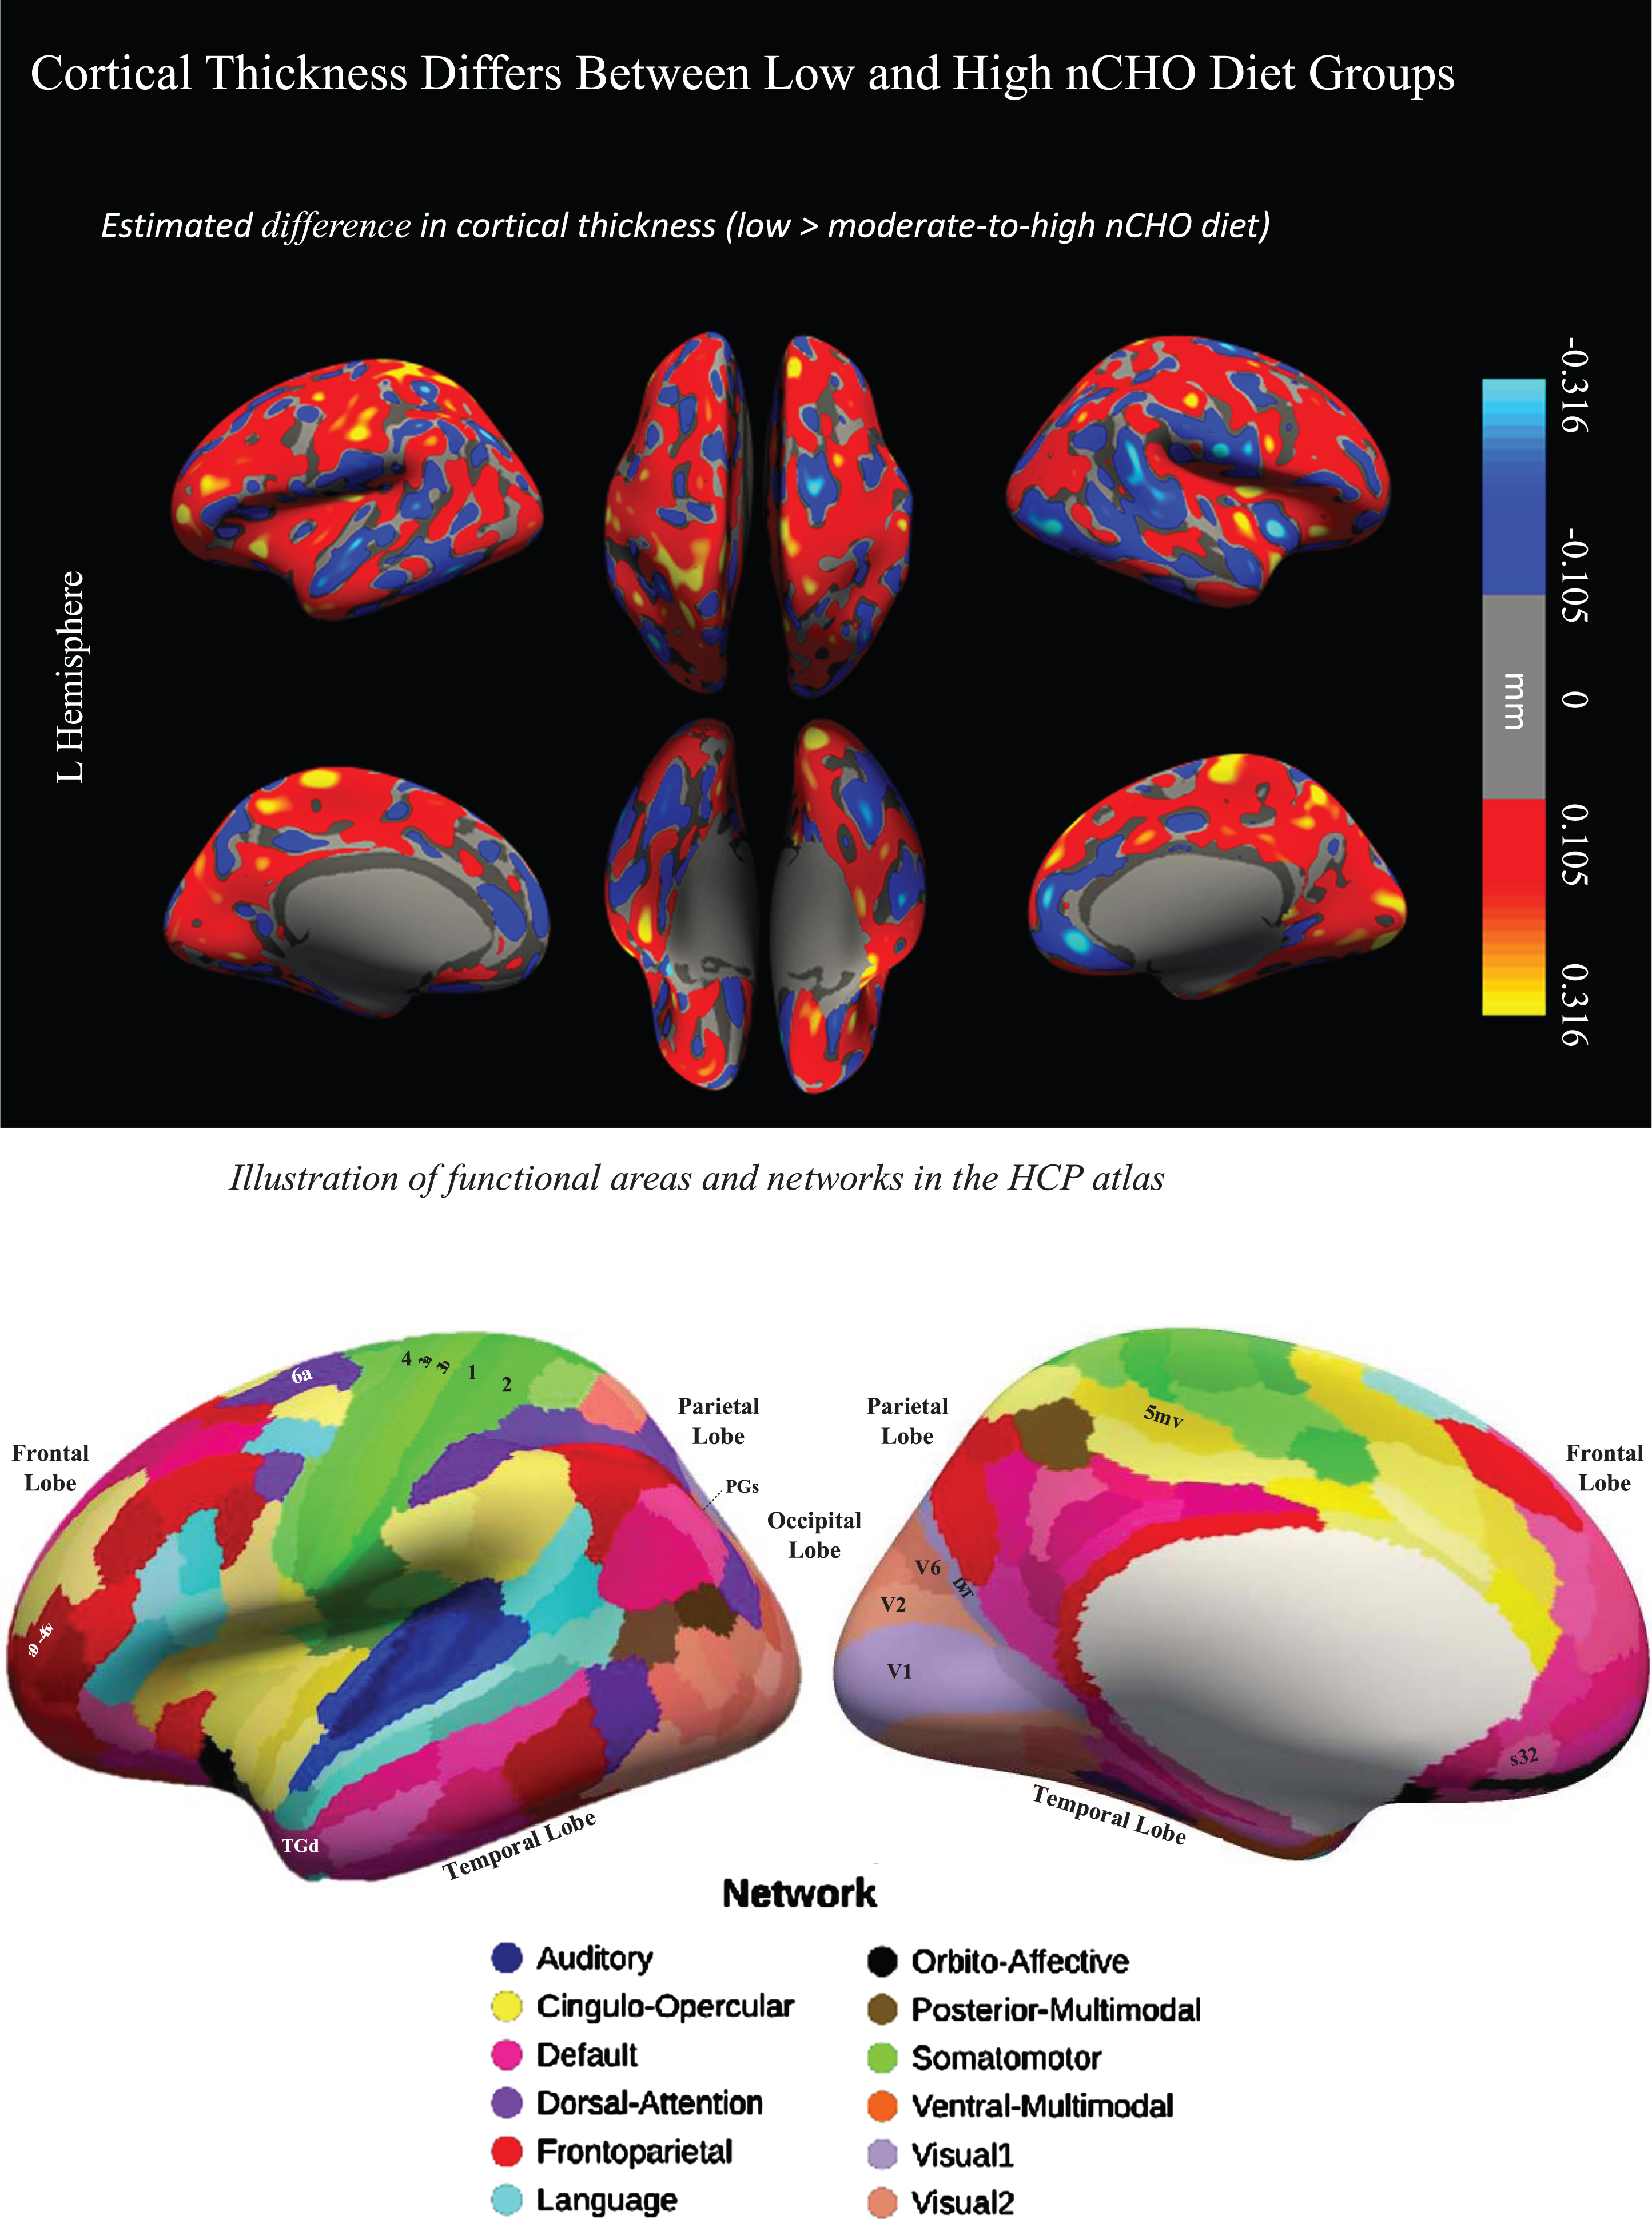
Uncorrected findings showed that individuals in the lower nCHO group had a pattern of generally thicker cortex than those eating a higher nCHO diet (Figs. 1 and 2). These results included expected differences between groups in regions commonly associated with AD [27–30,32,33] including parietal, frontal, visual, and lateral temporal cortices including the default mode and dorsal attention networks.
Fig. 2
Difference in cortical thickness between lower –higher nCHO diet groups and anatomical reference. Top of figure shows the cortical surface-wide map of the difference in cortical thickness between lower and higher nCHO diet groups. Warmer colors represent voxels with larger thickness in the lower than higher nCHO diet group. Cooler colors represent voxels with larger thickness in the higher than lower nCHO diet group. Bottom of figure shows the Human Connectome Project Multi-Modal Parcellation (HCP-MMP) Atlas.
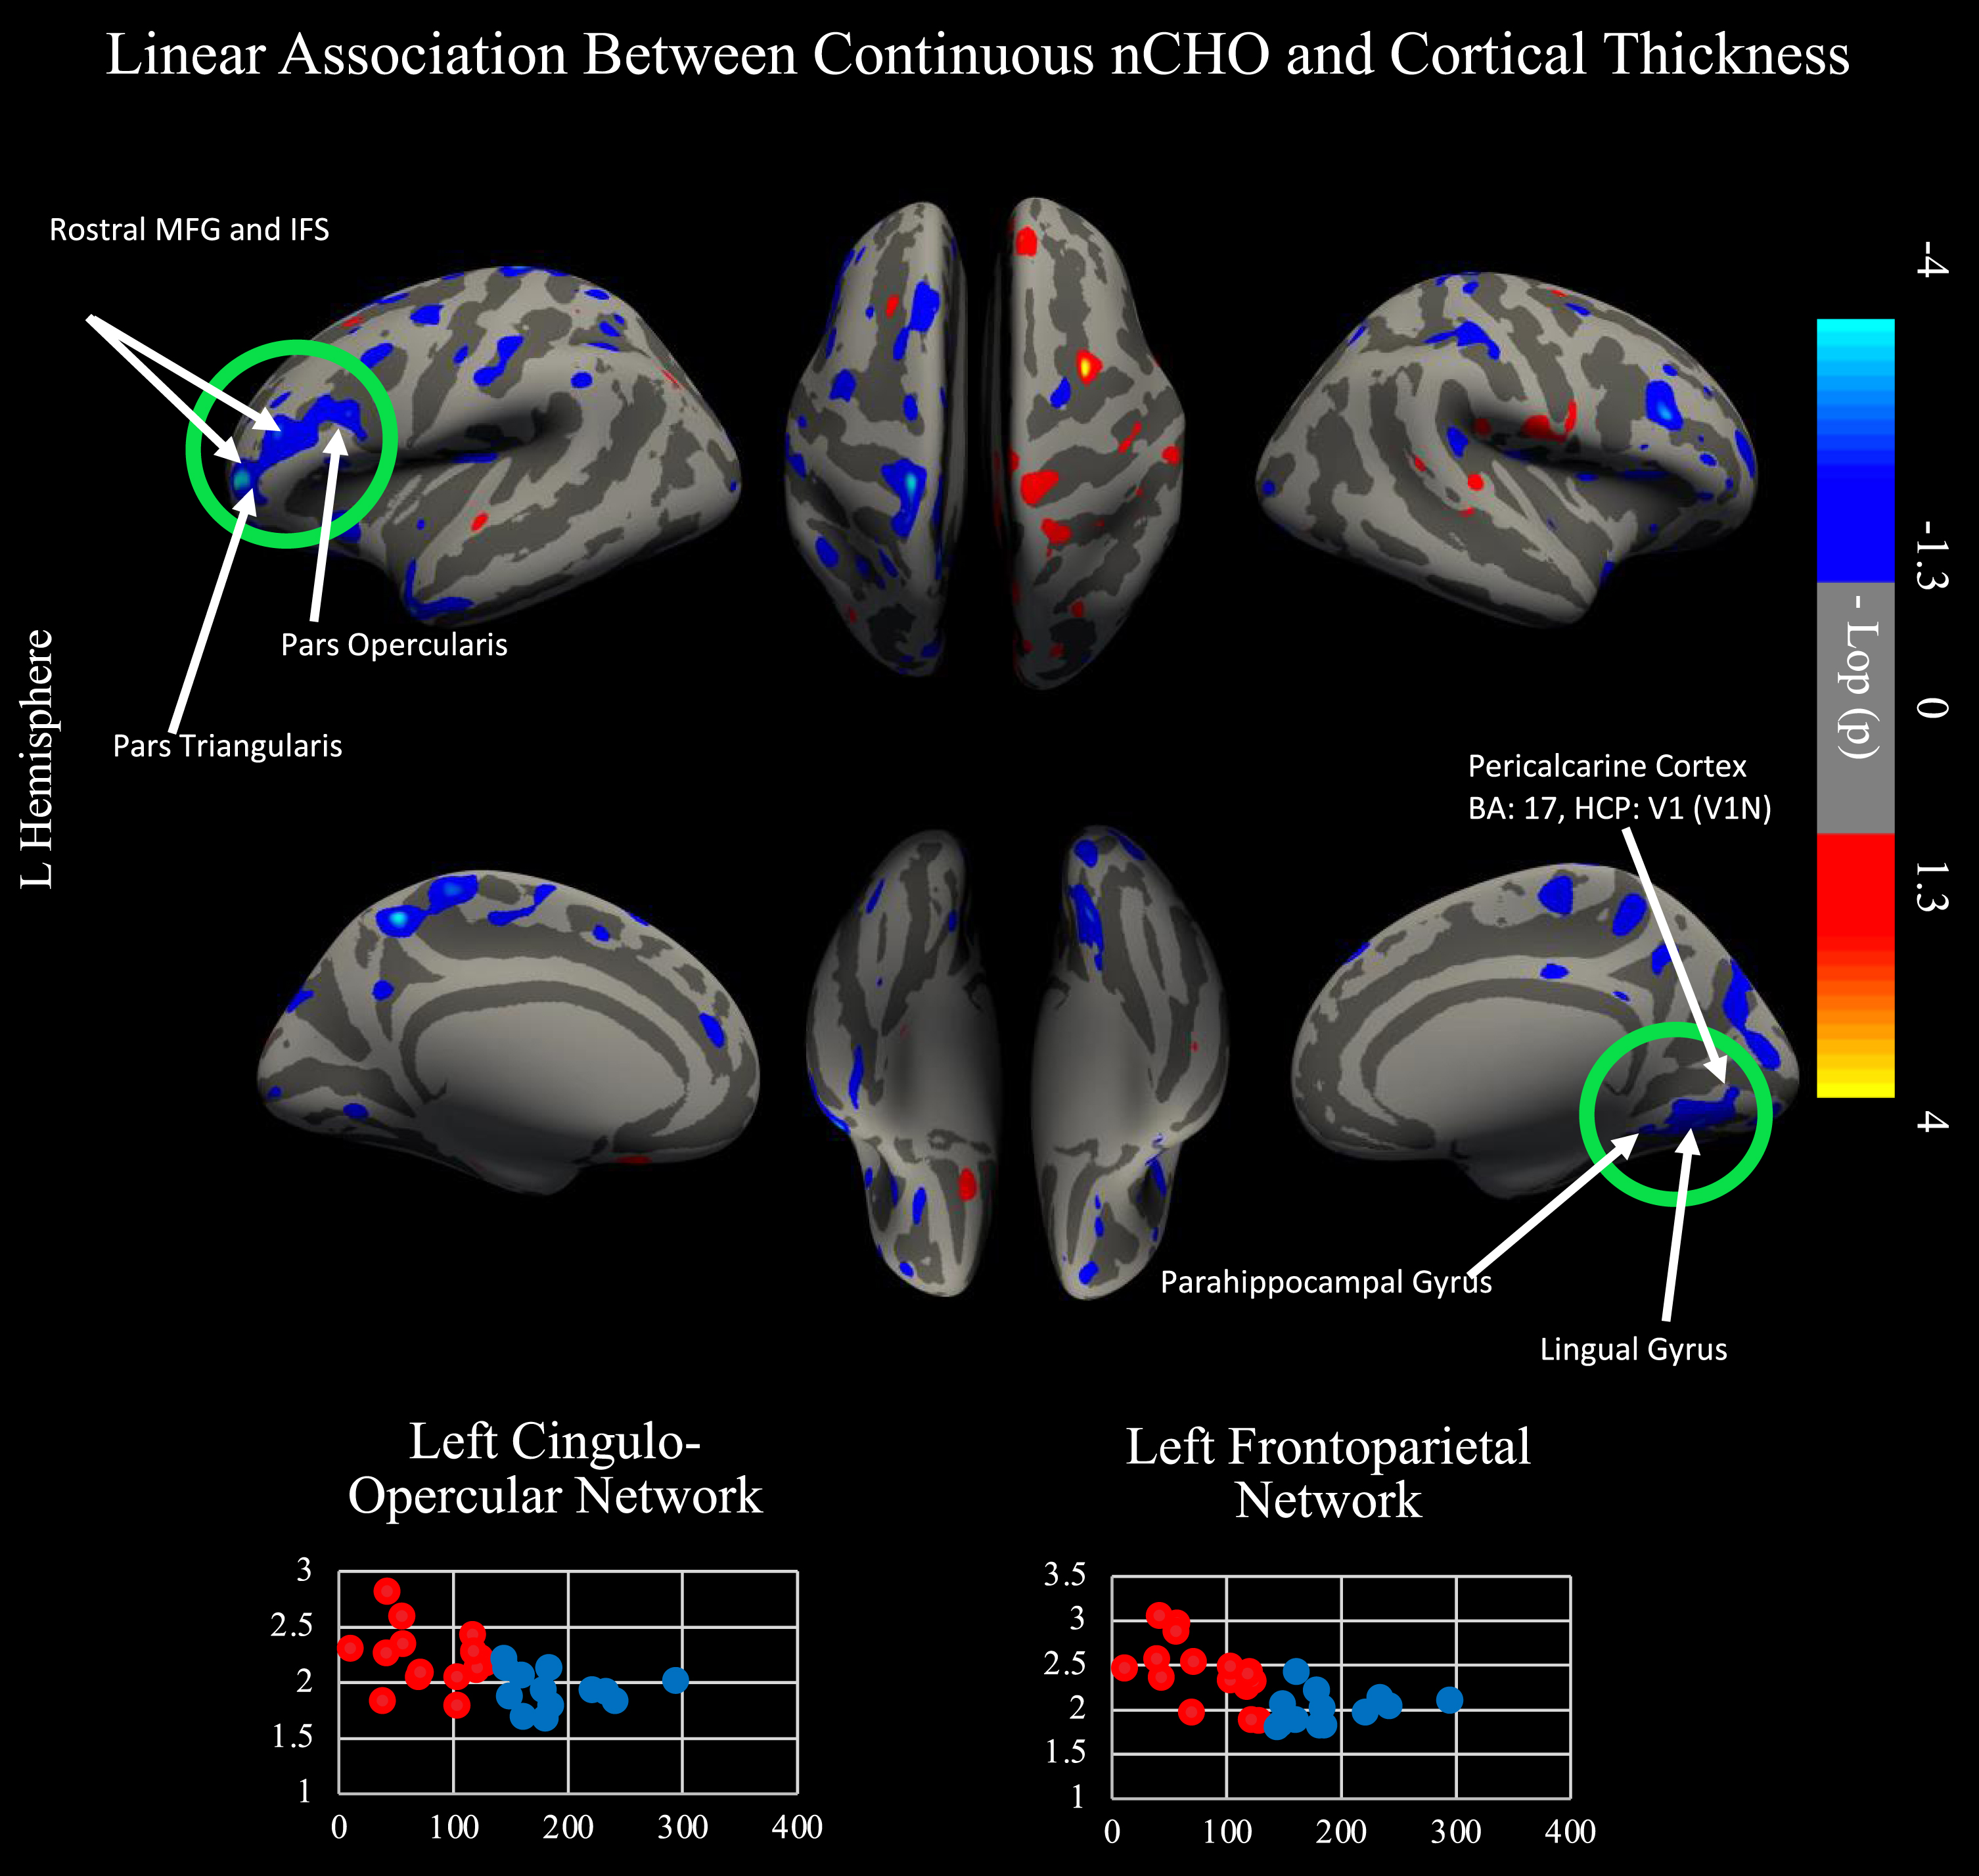
We conducted a secondary cortical surface analysis testing for a linear association between nCHO and cortical thickness, controlling for age (see Fig. 3). Brain regions that were significant after CWP correction included those from the frontoparietal, cingulo-opercular, and visual 1 and 2 networks. Specifically, we found significant clusters that included voxels from areas anterior and posterior 9-46v (a9-46v and p9-46v), anterior and posterior 47r (a47r and p47r), anterior and posterior IFS (IFSa and IFSp), IFJa, 46, and rostral area 6 (6r) in the left hemisphere and from the primary visual cortex (V1), second and third visual areas (V2 and V3), and ventromedial visual areas 1 and 2 (VMV1 and VMV2) in the right hemisphere. Cluster peaks were located in the left a9-46v (r = –0.617; CWP = 0.0014; cluster size = 1357.74 mm2) and right V3: (r = –0.491; CWP = 0.02899; cluster size = 923.04 mm2). Results within these clusters remained significant after controlling for age, sex, education, and BMI (p < 0.001).
Fig. 3
Linear relationship between nCHO and cortical thickness. Top of figure shows results from cortical surface analysis. Linear model includes age as a covariate. Green circles indicate regions that survived correction for multiple comparisons using CWP. White arrows point to highlighted anatomical regions. Cooler colors represent voxels with significantly thinner cortex in individuals eating a higher nCHO diet. Regions significant after CWP correction include anterior and posterior 9-46v (a9-46v and p9-46v), anterior 47r (a47r), posterior 47r (p47r), IFSa, IFSp, IFJa, 46, and rostral area 6 (6r) in the left hemisphere and the second (V2) and third visual areas (V3), ventromedial visual area 1 (VMV1) and 2 (VMV2), primary visual cortex (V1), and the parahippocampal gyrus (PHA1) in the right hemisphere. Bottom of figure displays voxels significant in our primary and secondary analyses: two-tailed t-test comparing lower –higher net carbohydrate (nCHO) diet groups (Fig. 1) and linear regression model of the association between nCHO and cortical thickness independent of age (top of figure).
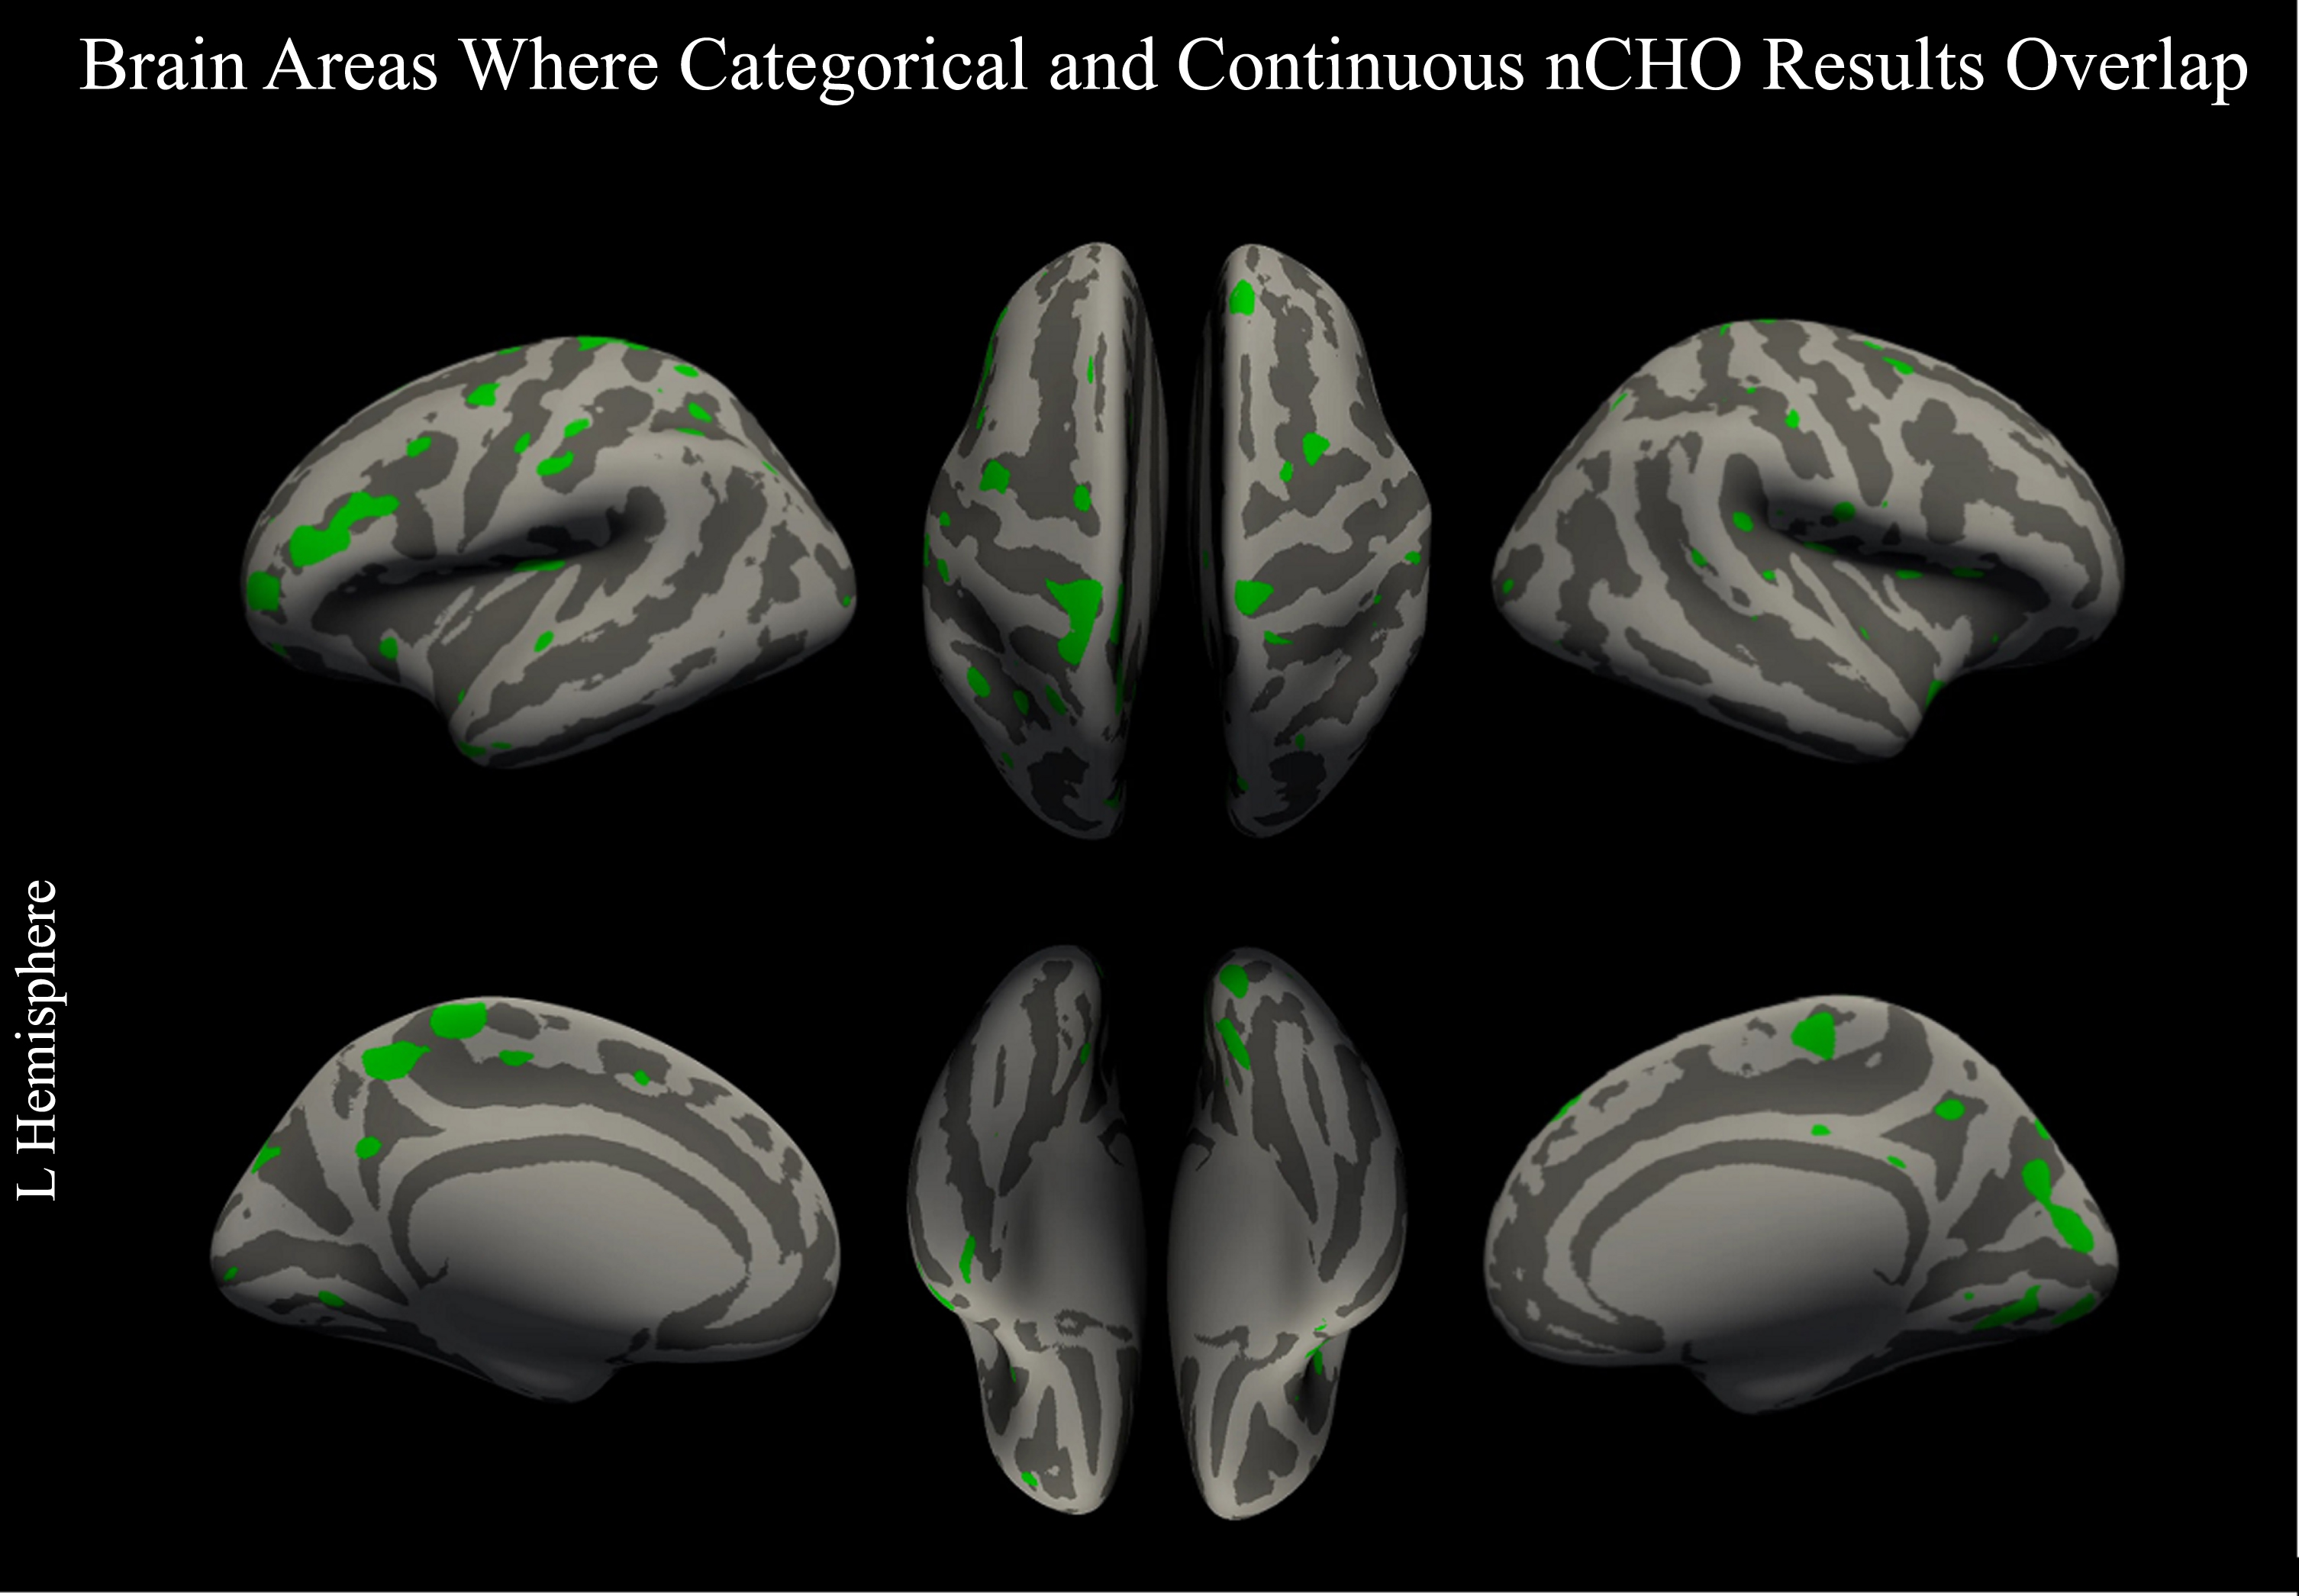
The two analyses (one examining nCHO intake as a categorical variable and the other as a continuous measure) had converging, significant results after CWP correction in V1 and V2 in the right hemisphere, which are part of the primary and secondary visual networks, respectively. Uncorrected, convergent findings included nodes within 12 bilateral, 31 left, and 10 right hemisphere regions defined by the HCP-MMP atlas that were part of the somatomotor, frontoparietal, language, cingulo-opercular, dorsal attention, auditory, default mode, posterior-multimodal, orbito-affective, and visual 1 and 2 networks (see Fig. 4).
Fig. 4
Overlap between categorical and continuous analysis approaches. Figure displays voxels thresholded at a voxel-wise p < 0.05 (uncorrected) in our primary and secondary analyses: two-tailed t-test comparing lower –higher net carbohydrate (nCHO) diet groups (Fig. 1) and linear regression model of the association between nCHO and cortical thickness independent of age (Fig. 3). Overlapping voxels are colored green.
DISCUSSION
In line with our hypothesis, our findings suggest a significant effect of carbohydrate intake on cortical gray matter thickness, with individuals consuming a carbohydrate-restricted diet having thicker cortex than those eating a moderate-to-high carbohydrate diet. Notably, the lower nCHO group exhibited preservation of cortical gray matter in areas within the somatomotor, visual 1 and 2 networks, with peak voxels within the left paracentral lobule (primary motor) and right cuneus (secondary visual cortex). Motor and visual deficits are known risk factors for dementia and often manifest early in the clinical syndrome [70]. However, our finding of preserved cortical gray matter within the somatosensory cortex was unexpected, as this area is generally thought to be spared in AD. Although previous evidence from animal models [71] and imaging experiments have suggested some dysfunction may be present, it has been difficult to detect due to variability in neurocognitive functioning [72]. Our results also revealed significant clusters that extended into the precuneus, which has an important role in many higher-level cognitive functions, such as episodic memory retrieval [73] and is closely adjacent to the HCP-MMP atlas’ anatomically defined default mode network [31, 74]. Notably, effect sizes were reasonably large in the primary motor and secondary visual areas. Widespread cortical thinning is a hallmark of AD, with prior research linking this to disease severity in individuals with MCI and AD [75] and these results suggest that eating a higher carbohydrate diet may contribute in part to these observations. Results without correction for multiple comparisons yielded a consistent pattern of gray matter preservation in the lower nCHO group [75]. To the best of our knowledge, no study has demonstrated a link between restricted-carbohydrate intake, presently defined using a 100–130 g/day nCHO cutoff, and atrophy in patients with AD confirmed by neuropathology.
Our secondary analyses, examining nCHO intake as a continuous variable, also revealed a significant, negative correlation between level of nCHO intake and cortical thickness in regions from the frontoparietal, cingulo-opercular, default mode, and visual 1 and 2 networks, with peak voxels within the right lingual, parahippocampal, and rostral middle frontal gyri. Notably, the most significant finding in this analysis was the middle frontal gyrus, which plays a crucial role in attention, executive functioning, and reasoning [76–78], functions important in compensatory skills in patients with memory impairment. Prior research in older adults who followed a MeDi diet did not detect this association [21]. Our sample was unique in that they consumed fewer carbohydrates and had AD with confirmed amyloid burden. Findings using carbohydrate intake as a continuous measure or categorized with a cutoff of 130 g/day converged in primary and secondary visual networks.
Although we hypothesized that a carbohydrate-restricted diet would impact lateral temporal lobe or dorsal attention network cortical structures, our results did not reveal significant findings in these areas. However, our sample is early in their disease progression and prior research findings suggest that the dorsal attention network and lateral temporal lobe are impacted later [79–81]. It is also possible that larger sample sizes or analyses using a more limited search volume may be needed to identify significant effects in these brain regions.
The primary limitation of this work is the small sample size. For this reason, all findings should be interpreted with caution. Furthermore, it is important to acknowledge that our sample was primarily composed of highly educated individuals with a high prevalence of the APOE ɛ4 allele, which may restrict the generalizability of our findings to other patient populations. Additionally, we used a retrospective, self-reported measure of diet (FFQ), which has inherent limitations in terms of recall accuracy and lacks information regarding the duration of adherence required to achieve the reported results. Moreover, this study is cross-sectional in design, and group assignment was based on participant self-selection into higher and lower nCHO groups. For these reasons, a clinical trial with a prescribed diet in a broader population would provide stronger evidence for the usefulness of restricting carbohydrates to under 130 g/day as a dietary intervention in patients with cognitive impairment. Future directions of this work will be to explore longitudinal trajectories of cortical thinning and assess how they are affected by changes in nCHO intake in the participants of this cohort. We will also assess the effects of APOE genotype on the relationship between nCHO intake and cortical thinning.
In summary, our small sample study provides initial evidence that a carbohydrate- restricted diet with an average daily intake under 130 g nCHO may mitigate the adverse effects of high blood sugar in adults with AD and biomarker evidence of AD neuropathology. While this dietary approach has been shown to benefit patients with insulin resistance and obesity [18], its potential benefits in the context of cognitively impaired patients have not been explored. Our findings could inform future research into dietary interventions for AD, particularly in targeting insulin resistance through a carbohydrate-restricted version of a nutrient-dense diet, such as the brain-healthy MIND diet [22]. However, further research with larger sample sizes and longer follow-up periods is needed to confirm these results and to better understand the mechanisms underlying the observed associations.
ACKNOWLEDGMENTS
We would like to thank the patients and families that participated in this research, without which this research would not be possible. We thank the Pacific Neuroscience Institute and Foundation staff and leadership, including the CEO and Founder, Dan Kelly, MD, Vice President, Melissa Coleman, Director of Research Administration and Operations, Melanie Lampa, Clinical Research Manager, Jessica Serna, Director of Marketing, Zara Jethani, Executive Assistants, Danielle Wozniak and Alyssa Simpers, and Accounting Manager, Bersabel Belay for their support. We would also like to thank Daniel Hirsch for his help implementing the FETA and Freesurfer programs. This study has benefited from the clinical infrastructure of the Pacific Brain Health Center (PBHC), specifically Kyrsten Cardenas, Brenda Smith, and all the PBHC clinical staff members. We are also grateful to the clinical research infrastructure and leadership provided by the Providence Saint John’s Cancer Institute, specifically, Dr. Neil Martin, Dr. Santosh Kesari, Lisa Van Kreunigen, Brian Anderson, and Elena Berezhnikh. We are grateful to all the participants who have been part of the project and to the many members of the study teams at the University of Cambridge who have enabled research on the FETA software for analysis of the EPIC-Norwalk food frequency questionnaire. Thanks to Avi Snyder (Washington University School of Medicine) for porting his Talairach alignment implementation to FreeSurfer. Thanks to Ron Kikinis and Steve Pieper for providing engineering advice and support for testing and open-sourcing of FreeSurfer.
FUNDING
This work is supported by the Pacific Neuroscience Institute Foundation, including the generous support of the Barbara and John McLoughlin Family as well as the Cary and Will Singleton Family; Providence St. Joseph Health, Seattle, WA [Alzheimer’s Translational Pillar (ATP)]; Saint John’s Health Center Foundation; and the National Institutes of Health [U01AG046139, RF1AG057443, U01AG061359, R01AG062514, R21AG061494].The EPIC-Norfolk study (DOI 10.22025/2019.10.105.00004) has received funding from the Medical Research Council (MR/N003284/1 and MC-UU_12015/1) and Cancer Research UK (C864/A14136).
Support for the research behind FreeSurfer was provided in part by the National Center for Research Resources (P41-RR14075, R01 RR16594-01A1 and the NCRR BIRN Morphometric Project BIRN002, U24 RR021382), the National Institute for Neurological Disorders and Stroke (R01 NS052585-01)), the National Institute of Biomedical Imaging and Bioengineering, as well as the Mental Illness and Neuroscience Discovery (MIND) Institute, and is part of the National Alliance for Medical Image Computing (NAMIC), funded by the National Institutes of Health through the NIH Roadmap for Medical Research, Grant U54 EB005149. Support for providing engineering advice and support for testing and open-sourcing of FreeSurfer was provided in part by the NA-MIC (NIH Roadmap for Medical Research Grant U54 EB005149).
CONFLICT OF INTEREST
Cyrus Raji, MD, PhD is an Editorial Board Member of this journal but was not involved in the peer-review process nor had access to any information regarding its peer-review.
DATA AVAILABILITY
The data supporting the findings of this study are available on request from the corresponding author.
REFERENCES
[1] | Gu Y , Nieves JW , Stern Y , Luchsinger JA , Scarmeas N ((2010) ) Food combination and Alzheimer disease risk: A protective diet. Arch Neurol 67: , 699–706. |
[2] | Gu Y , Scarmeas N ((2011) ) Dietary patterns in Alzheimer’s disease and cognitive aging. Curr Alzheimer Res 8: , 510–519. |
[3] | Morris MC , Evans DA , Bienias JL , Tangney CC , Bennett DA , Aggarwal N , Schneider J , Wilson RS ((2003) ) Dietary fats and the risk of incident Alzheimer disease. Arch Neurol 60: , 194–200. |
[4] | Féart C , Samieri C , Rondeau V , Amieva H , Portet F , Dartigues JF , Scarmeas N , Barberger-Gateau P ((2009) ) Adherence to a Mediterranean diet, cognitive decline, and risk of dementia. JAMA 302: , 638–648. |
[5] | Mosconi L , Murray J , Tsui WH , Li Y , Davies M , Williams S , Pirraglia E , Spector N , Osorio RS , Glodzik L , Mchugh P , De Leon MJ , Mosconi L ((2014) ) Mediterranean diet and magnetic resonance imaging-assessed brain atrophy in cognitively normal individuals at risk for Alzheimer’s disease. J Prev Alzheimers Dis 1: , 23. |
[6] | Mosconi L , Walters M , Sterling J , Quinn C , McHugh P , Andrews RE , Matthews DC , Ganzer C , Osorio RS , Isaacson RS , De Leon MJ , Convit A ((2018) ) Lifestyle and vascular risk effects on MRI-based biomarkers of Alzheimer’s disease: A cross-sectional study of middle-aged adults from the broader New York City area. BMJ Open 8: , e019362. |
[7] | Kahn BB ((1998) ) Type 2 diabetes: When insulin secretion fails to compensate for insulin resistance. Cell 92: , 593–596. |
[8] | Seaquist ER , Damberg GS , Tkac I , Gruetter R ((2001) ) The effect of insulin on in vivo cerebral glucose concentrations and rates of glucose transport/metabolism in humans. Diabetes 50: , 2203–2209. |
[9] | Refaie MR , Sayed-Ahmed NA , Bakr AM , Abdel Aziz MY , El Kannishi MH , Abdel-Gawad SS ((2006) ) Aging is an inevitable risk factor for insulin resistance. J Taibah Univ Med Sci 1: , 30–41. |
[10] | National Institutes of Health, U.S. Department of Health and Human Services, NIH National Institute on Aging (2017) What Happens to the Brain in Alzheimer’s Disease?. |
[11] | Michailidis M , Moraitou D , Tata DA , Kalinderi K , Papamitsou T , Papaliagkas V ((2022) ) Alzheimer’s disease as type 3 diabetes: Common pathophysiological mechanisms between Alzheimer’s disease and type 2 diabetes. Int J Mol Sci 23: , 2687. |
[12] | Kandimalla R , Thirumala V , Reddy PH ((2017) ) Is Alzheimer’s disease a type 3 diabetes? A critical appraisal. Biochim Biophys Acta Mol Basis Dis 1863: , 1078–1089. |
[13] | Cukierman T , Gerstein HC , Williamson JD ((2005) ) Cognitive decline and dementia in diabetes–systematic overview of prospective observational studies. Diabetologia 48: , 2460–2469. |
[14] | Rad SK , Arya A , Karimian H , Madhavan P , Rizwan F , Koshy S , Prabhu G ((2018) ) Mechanism involved in insulin resistance via accumulation of β-amyloid and neurofibrillary tangles: Link between type 2 diabetes and Alzheimer’s disease. Drug Des Devel Ther 12: , 3999. |
[15] | Mullins RJ , Diehl TC , Chia CW , Kapogiannis D ((2017) ) Insulin resistance as a link between amyloid-beta and tau pathologies in Alzheimer’s disease. Front Aging Neurosci 9: , 118. |
[16] | Jack CR , Knopman DS , Jagust WJ , Petersen RC , Weiner MW , Aisen PS , Shaw LM , Vemuri P , Wiste HJ , Weigand SD , Lesnick TG , Pankratz VS , Donohue MC , Trojanowski JQ ((2013) ) Update on hypothetical model of Alzheimer’s disease biomarkers. Lancet Neurol 12: , 207. |
[17] | National Center for Health Statistics (2020) Health, United States 2020-2021. |
[18] | Oh R , Gilani B , Uppaluri KR (2023) Lowcarbohydrate diet. In StatPearls. StatPearls Publishing, Treasure Island (FL). |
[19] | Ebbeling CB , Feldman HA , Klein GL , Wong JMW , Bielak L , Steltz SK , Luoto PK , Wolfe RR , Wong WW , Ludwig DS ((2018) ) Effects of a low carbohydrate diet on energy expenditure during weight loss maintenance: Randomized trial. BMJ 363: , k4583. |
[20] | Goldenberg JZ , Johnston BC ((2021) ) Low and very low carbohydrate diets for diabetes remission. BMJ 373: , n262. |
[21] | Staubo SC , Aakre JA , Vemuri P , Syrjanen JA , Mielke MM , Geda YE , Kremers WK , Machulda MM , Knopman DS , Petersen RC , Jack CR , Roberts RO ((2017) ) Mediterranean diet, micro- and macronutrients, and MRI measures of cortical thickness. Alzheimers Dement 13: , 168. |
[22] | Dhana K , James BD , Agarwal P , Aggarwal NT , Cherian LJ , Leurgans SE , Barnes LL , Bennett DA , Schneider JA , Gardener H ((2021) ) MIND diet, common brain pathologies, and cognition in community-dwelling older adults. J Alzheimers Dis 83: , 683. |
[23] | Morris MC , Tangney CC , Wang Y , Sacks FM , Barnes LL , Bennett DA , Aggarwal NT ((2015) ) MIND diet slows cognitive decline with aging. Alzheimers Dement 11: , 1015–1022. |
[24] | Merrill JD , Soliman D , Kumar N , Lim S , Shariff AI , Yancy WS ((2020) ) Low-carbohydrate and very-low-carbohydrate diets in patients with diabetes. Diabetes Spectrum 33: , 133–142. |
[25] | Evert AB , Dennison M , Gardner CD , Garvey WT , Lau KHK , MacLeod J , Mitri J , Pereira RF , Rawlings K , Robinson S , Saslow L , Uelmen S , Urbanski PB , Yancy WS Jr ((2019) ) Nutrition therapy for adults with diabetes or prediabetes: A consensus report. Diabetes Care 42: , 731–754. |
[26] | Frisoni GB , Fox NC , Jack CR , Scheltens P , Thompson PM ((2010) ) The clinical use of structural MRI in Alzheimer disease. Nat Rev Neurol 6: , 67–77. |
[27] | Josephs KA , Whitwell JL , Duffy JR , Vanvoorst WA , Strand EA , Hu WT , Boeve BF , Graff-Radford NR , Parisi JE , Knopman DS , Dickson DW , Jack CR , Petersen RC ((2008) ) Progressive aphasia secondary to Alzheimer disease vs FTLD pathology. Neurology 70: , 25–34. |
[28] | Thompson PM , Hayashi KM , De Zubicaray G , Janke AL , Rose SE , Semple J , Herman D , Hong MS , Dittmer SS , Doddrell DM , Toga AW ((2003) ) Dynamics of gray matter loss in Alzheimer’s disease. J Neurosci 23: , 994. |
[29] | Holroyd S , Shepherd ML , Downs JH ((2000) ) Occipital atrophy is associated with visual hallucinations in Alzheimer’s disease. J Neuropsychiatry Clin Neurosci 12: , 25–28. |
[30] | Fischer CE , Ting WKC , Millikin CP , Ismail Z , Schweizer TA , Alzheimer Disease Neuroimaging Initiative ((2016) ) Gray matter atrophy in patients with mild cognitive impairment/Alzheimer’s disease over the course of developing delusions. Int J Geriatr Psychiatry 31: , 76. |
[31] | Buckner RL , Andrews-Hanna JR , Schacter DL ((2008) ) The brain’s default network: Anatomy, function, and relevance to disease. Ann N Y Acad Sci 1124: , 1–38. |
[32] | Qian S , Zhang Z , Li B , Sun G ((2015) ) Functional-structural degeneration in dorsal and ventral attention systems for Alzheimer’s disease, amnestic mild cognitive impairment. Brain Imaging Behav 9: , 790–800. |
[33] | Brier MR , Thomas JB , Ances BM ((2014) ) Network dysfunction in Alzheimer’s disease: Refining the disconnection hypothesis. Brain Connect 4: , 299. |
[34] | McEwen SC , Merrill DA , Bramen J , Porter V , Panos S , Kaiser S , Hodes J , Ganapathi A , Bell L , Bookheimer T , Glatt R , Rapozo M , Ross MK , Price ND , Kelly D , Funk CC , Hood L , Roach JC ((2021) ) A systems-biology clinical trial of a personalized multimodal lifestyle intervention for early Alzheimer’s disease. Alzheimers Dement (N Y) 7: , e12191. |
[35] | Reisberg B ((1988) ) Functional assessment staging (FAST). Psychopharmacol Bull 24: , 653–659. |
[36] | Sjostrom M , Ainsworth B , Bauman A , Bull F , Hamilton-Craig C , Sallis J (2005) Guidelines for data processing analysis of the International Physical Activity Questionnaire (IPAQ) –Short and long forms. |
[37] | Jack CR , Bennett DA , Blennow K , Carrillo MC , Dunn B , Haeberlein SB , Holtzman DM , Jagust W , Jessen F , Karlawish J , Liu E , Molinuevo JL , Montine T , Phelps C , Rankin KP , Rowe CC , Scheltens P , Siemers E , Snyder HM , Sperling R , Elliott C , Masliah E , Ryan L , Silverberg N ((2018) ) NIA-AA Research Framework: Toward a biological definition of Alzheimer’s disease. Alzheimers Dement 14: , 535–562. |
[38] | Johnson KA , Minoshima S , Bohnen NI , Donohoe KJ , Foster NL , Herscovitch P , Karlawish JH , Rowe CC , Carrillo MC , Hartley DM , Hedrick S , Pappas V , Thies WH , Alzheimer’s Association, Society of Nuclear Medicine, Amyloid Imaging Taskforce ((2013) ) Appropriate use criteria for amyloid PET: A report of the Amyloid Imaging Task Force, the Society of Nuclear Medicine and Molecular Imaging, and the Alzheimer’s Association. Alzheimers Dement 9: , e-1–16. |
[39] | Schindler SE , Gray JD , Gordon BA , Xiong C , Batrla-Utermann R , Quan M , Wahl S , Benzinger TLS , Holtzman DM , Morris JC , Fagan AM ((2018) ) Cerebrospinal fluid biomarkers measured by Elecsys assays compared to amyloid imaging. Alzheimers Dement 14: , 1460–1469. |
[40] | Burke G , Lima J , Wong ND , Narula J ((2016) ) The multiethnic study of atherosclerosis. Glob Heart 11: , 267–268. |
[41] | Bild DE , Bluemke DA , Burke GL , Detrano R , Diez Roux AV , Folsom AR , Greenland P , Jacobs DR , Kronmal R , Liu K , Nelson JC , O’Leary D , Saad MF , Shea S , Szklo M , Tracy RP ((2002) ) Multi-ethnic study of atherosclerosis: Objectives and design. Am J Epidemiol 156: , 871–881. |
[42] | McClelland RL , Jorgensen NW , Budoff M , Blaha MJ , Post WS , Kronmal RA , Bild DE , Shea S , Liu K , Watson KE , Folsom AR , Khera A , Ayers C , Mahabadi AA , Lehmann N , Jöckel KH , Moebus S , Carr JJ , Erbel R , Burke GL ((2015) ) 10-year coronary heart disease risk prediction using coronary artery calcium and traditional risk factors: Derivation in the MESA (Multi-Ethnic Study of Atherosclerosis) with validation in the HNR (Heinz Nixdorf Recall) Study and the DHS (Dallas Heart Study). J Am Coll Cardiol 66: , 1643–1653. |
[43] | Katz A , Nambi SS , Mather K , Baron AD , Follmann DA , Sullivan G , Quon MJ ((2000) ) Quantitative insulin sensitivity check index: A simple, accurate method for assessing insulin sensitivity in humans. J Clin Endocrinol Metab 85: , 2402–2410. |
[44] | Kroke A , Klipstein-Grobusch K , Voss S , Möseneder J , Thielecke F , Noack R , Boeing H ((1999) ) Validation of a self-administered food-frequency questionnaire administered in the European Prospective Investigation into Cancer and Nutrition (EPIC) Study: Comparison of energy, protein, and macronutrient intakes estimated with the doubly labeled water, urinary nitrogen, and repeated 24-h dietary recall methods. Am J Clin Nutr 70: , 439–447. |
[45] | Bingham SA , Welch AA , McTaggart A , Mulligan AA , Runswick SA , Luben R , Oakes S , Khaw KT , Wareham N , Day NE ((2001) ) Nutritional methods in the European Prospective Investigation of Cancer in Norfolk. Public Health Nutr 4: , 847–858. |
[46] | Bingham SA , Gill C , Welch A , Day K , Cassidy A , Khaw KT , Sneyd MJ , Key TJA , Roe L , Day NE ((1994) ) Comparison of dietary assessment methods in nutritional epidemiology: Weighed records v. 24h recalls, food-frequency questionnaires and estimated-diet records. Br J Nutr 72: , 619–643. |
[47] | Mulligan AA , Luben RN , Bhaniani A , Parry-Smith DJ , O’Connor L , Khawaja AP , Forouhi NG , Khaw KT ((2014) ) A new tool for converting food frequency questionnaire data into nutrient and food group values: FETA research methods and availability. BMJ Open 4: , e004503. |
[48] | Hagströmer M , Oja P , Sjöström M ((2006) ) The International Physical Activity Questionnaire (IPAQ): A study of concurrent and construct validity. Public Health Nutr 9: , 755–762. |
[49] | Nasreddine ZS , Phillips NA , Bédirian V , Charbonneau S , Whitehead V , Collin I , Cummings JL , Chertkow H ((2005) ) The Montreal Cognitive Assessment, MoCA: A brief screening tool for mild cognitive impairment. J Am Geriatr Soc 53: , 695–699. |
[50] | Fischl B , Dale AM ((2000) ) Measuring the thickness of the human cerebral cortex from magnetic resonance images. Proc Natl Acad Sci U S A 97: , 11050–11055. |
[51] | Dale AM , Sereno MI ((1993) ) Improved localizadon of cortical activity by combining EEG and MEG with MRI cortical surface reconstruction: A linear approach. J Cogn Neurosci 5: , 162–176. |
[52] | Fischl B , Sereno MI , Dale A ((1999) ) Cortical surface-based analysis: II: Inflation, flattening, and a surface-based coordinate system. Neuroimage 9: , 195–207. |
[53] | Dale A , Fischl B , Sereno MI ((1999) ) Cortical surface-based analysis: I. Segmentation and surface reconstruction. Neuroimage 9: , 179–194. |
[54] | Fischl B , Liu A , Dale AM ((2001) ) Automated manifold surgery: Constructing geometrically accurate and topologically correct models of the human cerebral cortex. IEEE Medical Imaging 20: , 70–80. |
[55] | Fischl B , Salat DH , Busa E , Albert M , Dieterich M , Haselgrove C , van der Kouwe A , Killiany R , Kennedy D , Klaveness S , Montillo A , Makris N , Rosen B , Dale AM ((2002) ) Whole brain segmentation: Automated labeling of neuroanatomical structures in the human brain. Neuron 33: , 341–355. |
[56] | Fischl B , Salat DH , van der Kouwe AJW , Makris N , Ségonne F , Quinn BT , Dale AM ((2004) ) Sequence-independent segmentation of magnetic resonance images. Neuroimage 23: , S69–S84. |
[57] | Fischl B , Sereno MI , Tootell RB , Dale AM ((1999) ) High-resolution intersubject averaging and a coordinate system for the cortical surface. Hum Brain Mapp 8: , 272–284. |
[58] | Han X , Jovicich J , Salat D , van der Kouwe A , Quinn B , Czanner S , Busa E , Pacheco J , Albert M , Killiany R , Maguire P , Rosas D , Makris N , Dale A , Dickerson B , Fischl B ((2006) ) Reliability of MRI-derived measurements of human cerebral cortical thickness: The effects of field strength, scanner upgrade and manufacturer. Neuroimage 32: , 180–194. |
[59] | Jovicich J , Czanner S , Greve D , Haley E , van der Kouwe A , Gollub R , Kennedy D , Schmitt F , Brown G , MacFall J , Fischl B , Dale A ((2006) ) Reliability in multi-site structural MRI studies: Effects of gradient non-linearity correction on phantom and human data. Neuroimage 30: , 436–443. |
[60] | Segonne F , Dale AM , Busa E , Glessner M , Salat D , Hahn HK , Fischl B ((2004) ) A hybrid approach to the skull stripping problem in MRI. Neuroimage 22: , 1060–1075. |
[61] | Reuter M , Rosas HD , Fischl B ((2010) ) Highly accurate inverse consistent registration: A robust approach. Neuroimage 53: , 1181–1196. |
[62] | Reuter M , Schmansky NJ , Rosas HD , Fischl B ((2012) ) Within-subject template estimation for unbiased longitudinal image analysis. Neuroimage 61: , 1402–1418. |
[63] | Sled JG , Zijdenbos AP , Evans AC ((1998) ) A nonparametric method for automatic correction of intensity nonuniformity in MRI data. IEEE Trans Med Imaging 17: , 87–97. |
[64] | Segonne F , Pacheco J , Fischl B ((2007) ) Geometrically accurate topology-correction of cortical surfaces using nonseparating loops. IEEE Trans Med Imaging 26: , 518–529. |
[65] | Rosas HD , Liu AK , Hersch S , Glessner M , Ferrante RJ , Salat DH , van der Kouwe A , Jenkins BG , Dale AM , Fischl B ((2002) ) Regional and progressive thinning of the cortical ribbon in Huntington’s disease. Neurology 58: , 695–701. |
[66] | Kuperberg GR , Broome M , McGuire PK , David AS , Eddy M , Ozawa F , Goff D , West WC , Williams SCR , van der Kouwe A , Salat D , Dale A , Fischl B ((2003) ) Regionally localized thinning of the cerebral cortex in schizophrenia. Arch Gen Psychiatry 60: , 878–888. |
[67] | Salat DH , Buckner RL , Snyder AZ , Greve DN , Desikan RS , Busa E , Morris JC , Dale AM , Fischl B ((2004) ) Thinning of the cerebral cortex in aging. Cereb Cortex 14: , 721–730. |
[68] | Harris PA , Taylor R , Thielke R , Payne J , Gonzalez N , Conde JG ((2009) ) Research electronic data capture (REDCap)—A metadata-driven methodology and workflow process for providing translational research informatics support. J Biomed Inform 42: , 377–381. |
[69] | SYSTAT 13.2 Powerful Statistical Analysis and Graphics Software. |
[70] | Albers MW , Gilmore GC , Kaye J , Murphy C , Wingfield A , Bennett DA , Boxer AL , Buchman AS , Cruickshanks KJ , Devanand DP , Duffy CJ , Gall CM , Gates GA , Granholm AC , Hensch T , Holtzer R , Hyman BT , Lin FR , McKee AC , Morris JC , Petersen RC , Silbert LC , Struble RG , Trojanowski JQ , Verghese J , Wilson DA , Xu S , Zhang LI ((2015) ) At the interface of sensory and motor dysfunctions and Alzheimer’s disease. Alzheimers Dement 11: , 70. |
[71] | Maatuf Y , Stern EA , Slovin H ((2016) ) Abnormal population responses in the somatosensory cortex of Alzheimer’s disease model mice. Sci Rep 6: , 24560. |
[72] | Wiesman AI , Mundorf VM , Casagrande CC , Wolfson SL , Johnson CM , May PE , Murman DL , Wilson TW ((2021) ) Somatosensory dysfunction is masked by variable cognitive deficits across patients on the Alzheimer’s disease spectrum. EBioMedicine 73: , 103638. |
[73] | Cavanna AE , Trimble MR ((2006) ) The precuneus: A review of its functional anatomy and behavioural correlates. Brain 129: , 564–583. |
[74] | Sandhu Z , Tanglay O , Young IM , Briggs RG , Bai MY , Larsen ML , Conner AK , Dhanaraj V , Lin YH , Hormovas J , Fonseka RD , Glenn CA , Sughrue ME ((2021) ) Parcellation-based anatomic modeling of the default mode network. Brain Behav 11: , e01976. |
[75] | Dickerson BC , Bakkour A , Salat DH , Feczko E , Pacheco J , Greve DN , Grodstein F , Wright CI , Blacker D , Rosas HD , Sperling RA , Atri A , Growdon JH , Hyman BT , Morris JC , Fischl B , Buckner RL ((2009) ) The cortical signature of Alzheimer’s disease: Regionally specific cortical thinning relates to symptom severity in very mild to mild AD dementia and is detectable in asymptomatic amyloid-positive individuals. Cereb Cortex 19: , 497–510. |
[76] | Fuster JM ((2001) ) The prefrontal cortex—an update: Time is of the essence. Neuron 30: , 319–333. |
[77] | Badre D , Nee DE ((2018) ) Frontal cortex and the hierarchical control of behavior. Trends Cogn Sci 22: , 170. |
[78] | Andersson M , Ystad M , Lundervold A , Lundervold AJ ((2009) ) Correlations between measures of executive attention and cortical thickness of left posterior middle frontal gyrus –a dichotic listening study. Behav Brain Funct 5: , 41. |
[79] | Li R , Wu X , Fleisher AS , Reiman EM , Chen K , Yao L ((2012) ) Attention-related networks in Alzheimer’s disease: A resting functional MRI study. Hum Brain Mapp 33: , 1076–1088. |
[80] | Zhang Z , Zheng H , Liang K , Wang H , Kong S , Hu J , Wu F , Sun G ((2015) ) Functional degeneration in dorsal and ventral attention systems in amnestic mild cognitive impairment and Alzheimer’s disease: An fMRI study. Neurosci Lett 585: , 160–165. |
[81] | Planche V , Manjon JV , Mansencal B , Lanuza E , Tourdias T , Catheline G , Coupe P ((2022) ) Structural progression of Alzheimer’s disease over decades: The MRI staging scheme. Brain Commun 4: , fcac109. |


