
Diet’s Role in Modifying Risk of Alzheimer’s Disease: History and Present Understanding
Abstract
Diet is an important nonpharmacological risk-modifying factor for Alzheimer’s disease (AD). The approaches used here to assess diet’s role in the risk of AD include multi-country ecological studies, prospective and cross-sectional observational studies, and laboratory studies. Ecological studies have identified fat, meat, and obesity from high-energy diets as important risk factors for AD and reported that AD rates peak about 15–20 years after national dietary changes. Observational studies have compared the Western dietary pattern with those of the Dietary Approaches to Stop Hypertension (DASH), Mediterranean (MedDi), and Mediterranean–DASH Intervention for Neurodegenerative Delay (MIND) diets. Those studies identified AD risk factors including higher consumption of saturated and total fats, meat, and ultraprocessed foods and a lower risk of AD with higher consumption of fruits, legumes, nuts, omega-3 fatty acids, vegetables, and whole grains. Diet-induced factors associated with a significant risk of AD include inflammation, insulin resistance, oxidative stress, elevated homocysteine, dietary advanced glycation end products, and trimethylamine N-oxide. The molecular mechanisms by which dietary bioactive components and specific foods affect risk of AD are discussed. Given most countries’ entrenched food supply systems, the upward trends of AD rates would be hard to reverse. However, for people willing and able, a low–animal product diet with plenty of anti-inflammatory, low–glycemic load foods may be helpful.
INTRODUCTION
Alzheimer’s disease (AD) is the most common cause of dementia characterized by accumulation of tau protein tangles and amyloid-β (Aβ) plaque, progressive loss of neurons, and deterioration of normal brain function.
According to a 2023 review, the global number of people with AD, prodromal AD, and preclinical AD were estimated at 32 million, 69 million, and 315 million, respectively. Together they constituted 416 million across the AD continuum, or 22% of all people aged 50 or older [1]. Thus, AD is a serious health risk. A 2022 article identified 75 genetic risk foci, of which 42 were newly discovered [2]. However, people with genetic risk factors such as apolipoprotein E ɛ4 can modify their risk of developing AD by taking measures to reduce dietary risk factors.
A 2015 meta-analysis of modifiable risk factors for AD identified a healthful dietary pattern as the most important factor with a risk ratio (RR)/odds ratio (OR) of 0.45 (95% confidence interval [CI], 0.23–0.61) with grade II-A level of evidence [3]. The RR/OR values for specific dietary consumption were high folate intake, 0.49 (95% CI, 0.28–0.74), grade I; fish consumption, 0.68 (95% CI, 0.46–0.95), grade II-A; high vitamin E intake, 0.74 (95% CI, 0.63–0.83), grade I; and high vitamin C intake, 0.75 (95% CI, 0.57–0.02), grade I.
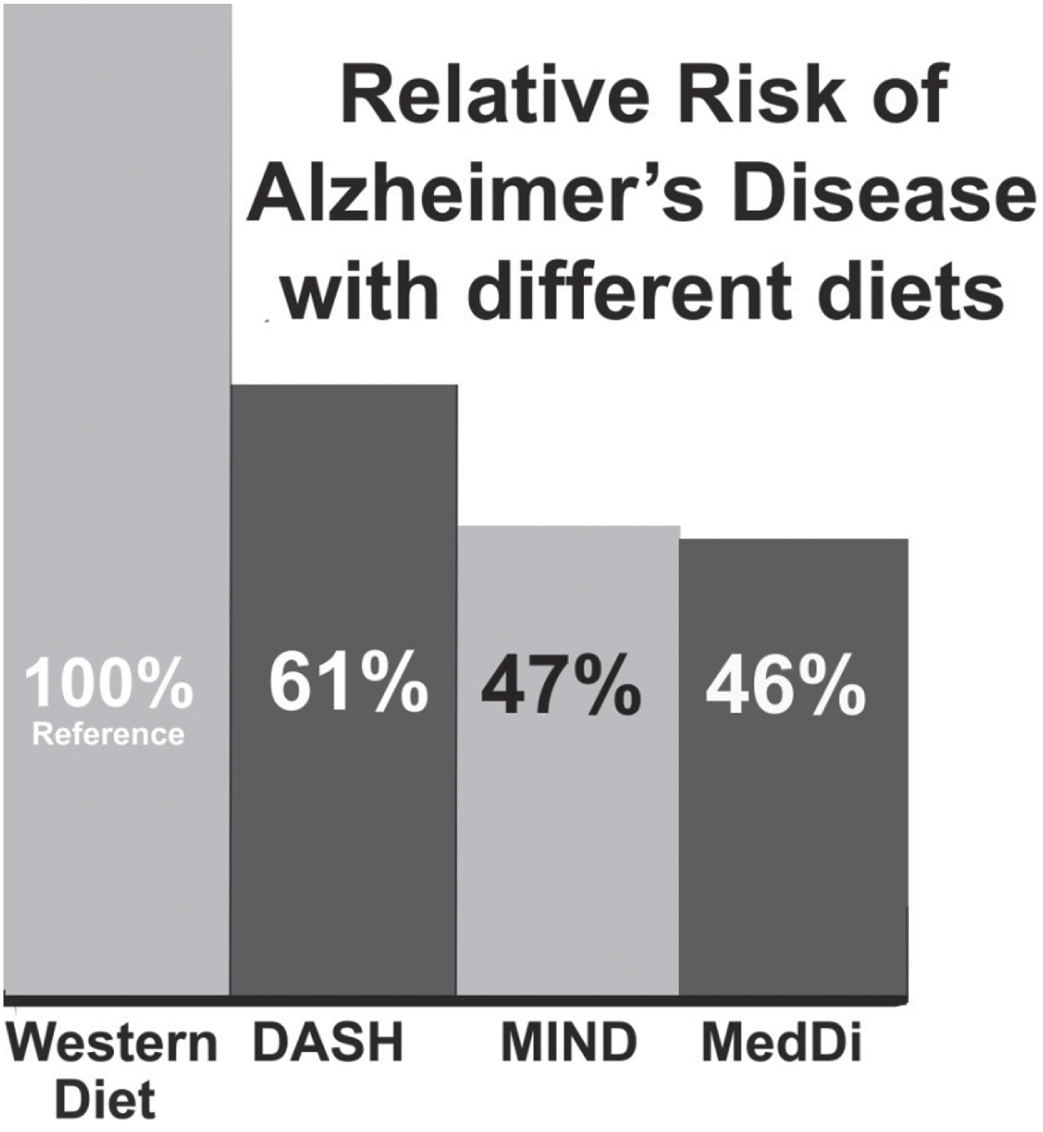
A 2020 review outlined the modifiable risk factors for AD throughout the lifespan [4]. In early life, more schooling reduces risk. Starting after age 45 years, many other modifiable risk factors become important. The review identified 10 factors with level A evidence (lack of cognitive activity, hyperhomocysteinemia, increased body mass index (BMI) in late life, depression, stress, diabetes, head trauma, hypertension in midlife, orthostatic hypotension, and education) and 9 factors with level B evidence (obesity in midlife, weight loss in late life, lack of physical exercise, smoking, poor sleep, cardiovascular disease ( CVD), frailty, atrial fibrillation, and lack of vitamin C). Levels of evidence were summarized to represent the quality of scientific evidence on the basis of directness of outcome for AD, credibility of meta-analyses, and consistency of evidence from clinical trials and/or observational studies: level A > level B > level C (based on the evidence level). Several of those factors, identified in boldface, are related to diet, yet diet was not included as a factor. However, a 2021 review did include diet as a modifiable risk factor [5]. That review cited the article by Morris and colleagues in 2015 [6] reporting that the Mediterranean diet (MedDi; hazard ratio [HR] = 0.46; 95% CI, 0.26–0.79), the Dietary Approaches to Stop Hypertension (DASH) diet (Hazard ratio [HR] = 0.61 [95%, CI 0.38–0.97]), and the Mediterranean–DASH Intervention for Neurodegenerative Delay (MIND) diet (HR = 0.47 [95% CI, 0.26–0.76]) were all inversely associated with the risk of AD. The protective effects of those dietary patterns on cognition might be attributed to antioxidant, anti-inflammatory, protective plant polyphenols, antidiabetic effects, and a higher ratio of mono- or polyunsaturated fats to saturated fatty acids (SFAs) [7].
Several ways exist to determine how diet affects risk of AD and to assess their relative influence. Ecological studies compare AD prevalence rates by country or time with respect to dietary supply values of macronutrients several years before the prevalence [8]. Cross-sectional studies compare prevalence of AD with respect to dietary factors [9]. Prospective studies enroll participants, obtain data for many factors, and use a food-frequency questionnaire to determine dietary factors, and then monitor participants for several years and compare dietary patterns for incidence of AD [10]. Such prospective studies also can be used to examine the role of specific foods and food groups in risk of AD [11]. Clinical trials also can be conducted in which diets are modified and changes in bioparameters associated with AD are sought [12]. In addition, once the general risk factors for AD are known, such as inflammation and insulin resistance (IR), the foods that affect those factors can be identified. Each approach can contribute to the understanding of how diet and dietary factors affect risk of AD.
The outline of this review is as follows:
1. A brief history of ecological and observational studies regarding dietary patterns and risk of AD is presented.
2. The mechanisms by which inflammation, IR, and oxidative stress affect risk of AD are discussed, followed by the roles of obesity, advanced glycation end products (AGEs), homocysteine, lipopolysaccharides, arachidonic acid (AA), and trimethylamine N-oxide (TMAO).
3. The effects of various food factors that reduce risk of AD are discussed along with the mechanisms by which they affect risk of AD.
ECOLOGICAL STUDIES
The first ecological study regarding diet and AD was published in 1997 [8]. It was inspired by a report that Japanese-American men living in Hawaii had a 5.4% prevalence of AD, which was about 2.5 times higher than that of Japanese living in Japan [13]. That study identified total fat and total energy as risk factors for AD, fish as a minor risk-reduction factor, and a rice-based diet as having little risk.
Also in 1997, data were analyzed from 5386 nondemented participants aged≥55 years from the population-based prospective Rotterdam Study and who were followed up for a mean time of 2.1 years. After adjustment for age, sex, education, and energy intake, high intakes of the following nutrients were associated with an increased risk of dementia: total fat (relative risk [RR] = 2.4 [95% CI, 1.1–5.2]), SFAs (RR = 1.9 [95% CI, 0.9–4.0]), and cholesterol (RR = 1.7 [95% CI, 0.9–3.2]) [14]. Dementia with a vascular component was most strongly related to total fat and saturated fat. Fish consumption, an important source of n-3 polyunsaturated fatty acids (FAs), was inversely related to incident dementia (RR = 0.4 [95% CI, 0.2–0.91]), and in particular to AD (RR = 0.3 [95% CI, 0.1–0.9]).
Two more multi-country ecological studies have been published. One was an eight-country study involving AD prevalence in developing countries and AD rates from 1985 to 2010 in Japan [15]. In that study, total energy and animal fat correlated highly with AD prevalence data, with a lag of 15–20 years. Increases in obesity rates were proposed to explain the finding. For Japan, AD rates increased greatly from 1% in 1985 to 7% in 2008 [16]. The increases correlated highly with increases in alcohol consumption, animal products, meat and rice supply, and lung cancer rates, with the strongest correlation for a lag of 15–25 years. In another multi-country study, AD prevalence data published after 1995 reconfirmed that meat was the most important dietary link to AD [17]. Ten countries were included: Brazil, Chile, Cuba, Egypt, India, Inner Mongolia, Korea, Nigeria, Sri Lanka, and the US. Dietary supply data were obtained from the United Nations Food and Agriculture Organization (FAO) [18] for 5, 10, and 15 years before the AD prevalence data. The highest correlations were found for a 5-year lag between dietary factor data and AD prevalence data. The highest correlation was found for meat, r = 0.95, p < 0.001; animal product energy less milk, r = 0.94, p < 0.001; milk, r = 0.69, p = 0.03; total energy, 0.39, p = 0.26; and cereals, r = –0.56, p = 0.10. Nutrition transitions from the traditional diets to the Western dietary (WD) pattern were proposed to explain the findings.
While preparing the manuscript, we reanalyzed the data for the 1997 ecological study [8] by using data ∼15 years before the AD prevalence data obtained from the Food and Agriculture Organization of the UN (FAO). Table 1 shows the data and Table 2, the results. Dietary supply values include food wasted or otherwise not consumed. It is generally assumed that humans consume about 70% of the dietary supply.
Table 1
Dietary supply values for 13 countries from the FAO [18]
| Factor | China, 1970 | Nigeria, 1980 | Japan, 1970 | Greece, 1961 | Italy, 1961 | Singapore, 1970 | Sweden, 1970 | Finland, 1965 | Italy, 1970 | Spain, 1970 | UK, 1970 | Canada, 1975 | USA, 1980 |
| AD prevalence (%) | 1.2 | 1.4 | 1.9 | 1.9 | 3.2 | 3.6 | 3.9 | 4.1 | 4.4 | 5.1 | 5.5 | ||
| Energy (kcal/cap/d) | 1993 | 2032 | 2687 | 2839 | 2985 | 2693 | 2866 | 3110 | 3377 | 2833 | 3249 | 2947 | 3239 |
| Animal product energy (kcal/cap/d) | 113 | 107 | 427 | 461 | 483 | 538 | 976 | 1309 | 633 | 663 | 1294 | 1040 | 1052 |
| Animal fat (g/cap/d) | 1.2 | 1 | 6 | 5 | 8 | 7 | 27 | 45 | 10 | 5 | 43 | 32 | 23 |
| Total fat (g/cap/d) | 22 | 52 | 54 | 92 | 83 | 55 | 116 | 121 | 109 | 101 | 141 | 117 | 131 |
| Cereals (kcal/cap/d) | 1344 | 766 | 1314 | 1288 | 1284 | 1250 | 611 | 865 | 1305 | 806 | 699 | 627 | 653 |
| Starchy roots (kcal/cap/d) | 297 | 395 | 85 | 59 | 94 | 44 | 159 | 207 | 82 | 202 | 188 | 111 | 89 |
| Sweeteners (kg/cap/y) | 2.5 | 11 | 32 | 15 | 25 | 52 | 46 | 44 | 30 | 29 | 49 | 46 | 59 |
| Vegetables (kg/cap/y) | 56 | 42 | 119 | 95 | 123 | 92 | 38 | 17 | 156 | 130 | 76 | 89 | 100 |
| Pulses (kcal/cap/y) | 6 | 61 | 31 | 69 | 50 | 27 | 9 | 11 | 48 | 71 | 33 | 17 | 28 |
| Fruit (kg/cap/y) | 8 | 71 | 62 | 157 | 108 | 66 | 83 | 44 | 136 | 90 | 62 | 105 | 111 |
| Alcohol (kg/cap/y) | 3 | 83 | 45 | 39 | 117 | 19 | 72 | 32 | 127 | 91 | 108 | 109 | 115 |
| Meat (kg/cap/y) | 9 | 11 | 19 | 26 | 36 | 43 | 55 | 43 | 56 | 47 | 77 | 100 | 112 |
| Eggs (kg/cap/y) | 2 | 2 | 16 | 6 | 9 | 7 | 12 | 9 | 11 | 13 | 15 | 13 | 16 |
| Milk (kg/cap/y) | 2 | 14 | 45 | 130 | 152 | 53 | 289 | 344 | 186 | 124 | 228 | 227 | 236 |
| Fish (kg/cap/y) | 5 | 15 | 65 | 20 | 12 | 48 | 29 | 18 | 13 | 30 | 21 | 18 | 16 |
| Vegetable oils (kg/cap/y) | 5 | 11 | 17 | 17 | 14 | 8 | 14 | 4 | 19 | 16 | 9 | 12 | 10 |
AD, Alzheimer’s disease; FAO, Food and Agriculture Organization of the United Nations; kg/cap/y, kilograms/capita/year.
Table 2
Linear correlation coefficients for dietary factors ∼15 years before prevalence of AD in 11 countries [8]
| Factor | r, adjusted r2, p | r, adjusted r2, p |
| (present analysis) | (1997 analysis [8]) | |
| Meat, omit Singapore | 0.95, 0.90, < 0.001 | |
| Meat | 0.93, 0.85, < 0.001 | |
| Fat | 0.91, 0.80, < 0.001 | 0.97, 0.88, < 0.001 |
| Fish, omit China, Nigeria | –0.83, 0.65, 0.005 | –0.70, 0.42, 0.04 |
| Energy | 0.82, 0.64, 0.002 | 0.94, 0.88, < 0.001 |
| Animal energy | 0.80, 0.66, 0.003 | |
| Milk | 0.75, 0.51, 0.008 | |
| Sweets | 0.67, 0.39, 0.02 | |
| Animal fat | 0.63, 0.33, 0.04 | |
| Cereals | –0.62, 0.31, 0.04 | –0.83, 0.69, 0.002 |
AD, Alzheimer’s disease.
As Table 2 shows, meat supply became the food group with the highest correlation with AD, followed by fat, fish (inverse), and total energy. The results are considered more accurate than those reported in 1997 because two related ecological studies reported that dietary factors 15–20 years before AD prevalence had the highest correlation with AD prevalence [15, 17] and that obesity 20 years before AD incidence has higher correlations than do data from 5, 10, and 15 years before [19].
Figure 1 shows the correlation between the prevalence of AD for 11 countries in the 1997 study [8] with respect to dietary meat supply obtained from the FAO [18] ∼15 years before the AD prevalence data. One factor, meat consumption, seems to explain the prevalence well, indicating that it may be the single most important dietary risk factor for AD.
Fig. 1
Correlation between prevalence of AD for 11 countries in the 1997 study [8] with respect to dietary meat supply obtained from the Food and Agriculture Organization. AD, Alzheimer’s disease.
![Correlation between prevalence of AD for 11 countries in the 1997 study [8] with respect to dietary meat supply obtained from the Food and Agriculture Organization. AD, Alzheimer’s disease.](https://content.iospress.com:443/media/jad/2023/96-4/jad-96-4-jad230418/jad-96-jad230418-g001.jpg)
A 2015 study examined AGEs’ possible role in risk of AD by using dietary component data in ecological and observational studies [20]. AGE values for various foods were obtained from the data in Uribarri and colleagues [21]. One finding was that dietary AGEs in the food supply for Japan increased from 3700 kU/day in 1961 to 11,800 in 2005, as shown in that study’s Table 5A and Fig. 2. AGEs from meat rose from 800 to 5100 kU/day. Table 5B in that article gives AGE values for the countries included in the 1997 ecological study [8] for the period ∼20 years before the AD prevalence data. The values ranged from 2100 kU/day for China in 1967 to 15,000 kU/day for the US in 1972.
Fig. 2
Comparisons of risk of three dietary patterns with respect to the WD based on data from the seminal studies.
Dietary patterns and risk of AD
The study of AD incidence with respect to dietary patterns offers useful information regarding how various food groups generally affect risk of AD. Those studies form the basis for further research. The WD pattern [22, 23], MedDi [24–26], DASH diet [27, 28], and MIND diet [6] have received the most attention. The WD is characterized as having high consumption of fat, ultraprocessed foods (UPFs), and meat [22]. A recent definition of the WD is a dietary pattern in which 70% of calories originate from animal foods, oils and fats, and sweeteners [23]. The WD thus includes low intakes of fruits, vegetables, whole grains, legumes, and nuts— all important sources of vitamins, minerals, fiber, and antioxidants, which are essential for optimal health. The MedDi has large amounts of olive oil, fish, breads and cereals, fruits, vegetables, legumes, nuts, beans, and seeds; moderate amounts of dairy products, poultry, and alcohol; and small amounts of red and processed meat and sweets [9]. The DASH diet has large amounts of grains, fruits, vegetables, legumes, nuts, and low-fat dairy products; moderate amounts of poultry and fish; and small amounts of red meat, sweets, saturated and total fat, cholesterol, and salt [9]. The MIND diet, based on the MedDi and DASH diets, has large amounts of olive oil, fish, whole grains, berries, green leafy vegetables, other vegetables, nuts, and beans; moderate amounts of poultry and alcohol/wine; and small amounts of red and processed meats, pastries and sweets, cheese, butter/margarine, and deep-fried foods [9].
Table 3 compares the quantities of the components of three dietary patterns. No comparable data are given for the WD since no tabulation similar to those for the other dietary patterns could be found. Instead, the data for Canada in 1975 and the US in 1980 given in Table 1 can be used. What is apparent is that in these two countries, animal fat, animal product energy, and meat supply is much higher than in two Mediterranean countries, Greece and Italy, while cereals and pulses supply is much lower. In scoring the DASH dietary pattern, 0 points is given for the first number, 0.5 points for values between the two numbers, and 1 point for the higher number. The higher the score, the closer the personal diet is to the ideal DASH dietary pattern [28]. The average MIND diet score for the AD sample was 7.4 and ranged from 2.5 to 12.5 in the MIND diet–Alzheimer’s disease risk study [6].
Table 3
Comparison of major dietary patterns that affect risk of AD
| Major components | MedDi [25] (s/d unless otherwise noted) | Max Score | DASH [28] (s/d unless otherwise noted) | Max Score | MIND [6] (s/d unless otherwise noted) | Max Score |
| Reduces risk of AD | ||||||
| Fish | >0.9 | 5 | included with meat | ≥0.14 | 1 | |
| Fruits | 0 to > 3 | 5 | <2 –≥4 | 1 | berries≥0.3 | 1 |
| Legumes | >0.9 | 5 | <2 –>4 | 1 | >0.4 | 1 |
| Nuts | included with legumes | included with legumes | ≥0.7 | 1 | ||
| Olive oil | 0 to 1 | 5 | primary | 1 | ||
| Vegetables | 0 to > 4.7 | 5 | <2 –≥4 | 1 | green leafy > 0.9 other > 1 | 1 |
| Whole grains | 0 to > 4.6 | 5 | <5 –≥7 | 1 | ≥3 | 1 |
| Moderate effect on risk of AD | ||||||
| Alcohol | 0 or > 100 g to < 40 g | 5 | 1 | 1 | ||
| Dairy | <1 –≥2 | 1 | ||||
| Potatoes | 0 to > 3 | 5 | ||||
| Poultry | >1.4 to≤0.4 | 5 | included with meat | ≥0.3 | 1 | |
| Increases risk of AD | ||||||
| Butter/margarine | <1 T | 1 | ||||
| Cheese, full fat diary | >4.3 to > 1.4 | 5 | <0.14 | 1 | ||
| Fast/fried food | <0.14 | 1 | ||||
| Meat, red and processed | <1.4 to 0 | 5 | <2 –≥4 | 1 | <0.6 | 1 |
| Saturated fatty acids | ≤6 –≥9 % kcal | 1 | ||||
| Sodium | ≤2400 to > 3000 mg/d | 1 | ||||
| Total fats | ≤27 –≥30% kcal | 1 | ||||
| UPF | ≤5 –≥8 s/wk | 1 | <5 | 1 | ||
| Total points possible | 55 | 10 | 15 |
S/d, servings/day; T, tablespoon.
Seminal observational studies show representative reductions in the risk of developing AD. In an observational study conducted in New York involving 2,259 community-based nondemented people with a mean age of 77±7 years followed up for 4±3 years, 262 AD cases occurred [29]. Those at the highest tertile of the MedDi compared with the lowest tertile had a HR for AD of 0.60 (95% CI, 0.42–0.87; ptrend = 0.007). However, a recent review noted that several other observational studies found much lower reductions in dementia when following the MedDi [30]. A 20-year study in Spain found only a 20% reduced incidence of dementia [31]. Studies in France [32] and Spain [33] found no statistically-significant association between adherence to the MedDi and AD and dementia. In a study conducted in Chicago involving 923 nondemented participants of mean age 81 years followed up for an average of 4.5 years, of whom 144 developed AD, the HR for highest versus lowest tertile of the MIND diet was 0.47 (95% CI, 0.26–0.76) [6]. For the DASH diet, the similar analysis found the HR to be 0.61 (95% CI, 0.38–0.97), and for the MedDi, HR was 0.46 (95% CI, 0.26–0.79) [6]. Given the few participants, high ages, and short follow-up times, those results may not apply to the general population, especially in non-Western developed countries. Nonetheless, the findings do yield evidence that dietary factors, even late in life, can affect risk of developing AD.
Figure 2 shows the relative risk of AD for three dietary patterns compared to the WD based on results from the seminal studies for each dietary pattern [6, 29].
Those observational studies show that dietary patterns with less red and processed meat than in the WD reduce the risk of AD. However, the reduction in risk is less than was found in ecological studies. The likely main reason is that in the highest quantiles of dietary adherence to those healthier eating patterns, the amount of red and processed meat is larger than that in countries with very low meat intake, as shown in Table 1.
Cross-sectional and longitudinal studies related to the MedDi, DASH, and MIND diets, generally with respect to the WD, have been used to assess the relative influence of food groups on risk of cognitive decline, dementia, and AD [9]. Many more such studies have explored the effect on cognitive decline rather than risk of dementia or AD but report similar results.
In general, studies of dietary patterns and risk of AD can show the general association of large food factor categories on risk but cannot apportion the risk according to food factor category. Also, the fact that the DASH, MedDi, and MIND dietary patterns permit some meat consumption means that meat’s role cannot be carefully assessed.
Another way to assess diet’s role in risk of AD is through observational studies involving many participants followed up for many years along with analysis of how food factors affect chronic disease risk. A good example of that approach is a Harvard study involving three cohorts with 205,852 health care professionals monitored for up to 32 years with dietary assessments using food-frequency questionnaires every 4 years [34]. Although results for AD and dementia were not presented, results for diabetes incidence can serve as a proxy for AD. Inflammatory diets and diets that lead to IR increase risk of both type 2 diabetes mellitus (T2DM) [35] and AD [36–38].
Studies also have evaluated the risk of developing AD for existing diabetics. A meta-analysis of results from cohort studies reported in 2017 that the RR of AD with respect to diabetes was 1.36 (95% CI, 1.18–1.53) for 12 Western country studies, 1.62 (95% CI, 1.49–1.75) for 5 Eastern country studies, and 1.53 (95% CI, 1.42–1.75) for the 17 countries combined [39]. The difference between Eastern and Western country results was attributed to differences in APOE alleles. A 2022 meta-analysis using different studies reported a risk ratio for developing AD after T2DM on the basis of 5 studies of 1.29 (95% CI, 1.06–1.57), an odds ratio based on 4 studies of 1.12 (95% CI, 1.01–1.25) and a HR based on 9 studies of 1.15 (95% CI, 1.06–1.25) [40].
The Harvard study included Table 3, giving Spearman correlation coefficients between energy-adjusted dietary patterns and food groups in the pooled data of three cohorts (N = 205,852) [34]. Food groups with a combined correlation coefficient > 0.20 in the two patterns— reversed empirical dietary index for hyperinsulinemia (rEDIH) and reversed empirical dietary inflammatory pattern (rEDIP)— were, in descending order of correlation coefficient, coffee, wine, leafy green vegetables, fruit, whole grains, dark yellow vegetables, salad dressing, beer, and garlic. Those food groups inversely correlated with the two dietary patterns with a combined correlation coefficient≤–0.12 in the two patterns, ordered from worse, were red meat, processed meat, French fries, high-energy drinks, low-energy drinks, eggs, and poultry. Because the analysis was based on health care professionals with mean BMI ranging from 23.7±3.5 to 26.5±5.2 kg/m2 of body surface area, the results may not apply to other groups and countries.
The data in Table 3 in the Harvard study [34] also included results for the MedDi adjusted for the US (AMED) and the DASH diet. The scores for those two dietary patterns can be added and the same done for the rEDIH and rEDIP dietary patterns. The two pairs of dietary patterns generally show agreement in results. The correlation coefficient for all 25 food groups is 0.69; with coffee omitted, r = 0.81; with coffee and food groups between 11 and –13 omitted, r = 0.90; with high-fat dairy also omitted, r = 0.96. In a comparison of the two pairs, the AMED + DASH dietary pattern pair considered butter, condiments, desserts, and pizza to increase risk, whereas the rEDIH + rEDIP dietary pattern pair considered them neutral. By contrast, the AMED + DASH dietary pattern pair considered fish, legumes, other vegetables, poultry, and tomatoes to reduce risk, whereas the rEDIH + rEDIP dietary pattern pair considered them neutral or slightly negative for poultry.
MAJOR RISK FACTORS FOR AD
Inflammation
The main causes of systemic inflammation are diet as well as overweight, obesity [41], and inflammaging [42]. The mechanisms by which obesity and inflammaging produce systemic inflammation are discussed later.
Systemic inflammation’s effect on AD pathology was reviewed by Xie and colleagues [38]. Many mouse model studies investigated the effect of injecting immune-stimulating molecules to evoke systemic inflammation by production of peripheral proinflammatory cytokines (presented in Table 1 of that review). As a result of systemic inflammation, levels of Aβ and phosphorylated tau were increased in wild-type rodents [43].
Inflammation’s role in the brain in AD pathology was reviewed by Sinyor, Mineo, and Ochner [44]. Proinflammatory cytokines such as tumor necrosis factor-α (TNF-α), interleukin-1β (IL−1β), and IL-6 are upregulated in brains of people with AD, which leads to an accumulation of Aβ plaque aggregates and tau hyperphosphorylation, resulting in neuronal loss. Both microglia and astrocytes mediate the effects of inflammation in the brain. Microglia are brain cells that regulate brain development, maintenance of neuronal networks, and injury repair [45]. The cells function as scavengers, removing damaged material. Aβ in the brain— in fibrils, aggregates, and senile plaque— results in neuroinflammation by triggering microglia. Microglia phagocytize the Aβ, but the clearance process of Aβ decreases over time because amyloid is hard to proteolyze. As a result, microglia become compromised and less efficient in breaking down amyloid plaques. The microglia release more proinflammatory cytokines, which may further exacerbate AD progression. A review by Wang and colleagues outlines the role of proinflammatory cytokines released from microglia in AD [46]. Figure 2 in that review outlines how failure of Aβ clearance leads to activated microglia in advanced AD. Eventually a vicious cycle ensues between microglia activation, neuroinflammation, and Aβ accumulation. One process involved is that inflammation increases Aβ generation through β-secretase, one of the two main enzymes responsible for generating Aβ [47].
Astrocytes regulate synaptic transmission and plasticity, protect neurons against toxic compounds, and support metabolism to ensure their optimal functioning [48]. Normal astrocytes protect the brain by degrading plaque and inhibiting activated microglia. However, when activated by accumulated Aβ or endotoxins, astrocytes can express proinflammatory cytokines.
Recent reviews further describe inflammation’s role in AD [36, 49]. Dietary fats affect systemic inflammation, as discussed in a review by Ricker and Haas [50]. Omega-6 FAs tend to be more proinflammatory, whereas omega-3 FAs are generally anti-inflammatory. Linoleic acid, an omega-6 FA found in corn, sunflower, and safflower oil, is a precursor to proinflammatory eicosanoids produced from AA, such as leukotrienes. AA also is obtained from animal products such as meat, dairy, and eggs. Omega-3 FAs compete for the delta-6 desaturase enzyme, thereby reducing the biosynthesis of AA [51]. Omega-3 FAs can reduce inflammation by producing anti-inflammatory eicosanoids such as leukotrienes, as well as resolvins, protectins, and maresins [52]. Those eicosanoids were discussed in a communication regarding their possible use in preventing and treating nonalcoholic fatty liver disease (NAFLD) [53]. Studies suggest that increasing levels of those eicosanoids in obesity could reduce adipose inflammation (decrease in macrophage accumulation and change to less inflammatory macrophages).
Inflammaging is systemic chronic low-grade age-related inflammation [42]. The recent viewpoint is that, during ageing, chronic, sterile, low-grade inflammation— called inflammaging— develops, which contributes to the pathogenesis of age-related diseases. From an evolutionary perspective, a variety of stimuli sustain inflammaging, including pathogens (non-self), endogenous cell debris and misplaced molecules (self) and nutrients and gut microbiota (quasi-self). A limited number of receptors, whose degeneracy allows them to recognize many signals and to activate the innate immune responses, sense these stimuli. In this situation, metaflammation (the metabolic inflammation accompanying metabolic diseases) is thought to be the form of chronic inflammation that is driven by nutrient excess or overnutrition [54]. A 2016 review outlined the evidence that n-3 polyunsaturated fatty acids and vitamin D reduce inflammation in older individuals [55]. A 2022 review outlined how inflammaging leads to neurodegeneration, obesity, and AD [56]. An observational study followed 1,059 elderly individuals (mean age, 73 years) in Greece for a mean of 3.0 (SD 0.9) years to examine the role of dietary inflammatory index (DII) on dementia incidence [57]. The 2014 Shivappa DII was used in the analysis [58]. Participants were divided into three tertiles, the low DII tertile had a DII score between –5.8 and –1.8; the middle DII tertile had a DII score between –1.8 and 0.2; the high DII tertile had a DII score between 0.2 and 6.0. Each additional DII unit was associated with a 21% increase in risk of dementia (HR = 1.21 [95% CI, 1.03–1.42]).
Insulin and insulin resistance
Insulin has important roles in the healthy brain. Emerging evidence from human and animal studies indicates that insulin influences cerebral bioenergetics, enhances synaptic viability and dendritic spine formation, and increases turnover of neurotransmitters, such as dopamine. Insulin also has a role in proteostasis, influencing clearance of AD’s hallmarks: the Aβ peptide and neurofibrillary tangles. Insulin also modulates vascular function through effects on vasoreactivity, lipid metabolism, and inflammation [59]. Through those multiple pathways, insulin dysregulation could contribute to neurodegeneration. However, hyperinsulinemia, such as caused by glucocorticoid treatment, reduces the activity of insulin-degrading enzyme [60], which is proteolytic against Aβ-forming peptides [61].
IR is a pathological condition in which cells fail to respond normally to insulin. Glucose thus remains in the bloodstream and brain cells may not get enough glucose for energy metabolism. The condition may be defined as a state in which normal or elevated insulin levels result in a poor biological response. IR often is accompanied by hyperinsulinemia, in which pancreatic β-cells release excessive amounts of insulin to maintain normal glycemia [62].
A review by Milstein and Ferris outlines insulin’s role in the brain and how IR increases risk of AD [63]. An important role of insulin is to initiate a series of phosphorylation events. Through the kinases phosphatidylinositol 3-kinase/protein kinase B (PKB/AKT), insulin activates the glucose transporter to move glucose out of the bloodstream and into brain cells. Brain cells also have a non-insulin-dependent transporter for glucose that is activated by nerve activity. IR influences a large variety of cellular functions, including synaptic plasticity, cholesterol synthesis, neuronal survival, and neurotransmitter biosynthesis and release [64, 65], as shown in Fig. 1 in that review. Insulin also can modulate cell growth and proliferation. Insulin also plays a critical role in intracellularly modulating metabolic activity by regulating metabolic signaling pathways. Several pathways have been identified regarding how insulin regulates metabolism in different brain cell types as well as promoting cell proliferation and survival and modulating mitochondrial homeostasis and function. Insulin in the brain also regulates feeding behaviors. Insulin signaling in astrocytes is important for integrity of the blood–brain barrier (BBB) and neuronal metabolic and redox homeostasis for whole-body glucose homeostasis [66] and modulating behavior [67].
Brain IR can be defined as the failure of brain cells to respond to insulin [68]. Mechanistically, the lack of response could be due to downregulation of insulin receptors, an inability of insulin receptors to bind insulin, or faulty activation of the insulin signaling cascade [69]. The mechanisms leading to IR are outlined in Milstein and Ferris [63]. One primary mechanism proposed for the development of IR is the accumulation of saturated free FAs and ceramides in the brain as a result of a high–saturated fat diet. Elevated free SFAs in the brain induce the synthesis of ceramides in the brain [70]. They induce inflammation by triggering Toll-like receptors, which activate the NF-κB pathway, which coordinates the transcription of proinflammatory cytokines, which impair insulin signaling and activate c-Jun N-terminal kinase, which disrupts brain insulin signaling [71]. Another mechanism of how dietary SFAs, especially palmitic acid, induce IR is through reducing the number of active insulin receptors to about half their normal value, thus contributing to hyperinsulinemia [72]. Figure 3 in Milstein and Ferris [63] shows how the mechanisms of brain IR develop from a high–saturated fat diet, by impairing insulin receptor signaling.
Fig. 3
Obesity rate for adults in the US versus year and AD mortality rates (number/100,000/year times 0.676) versus year minus 20 years. AD, Alzheimer’s disease.
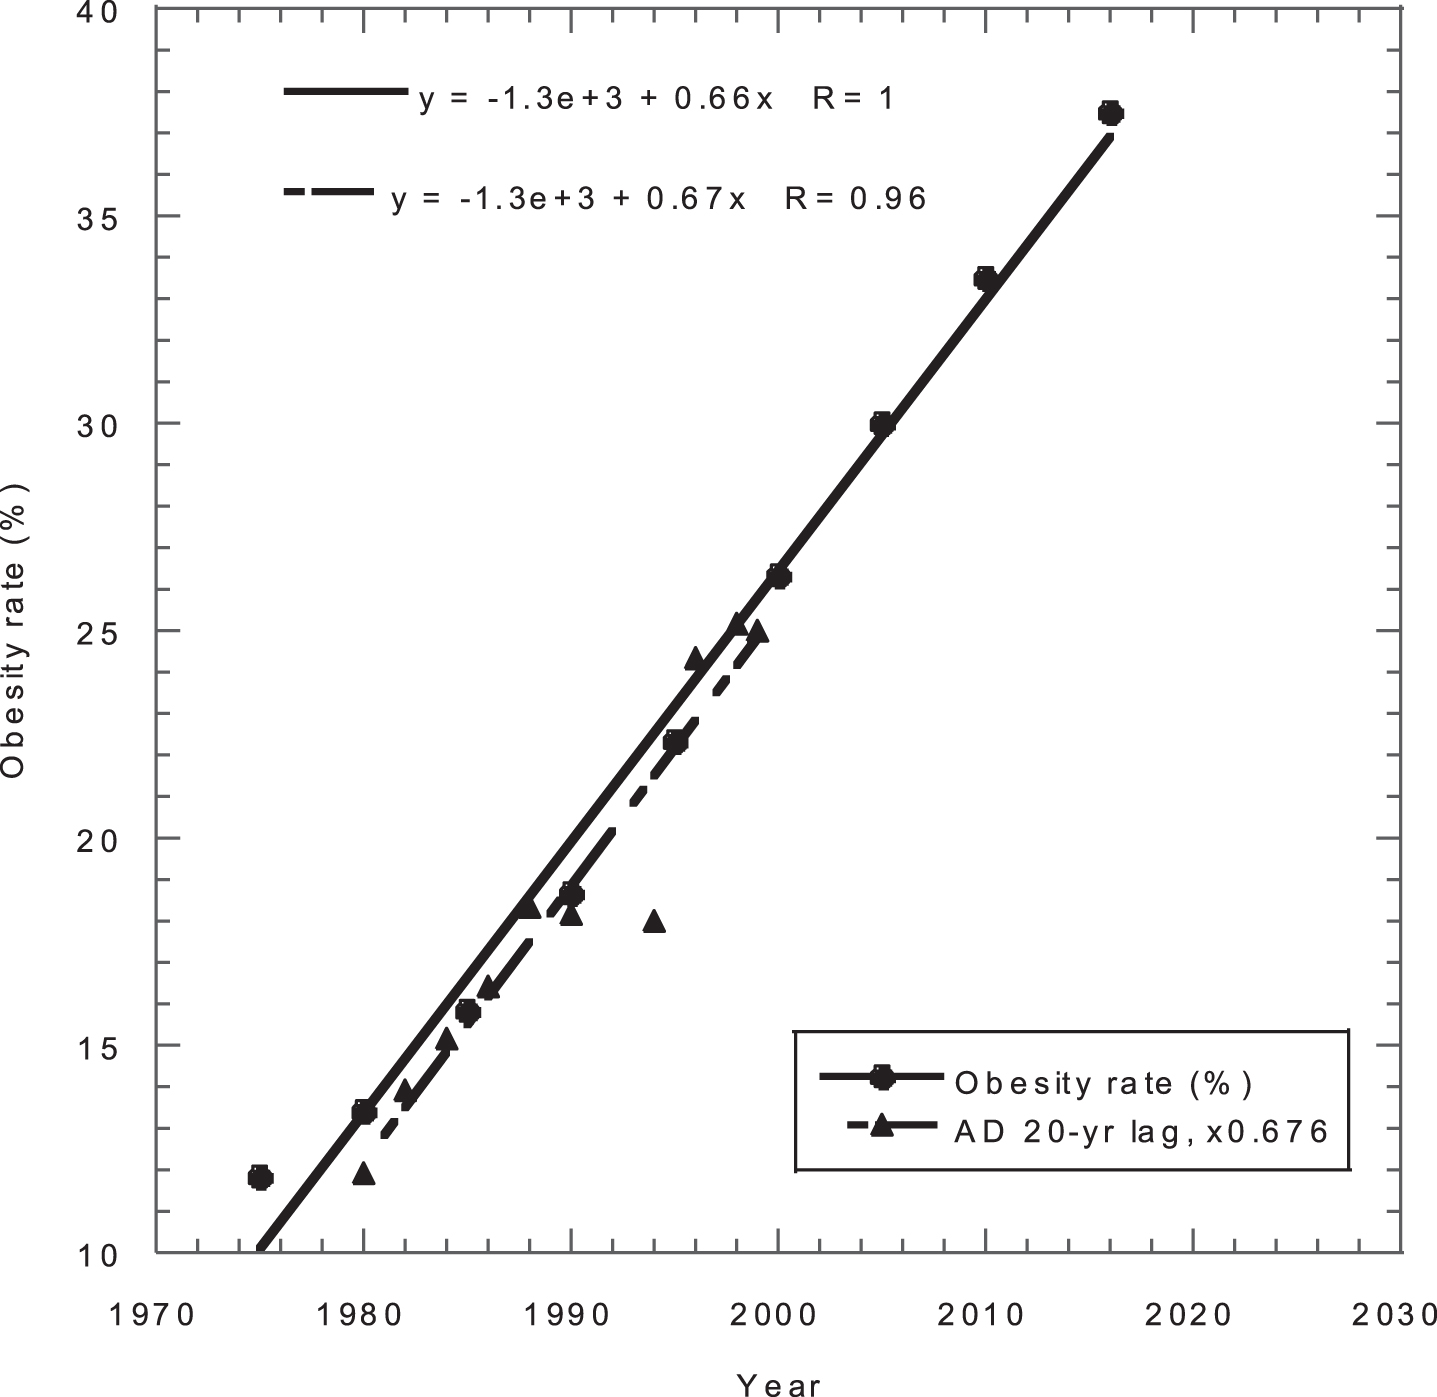
Figure 1 in Maciejczyk, Zebrowska, and Chabowski [71] outlines how reactive oxygen species (ROS) also lead to IR. The brain is particularly sensitive to free radical attack owing to the organ’s increased oxygen consumption, limited antioxidative mechanisms, and high levels of polyunsaturated FAs. In IR brain, overproduction of ROS can lead to oxidative damage associated with ATP depletion, activation of proinflammatory cytokines, accumulation of protein aggregates, and neuronal apoptosis. The antioxidant response to ROS is discussed in Milstein and Ferris [63]. The endogenous antioxidant response is controlled largely by the transcription factor nuclear factor erythroid 2–related factor 2, which regulates expression and activity of many key antioxidants and antioxidant biosynthesis pathways [73], including superoxide dismutases, glutathione, heme oxygenase 1, and catalase. The short polypeptide antioxidant glutathione is used as a cofactor for antioxidant enzymes such as glutathione peroxidases that are critical for reducing ROS and lipid peroxides [74]. In addition, many of those are localized within mitochondria to regulate mitochondrially derived ROS, especially coenzyme Q10. Of course, dietary antioxidants, such as vitamin E, vitamin C, carotenoids, and many polyphenols, also are critical for protecting the brain from oxidation and neurodegeneration [75].
Table 4 lists findings regarding diet’s role on insulin and IR.
Table 5 outlines findings regarding the effects of IR on AD.
Table 4
Findings on diet’s role in insulin and IR
| Year | Finding | Ref. |
| 2018 | Dietary fiber consumption reduces risk of IR. | [76] |
| 2019 | Three meals/day reduces insulin compared to six meals/day for T2DM patients. | [77] |
| 2019 | Describes how dietary berries reduce IR. | [78] |
| 2020 | Describes molecular mechanisms by which vitamin D prevents IR. | [79] |
| 2020 | Presents results of an RCT (randomized controlled trial) showing that a low-fat vegan diet could significantly reduce IR in overweight adults. | [80] |
| 2021 | Presents an analysis of how IR develops. Suggests a key role of adipose tissue, with a distal step in the insulin action pathway more important than earlier steps. | [81] |
| 2021 | Discusses how lifestyle factors including physical activity, higher dietary fiber intake, and sleep sufficiency could reduce IR. | [82] |
| 2022 | Reviews how healthy plant-based diets reduce IR and inflammation in the MetS. | [83] |
| 2022 | Discusses the importance of oxidative stress in inducing IR and pancreatic β-cell dysfunction. | [84] |
| 2022 | Discusses the dysregulated metabolic mediators released by adipose tissues to promote IR. | [85] |
| 2022 | Reviews evidence that plant-based diets could treat IR. | [62] |
IR, insulin resistance; MetS, metabolic syndrome; RCT, randomized controlled trial; T2DM, type 2 diabetes mellitus.
Table 5
Findings on how IR affects AD
| Year | Finding | Ref. |
| 2015 | Observational study: lower left medial temporal lobe glucose metabolism predicted by HOMA-IR was significantly related to worse immediate and delayed memory performance. | [86] |
| 2015 | Cross-sectional study: IR may contribute to Aβ deposition in AD-affected brain regions. | [87] |
| 2018 | Discusses importance of reduced brain insulin signaling in AD pathogenesis. | [88] |
| 2018 | Reviews IR’s role in T2DM and AD. | [69] |
| 2020 | Reviews evidence that IR may exacerbate Aβ accumulation and also tau hyperphosphorylation; reducing glucose transportation, energy metabolism, and increasing inflammatory pathways, thereby linking T2DM to AD. | [89] |
| 2020 | Suggests that sirtuins, most notably SIRT1, could play a role in development of IR in T2DM patients, leading to neurodegeneration and AD. | [90] |
| 2021 | Insulin plays an important role in brain health. Two significant insulin signal transduction pathways: the PKB/AKT pathway is responsible for metabolic effects, and the MAPK pathway influences cell growth, survival, and gene expression. | [91] |
| 2021 | Discusses multiple mechanisms by which IR exacerbates AD. | [92] |
| 2023 | Role of MetS as a risk factor for AD through IR and involvement of the astrocytic insulin receptor. | [93] |
Aβ, amyloid-β; AD, Alzheimer’s disease; HOMA-IR, Homeostatic Model Assessment for Insulin Resistance; MAPK, mitogen-activated protein kinase; MetS, metabolic syndrome; PKB/AKT, phosphatidylinositol 3-kinase and protein kinase B; SIRT1, a protein coding gene; T2DM, type 2 diabetes mellitus.
Oxidative stress
A review by Huang, Zhang, and Chen nicely introduces the role of oxidative stress in AD [94]. Oxidative stress is induced in the brain by the generation of excess ROS, lack of dietary antioxidants, or the dysfunction of the antioxidant system. Oxidative stress can damage the brain by several mechanisms, including an increase in Ca2 +, release of excitatory amino acids, and neurotoxicity. Reactive nitrogen species such as nitric oxide and peroxynitrite also can contribute. Mitochondria function as both one source and a target of toxic ROS. Transition metals including copper, iron, and zinc can play an important contributing role in oxidative stress, as discussed by Greenough, Camakaris, and Bush [95]. Because the brain membrane’s phospholipid FAs are polyunsaturated, the brain itself is vulnerable to free radical attacks.
Excess amounts of free transition metals such as copper, iron, and zinc accelerate aggregation of Aβ peptide in the brain [96]. Brewer presented evidence that excess copper from drinking water and eating meat is an important risk factor for AD [97]. Dietary intake levels of iron and copper but not manganese and zinc have been significantly correlated with lower cognitive score in a cross-sectional study conducted in the US. [34]. Red meat is an important source of dietary copper, iron, and zinc, whereas poultry is not [98]. Nonheme iron absorption in the intestines is affected by dietary factors: animal tissues and ascorbic acid enhance absorption while calcium oxalic acid, phytic acid and polyphenols inhibit absorption; dietary fibers and proteins can either enhance or inhibit absorption [99].
The review by Thapa and Carroll [100] points out that oxidative stress becomes more pronounced with age. Also, they highlight that compounds such as flavonoids; polyphenols; vitamins A, C, and E; and carotenoids, found in fruits and vegetables, are powerful antioxidants. The review also notes that trials with antioxidant supplements have been inconclusive regarding reduction of oxidative stress as of 2017. A 2021 review outlined the evidence that several compounds, including coenzyme Q10, creatine, and spermidine, have proven useful in mitigating oxidative stress and enhancing mitochondrial biogenesis [101]. Although vitamin E levels are low in people with AD, randomized controlled trials have had limited success in showing that vitamin E supplementation slows progression of AD. One reason may be that nearly all studies have used a single form of vitamin E, synthetic all-racemic α-tocopherol [102]. However, tree nuts are an excellent source of vitamin E [103] and have been significantly associated with anti-inflammatory and antihyperinsulinemia diets [34].
A review by Tönnies and Trushina [104] discusses how oxidative stress affects synaptic activity and neurotransmission in neurons, leading to cognitive dysfunction. In addition, molecular targets affected by ROS include nuclear and mitochondrial DNA, lipids, proteins, calcium homeostasis, mitochondrial dynamics and function, cellular architecture, receptor trafficking and endocytosis, and energy homeostasis. Abnormal cellular metabolism in turn could affect the production and accumulation of Aβ and hyperphosphorylated tau protein, which independently could exacerbate mitochondrial dysfunction and ROS production, thereby contributing to a vicious cycle.
A 2018 review outlined how oxidative stress contributes to oxidative damage in both the Aβ peptide and surrounding tissues [105].
Using five easily understood figures, a 2022 review discusses oxidative stress as the core pathogenesis and mechanism of AD [106]. Figure 1 shows how oxidative stress plays a vital role by causing inflammation according to the amyloid cascade, neurofibrillary tangles, and metal ions hypotheses. Figure 2 shows oxidative stress in the amyloid cascade hypothesis; Fig. 3, in the tau hypothesis; Fig. 4, in the inflammatory hypothesis; and Fig. 5, in the metal ions hypothesis.
A recent review [23] pointed out that the WD contributes to oxidative stress by decreasing the activity of endogenously created antioxidants such as glutathione and superoxide dismutase, which depend on dietary selenium, copper, zinc, and manganese [107].
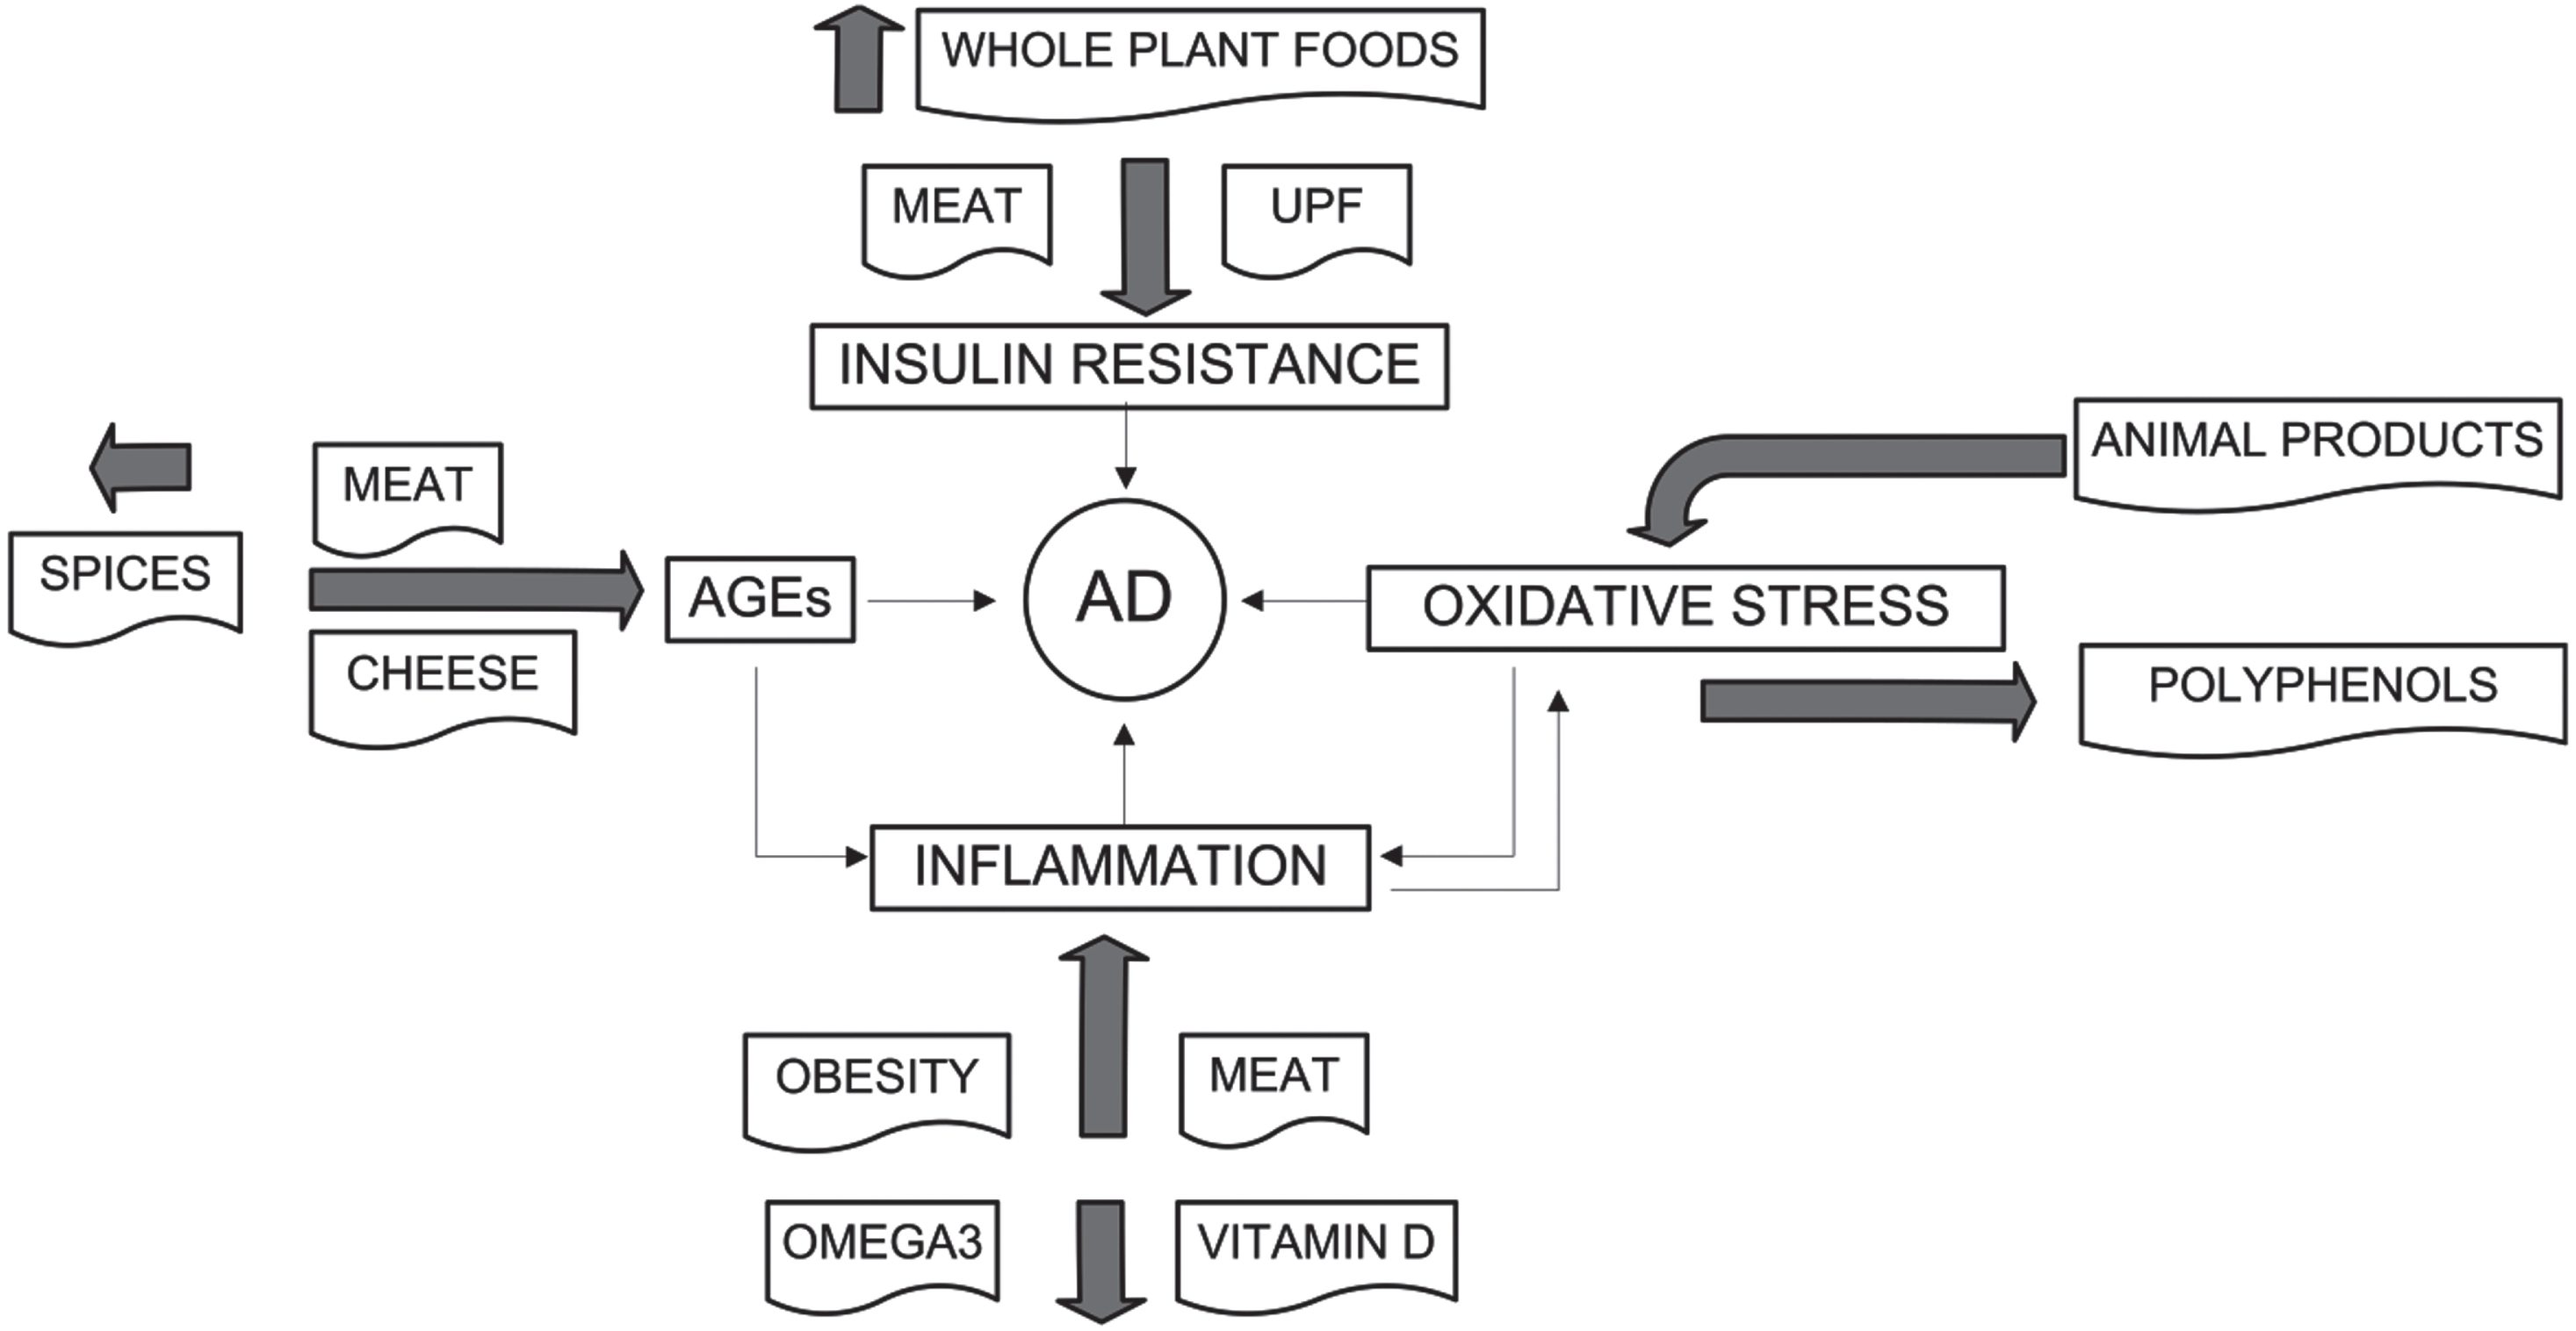
Fig. 4
Effects of specific dietary food groups and factors on risk of AD.
Vitamin D can reduce oxidative stress as a risk factor for AD. A mouse model study showed that vitamin D deficiency promoted glial activation and increased secretion of inflammatory factors. Furthermore, vitamin D: deficiency increased production and deposition of Aβ by elevating expression levels of amyloid-β protein precursor (AβPP) and β-site APP cleavage enzyme 1 (BACE1). Also, vitamin D deficiency increased phosphorylation of tau protein at Thr181, Thr205, and Ser396 by increasing the activities of cyclin-dependent kinase 5 (CDK5) and glycogen synthase kinase 3α/β and promoted synaptic dystrophy and neuronal loss. All those effects may be ascribed to enhanced oxidative stress through downregulation of superoxide dismutase 1, glutathione peroxidase 4, and cystine/glutamate exchanger as well as the lack of dietary antioxidants [108]. Another mouse model study showed that supplementation with vitamins D and E decreased an index of oxidative stress, decreased malondialdehyde level, and increased superoxide dismutase activity. As a result, memory improved, learning deficit was reduced, and neuronal loss was decreased [109].
Obesity
Some confusion has emerged in the journal literature regarding the correlation between obesity and risk of dementia and AD: shorter follow-up studies often report reduced risk, whereas longer studies often report increased risk [19]. As shown in Fig. 2 in that article, the HR for incident dementia per 5-kg/m2 increase in BMI adjusted for age, sex, and ethnicity varies from 0.87 (95% CI, 0.82–0.93) for all studies, to 0.99 (95% CI, 0.93–1.05) for excluding the first 10 years of follow-up, and to 1.16 (95% CI, 1.05–1.17) for excluding the first 20 years of follow-up. The interpretation of that finding is that higher BMI has a direct effect but that reverse causality is in play as a result of weight loss during the preclinical dementia phase.
Obesity is an important risk factor for AD and becoming more important globally because of the upward trends in obesity rates. Global obesity rates for men > 20 years rose from 5% in 1980 to 10% in 2015, whereas those for females rose from 9% to 15% [110]. Obesity rates show large regional differences: obesity rates in 2015 were 5% in the Western Pacific, 6% in Southeast Asia, 13% in Africa, 20% in the Eastern Mediterranean, 23% in Europe, and 28% in the Americas.
Santos and Sinha published a comprehensive review of the molecular mechanisms and therapeutic approaches regarding obesity and aging [111]. To begin with, obese adipose tissue has a chronic inflammatory cellular environment that leads to increased production of ROS, resulting in oxidative stress and mitochondrial dysfunction, which results in further ROS formation and exacerbation of the inflammatory process. Adipose tissue contains adipocytes as well as a matrix of connective tissue, nerve tissue, stromovascular cells, and immune cells. Adipocytes secrete adipokines or adipocytokines, which include proinflammatory cytokines and cytokine-related proteins, renin–angiotensin proteins, and a variety of other proteins that exert hormone-like actions [112]. Leptin is one of those adipokines. The nonadipocyte cells secrete compounds such as TNF-α, IL-6, and IL-8. The development of obesity involves a coordinated increase in size and number of fat cells. The expansion of white adipose tissue along with the ensuing local hypoxia promotes the recruitment of immune cells, resulting in low-grade inflammation [113]. The enlarged obese adipocytes have fewer insulin receptors, leading to increased release of free FAs into the blood. That outcome results in IR in peripheral tissues, oxidative stress, and tissue injury [114]. Also, the higher oxygen consumption in obesity increases mitochondrial respiration, resulting in increased ROS production and oxidative stress [115]. Oxidative stress promotes development and progression of metabolic dysfunction [116] and disruption of the BBB [117].
Obesity’s importance as a risk factor for AD is evident from comparing maps of obesity in the US for 2019–2021 based on data from the Behavioral Risk Factor Surveillance System program of the Centers for Disease and Control and Prevention [118] with the map for AD prevalence (%) for adults≥65 years by county in the US for 2020 [119]. Counties with highest AD prevalence rates are primarily in the southeast and Texas along the Mexican border. Self-reported obesity among non-Hispanic black (NHB) adults are 45% –50% in six southeastern states, where NHB people make up 17% –38% of the population. In 2014, the estimated percentage AD by race and sex were as follows: NHB, male, 13.8%, female, 15.1%; Hispanic, male, 9.9%, female, 13.9%; non-Hispanic white (NHW), male, 8.3%, female, 11.9% [120]. Conversely, states with the lowest AD rates were predominately in the northwest, states with low rates of obesity for NHW people and high NHW percentages of the population.
Trends in obesity rates and AD mortality rates can be used to predict increases in AD in the US. The AD death rate increased from 17.6/100,000 people/year in 2000 to 37.0/100,000/people/year in 2019 (Fig. 8 in ref. [121]), an annual increase of 4.1%. As a measure of obesity, data for the percentage of adults with obesity (BMI > 30 kg/m2) from 1975 to 2016 from data at the WHO Global Health Observatory were obtained from [122]. Because a 20-year lag exists between obesity and AD [19], the AD mortality rate data were shifted back 20 years and multiplied by a factor of 0.68 to bring the data for obesity and AD into general coincidence (Fig. 3). The two linear fits to the data show strong agreement. The graph implies that the AD mortality rates out to 2039 are already baked into the US. In 2039, the AD mortality rate is thus projected to be 35% higher than in 2019, or 50 per 100,000/year. AD prevalence rates also should increase by 35% by 2039. That finding is confounded because many dietary factors that produce obesity also contribute to AD.
Table 6 presents some findings regarding obesity and its effects related to risk of AD.
Table 6
Findings regarding obesity and its effects related to risk of AD
| Finding | Ref. |
| Both aging and obesity are characterized by oxidative stress and low-grade inflammation caused by dysregulation of mitochondrial function, senescence, DNA damage, and telomere shortening. | [123] |
| Increased blood/plasma cholesterol, glucose and insulin; increase in FFAs leading to increases in LDL and triglycerides, decreases in HDL, increase in activated macrophages, and secretion of proinflammatory cytokines. | [124] |
| Altered signaling by two adipokines, leptin and adiponectin, lead to cognitive dysfunction and augmented risk for AD. | [125] |
| Obesity results in lower 25(OH)D concentration. | [126] |
| WD drives the pandemic of obesity. | [127] |
| Rat model study showed that a high-fat diet leads first to gut dysbiosis, followed by brain pathology. | [128] |
| Obesity and AD are multifactorial pathologies, and different are the links that, interacting, promote dysfunctions: Aβ generation due to amyloidogenic APP cleavage, oxidative stress excess, inflammation, toxic lipid production, mitochondrial dysfunction, insulin/leptin resistance, and alteration of BBB integrity. | [129] |
| Adipose tissue dysfunction downregulates adiponectin, an adipokine that sensitizes the insulin receptor signaling pathway and suppresses inflammation. | [130] |
| Adipokines that are produced primarily by adipocytes trigger the release of FFAs from adipocytes into the bloodstream and lead to deposition of FAs into the liver and muscle, which in turn can increase the resistance of organs to insulin. Excess FFAs also damage β cells to reduce insulin secretion capability. Liver IR can increase blood glucose levels as long as the liver continues to produce glucose in the bloodstream. High and steady blood glucose levels lead to damaged pancreatic β cells and impair their ability to secrete insulin. High blood glucose levels can lead to the accumulation of AGEs and AD. | [131] |
| Molecular mechanisms link the obesity-induced impairment in insulin signaling to the upregulation of Aβ aggregation, tau hyperphosphorylation, inflammation, oxidative stress, and mitochondrial dysfunction. | [132] |
25(OH)D, 25-hydroxyvitamin D; Aβ, amyloid-β; AD, Alzheimer’s disease; AGEs, advanced glycation end products; APP, amyloid precursor protein; BBB, blood–brain barrier; FAs, fatty acids; FFAs, free fatty acids; HDL, high-density lipoprotein; IR, insulin resistance; LDL, low-density lipoprotein; WD, Western diet.
Homocysteine
The single source of homocysteine (Hcy) in humans is the demethylation of the essential amino acid methionine (Met) through two intermediate compounds, S-adenosylmethionine (SAM) and S-adenosylhomocysteine (AdoHcy) [133, 134]. The main source of Met in the human diet is animal products. Meat is the largest source of Met because meat is the largest source of animal products with high Met content in the diet. The annual consumption of milk in the US diet in 1980 was about 16 oz/person/day, whereas the amount of meat consumed was about 7.5 oz/day (see Table 2). According to data at My Food Data (http://www.myfooddata.com/articles/high-methionine-foods.php; accessed July 9, 2023), meat such as beef has about 1500 mg of Met in a 6-oz skirt steak, whereas 16 oz (1 pint) of milk has about 430 mg of Met. (See also [135].)
A 2020 review outlined how Hcy may affect risk of AD through the DNA methylation pathway [136]. Figure 1 in that review shows that the predominant metabolism of Hcy can proceed by three pathways. In one pathway, Hcy is remethylated to Met with the assistance of vitamin B12. In the second pathway, with vitamin B6 as a coenzyme, Hcy is converted to cysteine, which can be oxidized to sulfur and excreted through the urine. The third pathway is direct release into the intracellular fluid, followed by being exported to the systemic circulation. Without adequate vitamin B6, vitamin B12, and folate, Hcy concentrations can increase to the point of hyperhomocysteinemia, an important risk factor for AD.
Elevated Hcy is an important risk factor for AD [137]. That review presented meta-analyses of plasma Hcy and risk of dementia, AD, and vascular dementia (VaD) from prospective studies. The findings were as follows. Risk of dementia based on 11 studies: RR = 1.22 (95% CI, 1.08–1.36); AD based on 9 studies, RR = 1.07 (95% CI, 1.04–1.11); and VaD based on 3 studies, RR = 1.13 (95% CI, 1.04–1.23). Another study based on 35 case–control studies with 2172 AD patients and 2289 healthy controls reported a ratio of mean blood Hcy for AD patients vs. controls of 1.32 (95% CI, 1.25–1.40). Figure 7 in [137] showed a linear increase in relative risk for AD versus blood Hcy of 1.09 (95% CI, 1.06–1.13) per 5μmol/L. That study also showed an inverse correlation between blood Hcy and folate levels (p = 0.006).
A 2021 review outlined how Hcy increases risk of AD and other central nervous system diseases through inflammation [138]. One way is by impairing the BBB, thereby increasing the production of proinflammatory cytokines, which in the early stages of AD worsens the synapse destruction and the accumulation and activation of microglia, and in the late stage of AD, increases deposition of Aβ in blood vessels.
A 2022 review outlined several mechanisms whereby Hcy could affect neurodegeneration and lead to VaD and AD [139]. Regarding neurodegeneration, a rat model study showed that after 4 weeks of Hcy exposure, a decrease in speed of basic synaptic transmission emerged [140]. In a laboratory study involving cultured rat cerebellar granule neurons, acute Hcy-induced neurotoxicity was mediated both by group I metabotropic glutamate receptors and N-methyl-d-aspartate receptors [141]. An observational study involving 465 people in Massachusetts with various degrees of neurogenerative disease reported that Hcy was positively correlated with Aβ concentrations [142]; in the AD group (n = 145), for Aβ40, r = 0.36, p < 0.0001. In a mouse model study, compared with controls, tau mice fed with a diet low in folate and B vitamins had a significant increase in brain Hcy levels and worsening of behavioral deficits. The same mice had significantly elevated tau phosphorylation, synaptic pathology, and astrocyte activation. In vitro studies showed that Hcy’s effect on tau phosphorylation was mediated by an upregulation of 5-lipoxygenase through cyclin-dependent kinase 5 (cdk5) kinase pathway activation [143].
Regarding AD, an observational study conducted in Italy assessed the frequency of Hcy > 10μmol/L for 267 patients with probable AD, 198 patients with VaD, and 141 patients with possible AD [144]. Sixty-seven percent of those with probable AD had Hcy > 10μmol/L, compared with 50% with probable AD and 60% with VaD. In longitudinal cohort study in the UK, with 38 patients with mild to moderate AD followed up for an average period of 13 months, global cognition status (Addenbrooke’s Cognitive Examination Revised) declined significantly from 70±10 to 66±13 (p = 0.006) and was paralleled by a significant increase in Hcy concentrations (from 16±5 to 17±6μmol/L; p = 0.006) [145]. A dementia-free cohort of 816 subjects from an Italian population-based study was followed up for a mean period of 4 years, of whom 70 developed AD [146]. For Hcy > 15μmol/L, the HR for AD was 2.11 (95% CI, 1.19–3.76; p = 0.01). For folate < 11.8 mmol/L, the HR for AD was 1.98 (95% CI, 1.15–3.40; p = 0.01). A meta-analysis of Hcy as a risk factor for AD reported in 2014 involving five prospective studies showed RR for high versus low Hcy as 1.93 (95% CI, 1.50–2.49) [147]. However, a later meta-analysis reported a much smaller value. Nine prospective investigations conducted on 7,474 subjects with mean follow-up of 9.5 years (range, 3.7–10) were included in the meta-analysis [148]. A total of 875 of those subjects converted to AD and had significantly higher Hcy (HRadjusted = 1.48 [95% CI, 1.23–1.76]) than those who did not convert to AD. A significant publication bias (Egger’s test, t = 6.39, p = 0.0003) was overcome by the trim-and-fill method, which allowed calculating a bias-corrected imputed HRadjusted of 1.20 (95% CI, 1.01–1.44).
One way Hcy increases risk of AD is through self-assembly of amyloid-like toxic fibrils, their inhibition by polyphenols, and their ability to see the aggregation of Aβ peptide [149]. That finding was shown in a laboratory study. One way that low folate and vitamin B12 increase AD is by decreasing synthesis of SAM. SAM can methylate and quench the expression of both β- and γ-secretase, thus directly reducing production of Aβ [150].
Cysteine is synthesized from Hcy in the liver by transmethylation of Met [151]. Cysteine plays an important role in biological processes in the body such as catalyzing many important metabolic reactions, taking part in lipid biosynthesis, being an important component of skeletal muscles, and playing important roles in mitochondria and the endoplasmic reticulum. However, cysteine seems to play no direct role in risk of AD.
Advanced glycation end products
The predominant process of forming endogenous AGEs is through the classical Maillard reaction. Reducing sugars react nonenzymatically with an amino group of proteins, lipids, and nucleic acids through a series of reactions forming a Schiff base, followed by an Amadori rearrangement and later oxidative modifications (glycoxidation) to produce AGEs [152]. However, several other paths exist, starting with glycolysis, ketone body metabolism, lipid peroxidation, glucose in the polyol pathway, and several other pathways involving oxygen and steps along the Maillard reaction (see Fig. 1 in Khalid, Petroianu, and Adem [152]). Figure 1 in Twarda-Clapa and colleagues [153] also shows the various pathways by which AGEs are formed. That review also classifies AGEs according to their precursors as well as showing the dietary AGE content in 38 common types of food.
AGEs also are found in many foods [21]. Butter, cheese, and margarine have the highest concentrations, followed by meats cooked with their own liquid or fried in oil. Baked carbohydrates, dried figs, non-broiled/fried fish, and eggs have moderate concentrations. Fruits, vegetables, and liquids such as apple juice and milk have low concentrations. Cooking animal-source food at high temperatures, such as baking, broiling, or frying rather than boiling, increases production of AGEs [154]. Baking foods with spices commonly used in Europe can reduce formation of AGEs [155]. Recommended spices include allspice, cloves, cinnamon, star anise, oregano, and thyme. However, only about 10% –30% of exogenous AGEs are absorbed into the systemic circulation when eaten [156]. A low-AGE diet decreased serum AGEs by 30% in humans, whereas a high-AGE diet increased serum AGEs by 65%. The diets were similar, other than their AGE content. Alterations in circulating AGEs occurred within 2 weeks of the diet change [157]. Good evidence indicates that exogenous sources of AGEs have important health effects [158–160]. However, good evidence also exists that formation of AGEs in the gut from food is important [161], especially from meals with high fructose concentrations [162].
AGEs act through binding to their receptor, receptor for advanced glycation end products (RAGE). AGEs explain many neuropathological and biochemical features of AD such as extensive protein crosslinking, glial induction of oxidative stress, and neuronal cell death. Oxidative stress and AGEs initiate a positive feedback loop, wherein normal age-related changes develop into a pathophysiological cascade. RAGE and its decoy receptor soluble RAGE may contribute to or protect against AD pathogenesis by influencing transport of Aβ into the brain or by manipulating inflammatory mechanisms [163]. Figure 2 in that review shows how Aβ and AGEs both can trigger RAGE and, in combination with ROS, lead to proinflammatory signaling by NF-κB with the production of many proinflammatory cytokines. A 2015 review pointed out that RAGE could be a trigger for tau hyperphosphorylation as well as leading to increased inflammatory cytokines and ROS, which can increase Aβ cytotoxicity. Figure 1 in that review shows how RAGE mediates the influx of Aβ across the BBB while lipoprotein receptor–related protein 1 mediates the efflux. A 2022 article outlined how the RAGE–thioredoxin-interacting protein (TXNIP) axis drives inflammation in AD by targeting Aβ in mitochondria [164]. Oxidative stress activates the Nod-like receptor protein NLRP3inflammasome through TXNIP [165]. TXNIP links oxidative stress to inflammation, leading to cellular dysfunction, and is implicated in several diseases related to AD [166]. Figure 2 in that review outlines how TXNIP affects the brain–heart axis and human metabolism.
Research on AGEs and neurodegenerative diseases is active. Table 7 outlines additional findings.
Table 7
Findings in articles and reviews regarding AGEs and neurodegenerative diseases
| Finding | Ref. |
| AGEs have roles in AD and Parkinson’s disease. | [167] |
| AGE formation can be inhibited through polyphenols. | [168] |
| High dietary sugar intake is important in endogenous formation of AGEs. | [169] |
| AGEs modulate amyloidogenic Aβ protein precursor processing and tau phosphorylation. | [170] |
| Suggests several ways to diminish glycative burden. | [171] |
| RAGE’s role as a mediator of inflammatory neurodegeneration. | [172] |
| RAGE is an important pattern recognition receptor for inflammaging through binding with many pathogen- or damaging-associated molecular patterns. | [173] |
| Reviews progress of RAGE molecular imaging toward a better diagnostic biomarker than Aβ. | [174] |
| Reviews evidence that dietary AGEs contribute to IR of aging. | [175] |
Aβ, amyloid-β; AD, Alzheimer’s disease; AGEs, advanced glycation end products; IR, insulin resistance; RAGE, receptor for AGE.
Type 2 diabetes mellitus
Reasonable evidence indicates that people who develop T2DM have an increased risk of developing AD. The first such study was reported in 1997 [176]. It was based on a prospective study involving 1,455 people with T2DM in Rochester enrolled from January 1, 1970, and followed up until January 1, 1985. A total of 9,981 person-years of data were involved, with 101 who developed dementia and including 77 who developed AD. People with T2DM exhibited significantly increased risk of all dementia (RR = 1.66 [95% CI, 1.34–2.05]). Risk of AD was also elevated (for men, RR = 2.27 [95% CI, 1.55–3.31]; for women, RR = 1.37 [95% CI, 0.94–2.01]).
A 1998 review investigated the roles of glucose deficit, oxidative stress, and AGEs in AD [177]. Table 1 in that review showed comparable pathological events regarding AGEs leading to oxidative stress in both AD and T2DM. In AD, at the cellular level, that results in neuritic dystrophy. See also Perrone and Grant [20].
The Rotterdam Study also showed that T2DM was a significant risk factor for incident dementia and AD [178]. A population-based cohort of 6370 elderly people was followed up for a mean time of 2.1 years (range, 4 days to 6 years), during which time 126 became demented, of whom 80 had AD. The age- and sex-adjusted RR for dementia with T2DM was 1.9 (95% CI, 1.3–2.8). If the analysis was limited to those who underwent neuroimaging, the RR for AD was 2.3 (95% CI, 0.96–5.5). The fraction of incident dementia attributable to T2DM (population attributable risk [PAR]) was 8.8% (8.1% in men and 9.2% in women). For comparison, a 2014 analysis estimated that worldwide, with 6.4% prevalence of diabetes, the worldwide PAR for AD from diabetes was 2.9% (95% CI, 1.3% –4.7%), whereas for the US, with 10.3% diabetes prevalence, the PAR was 4.5% (95% CI, 2.0% –7.3%) [179]. However, a later analysis noted that when the PAR calculated for those > 65 years was weighted to give the relative contribution of each risk factor for the overall PAR when adjusted for communality, the PAR for diabetes was reduced from 3.1% to 1.1%, with smoking being 5.2%; depression, 3.9%; social isolation, 3.5%; physical inactivity, 1.6%; and air pollution, 2.3%, for a total of 17.6%.
Considerations of the roles of insulin and insulin-like growth factor in the development of AD led Steen and team to ask whether AD could be considered “type 3 diabetes” [180]. A 2009 review reiterated that AGEs also contribute to the concept of AD being type 3 diabetes [181]. More thoughts about AD as type 3 diabetes are given in a 2017 review [182]. A 2020 review summarizes the evidence that crosstalk between SFAs and Toll-like receptor 4 leads to IR [183].
Lipopolysaccharides (endotoxins)
When meat, poultry, or milk is cooked, bacteria are killed. The leftover membranes of gram-negative bacteria, known as lipopolysaccharide (LPS) or endotoxin, have been implicated in progressive neurodegeneration in AD. LPS can enter the bloodstream of people who eat meat, chicken, or cheese, boosted by the excess SFAs in those foods [22, 184, 185]. LPS, together with SFAs, can be packaged into chylomicrons in the enterocytes to enter the bloodstream [186]. LPS can increase oxidative stress by increasing inflammation. Peripheral LPS may affect inflammation in the central nervous system, including in microglia. LPS may trigger inflammation in the brain by way of cluster of differentiation-14 LPS receptors [187].
Arachidonic acid
Dietary AA comes only from animal fat. Higher AA intake increases the risk of inflammation in AD [188]. AA is processed by lipoxygenase enzymes to become hydroperoxyeicosatetraenoic acid and then inflammatory leukotrienes. Leukotrienes made from AA can increase inflammation and apoptosis in the brain. Prostaglandins made from AA (PGE2 and PGJ2) have a toxic effect on neurons [189]. Also, thromboxanes made from AA can constrict arteries and increase clotting in VaD, which may reduce brain perfusion [190].
Trimethylamine N-oxide
Trimethylamine is produced from the food precursors choline and l-carnitine by the gut microbiota [191]. Trimethylamine is oxidized by flavin-containing monooxygenase 3 in the liver to become TMAO. Foods with more than 70 mg of choline per 100 g include eggs, chicken meat, chicken liver, pork sausage, wheat germ, bacon, pork loin, Atlantic cod, soybeans, and beef [192]. Table 2 in Kepka and colleagues [193] gives the l-carnitine content per 100 g of various foods: beef, 98–139 mg; pork, 20–30 mg; turkey, 51 mg; chicken, 34 mg; fish, 3–9 mg; cow’s milk, 8–10 mg; yogurt, 40 mg; cheese, 14–29 mg; vegetables, 1–4 mg; fruits, 0.2–2 mg.
More important is the relation between diet and circulating TMAO concentrations. Figure 2 in Yang and colleagues [194] gives those values, shown here in Table 8. Because the values are based on amounts per 5% energy/day or one serving/day, they do not represent average consumption rates. The main finding is that animal products increase the amount of TMAO in serum, whereas plant-based products either do not significantly affect TMAO concentrations or lower them.
Table 8
Circulating TMAO concentrations associated with various food groups [194]
| Subgroup | Amount | Amount | Adjusted β (95% CI) |
| (per 5% energy) | (per 1 serving/day) | ||
| Total fish | x | 0.15 (0.08–0.23) | |
| Animal protein | x | 0.13 (0.09–0.16) | |
| Eggs | x | 0.08 (0.02–0.14) | |
| Saturated fat | x | 0.06 (0.01–0.10) | |
| Red meat | x | 0.05 (0.02–0.09) | |
| Monosaturated fat | x | 0.05 (0.02–0.06) | |
| Processed meat | x | 0.02 (–0.08 to 0.13) | |
| Nuts | x | –0.12 (–0.17 to 0.00) | |
| Plant protein | x | –0.13 (–0.21 to –0.04) |
95% CI, 95% confidence interval; TMAO, trimethylamine N-oxide, x indicates whether the amount was per 5% energy or per 1 serving/day.
TMAO concentrations are elevated in the cerebrovascular fluid of people with mild cognitive impairment and AD [195]. A 2022 review discussed the evidence that TMAO increases risk of AD [196]. The evidence includes that TMAO can cross the BBB, that TMAO has been associated with p-tau and p-tau/Aβ42, implicated in development of IR, and associated with unfavorable metabolic syndrome profiles. Those researchers recommend further research to evaluate the evidence. TMAO enhances inflammatory pathways through cholesterol and bile acid dysregulation, as well as activating the nuclear transcription factor NF-κB, which in turn triggers cytokine production leading to an exaggerated inflammatory response [191]. Recent reviews outline the evidence that TMAO contributes to the development of atherosclerosis [197, 198]. Atherosclerosis contributes to the risk of VaD and stroke and possibly to AD [199–201]. Midlife moderate or high cholesterol increases AD risk by 50% and raises VaD risk [202]. However, midlife atherosclerosis was not associated with development of AD in a Swedish prospective study involving 6101 participants, with 285 who developed AD. However, that study also shows that midlife atherosclerosis increased risk of VaD 20 years later by 32% –90%. [200].
A 2021 review notes that TMAO causes the aggregation of Aβ peptide and tau protein [203]. In addition, TMAO can activate astrocytes and inflammatory response. Figure 2 in that review shows a schematic of the processes involved. Besides molecular investigation, animal and human studies also have supported the existence of a functional relationship between TMAO and cognitive decline. Figure 3 in that review outlines possible roles of TMAO in AD’s molecular and cellular pathophysiological mechanisms.
Meat
Ecological studies have identified meat as the most important risk factor for AD, as discussed above. The main reasons seem to be that meat— especially red and processed meats— increase atherosclerosis, IR, and inflammation. SFAs in meat may be the main contributing factor to atherosclerosis [204]. In addition, because meat is a concentrated source of energy, its consumption contributes to overweight and obesity. According to data from the 1999–2004 National Health and Nutrition Examination Survey, people consuming meat in the highest quintile had an OR of 1.27 (95% CI, 1.08–1.49) for obesity [205].
A 2014 meta-analysis of 18 studies reported that consumption of higher quantities of red and processed meats was a risk factor for obesity (OR = 1.37 [95% CI, 1.14–1.64]) [206]. Pooled BMI trends showed that in comparison with those in the lowest n-tile, subjects in the highest n-tile of red and processed meat consumption had higher BMI (mean difference, 1.37 [95% CI, 0.90–1.84] for red meat; mean difference, 1.32 [95% CI, 0.64–2.00] for processed meat).
An ecological analysis of global BMI rates from the World Health Organization and dietary energy supply by food groups from the Food Balance Sheets of the Food and Agriculture Organization of the UN was used to determine the major contribution to obesity [207]. Spearman analyses of the major food groups show that meat availability is most highly correlated with prevalence of obesity (r = 0.67; p < 0.001) and overweight (r = 0.80; p < 0.001) and mean BMI (r = 0.66; p < 0.001) and that the relationships remain when total caloric availability, prevalence of physical inactivity, and GDP are controlled for in partial correlation analysis.
Figure 2 in the EAT-Lancet Commission on healthy diets from sustainable food systems [208] shows that replacing red meat with low-fat dairy, fish, nuts, or poultry reduces risk of major health outcomes (coronary heart disease, diabetes, mortality, and stroke) in the range of 7% ±3% (fish for mortality) to 30% ±13% (nuts and coronary heart disease).
Additional evidence that supports meat as an important risk factor for AD comes from studies of diet and risk of T2DM. A risk assessment model estimated T2DM incidence among adults attributable to direct and body weight–mediated effects of 11 dietary factors in 184 countries in 1990 and 2018 [209]. In 2018, suboptimal intake of those dietary factors was estimated to be attributable to 14.1 million (95% uncertainty interval, 13.8 million–14.4 million) incident T2DM cases, representing 70.3% (95% CI, 68.8% –71.8%) of new cases globally. The largest T2DM burdens were attributable to insufficient whole-grain intake (26.1% [95% CI, 25.0% –27.1% ]), excess refined rice and wheat intake (24.6% [95% CI, 22.3% –27.2% ]), and excess processed meat intake (20.3% [95% CI, 18.3% –23.5% ]). Excess intake of six harmful dietary factors jointly (refined rice and wheat, processed meats, unprocessed red meat, sugar-sweetened beverages, potatoes, fruit juice) contributed a larger proportion of the total global diet-attributable burden of T2DM (60.8%) than insufficient intake of five protective dietary factors (whole grains, yogurt, fruits, nonstarchy vegetables, and nuts and seeds; 39.2%).
A cross-sectional study in people aged 40–70-years who underwent screening colonoscopy between 2013 and 2015 in a single center in Israel assessed the effect of meat consumption and risk of NAFLD [210]. High consumption of total meat (portions/day above the median; OR = 1.49 [95% CI, 1.05–2.13; p = 0.03]; OR = 1.63 [95% CI, 1.12–2.37; p = 0.01]) and red and/or processed meat (OR = 1.47 [95% CI, 1.04–2.09; p = 0.03]; OR = 1.55 [95% CI, 1.07–2.23; p = 0.02]) was independently associated with higher odds of NAFLD and IR, respectively. A review pointed out that IR is a key pathological feature of NAFLD and that low-density lipoprotein receptor–related protein 1 is involved in Aβ clearance but that NAFLD reduces hepatic low-density lipoprotein receptor–related protein activity [211].
An analysis of data from 403,886 men and women (aged 38–73 years) participating in the UK Biobank study was used to examine how meat intake affects inflammatory markers [212]. Each 50-g/day higher intake of total meat increased C-reactive protein by 11.6%; for processed meat, 38.3%; for unprocessed meat, 14.4%; and for poultry, 12.8%. However, for total meat, BMI accounted for 67% of the effect. The study then supports the idea that meat consumption’s effect on risk of AD is related primarily to increase in BMI.
Dietary AGE intake has tripled in the last 50 years. Meat comprises half of AGE and dairy a close second, raising risk of AD from 10% to 23% [20]. Diets rich in SFAs can disrupt the BBB and impair cognition [213].
A 2023 article reported that an analysis of data from the 2015–2018 US National Health and Nutrition Examination Survey found that 12% of individuals accounted for half of all beef consumption [214]. They would be ones who would be expected to have significantly increased risk of AD.
Ultraprocessed foods
For two reasons, UPFs have joined meat as the two most important dietary risk factors for AD:
1. UPFs have few bioactive substances that can reduce inflammation, oxidative stress, or Hcy, including little to no dietary fiber.
2. As an inexpensive source of energy, UPFs help drive the obesity pandemic.
A prospective study in France involved 110,260 adult participants (mean age = 43 years [SD = 15 years], 78% women, median follow-up of 4.1 years). Between 2009 and 2019, 7,036 participants became overweight. An increase of 10% in UPFs increased risk of obesity (HR = 1.09 [95% CI, 1.05–1.13]) [215]. A meta-analysis of six studies published between 2015 and 2019 showed an increased risk of obesity with UPF intake (pooled effect size = 1.26 [95% CI, 1.13–1.41]) [216].
A study based on dietary recall from US participants aged > 1 year in 2017–2018 reported that 58% ±1% of the total energy of food consumed was UPFs, whereas unprocessed or minimally processed foods made up 28% ±1% of total energy [217].
Popkin and colleagues pointed out in 2012 that the global nutrition transition that began in the 1970 s with increased reliance on processed foods, increased away-from-home food intake, and increased use of edible oils and sugar-sweetened beverages had significant effects on obesity rates by the 1990 s [218].
An analysis of the effect of UPFs on obesity in 19 European countries was published in 2017 [219]. The analysis used data on household availability of UPFs as a function of total energy for various years from 1991 to 2008 versus prevalence of obesity for adults for the same years as used for each country. The regression fit to the data increased from 15% obesity for 10% UPFs to 20% obesity for 50% UPFs. The change in obesity was 0.25% (95% CI, 0.05–0.45%) per percentage-point change in UPFs with R2 = 0.63 and p = 0.02. Thus, UPFs do significantly affect countrywide obesity rates.
UPF consumption also is associated with low-grade inflammation [220]. Figure 2 in that review suggests that UPF consumption may increase low-grade inflammation through higher sugar and fat content and lower fiber and micronutrients. In addition, it can affect the gut microbiota, thereby reducing production of short-chain FAs and increasing gut permeability. In addition, nonnutrient components of UPFs such as bisphenol and phthalates also can increase inflammation [220].
A study based on data in the UK Biobank involved a total of 717,333 person-years of follow-up (median, 10.0 years) [221]. A total of 518 participants developed dementia, of whom 287 developed AD and 119 developed VaD. In the fully adjusted model, consumption of UPFs was associated with higher risk of dementia (HR for 10% increase in UPFs = 1.25 [95% CI, 1.14–1.37]) and AD (HR = 1.14 [95% CI, 1.00–1.30]). Another study from the Framingham Offspring Study involved 2,909 adult participants followed up for a mean of 14.4 years. During that time, 306 incident dementia cases occurred, of which 184 were AD [222]. For participants consuming > 7.5 servings/day of UPFs, the HR for all-cause dementia was 1.61 (95% CI, 1.09–2.16), whereas the HR for AD was 1.75 (95% CI, 1.04–2.71).
A cross-sectional study conducted in Italy assessed the correlation between consumption of UPF and adherence to the MedDi [223]. Adherence to MedDi was assessed through the validated Medi-Lite questionnaire, developed by Sofi et al. [224]. The questionnaire includes nine domains, based on daily and/or weekly consumption of fruits, vegetables, cereals, legumes, fish, meat and meat products, dairy products, alcohol, and olive oil. The linear regression fit found 30% UPF for a MedDi-Lite score of 0, but 5% UPF for a MedDi-Lite score of 18.
Figure 4 shows how foods affect the major risk factors for AD.
Bioactive compounds in food
Food has several bioactive compounds that reduce the risk of AD. Most such compounds are found in whole-plant foods. Table 9 outlines the bioactive compounds in various foods that have been associated with reduced risk of AD and how they affect risk of AD. It should be noted that since the evidence is primarily based on laboratory studies, the findings are suggestive rather than definitive.
Table 9
Mechanisms and/or effects of bioactive components associated with foods that reduce risk of AD
| Food source | Bioactive components | Mechanisms and/or effects | Reference |
| Blackberries, red grapes | Resveratrol | Dietary polyphenol resveratrol has antioxidant and cytoprotective effects, producing neuroprotection. | [225] |
| Coffee | Caffeic acid is one of three active ingredients in coffee [226]. | Caffeic acid ameliorated memory and learning impairments, enhanced superoxide dismutase and glutathione free radical activity, decreased expression of phosphorylated tau protein and AβPP, and increased expression of synaptic proteins. | [227] |
| Fish, especially cold-water ocean | Omega-3, docosahexaenoic acid (22:6n-3) | Profound effects on membrane functions, leading to change in nerve conduction, neurotransmitter release, neurotransmitter reuptake, and postsynaptic transmitter effect. | [228] |
| Fish, especially cold-water ocean | Vitamin D [229] | Vitamin D acts primarily as a hormone and has many mechanisms to shield against aging [230]. Vitamin D reduces amyloid production while also increasing its clearance from the brain in AD as well as many other mechanisms [231]. | |
| Fruits, vegetables (yellow, orange, red) | Carotenoids, e.g., leutein and zeaxanthin | Carotenoids reduce oxidative stress, lipid peroxidation, and protein peroxidation products. They also increase the levels of antioxidant enzymes such as catalase and superoxide dismutase. Astaxanthin protects nerve cells against apoptosis by lowering caspase-3 activity and increases neurogenesis by influencing mitogen-activated kinases [232]. | [233] |
| Fruits, vegetables (red, violet, blue) | Anthocyanins | Anthocyanins ameliorate oxidative stress by lowering free radical production and lipid peroxidation. They also reduce prostaglandin synthesis by inhibiting COX. Furthermore, anthocyanins reduce phosphorylated tau protein aggregation. They lower the intracellular Ca2+ ion concentration and inhibit caspase-3, to reduce neuronal apoptosis. | [233, 234] |
| Garlic | Allicin, other bioactive compounds | Garlic has many compounds that reduce inflammation, oxidation, and provide neuroprotection. | [235] |
| Legumes | Polyphenols, peptides, saponins, and carotenoids | The main mechanisms of action include interaction with cell membrane receptors and inhibition of key enzymes. | [236] |
| Legumes | Folate | Reduces Hcy. | [237] |
| Nuts, almond, hazelnut and walnut | Phenolic acid, e.g., Caffeic acid | Protect cells against Aβ-induced toxicity via attenuating intracellular calcium influx and decreasing of tau phosphorylation [238]. | [239] |
| Nuts, almond, hazelnut and walnut | Non-flavonoids, e.g., lignans | Lignans have been shown to ameliorate Aβ-induced neurodegeneration via protection against oxidative stress, anticholinesterase activity and inhibiting the inflammatory signaling pathways [240]. | [239] |
| Nuts, almond, hazelnut and walnut | Flavonoids, e.g., quercetin | Fount to attenuate Aβ1–42-induced cytotoxicity, protein oxidation, lipid peroxidation and apoptosis in primary hippocampal cultures [241]. | [239] |
| Olive oil | Oleuropein, | Oleuropein is a glycosylated seco-iridoid with strong antioxidant potential and protects nerve cells from neurotoxin-induced apoptosis [242]. It can also lower Aβ levels and prevent its aggregation, simultaneously reducing the expression of glutaminyl cyclase, an enzyme involved in Aβ synthesis. | [233] |
| Olive oil | Oleocanthal | It reduces inflammation by inhibiting COX, which participates in the synthesis of pro-inflammatory eicosanoids. [242] showed its ability to reduce Aβ aggregation and modulate its clearance from the brain. | [233] |
| Peppers | Capsaicin | Ten studies showed capsaicin attenuated tau deposition, apoptosis, and synaptic dysfunction. | [243] |
| Soy products | Genistein | It reduces oxidative stress by inhibiting the synthesis of oxygen reactive species. Moreover, genistein protects mitochondria by increasing reduced-to-oxidized glutathione ratio and reducing 8-oxo-20-deoxyguanosine, a marker of mitochondrial DNA damage [244]. It also reduces apoptosis by restricting caspase-3 activity and ameliorates inflammation through reduction in TNF-α and NF-κB levels. Genistein can act as a β-secretase inhibitor and as a α-secretase promoter, thus decreasing Aβ synthesis and senile plaque formation [244]. | [233] |
| Spices | Cinnamon, ginger, pepper, saffron | Suppress inflammatory pathways, serve as antioxidants, inhibits acetylcholinesterase and Aβ aggregation. | [245] |
| Turmeric, e.g., curry power | Curcumin | Prevents Aβ aggregation, protects neurons from toxic insults, improves synaptic functions. | [246] |
| Vegetables, cruciferous | Isothiocyanates | Isothiocyanates act as antioxidants. They are also show anti-inflammatory effects. Moreover, some isothiocyanates efficiently suppress acetylcholinesterase activity, thereby prolonging the half-life of acetylcholine, a neurotransmitter whose concentration is usually lowered in patients with AD [247]. | [233] |
| Vegetables, green leafy | Folate, lutein, phylloquinone | Folate, reduction of Hcy [137]; lutein, antioxidant, anti-inflammatory properties [248] | [249] |
| Whole grains | Phenolic acids | Antioxidant activity, anti-inflammatory activity, antimicrobial activity. | [250] |
Aβ, amyloid-β; AβPP, amyloid-β protein precursor; BBB, blood–brain barrier; COX, Cyclooxygenase; Hcy, homocysteine; NF-κB, Nuclear factor kappa-light-chain-enhancer of activated B cells; TNF-α, tumor necrosis factor α.
DISCUSSION
This review found that meat, especially red and processed meat, UPF, and obesity are important risk factors for AD. The most important mechanisms for risk of AD appear to be inflammation and IR. Additional mechanisms include oxidative stress, elevated Hcy, dietary AGEs, and TMAO. Foods that reduce risk of AD include fish, fruits and vegetables, especially brightly colored ones, cruciferous and leafy green vegetables, legumes, olive oil, soy products, spices, and whole grains. The compounds in these foods that might explain the effect on risk of AD as well as the mechanisms involved have been tentatively identified through laboratory studies.
More support for the role of dietary patterns in reducing risk of AD comes from studies of dietary patterns in reducing risk of AD’s comorbidities. A 2021 review outlined the evidence that several diseases comorbid with AD contribute to the risk of AD [251]: T2DM, CVD, depression, and inflammatory bowel disease. Inflammation was the factor shared by most of the comorbidities. Genetic factors also explained some of the links. When possible, the review listed mechanisms that might explain the relationship of disease comorbidities to AD. Another recent review outlined the health benefits of plant-based diets for atherosclerosis, chronic diseases such as CVD and T2DM, and metabolic syndrome [204]. The shared risk factors for those diseases include inflammation, IR, impaired blood lipid profile, and endothelial dysfunction. The review outlined how plant-based food patterns reduce HOMA-IR (Homeostatic Model Assessment for Insulin Resistance), non-HDL cholesterol, oxidative stress, plasma cholesterol (low-density lipoprotein), and endothelial vascular dysfunction. Thus, not only does a healthy plant-based food pattern reduce risk of AD directly, it also reduces it indirectly by reducing risk of diseases comorbid with AD and improves overall well-being by reducing those comorbidities.
VaD has similarities and differences with AD. For example, high consumption of SFAs is an important risk factor for VaD [252]. Much of AD coexists with VaD and often is called mixed dementia. VaD includes small strokes that damage cognition, reduced brain perfusion that reduces cognition, and damage to the BBB. A recent review outlined the global effects of the WD and how it affects metabolism and health [23].
Unfortunately, even with a diagnosis of increased risk for AD, many people would be unable or unwilling to modify their diet. A primary reason for many people is entrenched habit patterns and the cost of readily available food. Obesity rates are strongly inversely correlated with income. A 2018 article shows that in the US, consumption of high-fructose corn syrup began to climb rapidly in about 1975, and TV ads and obesity rates began to climb rapidly after 1990 [253]. (In the 21st century, UPFs tended to replace meat as the most important driver of obesity trends.). Figure 5 in that article shows that obesity prevalence for people with the lower median household income < $10,000/year in 2009 climbed at an annual rate of 1.6% from 1990 to 2015, dropping to 0.8% /year for ∼$50,000/year, ∼0.5% for $100,000/year, and 0.25% for $150,000/year.
From this review, it is now clear that AD has several risk factors, many of which can be evaluated well before symptoms of AD become apparent. Several are related to eating animal products, especially red and processed meat: high AGE concentrations, high body weight/obesity, high Hcy concentrations, IR, endotoxins, animal foods with AA, and high TMAO concentrations. Some symptoms also are related to high consumption of UPFs: high body weight/obesity, having T2DM, high HbA1c (hemoglobin A1c, or glycated hemoglobin), IR, and low antioxidant status. Some symptoms are related to higher weight or BMI, such as C-reactive protein. Thus, a preliminary analysis can be made after considering the personal dietary pattern, BMI, and T2DM status. Then, if warranted, some blood biomarkers could be measured.
The report Food in the Anthropocene: the EAT–Lancet Commission on healthy diets from sustainable food systems has 6,705 Google Scholar citations as of July 25, 2023. The scientific targets for healthy diets lists those foods in descending order of grams/day: vegetables; dairy foods; all grains; fruits; tubers/starchy vegetables; dry beans, lentils and peas; nuts; unsaturated oils; chicken, other poultry; all sweeteners; fish; soy; and eggs. Those targets are in general agreement with what would reduce the risk of AD. (However, the grains should be consumed as whole grains rather than as UPFs.) The report also listed several scientific targets for sustainable food production: effects on climate change, nitrogen cycling, phosphorus cycling, freshwater use, biodiversity loss, and land-system change. The report also outlined five strategies that could lead to global adoption of health diets from sustainable food systems. Thus, what is good for Earth also is good for human health, and vice versa.
SUMMARY AND CONCLUSION
Research during the past three decades has yielded strong evidence that dietary factors play important roles in the risk of AD. The most important dietary risk factors appear to be meat, especially red and processed meat, and UPFs. Both are important determinants of obesity, also an important risk factor. The mechanisms by which diet affects risk of AD include those associated with inflammation, hyperinsulinemia, oxidative stress, Hcy, AGEs, modification of the gut microbiome, endotoxins, AA, and TMAO. Risk reduction of AD is related to higher consumption of fruits, legumes, nuts, omega-3 FAs, vegetables, and whole grains. Of dietary patterns, the WD has the highest risk for AD, whereas the DASH and MIND dietary patterns, with reduced intake of meat and other modifications, appear to reduce risk of AD by 40% –50% in comparison with the WD. However, a healthful, whole plant–based diet appears to yield the greatest risk reduction. T2DM shares many dietary risk factors as AD and is considered a risk factor for AD. T2DM can be reversed through a whole-food vegan diet with supplementation and enough essential FAs. Unfortunately, the diets that offer greater AD risk reduction are more expensive than the WD. Thus, people with lower incomes are often most at risk for AD. Correcting that inequity would take government and industry action.
ACKNOWLEDGMENTS
The authors have no acknowledgments to report.
FUNDING
The authors have no funding to report. However, WBG receives funding from Bio-Tech Pharmacal, Inc. (Fayetteville, AR, USA).
CONFLICT OF INTEREST
William B. Grant is an Editorial Board Member of this journal but was not involved in the peer-review process nor had access to any information regarding its peer-review. Steven M. Blake has no conflicts of interest to declare.
REFERENCES
[1] | Gustavsson A , Norton N , Fast T , Frolich L , Georges J , Holzapfel D , Kirabali T , Krolak-Salmon P , Rossini PM , Ferretti MT , Lanman L , Chadha AS , van der Flier WM ((2023) ) Global estimates on the number of persons across the Alzheimer’s disease continuum. Alzheimers Dement 19: , 658–670. |
[2] | Bellenguez C , Kucukali F , Jansen IE , Kleineidam L , Moreno-Grau S , Amin N , Naj AC , Campos-Martin R , Grenier-Boley B , Andrade V , et al. ((2022) ) New insights into the genetic etiology of Alzheimer’s disease and related dementias. Nat Genet 54: , 412–436. |
[3] | Xu W , Tan L , Wang HF , Jiang T , Tan MS , Tan L , Zhao QF , Li JQ , Wang J , Yu JT ((2015) ) Meta-analysis of modifiable risk factors for Alzheimer’s disease. J Neurol Neurosurg Psychiatry 86: , 1299–1306. |
[4] | Yu JT , Xu W , Tan CC , Andrieu S , Suckling J , Evangelou E , Pan A , Zhang C , Jia J , Feng L , Kua EH , Wang YJ , Wang HF , Tan MS , Li JQ , Hou XH , Wan Y , Tan L , Mok V , Tan L , Dong Q , Touchon J , Gauthier S , Aisen PS , Vellas B ((2020) ) Evidence-based prevention of Alzheimer’s disease: Systematic review and meta-analysis of 243 observational prospective studies and 153 randomised controlled trials. J Neurol Neurosurg Psychiatry 91: , 1201–1209. |
[5] | Zhang XX , Tian Y , Wang ZT , Ma YH , Tan L , Yu JT ((2021) ) The epidemiology of Alzheimer’s disease modifiable risk factors and prevention. J Prev Alzheimers Dis 8: , 313–321. |
[6] | Morris MC , Tangney CC , Wang Y , Sacks FM , Bennett DA , Aggarwal NT ((2015) ) MIND diet associated with reduced incidence of Alzheimer’s disease. Alzheimers Dement 11: , 1007–1014. |
[7] | Chen X , Maguire B , Brodaty H , O’Leary F ((2019) ) Dietary patterns and cognitive health in older adults: A systematic review. J Alzheimers Dis 67: , 583–619. |
[8] | Grant WB ((1997) ) Dietary links to Alzheimer’s disease. Alzheimers Dis Rev 2: , 42–55. |
[9] | van den Brink AC , Brouwer-Brolsma EM , Berendsen AAM , van de Rest O ((2019) ) The Mediterranean, Dietary Approaches to Stop Hypertension (DASH), and Mediterranean-DASH Intervention for Neurodegenerative Delay (MIND) diets are associated with less cognitive decline and a lower risk of Alzheimer’s disease-a review. Adv Nutr 10: , 1040–1065. |
[10] | Luchsinger JA , Tang MX , Shea S , Mayeux R ((2002) ) Caloric intake and the risk of Alzheimer disease. Arch Neurol 59: , 1258–1263. |
[11] | Roman GC , Jackson RE , Gadhia R , Roman AN , Reis J ((2019) ) Mediterranean diet: The role of long-chain omega-3 fatty acids in fish; polyphenols in fruits, vegetables, cereals, coffee, tea, cacao and wine; probiotics and vitamins in prevention of stroke, age-related cognitive decline, and Alzheimer disease. Rev Neurol (Paris) 175: , 724–741. |
[12] | Baranowski BJ , Marko DM , Fenech RK , Yang AJT , MacPherson REK ((2020) ) Healthy brain, healthy life: A review of diet and exercise interventions to promote brain health and reduce Alzheimer’s disease risk. Appl Physiol Nutr Metab 45: , 1055–1065. |
[13] | White L , Petrovitch H , Ross GW , Masaki KH , Abbott RD , Teng EL , Rodriguez BL , Blanchette PL , Havlik RJ , Wergowske G , Chiu D , Foley DJ , Murdaugh C , Curb JD ((1996) ) Prevalence of dementia in older Japanese-American men in Hawaii: The Honolulu-Asia Aging Study. JAMA 276: , 955–960. |
[14] | Kalmijn S , Launer LJ , Ott A , Witteman JC , Hofman A , Breteler MM ((1997) ) Dietary fat intake and the risk of incident dementia in the Rotterdam Study. Ann Neurol 42: , 776–782. |
[15] | Grant WB ((2014) ) Trends in diet and Alzheimer’s disease during the nutrition transition in Japan and developing countries. J Alzheimers Dis 38: , 611–620. |
[16] | Dodge HH , Buracchio TJ , Fisher GG , Kiyohara Y , Meguro K , Tanizaki Y , Kaye JA ((2012) ) Trends in the prevalence of dementia in Japan. Int J Alzheimers Dis 2012: , 956354. |
[17] | Grant WB ((2016) ) Using multicountry ecological and observational studies to determine dietary risk factors for Alzheimer’s disease. J Am Coll Nutr 35: , 476–489. |
[18] | (1996) Food Balance Sheets; 1992-94 average, Food and Agriculture Organization of the United Nations, Rome. |
[19] | Kivimaki M , Luukkonen R , Batty GD , Ferrie JE , Pentti J , Nyberg ST , Shipley MJ , Alfredsson L , Fransson EI , Goldberg M , Knutsson A , Koskenvuo M , Kuosma E , Nordin M , Suominen SB , Theorell T , Vuoksimaa E , Westerholm P , Westerlund H , Zins M , Kivipelto M , Vahtera J , Kaprio J , Singh-Manoux A , Jokela M ((2018) ) Body mass index and risk of dementia: Analysis of individual-level data from 1.3 million individuals. Alzheimers Dement 14: , 601–609. |
[20] | Perrone L , Grant WB ((2015) ) Observational and ecological studies of dietary advanced glycation end products in national diets and Alzheimer’s disease incidence and prevalence. J Alzheimers Dis 45: , 965–979. |
[21] | Uribarri J , Woodruff S , Goodman S , Cai W , Chen X , Pyzik R , Yong A , Striker GE , Vlassara H ((2010) ) Advanced glycation end products in foods and a practical guide to their reduction in the diet. J Am Diet Assoc 110: , 911–916 e912. |
[22] | Wieckowska-Gacek A , Mietelska-Porowska A , Wydrych M , Wojda U ((2021) ) Western diet as a trigger of Alzheimer’s disease: From metabolic syndrome and systemic inflammation to neuroinflammation and neurodegeneration. Ageing Res Rev 70: , 101397. |
[23] | Clemente-Suarez VJ , Beltran-Velasco AI , Redondo-Florez L , Martin-Rodriguez A , Tornero-Aguilera JF ((2023) ) Global impacts of Western diet and its effects on metabolism and health: A narrative review. Nutrients 15: , 2749. |
[24] | Willett WC , Sacks F , Trichopoulou A , Drescher G , Ferro-Luzzi A , Helsing E , Trichopoulos D ((1995) ) Mediterranean diet pyramid: A cultural model for healthy eating.1402S-1406S. Am J Clin Nutr 61: . |
[25] | Panagiotakos DB , Pitsavos C , Arvaniti F , Stefanadis C ((2007) ) Adherence to the Mediterranean food pattern predicts the prevalence of hypertension, hypercholesterolemia, diabetes and obesity, among healthy adults; the accuracy of the MedDietScore. Prev Med 44: , 335–340. |
[26] | Bach-Faig A , Berry EM , Lairon D , Reguant J , Trichopoulou A , Dernini S , Medina FX , Battino M , Belahsen R , Miranda G , Serra-Majem L , Mediterranean Diet Foundation Expert Group ((2011) ) Mediterranean diet pyramid today. Science and cultural updates. Public Health Nutr 14: , 2274–2284. |
[27] | Appel LJ , Moore TJ , Obarzanek E , Vollmer WM , Svetkey LP , Sacks FM , Bray GA , Vogt TM , Cutler JA , Windhauser MM , Lin PH , Karanja N ((1997) ) A clinical trial of the effects of dietary patterns on blood pressure. DASH Collaborative Research Group. N Engl J Med 336: , 1117–1124. |
[28] | Epstein DE , Sherwood A , Smith PJ , Craighead L , Caccia C , Lin PH , Babyak MA , Johnson JJ , Hinderliter A , Blumenthal JA ((2012) ) Determinants and consequences of adherence to the dietary approaches to stop hypertension diet in African-American and white adults with high blood pressure: Results from the ENCORE trial. J Acad Nutr Diet 112: , 1763–1773. |
[29] | Scarmeas N , Stern Y , Tang MX , Mayeux R , Luchsinger JA ((2006) ) Mediterranean diet and risk for Alzheimer’s disease. Ann Neurol 59: , 912–921. |
[30] | Ellouze I , Sheffler J , Nagpal R , Arjmandi B ((2023) ) Dietary patterns and Alzheimer’s disease: An updated review linking nutrition to neuroscience. Nutrients 15: , 3204. |
[31] | Andreu-Reinon ME , Chirlaque MD , Gavrila D , Amiano P , Mar J , Tainta M , Ardanaz E , Larumbe R , Colorado-Yohar SM , Navarro-Mateu F , Navarro C , Huerta JM ((2021) ) Mediterranean diet and risk of dementia and Alzheimer’s disease in the EPIC-Spain Dementia Cohort Study. Nutrients 13: , 700. |
[32] | Feart C , Samieri C , Rondeau V , Amieva H , Portet F , Dartigues JF , Scarmeas N , Barberger-Gateau P ((2009) ) Adherence to a Mediterranean diet, cognitive decline, and risk of dementia. JAMA 302: , 638–648. |
[33] | Hu EA , Wu A , Dearborn JL , Gottesman RF , Sharrett AR , Steffen LM , Coresh J , Rebholz CM ((2020) ) Adherence to dietary patterns and risk of incident dementia: Findings from the Atherosclerosis Risk in Communities Study. J Alzheimers Dis 78: , 827–835. |
[34] | Wang P , Song M , Eliassen AH , Wang M , Fung TT , Clinton SK , Rimm EB , Hu FB , Willett WC , Tabung FK , Giovannucci EL ((2023) ) Optimal dietary patterns for prevention of chronic disease. Nat Med 29: , 719–728. |
[35] | Lee DH , Li J , Li Y , Liu G , Wu K , Bhupathiraju S , Rimm EB , Rexrode KM , Manson JE , Willett WC , Hu FB , Tabung FK , Giovannucci EL ((2020) ) Dietary inflammatory and insulinemic potential and risk of type 2 diabetes: Results from three prospective U.S. cohort studies. Diabetes Care 43: , 2675–2683. |
[36] | Walker KA , Ficek BN , Westbrook R ((2019) ) Understanding the role of systemic inflammation in Alzheimer’s disease. ACS Chem Neurosci 10: , 3340–3342. |
[37] | Vinuesa A , Pomilio C , Gregosa A , Bentivegna M , Presa J , Bellotto M , Saravia F , Beauquis J ((2021) ) Inflammation and insulin resistance as risk factors and potential therapeutic targets for Alzheimer’s disease. Front Neurosci 15: , 653651. |
[38] | Xie J , Van Hoecke L , Vandenbroucke RE ((2021) ) The impact of systemic inflammation on Alzheimer’s disease pathology. Front Immunol 12: , 796867. |
[39] | Zhang J , Chen C , Hua S , Liao H , Wang M , Xiong Y , Cao F ((2017) ) An updated meta-analysis of cohort studies: Diabetes and risk of Alzheimer’s disease. Diabetes Res Clin Pract 124: , 41–47. |
[40] | Athanasaki A , Melanis K , Tsantzali I , Stefanou MI , Ntymenou S , Paraskevas SG , Kalamatianos T , Boutati E , Lambadiari V , Voumvourakis KI , Stranjalis G , Giannopoulos S , Tsivgoulis G , Paraskevas GP ((2022) ) Type 2 diabetes mellitus as a risk factor for Alzheimer’s disease: Review and meta-analysis. Biomedicines 10: , 778. |
[41] | Rodriguez-Hernandez H , Simental-Mendia LE , Rodriguez-Ramirez G , Reyes-Romero MA ((2013) ) Obesity and inflammation: Epidemiology, risk factors, and markers of inflammation. Int J Endocrinol 2013: , 678159. |
[42] | Franceschi C , Bonafe M , Valensin S , Olivieri F , De Luca M , Ottaviani E , De Benedictis G ((2000) ) Inflamm-aging. An evolutionary perspective on immunosenescence. Ann N Y Acad Sci 908: , 244–254. |
[43] | Wang LM , Wu Q , Kirk RA , Horn KP , Ebada Salem AH , Hoffman JM , Yap JT , Sonnen JA , Towner RA , Bozza FA , Rodrigues RS , Morton KA ((2018) ) Lipopolysaccharide endotoxemia induces amyloid-beta and p-tau formation in the rat brain. Am J Nucl Med Mol Imaging 8: , 86–99. |
[44] | Sinyor B , Mineo J , Ochner C ((2020) ) Alzheimer’s disease, inflammation, and the role of antioxidants. J Alzheimers Dis Rep 4: , 175–183. |
[45] | Colonna M , Butovsky O ((2017) ) Microglia function in the central nervous system during health and neurodegeneration. Annu Rev Immunol 35: , 441–468. |
[46] | Wang WY , Tan MS , Yu JT , Tan L ((2015) ) Role of pro-inflammatory cytokines released from microglia in Alzheimer’s disease. Ann Transl Med 3: , 136. |
[47] | Sastre M , Walter J , Gentleman SM ((2008) ) Interactions between APP secretases and inflammatory mediators. J Neuroinflammation 5: , 25. |
[48] | Sidoryk-Wegrzynowicz M , Wegrzynowicz M , Lee E , Bowman AB , Aschner M ((2011) ) Role of astrocytes in brain function and disease. Toxicol Pathol 39: , 115–123. |
[49] | Onyango IG , Jauregui GV , Carna M , Bennett JP Jr. , Stokin GB ((2021) ) Neuroinflammation in Alzheimer’s disease. Biomedicines 9: , 524. |
[50] | Ricker MA , Haas WC ((2017) ) Anti-inflammatory diet in clinical practice: A review. Nutr Clin Pract 32: , 318–325. |
[51] | Brenner RR ((2003) ) Hormonal modulation of delta6 and delta5 desaturases: Case of diabetes. Prostaglandins Leukot Essent Fatty Acids 68: , 151–162. |
[52] | Kwon Y ((2020) ) Immuno-resolving ability of resolvins, protectins, and maresins derived from omega-3 fatty acids in metabolic syndrome. Mol Nutr Food Res 64: , e1900824. |
[53] | Maciejewska-Markiewicz D , Stachowska E , Hawrylkowicz V , Stachowska L , Prowans P ((2021) ) The role of resolvins, protectins and marensins in non-alcoholic fatty liver disease (NAFLD). Biomolecules 11: , 937. |
[54] | Franceschi C , Garagnani P , Parini P , Giuliani C , Santoro A ((2018) ) Inflammaging: A new immune-metabolic viewpoint for age-related diseases. Nat Rev Endocrinol 14: , 576–590. |
[55] | Ticinesi A , Meschi T , Lauretani F , Felis G , Franchi F , Pedrolli C , Barichella M , Benati G , Di Nuzzo S , Ceda GP , Maggio M ((2016) ) Nutrition and inflammation in older individuals: Focus on vitamin D, n-3 polyunsaturated fatty acids and whey proteins. Nutrients 8: , 186. |
[56] | Kosyreva AM , Sentyabreva AV , Tsvetkov IS , Makarova OV ((2022) ) Alzheimer’s disease and inflammaging. Brain Sci 12: , 1237. |
[57] | Charisis S , Ntanasi E , Yannakoulia M , Anastasiou CA , Kosmidis MH , Dardiotis E , Gargalionis AN , Patas K , Chatzipanagiotou S , Mourtzinos I , Tzima K , Hadjigeorgiou G , Sakka P , Kapogiannis D , Scarmeas N ((2021) ) Diet inflammatory index and dementia incidence: A population-based study. Neurology 97: , e2381–e2391. |
[58] | Shivappa N , Steck SE , Hurley TG , Hussey JR , HebertJR ((2014) ) Designing and developing a literature-derived, population-based dietary inflammatory index. Public Health Nutr 17: , 1689–1696. |
[59] | Kellar D , Craft S ((2020) ) Brain insulin resistance in Alzheimer’s disease and related disorders: Mechanisms and therapeutic approaches. Lancet Neurol 19: , 758–766. |
[60] | Protzek AO , Rezende LF , Costa-Junior JM , Ferreira SM , Cappelli AP , de Paula FM , de Souza JC , Kurauti MA , Carneiro EM , Rafacho A , Boschero AC ((2016) ) Hyperinsulinemia caused by dexamethasone treatment is associated with reduced insulin clearance and lower hepatic activity of insulin-degrading enzyme. J Steroid Biochem Mol Biol 155: , 1–8. |
[61] | Kurochkin IV , Guarnera E , Berezovsky IN ((2018) ) Insulin-degrading enzyme in the fight against Alzheimer’s disease. Trends Pharmacol Sci 39: , 49–58. |
[62] | Banaszak M , Gorna I , Przyslawski J ((2022) ) Non-pharmacological treatments for insulin resistance: Effective intervention of plant-based diets-a critical review. Nutrients 14: , 1400. |
[63] | Milstein JL , Ferris HA ((2021) ) The brain as an insulin-sensitive metabolic organ. Mol Metab 52: , 101234. |
[64] | Kleinridders A , Ferris HA , Cai W , Kahn CR ((2014) ) Insulin action in brain regulates systemic metabolism and brain function. Diabetes 63: , 2232–2243. |
[65] | Kwon H , Pessin H (2020) Insulin-mediated PI3K and AKT signaling. In The Liver: Biology and Pathobiology, Sixth Edition, Arias IM, Alter HJ, Boyer JL, Cohen DE, Shafritz DA, Thorgeirsson SS, Wolkoff AW, eds. John Wiley & Songs., Ltd., pp. 485-495. |
[66] | Garcia-Caceres C , Quarta C , Varela L , Gao Y , Gruber T , Legutko B , Jastroch M , Johansson P , Ninkovic J , Yi CX , Le Thuc O , Szigeti-Buck K , Cai W , Meyer CW , Pfluger PT , Fernandez AM , Luquet S , Woods SC , Torres-Aleman I , Kahn CR , Gotz M , Horvath TL , Tschop MH ((2016) ) Astrocytic insulin signaling couples brain glucose uptake with nutrient availability. Cell 166: , 867–880. |
[67] | Cai W , Xue C , Sakaguchi M , Konishi M , Shirazian A , Ferris HA , Li ME , Yu R , Kleinridders A , Pothos EN , Kahn CR ((2018) ) Insulin regulates astrocyte gliotransmission and modulates behavior. J Clin Invest 128: , 2914–2926. |
[68] | Mielke JG , Taghibiglou C , Liu L , Zhang Y , Jia Z , Adeli K , Wang YT ((2005) ) A biochemical and functional characterization of diet-induced brain insulin resistance. J Neurochem 93: , 1568–1578. |
[69] | Arnold SE , Arvanitakis Z , Macauley-Rambach SL , Koenig AM , Wang HY , Ahima RS , Craft S , Gandy S , Buettner C , Stoeckel LE , Holtzman DM , Nathan DM ((2018) ) Brain insulin resistance in type 2 diabetes and Alzheimer disease: Concepts and conundrums. Nat Rev Neurol 14: , 168–181. |
[70] | Chudoba C , Wardelmann K , Kleinridders A ((2019) ) Molecular effects of dietary fatty acids on brain insulin action and mitochondrial function. Biol Chem 400: , 991–1003. |
[71] | Maciejczyk M , Zebrowska E , Chabowski A ((2019) ) How excess dietary saturated fats induce insulin resistance Int J Mol Sci 20: , 874. |
[72] | Blake S , Rudolph D ((2021) ) How excess dietary saturated fats induce insulin resistance. Int J Transl Sci 1: , 4. |
[73] | Ma Q ((2013) ) Role of nrf2 in oxidative stress and toxicity. Annu Rev Pharmacol Toxicol 53: , 401–426. |
[74] | Liddell JR , Hoepken HH , Crack PJ , Robinson SR , Dringen R ((2006) ) Glutathione peroxidase 1 and glutathione are required to protect mouse astrocytes from iron-mediated hydrogen peroxide toxicity. J Neurosci Res 84: , 578–586. |
[75] | Feng J , Zheng Y , Guo M , Ares I , Martínez M , Lopez-Torres B , MartínezLarrañaga MR , Wang X , Anadón A , Martínez MA ((2023) ) Oxidative stress, the blood–brain barrier and neurodegenerative diseases: The critical beneficial role of dietary antioxidants. Acta Pharm Sin B 13: , 3988–4024. |
[76] | Weickert MO , Pfeiffer AFH ((2018) ) Impact of dietary fiber consumption on insulin resistance and the prevention of type 2 diabetes. J Nutr 148: , 7–12. |
[77] | Jakubowicz D , Landau Z , Tsameret S , Wainstein J , Raz I , Ahren B , Chapnik N , Barnea M , Ganz T , Menaged M , Mor N , Bar-Dayan Y , Froy O ((2019) ) Reduction in glycated hemoglobin and daily insulin dose alongside circadian clock upregulation in patients with type 2 diabetes consuming a three-meal diet: A randomized clinical trial. Diabetes Care 42: , 2171–2180. |
[78] | Calvano A , Izuora K , Oh EC , Ebersole JL , Lyons TJ , Basu A ((2019) ) Dietary berries, insulin resistance and type 2 diabetes: An overview of human feeding trials. Food Funct 10: , 6227–6243. |
[79] | Szymczak-Pajor I , Drzewoski J , Sliwinska A ((2020) ) The molecular mechanisms by which vitamin D prevents insulin resistance and associated disorders. Int J Mol Sci 21: , 6644. |
[80] | Kahleova H , Petersen KF , Shulman GI , Alwarith J , Rembert E , Tura A , Hill M , Holubkov R , Barnard ND ((2020) ) Effect of a low-fat vegan diet on body weight, insulin sensitivity, postprandial metabolism, and intramyocellular and hepatocellular lipid levels in overweight adults: A randomized clinical trial. JAMA Netw Open 3: , e2025454. |
[81] | James DE , Stockli J , Birnbaum MJ ((2021) ) The aetiology and molecular landscape of insulin resistance. Nat Rev Mol Cell Biol 22: , 751–771. |
[82] | Barber TM , Kyrou I , Randeva HS , Weickert MO ((2021) ) Mechanisms of insulin resistance at the crossroad of obesity with associated metabolic abnormalities and cognitive dysfunction. Int J Mol Sci 22: , 546. |
[83] | Thomas MS , Calle M , Fernandez ML ((2023) ) Healthy plant-based diets improve dyslipidemias, insulin resistance, and inflammation in metabolic syndrome. A narrative review. Adv Nutr 14: , 44–54. |
[84] | Andreadi A , Bellia A , Di Daniele N , Meloni M , Lauro R , Della-Morte D , Lauro D ((2022) ) The molecular link between oxidative stress, insulin resistance, and type 2 diabetes: A target for new therapies against cardiovascular diseases. Curr Opin Pharmacol 62: , 85–96. |
[85] | Li M , Chi X , Wang Y , Setrerrahmane S , Xie W , Xu H ((2022) ) Trends in insulin resistance: Insights into mechanisms and therapeutic strategy. Signal Transduct Target Ther 7: , 216. |
[86] | Willette AA , Bendlin BB , Starks EJ , Birdsill AC , Johnson SC , Christian BT , Okonkwo OC , La Rue A , Hermann BP , Koscik RL , Jonaitis EM , Sager MA , Asthana S ((2015) ) Association of insulin resistance with cerebral glucose uptake in late middle-aged adults at risk for Alzheimer disease. JAMA Neurol 72: , 1013–1020. |
[87] | Willette AA , Johnson SC , Birdsill AC , Sager MA , Christian B , Baker LD , Craft S , Oh J , Statz E , Hermann BP , Jonaitis EM , Koscik RL , La Rue A , Asthana S , Bendlin BB ((2015) ) Insulin resistance predicts brain amyloid deposition in late middle-aged adults.-. Alzheimers Dement 11: , 504–510 e501. |
[88] | Bloom GS , Lazo JS , Norambuena A ((2018) ) Reduced brain insulin signaling: A seminal process in Alzheimer’s disease pathogenesis. Neuropharmacology 136: , 192–195. |
[89] | Nguyen TT , Ta QTH , Nguyen TTD , Le TT , Vo VG ((2020) ) Role of insulin resistance in the Alzheimer’s disease progression. Neurochem Res 45: , 1481–1491. |
[90] | Shieh JC , Huang PT , Lin YF ((2020) ) Alzheimer’s disease and diabetes: Insulin signaling as the bridge linking two pathologies. Mol Neurobiol 57: , 1966–1977. |
[91] | Sedzikowska A , Szablewski L ((2021) ) Insulin and insulin resistance in Alzheimer’s disease. Int J Mol Sci 22: , 9987. |
[92] | Wei Z , Koya J , Reznik SE ((2021) ) Insulin resistance exacerbates Alzheimer disease via multiple mechanisms. Front Neurosci 15: , 687157. |
[93] | Ezkurdia A , Ramirez MJ , Solas M ((2023) ) Metabolic syndrome as a risk factor for Alzheimer’s disease: A focus on insulin resistance. Int J Mol Sci 24: , 4354. |
[94] | Huang WJ , Zhang X , Chen WW ((2016) ) Role of oxidative stress in Alzheimer’s disease. Biomed Rep 4: , 519–522. |
[95] | Greenough MA , Camakaris J , Bush AI ((2013) ) Metal dyshomeostasis and oxidative stress in Alzheimer’s disease. Neurochem Int 62: , 540–555. |
[96] | Lovell MA , Robertson JD , Teesdale WJ , Campbell JL , Markesbery WR ((1998) ) Copper, iron and zinc in Alzheimer’s disease senile plaques. J Neurol Sci 158: , 47–52. |
[97] | Brewer GJ ((2015) ) Copper-2 ingestion, plus increased meat eating leading to increased copper absorption, are major factors behind the current epidemic of Alzheimer’s disease. Nutrients 7: , 10053–10064. |
[98] | Agarwal S , McCullough KR , Fulgoni VL , 3rd ((2023) ) Nutritional effects of removing a serving of meat or poultry from healthy dietary patterns-a dietary modeling study. Nutrients 15: , 1717. |
[99] | Piskin E , Cianciosi D , Gulec S , Tomas M , Capanoglu E ((2022) ) Iron absorption: Factors, limitations, and improvement methods. ACS Omega 7: , 20441–20456. |
[100] | Thapa A , Carroll NJ ((2017) ) Dietary modulation of oxidative stress in Alzheimer’s disease. Int J Mol Sci 18: , 1583. |
[101] | Misrani A , Tabassum S , Yang L ((2021) ) Mitochondrial dysfunction and oxidative stress in Alzheimer’s disease. Front Aging Neurosci 13: , 617588. |
[102] | Browne D , McGuinness B , Woodside JV , McKay GJ ((2019) ) Vitamin E and Alzheimer’s disease: What do we know so far? Clin Interv Aging 14: , 1303–1317. |
[103] | King JC , Blumberg J , Ingwersen L , Jenab M , Tucker KL ((2008) ) Tree nuts and peanuts as components of a healthy diet. J Nutr 138: , 1736S–1740S |
[104] | Tonnies E , Trushina E ((2017) ) Oxidative stress, synaptic dysfunction, and Alzheimer’s disease. J Alzheimers Dis 57: , 1105–1121. |
[105] | Cheignon C , Tomas M , Bonnefont-Rousselot D , Faller P , Hureau C , Collin F ((2018) ) Oxidative stress and the amyloid beta peptide in Alzheimer’s disease. Redox Biol 14: , 450–464. |
[106] | Bai R , Guo J , Ye XY , Xie Y , Xie T ((2022) ) Oxidative stress: The core pathogenesis and mechanism of Alzheimer’s disease. Ageing Res Rev 77: , 101619. |
[107] | Fregoso Aguilar TA , Hernández Navarro BC , Mendoza Pérez JA (2016) Endogenous antioxidants: A review of their role in oxidative stress. In A Master Regulator of Oxidative Stress - The Transcription Factor Nrf2, BoD–Books on Demand, Norderstedt, Germany, pp. 3-20. |
[108] | Fan YG , Pang ZQ , Wu TY , Zhang YH , Xuan WQ , Wang Z , Yu X , Li YC , Guo C , Wang ZY ((2020) ) Vitamin D deficiency exacerbates Alzheimer-like pathologies by reducing antioxidant capacity. Free Radic Biol Med 161: , 139–149. |
[109] | Mehrabadi S , Sadr SS ((2020) ) Administration of Vitamin D(3) and E supplements reduces neuronal loss and oxidative stress in a model of rats with Alzheimer’s disease. Neurol Res 42: , 862–868. |
[110] | Chooi YC , Ding C , Magkos F ((2019) ) The epidemiology of obesity. Metabolism 92: , 6–10. |
[111] | Santos AL , Sinha S ((2021) ) Obesity and aging: Molecular mechanisms and therapeutic approaches. Ageing Res Rev 67: , 101268. |
[112] | Falcao-Pires I , Castro-Chaves P , Miranda-Silva D , Lourenco AP , Leite-Moreira AF ((2012) ) Physiological, pathological and potential therapeutic roles of adipokines. Drug Discov Today 17: , 880–889. |
[113] | Wang L , Sun P , Wu Y , Wang L ((2021) ) Metabolic tissue-resident CD8(+) T cells: A key player in obesity-related diseases. Obes Rev 22: , e13133. |
[114] | Fernandez-Sanchez A , Madrigal-Santillan E , Bautista M , Esquivel-Soto J , Morales-Gonzalez A , Esquivel-Chirino C , Durante-Montiel I , Sanchez-Rivera G , Valadez-Vega C , Morales-Gonzalez JA ((2011) ) Inflammation, oxidative stress, and obesity. Int J Mol Sci 12: , 3117–3132. |
[115] | Manna P , Jain SK ((2015) ) Obesity, oxidative stress, adipose tissue dysfunction, and the associated health risks: Causes and therapeutic strategies. Metab Syndr Relat Disord 13: , 423–444. |
[116] | Hurrle S , Hsu WH ((2017) ) The etiology of oxidative stress in insulin resistance. Biomed J 40: , 257–262. |
[117] | Roh HT , Cho SY , So WY ((2017) ) Obesity promotes oxidative stress and exacerbates blood-brain barrier disruption after high-intensity exercise. J Sport Health Sci 6: , 225–230. |
[118] | Adult Obesity Prevalence Maps, Centers for Disease Control and Prevention. National Center for Chronic Disease Prevention and Health Promotion, Division of Nutrition, Physical Activity, and Obesity, https://www.cdc.gov/obesity/data/maps/2021/obesity-prevalence-map-brace-ethnicity-2011-2020-508.pptx, Accessed July 26, 2023. |
[119] | Dhana K , Beck T , Desai P , Wilson RS , Evans DA , Rajan KB ((2023) ) Prevalence of Alzheimer’s disease dementia in the 50 US states and 3142 counties: A population estimate using the 2020 bridged-race postcensal from the National Center for Health Statistics. Alzheimers Dement 19: , 4388–4395. |
[120] | Matthews KA , Xu W , Gaglioti AH , Holt JB , Croft JB , Mack D , McGuire LC ((2019) ) Racial and ethnic estimates of Alzheimer’s disease and related dementias in the United States (2015-2060) in adults aged> /=65 years. Alzheimers Dement 15: , 17–24. |
[121] | Alzheimer’s Disease Facts and Figures, Alzheimer’ Association, https://www.alz.org/media/Documents/alz vheimers-facts-and-figures.pdf, Accessed April 11, 2023. |
[122] | Share of Adults in the U.S. Who Are Obese, 1975-2016, Our World in Data, https://ourworldindata.org/grapher/share-of-adults-defined-as-obese?tab=chart&country=¡«USA, Accessed April 11, 2023. |
[123] | Perez LM , Pareja-Galeano H , Sanchis-Gomar F , Emanuele E , Lucia A , Galvez BG ((2016) ) ‘Adipaging’: Ageing and obesity share biological hallmarks related to a dysfunctional adipose tissue. J Physiol 594: , 3187–3207. |
[124] | Jones NS , Rebeck GW ((2018) ) The synergistic effects of APOE genotype and obesity on Alzheimer’s disease risk. Int J Mol Sci 20: , 63. |
[125] | Forny-Germano L , De Felice FG , Vieira M ((2018) ) The role of leptin and adiponectin in obesity-associated cognitive decline and Alzheimer’s disease. Front Neurosci 12: , 1027. |
[126] | Roizen JD , Long C , Casella A , O’Lear L , Caplan I , Lai M , Sasson I , Singh R , Makowski AJ , Simmons R , Levine MA ((2019) ) Obesity decreases hepatic 25-hydroxylase activity causing low serum 25-hydroxyvitamin D. J Bone Miner Res 34: , 1068–1073. |
[127] | Kopp W ((2019) ) How Western diet and lifestyle drive the pandemic of obesity and civilization diseases. Diabetes Metab Syndr Obes 12: , 2221–2236. |
[128] | Saiyasit N , Chunchai T , Prus D , Suparan K , Pittayapong P , Apaijai N , Pratchayasakul W , Sripetchwandee J , Chattipakorn MDPDN , Chattipakorn SC ((2020) ) Gut dysbiosis develops before metabolic disturbance and cognitive decline in high-fat diet-induced obese condition. Nutrition 69: , 110576. |
[129] | Picone P , Di Carlo M , Nuzzo D ((2020) ) Obesity and Alzheimer’s disease: Molecular bases. Eur J Neurosci 52: , 3944–3950. |
[130] | Kim JY , Barua S , Jeong YJ , Lee JE ((2020) ) Adiponectin: The potential regulator and therapeutic target of obesity and Alzheimer’s disease. Int J Mol Sci 21: , 6419. |
[131] | Ebrahimpour S , Zakeri M , Esmaeili A ((2020) ) Crosstalk between obesity, diabetes, and alzheimer’s disease: Introducing quercetin as an effective triple herbal medicine. Ageing Res Rev 62: , 101095. |
[132] | Terzo S , Amato A , Mule F ((2021) ) From obesity to Alzheimer’s disease through insulin resistance. J Diabetes Complications 35: , 108026. |
[133] | Finkelstein JD , Martin JJ ((1986) ) Methionine metabolism in mammals. Adaptation to methionine excess. J Biol Chem 261: , 1582–1587. |
[134] | Castro R , Rivera I , Blom HJ , Jakobs C , Tavares de Almeida I ((2006) ) Homocysteine metabolism, hyperhomocysteinaemia and vascular disease: An overview. J Inherit Metab Dis 29: , 3–20. |
[135] | Nutrient Ranking Tool, My Food Data, https://tools.myfooddata.com/nutrient-ranking-tool/Methionine/Meats/Highest/Household/Common/No, Accessed 26 July 2023. |
[136] | Pi T , Liu B , Shi J ((2020) ) Abnormal homocysteine metabolism: An insight of Alzheimer’s disease from DNA methylation. Behav Neurol 2020: , 8438602. |
[137] | Wang Q , Zhao J , Chang H , Liu X , Zhu R ((2021) ) Homocysteine and folic acid: Risk factors for Alzheimer’s disease-an updated meta-analysis. Front Aging Neurosci 13: , 665114. |
[138] | Tawfik A , Elsherbiny NM , Zaidi Y , Rajpurohit P ((2021) ) Homocysteine and age-related central nervous system diseases: Role of inflammation. Int J Mol Sci 22: , 6259. |
[139] | Luzzi S , Cherubini V , Falsetti L , Viticchi G , Silvestrini M , Toraldo A ((2022) ) Homocysteine, cognitive functions, and degenerative dementias: State of the art. Biomedicines 10: , 2741. |
[140] | Christie LA , Riedel G , Algaidi SA , Whalley LJ , Platt B ((2005) ) Enhanced hippocampal long-term potentiation in rats after chronic exposure to homocysteine. Neurosci Lett 373: , 119–124. |
[141] | Zieminska E , Stafiej A , Lazarewicz JW ((2003) ) Role of group I metabotropic glutamate receptors and NMDA receptors in homocysteine-evoked acute neurodegeneration of cultured cerebellar granule neurones. Neurochem Int 43: , 481–492. |
[142] | Irizarry MC , Gurol ME , Raju S , Diaz-Arrastia R , Locascio JJ , Tennis M , Hyman BT , Growdon JH , Greenberg SM , Bottiglieri T ((2005) ) Association of homocysteine with plasma amyloid beta protein in aging and neurodegenerative disease. Neurology 65: , 1402–1408. |
[143] | Di Meco A , Li JG , Barrero C , Merali S , Pratico D ((2019) ) Elevated levels of brain homocysteine directly modulate the pathological phenotype of a mouse model of tauopathy. Mol Psychiatry 24: , 1696–1706. |
[144] | Lauriola M , D’Onofrio G , Ciccone F , Germano C , Cascavilla L , Paris F , Greco A ((2021) ) Relationship of homocysteine plasma levels with mild cognitive impairment, Alzheimer’s disease, vascular dementia, psychobehavioral, and functional complications. J Alzheimers Dis 82: , 235–248. |
[145] | Farina N , Jerneren F , Turner C , Hart K , Tabet N ((2017) ) Homocysteine concentrations in the cognitive progression of Alzheimer’s disease. Exp Gerontol 99: , 146–150. |
[146] | Ravaglia G , Forti P , Maioli F , Martelli M , Servadei L , Brunetti N , Porcellini E , Licastro F ((2005) ) Homocysteine and folate as risk factors for dementia and Alzheimer disease. Am J Clin Nutr 82: , 636–643. |
[147] | Beydoun MA , Beydoun HA , Gamaldo AA , Teel A , Zonderman AB , Wang Y ((2014) ) Epidemiologic studies of modifiable factors associated with cognition and dementia: Systematic review and meta-analysis. BMC Public Health 14: , 643. |
[148] | Zuin M , Cervellati C , Brombo G , Trentini A , Roncon L , Zuliani G ((2021) ) Elevated blood homocysteine and risk of Alzheimer’s dementia: An updated systematic review and meta-analysis based on prospective studies. J Prev Alzheimers Dis 8: , 329–334. |
[149] | Sade Yazdi D , Laor Bar-Yosef D , Adsi H , Kreiser T , Sigal S , Bera S , Zaguri D , Shaham-Niv S , Oluwatoba DS , Levy D , Gartner M , Do TD , Frenkel D , Gazit E ((2021) ) Homocysteine fibrillar assemblies display cross-talk with Alzheimer’s disease beta-amyloid polypeptide. Proc Natl Acad Sci U S A 118: , e2017575118. |
[150] | Fuso A , Seminara L , Cavallaro RA , D’Anselmi F , Scarpa S ((2005) ) S-adenosylmethionine/homocysteine cycle alterations modify DNA methylation status with consequent deregulation of PS1 and BACE and beta-amyloid production. Mol Cell Neurosci 28: , 195–204. |
[151] | Rehman T , Shabbir MA , Inam-Ur-Raheem M , Manzoor MF , Ahmad N , Liu ZW , Ahmad MH , Siddeeg A , Abid M , Aadil RM ((2020) ) Cysteine and homocysteine as biomarker of various diseases. Food Sci Nutr 8: , 4696–4707. |
[152] | Khalid M , Petroianu G , Adem A ((2022) ) Advanced glycation end products and diabetes mellitus: Mechanisms and perspectives. Biomolecules 12: , 542. |
[153] | Twarda-Clapa A , Olczak A , Bialkowska AM , Koziolkiewicz M ((2022) ) Advanced glycation end-products (AGEs): Formation, chemistry, classification, receptors, and diseases related to AGEs. Cells 11: , 1312. |
[154] | Goldberg T , Cai W , Peppa M , Dardaine V , Baliga BS , Uribarri J , Vlassara H ((2004) ) Advanced glycoxidation end products in commonly consumed foods. J Am Diet Assoc 104: , 1287–1291. |
[155] | Starowicz M , Zielinski H ((2019) ) Inhibition of advanced glycation end-product formation by high antioxidant-leveled spices commonly used in European cuisine. Antioxidants (Basel) 8: , 100. |
[156] | Koschinsky T , He CJ , Mitsuhashi T , Bucala R , Liu C , Buenting C , Heitmann K , Vlassara H ((1997) ) Orally absorbed reactive glycation products (glycotoxins): An environmental risk factor in diabetic nephropathy. Proc Natl Acad Sci U S A 94: , 6474–6479. |
[157] | Vlassara H , Cai W , Crandall J , Goldberg T , Oberstein R , Dardaine V , Peppa M , Rayfield EJ ((2002) ) Inflammatory mediators are induced by dietary glycotoxins, a major risk factor for diabetic angiopathy. Proc Natl Acad Sci U S A 99: , 15596–15601. |
[158] | Mastrocola R , Collotta D , Gaudioso G , Le Berre M , Cento AS , Ferreira Alves G , Chiazza F , Verta R , Bertocchi I , Manig F , Hellwig M , Fava F , Cifani C , Aragno M , Henle T , Joshi L , Tuohy K , Collino M ((2020) ) Effects of exogenous dietary advanced glycation end products on the cross-talk mechanisms linking microbiota to metabolic inflammation. Nutrients 12: , 2497. |
[159] | Garay-Sevilla ME , Rojas A , Portero-Otin M , Uribarri J ((2021) ) Dietary AGEs as exogenous boosters of inflammation. Nutrients 13: , 2802. |
[160] | Sergi D , Boulestin H , Campbell FM , Williams LM ((2021) ) The role of dietary advanced glycation end products in metabolic dysfunction. Mol Nutr Food Res 65: , e1900934. |
[161] | DeChristopher LR ((2017) ) Perspective: The paradox in dietary advanced glycation end products research-the source of the serum and urinary advanced glycation end products is the intestines, not the food. Adv Nutr 8: , 679–683. |
[162] | Martinez-Saez N , Fernandez-Gomez B , Cai W , Uribarri J , Del Castillo MD ((2019) ) In vitro formation of Maillard reaction products during simulated digestion of meal-resembling systems. Food Res Int 118: , 72–80. |
[163] | Srikanth V , Maczurek A , Phan T , Steele M , Westcott B , Juskiw D , Munch G ((2011) ) Advanced glycation endproducts and their receptor RAGE in Alzheimer’s disease. Neurobiol Aging 32: , 763–777. |
[164] | Sbai O , Djelloul M , Auletta A , Ieraci A , Vascotto C , Perrone L ((2022) ) Correction to: RAGE-TXNIP axis drives inflammation in Alzheimer’s by targeting Abeta to mitochondria in microglia. Cell Death Dis 13: , 368. |
[165] | Zhou R , Tardivel A , Thorens B , Choi I , Tschopp J ((2010) ) Thioredoxin-interacting protein links oxidative stress to inflammasome activation. Nat Immunol 11: , 136–140. |
[166] | Perrone L , Valente M ((2021) ) The emerging role of metabolism in brain-heart axis: New challenge for the therapy and prevention of Alzheimer disease. May thioredoxin interacting protein (TXNIP) play a role? Biomolecules 11: , 1652. |
[167] | Salahuddin P , Rabbani G , Khan RH ((2014) ) The role of advanced glycation end products in various types of neurodegenerative disease: A therapeutic approach. Cell Mol Biol Lett 19: , 407–437. |
[168] | Khangholi S , Majid FA , Berwary NJ , Ahmad F , Aziz RB ((2016) ) The mechanisms of inhibition of advanced glycation end products formation through polyphenols in hyperglycemic condition. Planta Med 82: , 32–45. |
[169] | Aragno M , Mastrocola R ((2017) ) Dietary sugars and endogenous formation of advanced glycation endproducts: Emerging mechanisms of disease. Nutrients 9: , 385. |
[170] | Batkulwar K , Godbole R , Banarjee R , Kassaar O , Williams RJ , Kulkarni MJ ((2018) ) Advanced glycation end products modulate amyloidogenic APP processing and tau phosphorylation: A mechanistic link between glycation and the development of Alzheimer’s disease. ACS Chem Neurosci 9: , 988–1000. |
[171] | Rowan S , Bejarano E , Taylor A ((2018) ) Mechanistic targeting of advanced glycation end-products in age-related diseases. Biochim Biophys Acta Mol Basis Dis 1864: , 3631–3643. |
[172] | Derk J , MacLean M , Juranek J , Schmidt AM ((2018) ) The receptor for advanced glycation endproducts (RAGE) and mediation of inflammatory neurodegeneration. J Alzheimers Dis Parkinsonism 8: , 421. |
[173] | Teissier T , Boulanger E ((2019) ) The receptor for advanced glycation end-products (RAGE) is an important pattern recognition receptor (PRR) for inflammaging. Biogerontology 20: , 279–301. |
[174] | Kong Y , Liu C , Zhou Y , Qi J , Zhang C , Sun B , Wang J , Guan Y ((2020) ) Progress of RAGE molecular imaging in Alzheimer’s disease. Front Aging Neurosci 12: , 227. |
[175] | Portero-Otin M , Pia de la Maza M , Uribarri J ((2023) ) Dietary advanced glycation end products: Their role in the insulin resistance of aging. Cells 12: , 1684. |
[176] | Leibson CL , Rocca WA , Hanson VA , Cha R , Kokmen E , O’Brien PC , Palumbo PJ ((1997) ) Risk of dementia among persons with diabetes mellitus: A population-based cohort study. Am J Epidemiol 145: , 301–308. |
[177] | Munch G , Schinzel R , Loske C , Wong A , Durany N , Li JJ , Vlassara H , Smith MA , Perry G , Riederer P ((1998) ) Alzheimer’s disease–synergistic effects of glucose deficit, oxidative stress and advanced glycation endproducts. J Neural Transm (Vienna) 105: , 439–461. |
[178] | Ott A , Stolk RP , van Harskamp F , Pols HA , Hofman A , Breteler MM ((1999) ) Diabetes mellitus and the risk of dementia: The Rotterdam Study. Neurology 53: , 1937–1942. |
[179] | Norton S , Matthews FE , Barnes DE , Yaffe K , Brayne C ((2014) ) Potential for primary prevention of Alzheimer’s disease: An analysis of population-based data. Lancet Neurol 13: , 788–794. |
[180] | Steen E , Terry BM , Rivera EJ , Cannon JL , Neely TR , Tavares R , Xu XJ , Wands JR , de la Monte SM ((2005) ) Impaired insulin and insulin-like growth factor expression and signaling mechanisms in Alzheimer’s disease–is this type 3 diabetes? J Alzheimers Dis 7: , 63–80. |
[181] | Kroner Z ((2009) ) The relationship between Alzheimer’s disease and diabetes: Type 3 diabetes? Altern Med Rev 14: , 373–379. |
[182] | Kandimalla R , Thirumala V , Reddy PH ((2017) ) Is Alzheimer’s disease a type 3 diabetes? A critical appraisal. Biochim Biophys Acta Mol Basis Dis 1863: , 1078–1089. |
[183] | Li B , Leung JCK , Chan LYY , Yiu WH , Tang SCW ((2020) ) A global perspective on the crosstalk between saturated fatty acids and Toll-like receptor 4 in the etiology of inflammation and insulin resistance. Prog Lipid Res 77: , 101020. |
[184] | Harte AL , Varma MC , Tripathi G , McGee KC , Al-Daghri NM , Al-Attas OS , Sabico S , O’Hare JP , Ceriello A , Saravanan P , Kumar S , McTernan PG ((2012) ) High fat intake leads to acute postprandial exposure to circulating endotoxin in type 2 diabetic subjects. Diabetes Care 35: , 375–382. |
[185] | Bailey MA , Holscher HD ((2018) ) Microbiome-mediated effects of the Mediterranean diet on inflammation. Adv Nutr 9: , 193–206. |
[186] | Ghoshal S , Witta J , Zhong J , de Villiers W , Eckhardt E ((2009) ) Chylomicrons promote intestinal absorption of lipopolysaccharides. J Lipid Res 50: , 90–97. |
[187] | Lacroix S , Feinstein D , Rivest S ((1998) ) The bacterial endotoxin lipopolysaccharide has the ability to target the brain in upregulating its membrane CD14 receptor within specific cellular populations. Brain Pathol 8: , 625–640. |
[188] | Rapoport SI , Carson RE , Bhattacharjee A , Schapiro MB , Herscovitch P , Eckelman W , Esposito G ((2005) ) Imaging neuroinflammation in Alzheimer disease with [1–11C] arachidonic acid and positron emission tomography. Alzheimers Dement 1: , S41. |
[189] | Maccarrone M , Melino G , Finazzi-Agro A ((2001) ) Lipoxygenases and their involvement in programmed cell death. Cell Death Differ 8: , 776–784. |
[190] | Parise LV , Venton DL , Le Breton GC ((1984) ) Arachidonic acid-induced platelet aggregation is mediated by a thromboxane A2/prostaglandin H2 receptor interaction. J Pharmacol Exp Ther 228: , 240–244. |
[191] | Constantino-Jonapa LA , Espinoza-Palacios Y , Escalona-Montano AR , Hernandez-Ruiz P , Amezcua-Guerra LM , Amedei A , Aguirre-Garcia MM ((2023) ) Contribution of trimethylamine N-oxide (TMAO) to chronic inflammatory and degenerative diseases. Biomedicines 11: , 431. |
[192] | Zeisel SH , Mar MH , Howe JC , Holden JM ((2003) ) Concentrations of choline-containing compounds and betaine in common foods. J Nutr 133: , 1302–1307. |
[193] | Kepka A , Ochocinska A , Borzym-Kluczyk M , Skorupa E , Stasiewicz-Jarocka B , Chojnowska S , Waszkiewicz N ((2020) ) Preventive role of L-carnitine and balanced diet in Alzheimer’s disease. Nutrients 12: , 1987. |
[194] | Yang JJ , Shu XO , Herrington DM , Moore SC , Meyer KA , Ose J , Menni C , Palmer ND , Eliassen H , Harada S , Tzoulaki I , Zhu H , Albanes D , Wang TJ , Zheng W , Cai H , Ulrich CM , Guasch-Ferre M , Karaman I , Fornage M , Cai Q , Matthews CE , Wagenknecht LE , Elliott P , Gerszten RE , Yu D ((2021) ) Circulating trimethylamine N-oxide in association with diet and cardiometabolic biomarkers: An international pooled analysis. Am J Clin Nutr 113: , 1145–1156. |
[195] | Vogt NM , Romano KA , Darst BF , Engelman CD , Johnson SC , Carlsson CM , Asthana S , Blennow K , Zetterberg H , Bendlin BB , Rey FE ((2018) ) The gut microbiota-derived metabolite trimethylamine N-oxide is elevated in Alzheimer’s disease. Alzheimers Res Ther 10: , 124. |
[196] | Arrona Cardoza P , Spillane MB , Morales Marroquin E ((2022) ) Alzheimer’s disease and gut microbiota: Does trimethylamine N-oxide (TMAO) play a role? Nutr Rev 80: , 271–281. |
[197] | Liu Y , Dai M ((2020) ) Trimethylamine N-oxide generated by the gut microbiota is associated with vascular inflammation: New insights into atherosclerosis. Mediators Inflamm 2020: , 4634172. |
[198] | Zhu Y , Li Q , Jiang H ((2020) ) Gut microbiota in atherosclerosis: Focus on trimethylamine N-oxide. APMIS 128: , 353–366. |
[199] | Shabir O , Berwick J , Francis SE ((2018) ) Neurovascular dysfunction in vascular dementia, Alzheimer’s and atherosclerosis. BMC Neurosci 19: , 62. |
[200] | Gustavsson AM , van Westen D , Stomrud E , Engstrom G , Nagga K , Hansson O ((2020) ) Midlife atherosclerosis and development of Alzheimer or vascular dementia. Ann Neurol 87: , 52–62. |
[201] | Xie B , Shi X , Xing Y , Tang Y ((2020) ) Association between atherosclerosis and Alzheimer’s disease: A systematic review and meta-analysis. Brain Behav 10: , e01601. |
[202] | Solomon A , Kivipelto M , Wolozin B , Zhou J , Whitmer RA ((2009) ) Midlife serum cholesterol and increased risk of Alzheimer’s and vascular dementia three decades later. Dement Geriatr Cogn Disord 28: , 75–80. |
[203] | Buawangpong N , Pinyopornpanish K , Siri-Angkul N , Chattipakorn N , Chattipakorn SC ((2022) ) The role of trimethylamine-N-Oxide in the development of Alzheimer’s disease. J Cell Physiol, 237: , 1661–1685. |
[204] | Peña-Jorquera H , Cid-Jofré V , Landaeta-Díaz L , Petermann-Rocha F , Martorell M , Zbinden-Foncea H , Ferrari G , Jorquera-Aguilera C , Cristi-Montero C ((2023) ) Plant-based nutrition: Exploring health benefits for atherosclerosis, chronic diseases, and metabolic syndrome-a comprehensive review. Nutrients 15: , 3244. |
[205] | Wang Y , Beydoun MA ((2009) ) Meat consumption is associated with obesity and central obesity among US adults. Int J Obes (Lond) 33: , 621–628. |
[206] | Rouhani MH , Salehi-Abargouei A , Surkan PJ , Azadbakht L ((2014) ) Is there a relationship between red or processed meat intake and obesity? A systematic review and meta-analysis of observational studies. Obes Rev 15: , 740–748. |
[207] | You W , Henneberg M ((2016) ) Meat consumption providing a surplus energy in modern diet contributes to obesity prevalence: An ecological analysis. BMC Nutr 2: , 22. |
[208] | Willett W , Rockstrom J , Loken B , Springmann M , Lang T , Vermeulen S , Garnett T , Tilman D , DeClerck F , Wood A , Jonell M , Clark M , Gordon LJ , Fanzo J , Hawkes C , Zurayk R , Rivera JA , De Vries W , Majele Sibanda L , Afshin A , Chaudhary A , Herrero M , Agustina R , Branca F , Lartey A , Fan S , Crona B , Fox E , Bignet V , Troell M , Lindahl T , Singh S , Cornell SE , Srinath Reddy K , Narain S , Nishtar S , Murray CJL ((2019) ) Food in the Anthropocene: The EAT-Lancet Commission on healthy diets from sustainable food systems. Lancet 393: , 447–492. |
[209] | O’Hearn M , Lara-Castor L , Cudhea F , Miller V , Reedy J , Shi P , Zhang J , Wong JB , Economos CD , Micha R , Mozaffarian D , Global Dietary Database ((2023) ) Incident type 2 diabetes attributable to suboptimal diet in 184 countries. Nat Med 29: , 982–995. |
[210] | Zelber-Sagi S , Ivancovsky-Wajcman D , Fliss Isakov N , Webb M , Orenstein D , Shibolet O , Kariv R ((2018) ) High red and processed meat consumption is associated with non-alcoholic fatty liver disease and insulin resistance. J Hepatol 68: , 1239–1246. |
[211] | Estrada LD , Ahumada P , Cabrera D , Arab JP ((2019) ) Liver dysfunction as a novel player in Alzheimer’s progression: Looking outside the brain. Front Aging Neurosci 11: , 174. |
[212] | Papier K , Hartman L , Tong TYN , Key TJ , Knuppel A ((2022) ) Higher meat intake is associated with higher inflammatory markers, mostly due to adiposity: Results from UK Biobank. J Nutr 152: , 183–189. |
[213] | Kotlega D , Peda B , Palma J , Zembron-Lacny A , Golab-Janowska M , Masztalewicz M , Nowacki P , Szczuko M ((2021) ) Free fatty acids are associated with the cognitive functions in stroke survivors. Int J Environ Res Public Health 18: , 6500. |
[214] | Willits-Smith A , Odinga H , O’Malley K , Rose D ((2023) ) Demographic and socioeconomic correlates of disproportionate beef consumption among US adults in an age of global warming. Nutrients 15: , 3795. |
[215] | Beslay M , Srour B , Mejean C , Alles B , Fiolet T , Debras C , Chazelas E , Deschasaux M , Wendeu-Foyet MG , Hercberg S , Galan P , Monteiro CA , Deschamps V , Calixto Andrade G , Kesse-Guyot E , Julia C , Touvier M ((2020) ) Ultra-processed food intake in association with BMI change and risk of overweight and obesity: A prospective analysis of the French NutriNet-Sante cohort. PLoS Med 17: , e1003256. |
[216] | Askari M , Heshmati J , Shahinfar H , Tripathi N , Daneshzad E ((2020) ) Ultra-processed food and the risk of overweight and obesity: A systematic review and meta-analysis of observational studies. Int J Obes (Lond) 44: , 2080–2091. |
[217] | Steele EM , O’Connor LE , Juul F , Khandpur N , Galastri Baraldi L , Monteiro CA , Parekh N , Herrick KA ((2023) ) Identifying and estimating ultraprocessed food intake in the US NHANES according to the Nova Classification System of Food Processing. J Nutr 153: , 225–241. |
[218] | Popkin BM , Adair LS , Ng SW ((2012) ) Global nutrition transition and the pandemic of obesity in developing countries. Nutr Rev 70: , 3–21. |
[219] | Monteiro CA , Moubarac JC , Levy RB , Canella DS , Louzada M , Cannon G ((2018) ) Household availability of ultra-processed foods and obesity in nineteen European countries. Public Health Nutr 21: , 18–26. |
[220] | Asensi MT , Napoletano A , Sofi F , Dinu M ((2023) ) Low-grade inflammation and ultra-processed foods consumption: A review. Nutrients 15: , 1546. |
[221] | Li H , Li S , Yang H , Zhang Y , Zhang S , Ma Y , Hou Y , Zhang X , Niu K , Borne Y , Wang Y ((2022) ) Association of ultraprocessed food consumption with risk of dementia: A prospective cohort study. Neurology 99: , e1056–e1066. |
[222] | Wang K , Tang W , Hao X , Zhao J ((2023) ) Ultra processed food consumption and risk of dementia and Alzheimer’ls disease: Long-term results from the Framingham Offspring Study. Alzheimers Dement, doi: 10.1002/alz.13351. |
[223] | Dinu M , Tristan Asensi M , Pagliai G , Lotti S , Martini D , Colombini B , Sofi F ((2022) ) Consumption of ultra-processed foods is inversely associated with adherence to the Mediterranean diet: A cross-sectional study. Nutrients 14: , 2073. |
[224] | Sofi F , Macchi C , Abbate R , Gensini GF , Casini A ((2014) ) Mediterranean diet and health status: An updated meta-analysis and a proposal for a literature-based adherence score. Public Health Nutr 17: , 2769–2782. |
[225] | Grinan-Ferre C , Bellver-Sanchis A , Izquierdo V , Corpas R , Roig-Soriano J , Chillon M , Andres-Lacueva C , Somogyvari M , Soti C , Sanfeliu C , Pallas M ((2021) ) The pleiotropic neuroprotective effects of resveratrol in cognitive decline and Alzheimer’s disease pathology: From antioxidant to epigenetic therapy. Ageing Res Rev 67: , 101271. |
[226] | Ding Q , Xu YM , Lau ATY ((2023) ) The epigenetic effects of coffee. Molecules 28: , 1770. |
[227] | Chang W , Huang D , Lo YM , Tee Q , Kuo P , Wu JS , Huang W , Shen S ((2019) ) Protective effect of caffeic acid against Alzheimer’s disease pathogenesis via modulating cerebral insulin signaling, beta-amyloid accumulation, and synaptic plasticity in hyperinsulinemic rats. J Agric Food Chem 67: , 7684–7693. |
[228] | Morris MC , Evans DA , Bienias JL , Tangney CC , Bennett DA , Wilson RS , Aggarwal N , Schneider J ((2003) ) Consumption of fish and n-3 fatty acids and risk of incident Alzheimer disease. Arch Neurol 60: , 940–946. |
[229] | Lu Z , Chen TC , Zhang A , Persons KS , Kohn N , Berkowitz R , Martinello S , Holick MF ((2007) ) An evaluation of the vitamin D3 content in fish: Is the vitamin D content adequate to satisfy the dietary requirement for vitamin D? J Steroid Biochem Mol Biol 103: , 642–644. |
[230] | Fantini C , Corinaldesi C , Lenzi A , Migliaccio S , Crescioli C ((2023) ) Vitamin D as a shield against aging. Int J Mol Sci 24: , 4546. |
[231] | Gezen-Ak D , Dursun E ((2023) ) Vitamin D, a secosteroid hormone and its multifunctional receptor, vitaminDreceptor, in Alzheimer’s type neurodegeneration. J Alzheimers Dis 95: , 1273–1299. |
[232] | Grimmig B , Daly L , Subbarayan M , Hudson C , Williamson R , Nash K , Bickford PC ((2018) ) Astaxanthin is neuroprotective in an aged mouse model of Parkinson’s disease. Oncotarget 9: , 10388–10401. |
[233] | Grodzicki W , Dziendzikowska K ((2020) ) The role of selected bioactive compounds in the prevention of Alzheimer’s disease. Antioxidants (Basel) 9: , 229. |
[234] | Li D , Wang P , Luo Y , Zhao M , Chen F ((2017) ) Health benefits of anthocyanins and molecular mechanisms: Update from recent decade. Crit Rev Food Sci Nutr 57: , 1729–1741. |
[235] | Tedeschi P , Nigro M , Travagli A , Catani M , Cavazzini A , Merighi S , Gessi S ((2022) ) Therapeutic potential of allicin and aged garlic extract in Alzheimer’s disease. Int J Mol Sci 23: , 6950. |
[236] | Moreno-Valdespino CA , Luna-Vital D , Camacho-Ruiz RM , Mojica L ((2020) ) Bioactive proteins and phytochemicals from legumes: Mechanisms of action preventing obesity and type-2 diabetes. Food Res Int 130: , 108905. |
[237] | Hatzis CM , Bertsias GK , Linardakis M , Scott JM , Kafatos AG ((2006) ) Dietary and other lifestyle correlates of serum folate concentrations in a healthy adult population in Crete, Greece: A cross-sectional study. Nutr J 5: , 5. |
[238] | Sul D , Kim HS , Lee D , Joo SS , Hwang KW , Park SY ((2009) ) Protective effect of caffeic acid against beta-amyloid-induced neurotoxicity by the inhibition of calcium influx and tau phosphorylation. Life Sci 84: , 257–262. |
[239] | Gorji N , Moeini R , Memariani Z ((2018) ) Almond, hazelnut and walnut, three nuts for neuroprotection in Alzheimer’s disease: A neuropharmacological review of their bioactive constituents. Pharmacol Res 129: , 115–127. |
[240] | Zhao X , Liu C , Xu M , Li X , Bi K , Jia Y ((2016) ) Total lignans of Schisandra chinensis ameliorates Abeta1-42-induced neurodegeneration with cognitive impairment in mice and primary mouse neuronal cells. PLoS One 11: , e0152772. |
[241] | Ansari MA , Abdul HM , Joshi G , Opii WO , Butterfield DA ((2009) ) Protective effect of quercetin in primary neurons against Abeta(1-42): Relevance to Alzheimer’s disease. J Nutr Biochem 20: , 269–275. |
[242] | Rodriguez-Morato J , Xicota L , Fito M , Farre M , Dierssen M , de la Torre R ((2015) ) Potential role of olive oil phenolic compounds in the prevention of neurodegenerative diseases. Molecules 20: , 4655–4680. |
[243] | Inyang D , Saumtally T , Nnadi CN , Devi S , So PW ((2023) ) A systematic review of the effects of capsaicin on Alzheimer’s disease. Int J Mol Sci 24: , 10176. |
[244] | Devi KP , Shanmuganathan B , Manayi A , Nabavi SF , Nabavi SM ((2017) ) Molecular and therapeutic targets of genistein in Alzheimer’s disease. Mol Neurobiol 54: , 7028–7041. |
[245] | Mirmosayyeb O , Tanhaei A , Sohrabi HR , Martins RN , Tanhaei M , Najafi MA , Safaei A , Meamar R ((2017) ) Possible role of common spices as a preventive and therapeutic agent for Alzheimer’s disease. Int J Prev Med 8: , 5. |
[246] | Reddy PH , Manczak M , Yin X , Grady MC , Mitchell A , Tonk S , Kuruva CS , Bhatti JS , Kandimalla R , Vijayan M , Kumar S , Wang R , Pradeepkiran JA , Ogunmokun G , Thamarai K , Quesada K , Boles A , Reddy AP ((2018) ) Protective effects of Indian spice curcumin against amyloid-beta in Alzheimer’s disease. J Alzheimers Dis 61: , 843–866. |
[247] | Burcul F , Generalic Mekinic I , Radan M , Rollin P , Blazevic I ((2018) ) Isothiocyanates: Cholinesterase inhibiting, antioxidant, and anti-inflammatory activity. J Enzyme Inhib Med Chem 33: , 577–582. |
[248] | Yuan C , Chen H , Wang Y , Schneider JA , Willett WC , Morris MC ((2021) ) Dietary carotenoids related to risk of incident Alzheimer dementia (AD) and brain AD neuropathology: A community-based cohort of older adults. Am J Clin Nutr 113: , 200–208. |
[249] | Morris MC , Wang Y , Barnes LL , Bennett DA , Dawson-Hughes B , Booth SL ((2018) ) Nutrients and bioactives in green leafy vegetables and cognitive decline: Prospective study. Neurology 90: , e214–e222. |
[250] | Calinoiu LF , Vodnar DC ((2018) ) Whole grains and phenolic acids: A review on bioactivity, functionality, health benefits and bioavailability. Nutrients 10: , 1615. |
[251] | Santiago JA , Potashkin JA ((2021) ) The impact of disease comorbidities in Alzheimer’s disease. Front Aging Neurosci 13: , 631770. |
[252] | Blake SM , Harding R , Blake CP , Borman PL ((2022) ) Reducing excess dietary saturated fat intake to improve cognition in vascular dementia. GSC Adv Res Rev 12: , 122–135. |
[253] | Bentley RA , Ormerod P , Ruck DJ ((2018) ) Recent origin and evolution of obesity-income correlation across the United States. Palgrave Commun 4: , 146. |


