
Postmortem Brain Imaging in Alzheimer’s Disease and Related Dementias: The South Texas Alzheimer’s Disease Research Center Repository
Abstract
Background:
Neuroimaging bears the promise of providing new biomarkers that could refine the diagnosis of dementia. Still, obtaining the pathology data required to validate the relationship between neuroimaging markers and neurological changes is challenging. Existing data repositories are focused on a single pathology, are too small, or do not precisely match neuroimaging and pathology findings.
Objective:
The new data repository introduced in this work, the South Texas Alzheimer’s Disease research center repository, was designed to address these limitations. Our repository covers a broad diversity of dementias, spans a wide age range, and was specifically designed to draw exact correspondences between neuroimaging and pathology data.
Methods:
Using four different MRI sequences, we are reaching a sample size that allows for validating multimodal neuroimaging biomarkers and studying comorbid conditions. Our imaging protocol was designed to capture markers of cerebrovascular disease and related lesions. Quantification of these lesions is currently underway with MRI-guided histopathological examination.
Results:
A total of 139 postmortem brains (70 females) with mean age of 77.9 years were collected, with 71 brains fully analyzed. Of these, only 3% showed evidence of AD-only pathology and 76% had high prevalence of multiple pathologies contributing to clinical diagnosis.
Conclusion:
This repository has a significant (and increasing) sample size consisting of a wide range of neurodegenerative disorders and employs advanced imaging protocols and MRI-guided histopathological analysis to help disentangle the effects of comorbid disorders to refine diagnosis, prognosis and better understand neurodegenerative disorders.
INTRODUCTION
A diagnosis of dementia is often difficult for patients and their families. They face complex decisions regarding patient autonomy, caregiver needs, and potential financial concerns [1]. Furthermore, it is essential to identify the underlying pathophysiology to guide patient management accurately. Unfortunately, early clinical diagnosis of dementia is challenging. Histopathology at autopsy has long been the gold standard for the diagnosis of Alzheimer’s disease (AD) [2–5], frontotemporal lobar degeneration (FTLD) [6], and Lewy body dementia (LBD) [7]. Still, these postmortem guidelines are challenging to translate into in-vivo biomarkers, which are critical for early and accurate dementia diagnosis.
Several reasons explain the challenges for accurate diagnoses of dementia. First, neurodegenerative processes often begin with an early phase marked by insidious progression or lack of symptoms [8] that may not alert patients and healthcare providers until a diagnosis of mild cognitive impairment (MCI) or even more advanced stage. A second issue is the prevalence of comorbid conditions [9]. Cerebrovascular diseases (CVD) are the most common concomitant pathologies alongside AD in patients with cognitive impairment, and the respective contributions of vascular dementia (VaD) and AD to cognitive impairment are challenging to disentangle [10–14]. The prevalence of mixed pathological diagnoses (combinations of AD, VaD, LBD, FTLD) has been reported to be as high as 70% [15].
New investigations are required to develop in vivo biomarkers better reflecting clinical presentation and postmortem pathology, to understand the pathophysiological processes underlying dementias, and to refine dementias’ diagnosis. Neuroimaging could potentially bridge these gaps as it can detect tissue damage in a non-invasive way and is increasingly available in clinical care [16]. Several brain banks have thus been established, to create postmortem data repositories describing both normal aging and neurodegenerative disorders with the hope of discovering new disease biomarkers. Unfortunately, most repositories either lack postmortem imaging to correlate with histopathological findings [17–20] or are restricted to a specific population, healthy brains, or a single disorder [21, 22]. These limitations primarily reduce the possibilities of understanding similarities between neurodegenerative pathologies and developing more specific markers.
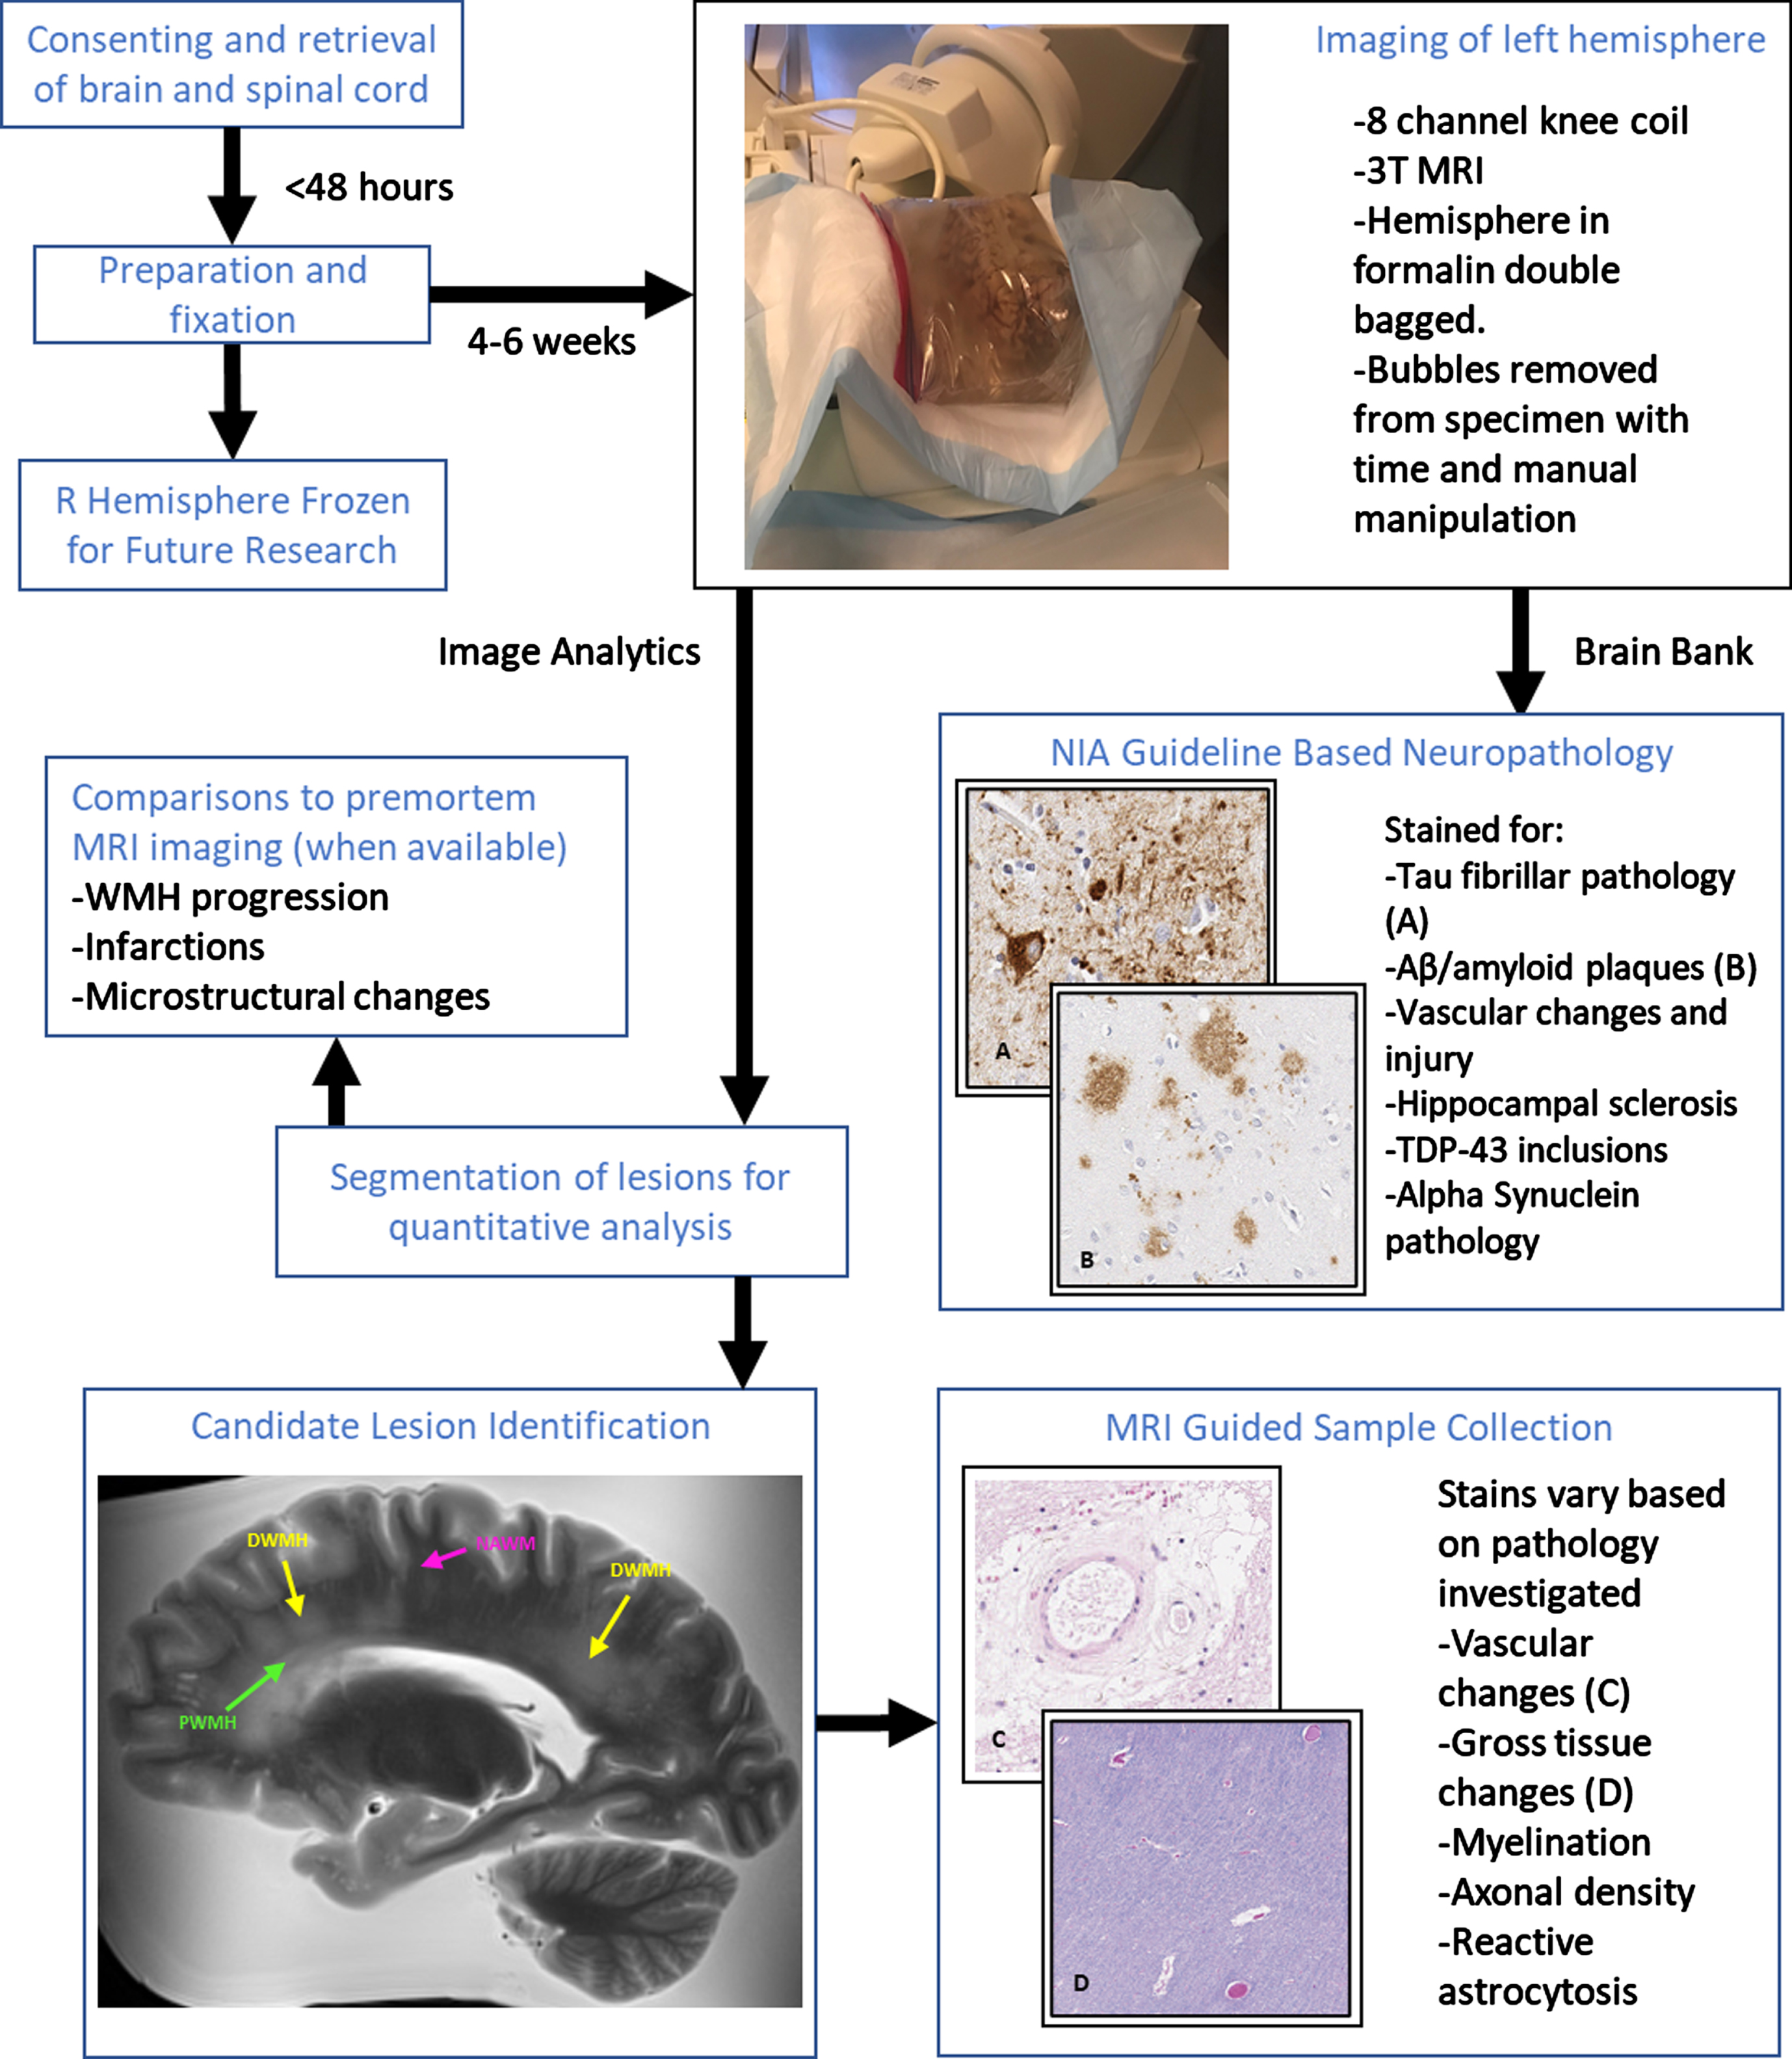
The Biggs Institute Brain Bank was designed to overcome these limitations by developing a data repository where brain imaging and histopathology closely correspond. Our repository provides unique opportunities for radiological images to identify potential biomarkers to guide histopathological sectioning and provide context for the diagnostic utility of the imaging biomarkers (Fig. 1). This approach offers crucial information for the validation of future dementia biomarkers.
In summary, the primary goals of this manuscript are threefold:
1. To describe the South Texas ADRC Brain Bank postmortem database, a unique data repository of postmortem imaging and histopathology of patients with a wide range of neurodegenerative disorders, filling a critical gap in AD research with the lack of joint imaging-pathology dataset in a population with diverse and often overlapping neurodegenerative disorders [21, 22].
2. To introduce novel techniques developed by our group for performing MR-guided pathological analysis of near microscopic lesions through a newly developed 3D printed cutting guide pipeline. Our repository, to our knowledge, is one of the first with the capacity to perform histopathological analysis of a specified MRI-visible lesion of any size.
3. Demonstrate potential avenues of novel method development and new lines of investigation with this unique cohort, with a particular focus on vascular brain lesions, iron deposition, hippocampal segmentation, and volumetric measures quantification in relation to varying pathologies.
Fig. 1
Overview of MR-guided histopathological examination within the South Texas Alzheimer’s Disease Research Center Repository. Perivascular (green), deep (yellow), and normal appearing (magenta) white matter examples are identified in the MRI image.
MATERIAL AND METHODS
Brain samples
The brains collected in this work are all donated at our institution, the University of Texas Health Science Center at San Antonio. Our brain bank accepts donations from patients with clinically diagnosed neurodegenerative disorders (Table 1). Once consent is obtained (the consent form can be found at https://biggsinstitute.org/research/brain-donation/enroll/), a diener is dispatched to collect the brain, brain stem, and spinal cord. The right hemisphere is frozen to be preserved for future analysis, while the left hemisphere and the spinal cord are fixed in a 10% neutral buffered formalin solution [23] and kept in refrigerated conditions for subsequent imaging and histopathology. So far, 139 brains have undergone postmortem imaging.
Table 1
South Texas Alzheimer’s Disease research center cohort. In addition to these 139 patients, 8 patients (2 men and 6 women) were diagnosed with rare disorders: frontotemporal dementia and multiple sclerosis (1 man, 78 years old), anorexia nervosa (1 woman, 57 years old), Alzheimer’s disease and Creutzfeldt-Jakob disease (1 woman, 79 years old), Huntington’s disease (1 woman, 64 years old), amyotrophic lateral sclerosis (1 woman, 62 years old), multiple system atrophy (1 man, 77 years old), and multiple sclerosis (2 women, 57 and 66 years old). An additional 13 patients’ records are pending for diagnosis
| Diagnosis | Total | Men | Women | Mean age (min-max age) |
| Total | 139 | 69 | 70 | 77.9 (54–97) |
| Alzheimer’s Disease (AD) | 65 | 34 | 31 | 78.8 (56–95) |
| Frontotemporal Dementia (FTD) | 10 | 3 | 7 | 69.7 (61–75) |
| Lewy Body Dementia (LBD) | 9 | 8 | 1 | 76.2 (63–88) |
| Vascular Dementia (VaD) | 4 | 3 | 1 | 83.0 (74–97) |
| Parkinson’s Disease (PD) | 8 | 4 | 4 | 75.2 (70–78) |
| AD &LBD | 9 | 3 | 6 | 75.8 (55–87) |
| AD &LBD &FTD | 1 | 1 | 0 | 73.0 (73–73) |
| AD &LBD &VaD | 2 | 1 | 1 | 68.0 (58–78) |
| AD &LBD &VaD &PD | 1 | 1 | 0 | 88.0 (88–88) |
| AD &VaD | 8 | 3 | 5 | 81.9 (61–94) |
| AD &PD | 2 | 1 | 1 | 81.0 (72–90) |
| Dementia not specified | 20 | 7 | 13 | 78.4 (54–91) |
In addition, family interviews are conducted by our team and medical records are collected to aid in the understanding of how the pathology corresponds to clinical presentation, and they are reviewed by a team including members from psychiatry, neurology, and pathology. Collection of medical records involves contacting all medical and imaging providers visited by the donor once consent is given, although collection of records from some facilities can be unsuccessful despite this. Antemortem clinical magnetic resonance imaging (MRI) including T1-weighted, T2-weighted, Fluid Attenuation Inversion Recovery (FLAIR), Diffusion Weighted Imaging (DWI), and Susceptibility Weighted Imaging (SWI) have been collected in 52 donors and counting with consent for comparisons between ante- and postmortem imaging (Fig. 2). An additional eight antemortem fluorodeoxyglucose positron emission tomography (PET) scans and one amyloid PET scan are also available for future investigation of PET biomarkers. Other images, including computerized tomography scans and X-Ray images, were also stored in case of future utility.
Fig. 2
Example of lesion progression. The antemortem clinical scan was performed in 2014, while the postmortem scan was completed in 2020, several months after passing. The WMH around the frontal horn of the lateral ventricle has increased during this time. The total WMH volume increased from 10.2 cm3 (in 2014) to 14.5 cm3 (in 2020) during this time.
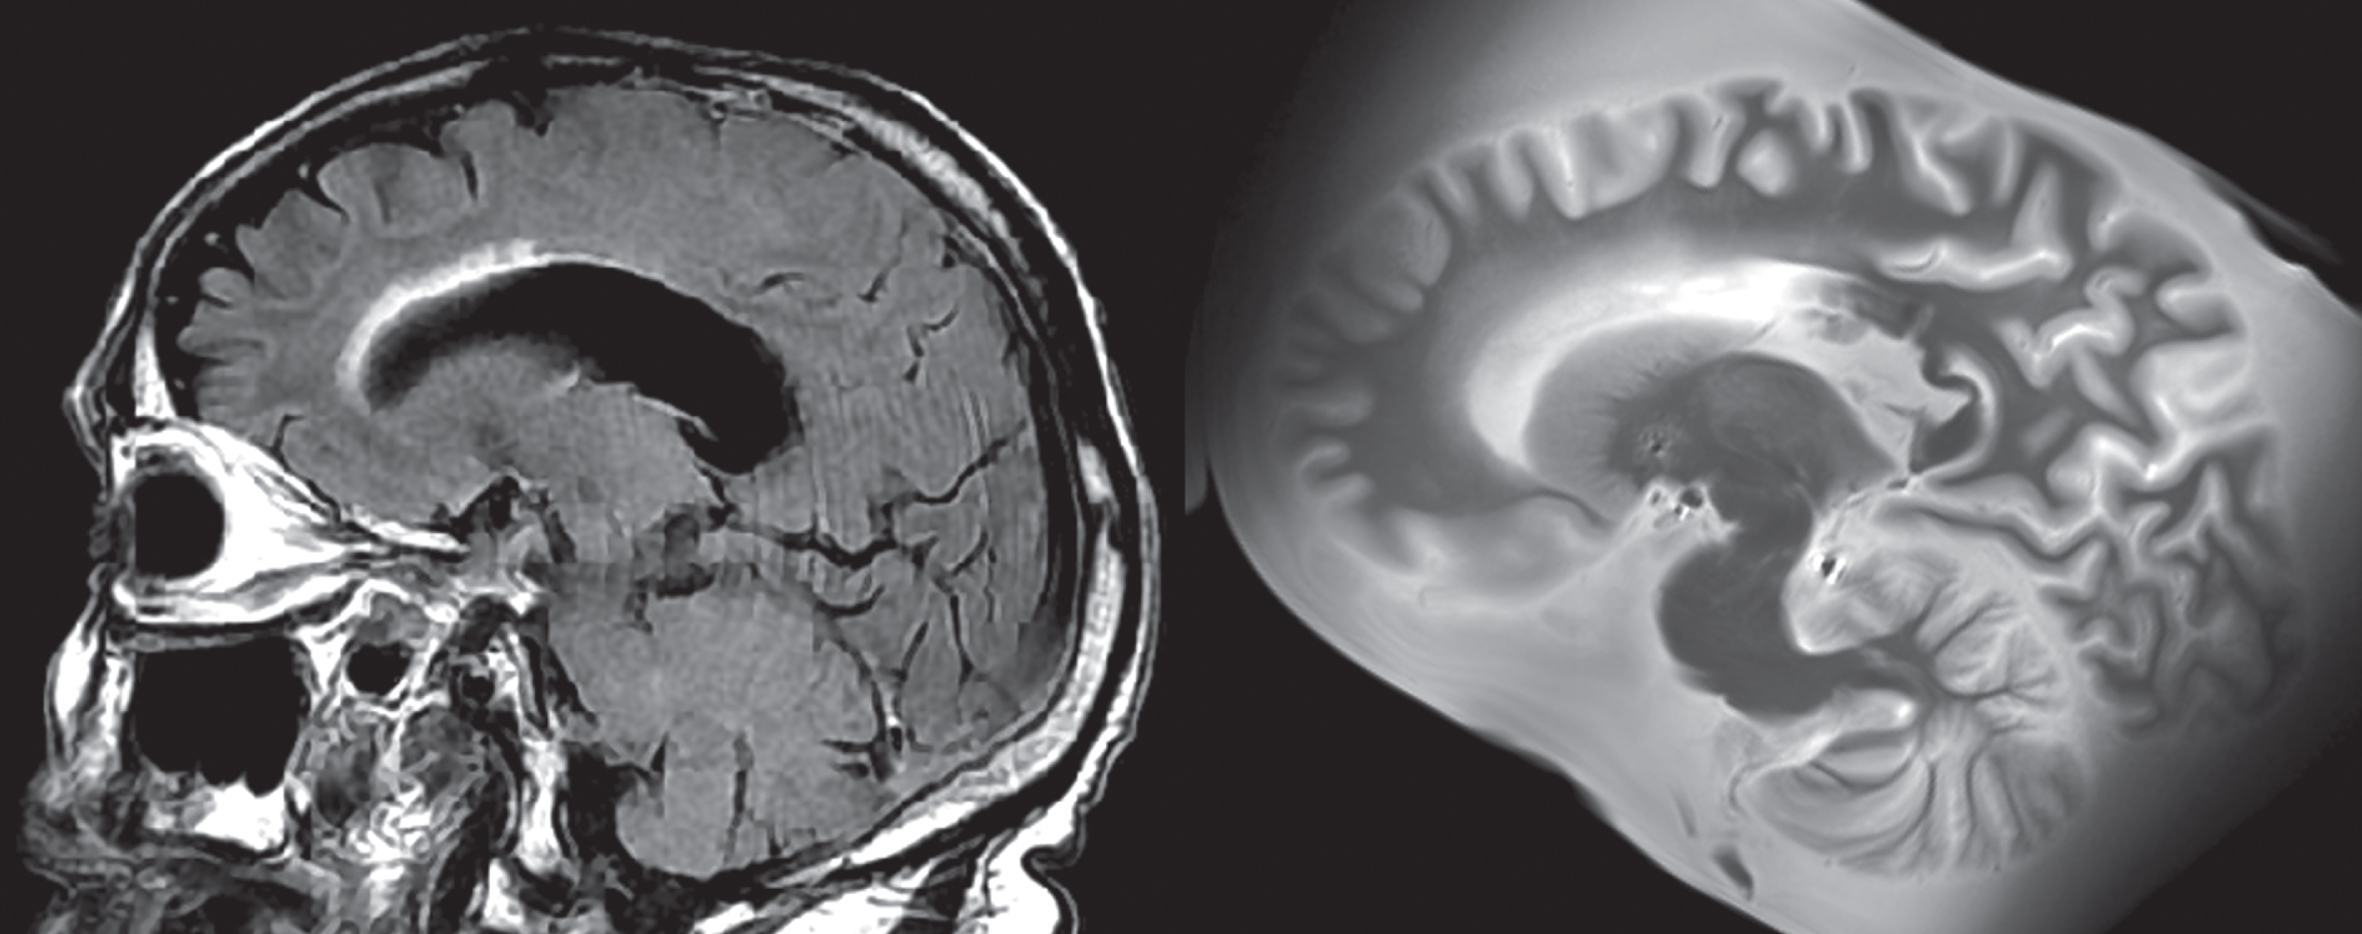
Image acquisition
Before dissection for histopathology, a postmortem MRI is performed on the left half of the brain, including the cerebral hemisphere, cerebellum, and brain stem down to approximately the cervicomedullary junction. Brain halves are first submerged in a bag filled with formalin and kept refrigerated for two weeks to eliminate air bubbles. The bags containing the brains are then placed inside a Siemens TimTrio 3T scanner and imaged using an 8-channel knee coil. The first 101 brains were scanned following the original imaging protocol presented in Table 2 and lasting 2.5 h. Subsequently, a postmortem Diffusion-Weighted Fast Imaging with Steady-state free Precession (DW true FISP) sequence was added to the protocol in order to characterize white matter tissue integrity through diffusion metrics such as fractional anisotropy and mean diffusivity, and replaced the gradient echo sequence. The T2-weighted turbo spin echo sequence (TSE) was modified to reduce slice thickness and improve the scan resolution. The revised sequence takes approximately 14 hours and was used to scan the next 59 brains in the repository (Table 2).
Table 2
Imaging protocols. The first 101 brains were scanned using the original imaging protocol. The revised protocol incorporating a new diffusion-weighted sequence as well as a higher resolution T2 TSE sequence was used for the next 59 brains
| Original | TR (ms) | TE (ms) | Flip Angle | Resolution (mm3) | Scan Time (min) | Other parameters |
| SWI/QSM | 39 | 6.72, 12.79, 21.29, 29.79 | 15° | 0.5×0.5×0.5 | 61 | 6 averages |
| T1-Weighted | 2200 | 3.25 | 13° | 0.5×0.5×0.5 | 24 | 4 averages |
| T2 TSE | 3750 | 20, 30, 50 | 120° | 1.5×0.6×0.6 | 40 | 4 averages |
| Multi-Echo GRE | 35 | 5, 10, 15, 20, 25, 30 | 20° | 1.0×1.0×1.0 | 5 | |
| Revised | TR (ms) | TE (ms) | Flip Angle | Resolution (mm3) | Scan Time (min) | Other parameters |
| SWI/QSM | 39 | 6.72, 12.79, 21.29, 29.79 | 15° | 0.5×0.5×0.5 | 61 | 6 averages |
| T1-Weighted | 2200 | 3.25 | 13° | 0.5×0.5×0.5 | 24 | 4 averages |
| T2 TSE | 9790 | 23, 34, 68 | 120° | 0.8×0.6×0.6 | 293 | 14 averages |
| DW True FISP | 29.77 | 23.89 | 35° | 1.0×1.0×1.0 | 472 | b-value 1 = 0 s/mm2 b-value 2 = 18000 s/mm2 44 diffusion directions 8 B0 images |
Quality control
After initial testing of the scanning parameters to optimize image quality for a limited scan time, imaging quality across brains generally did not vary greatly. The 8-channel knee coil was selected after comparisons with other coils to maximize overall contrast-to-noise (CNR) of the brain, though the CNR did drop near the edges of the image. The CNR is defined by [24]:
T1-weighted images generally had a CNR in the range of 40–50 at the center of the coil while T2-weighted images generally had a CNR in the in the range of 20–30 at the center of the coil.
The most consistent artifact to appear are bubbles in the formalin that at times get trapped within the ventricles and cause artifacting due to the sudden susceptibility change at the air-fluid interface. To address this issue, each brain undergoes a short 5-min preliminary low-resolution scan to visually assess for the presence of bubbles. If present, the brains are shifted and then stored back in refrigeration to allow the bubbles to pass with time.
Image processing
Brain scans are processed as follows. Due to the amorphous shape of the formalin containing bag, the alignment of scans was inconsistent due to a desire to minimize field of view to minimize scan time. This required reorientation of the brain post scan for consistent axes across all scans. This issue was gradually improved upon with increasing experience in bag placement within the coil for consistent orientation of the brain, and efforts are currently ongoing to design custom MR-compatible brain holders. The N4 bias field correction algorithm provided with the Advanced Normalization Tools (ANTs) software library version 2.2.0 [25] is then used to correct MRI intensity to remove artifacts induced by inhomogeneities in the magnetic field generated by the MRI scanner [26]. ANTs is then used to register the T2-weighted scan in the space of the T1-weighted scan, and the registered T2-weighted scan is used to segment brain tissues by using the FSL FAST software version 5.0.11 [27]. The workflow is summarized in Fig. 3 (top).
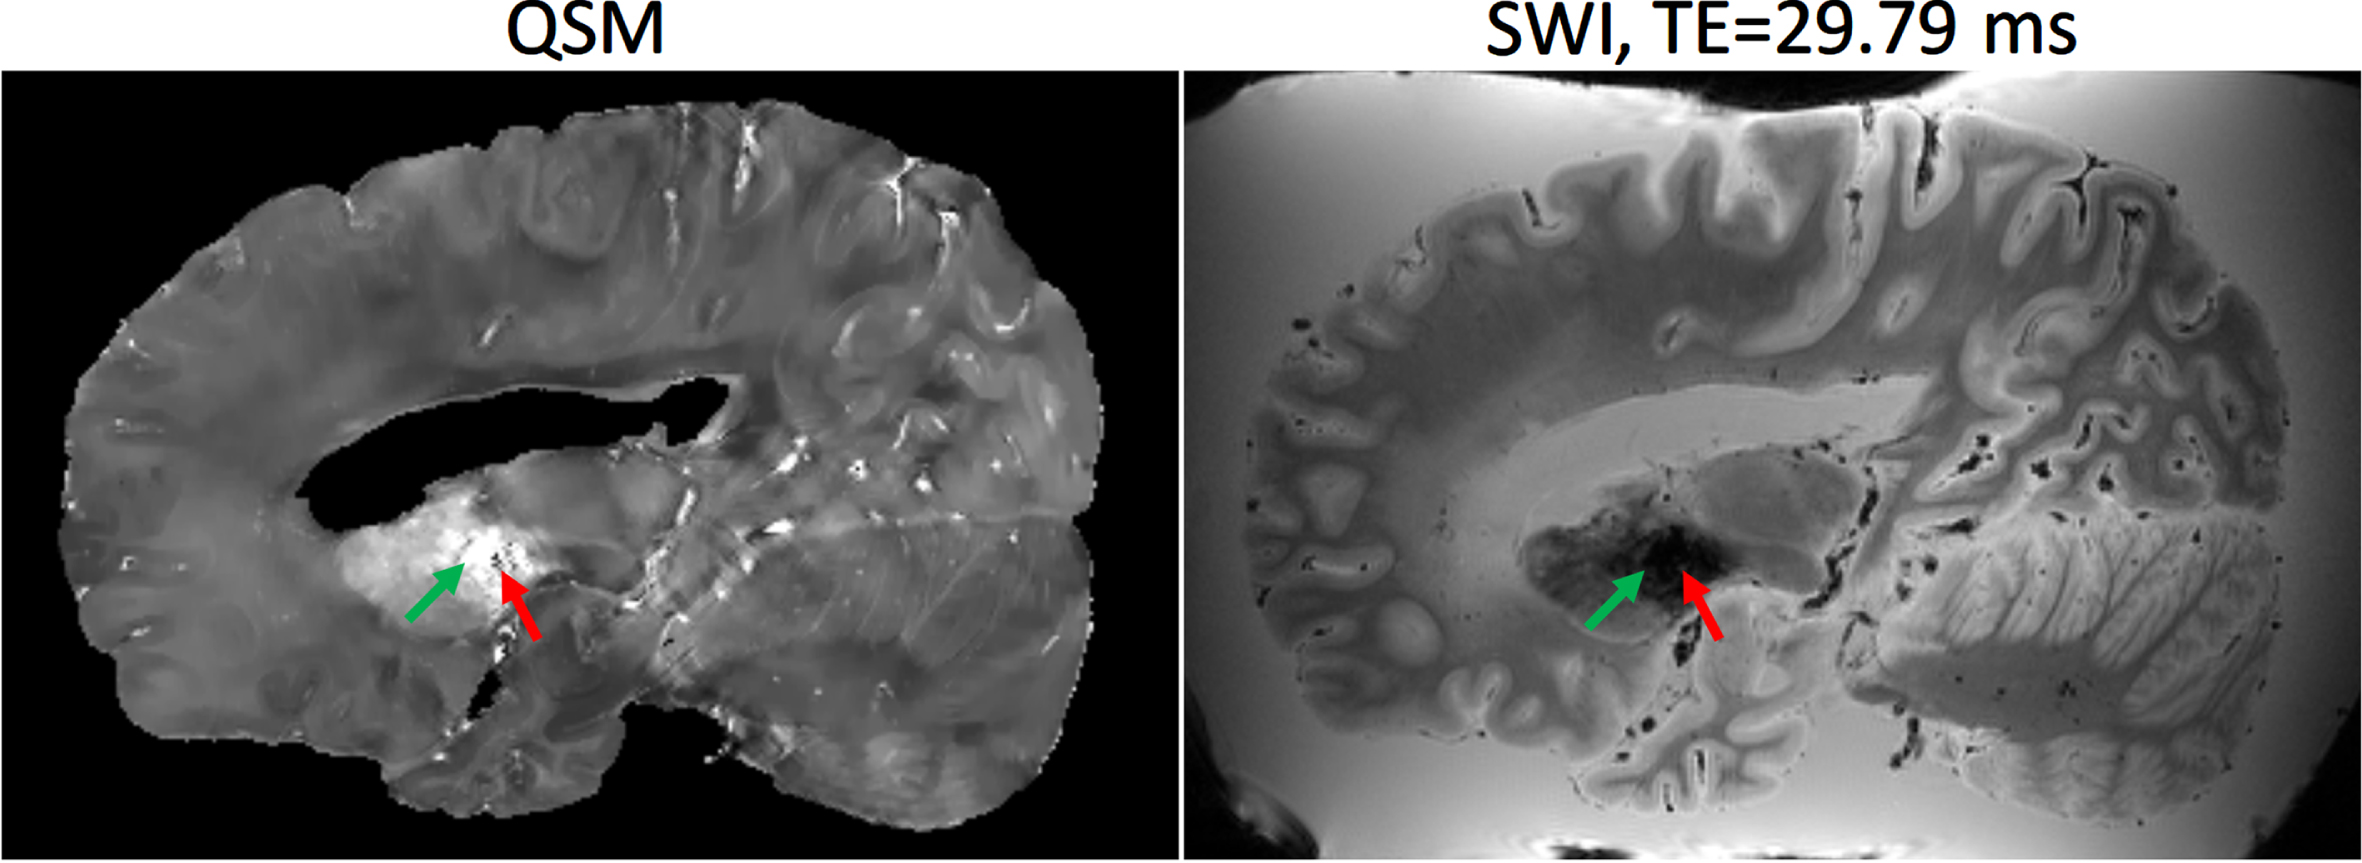
SWI is a high-resolution, 3D imaging sequence where the image contrast is enhanced by combining the magnitude and phase data [28, 29]. A homodyne high-pass filter [30] with a predefined k-space window size was applied to the raw phase image to generate a negative phase mask. This phase mask was raised to power 4 and multiplied with the magnitude image to generate the SWI. Quantitative susceptibility mapping (QSM) is a post-processing method for mapping the magnetic susceptibility of local tissue and is useful for quantifying biomarkers such as iron distribution, calcification, and demyelination [31]. QSMs were generated using the Morphology Enabled Dipole Inversion method [31, 32]. A non-linear fitting was used to estimate the total field followed by spatial unwrapping. Then background fields were removed with the Projection onto Dipole Fields method [33] and the final susceptibility map was calculated with the Morphology Enabled Dipole Inversion with zero referencing using cerebral spinal fluid method [34]. The workflow is summarized in Fig. 3 (bottom) and an example of SWI/QSM is shown in Fig. 4.
Fig. 3
Flowchart of the various filters applied for the processing of structural and SWI/QSM images. Blue boxes correspond to image inputs/outputs, while yellow corresponds to applied filters and transformations.
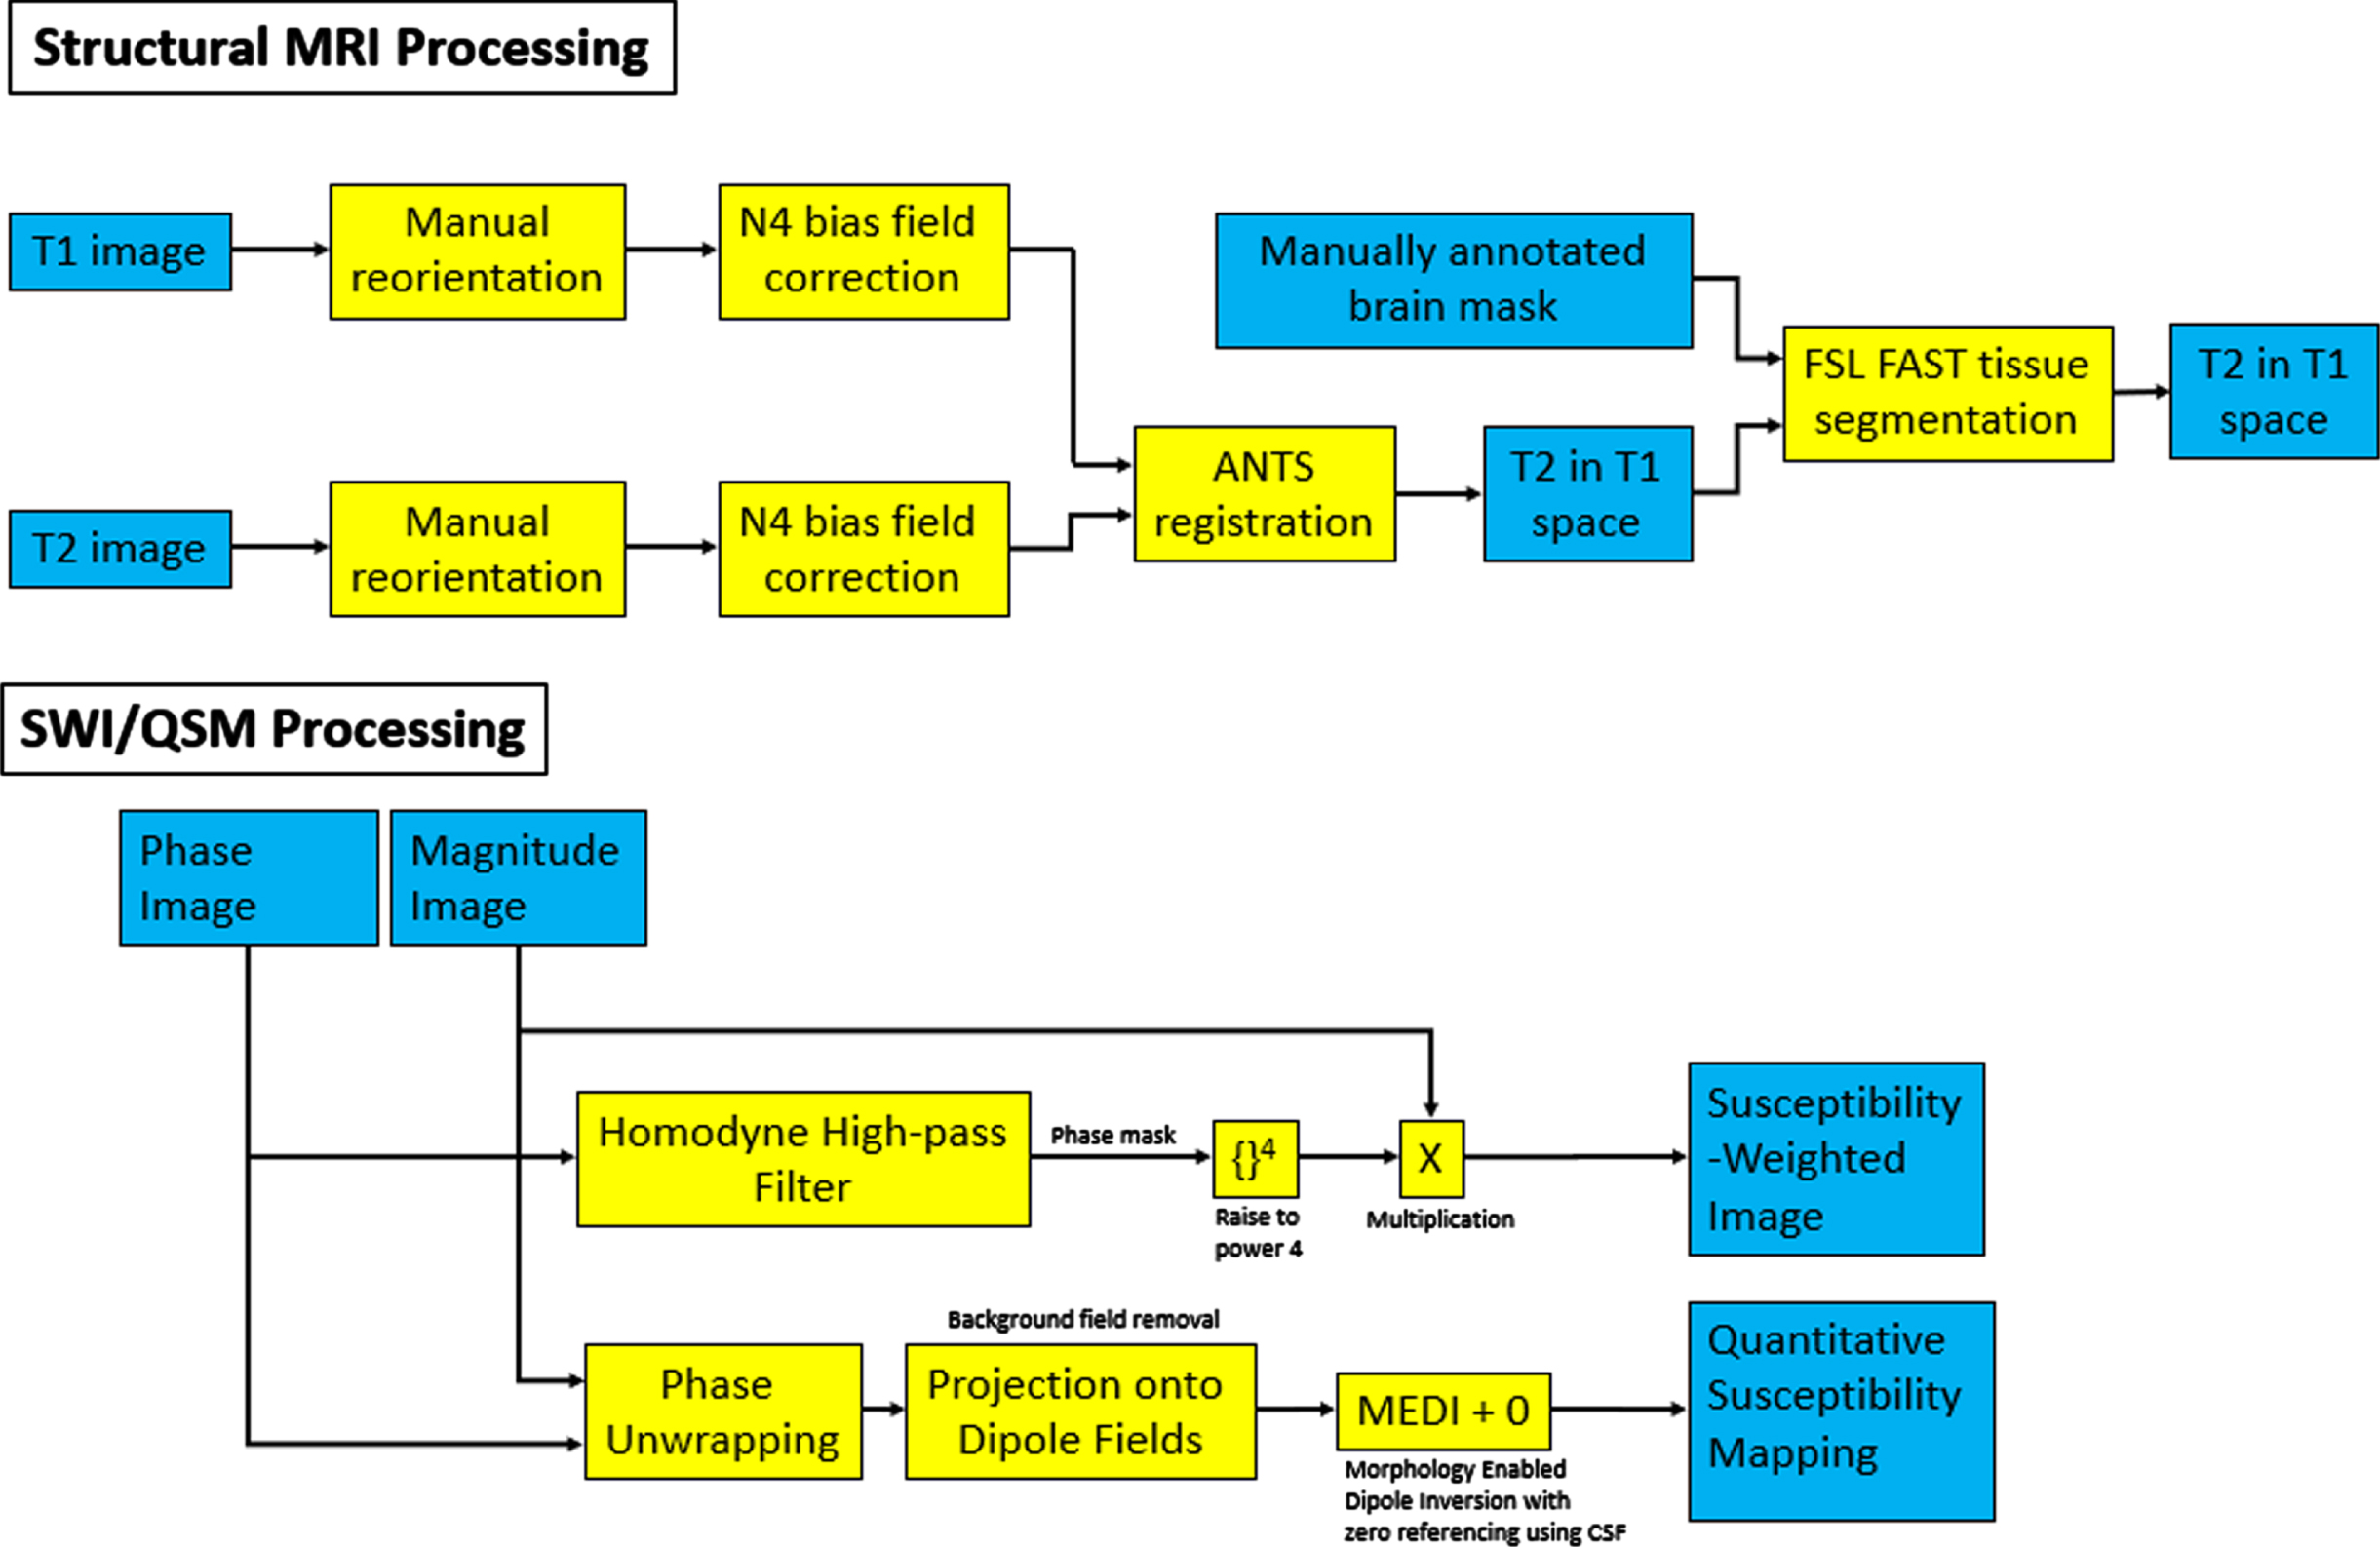
Fig. 4
Example of Quantitative Susceptibility Mapping (QSM) (left) and Susceptibility Weighted Image (SWI) at echo time = 29.79 ms (right). The basal ganglia (green arrow) typically has a higher concentration of paramagnetic iron which exhibit hyperintensities on QSM, whereas diamagnetic calcifications exhibit hypointensities (red arrow).
Standard histopathological examination
Microscopic sections are prepared from 23 brain regions according to NIA Alzheimer’s Association guidelines [35]. All brains are evaluated according to the most current diagnostic criteria for AD. Hematoxylin and eosin stains [36], Thioflavin-S [37], p-tau (AT8) [38], and amyloid-β (4G8) [39] immunohistochemistry are routinely used for AD and cerebral amyloid angiopathy (CAA) [40]. Examination for other contributing factors, including cerebrovascular injury [41], tauopathies, α-synucleinopathies [42], and p-TDP-43 is also undertaken. Additional stains include ubiquitin (p62) [43], fused-in-sarcoma protein (FUS) [44], and α-internexin [45] to detect inclusions for various other types of neurodegenerative disorders were performed as well.
Neuropathological indicators of AD degenerative change include determining the Thal phase of amyloid-β plaque deposition [46], Braak neurofibrillary tangle stage [47], and the Consortium to Establish a Registry for Alzheimer’s Disease (CERAD) neuritic plaque score [3]. A composite “ABC” score is determined using the three indicators to assess the extent of AD neuropathological change [35]. Other neurodegenerative changes include locations of Lewy body pathology spread for LBD staging [48], evidence of tau pathology for determining presence of FTLD-tauopathies [49], and TDP-43 inclusions for FTLD-TDP subtype [50] as well as Limbic-predominant Age-related TDP-43 Encephalopathy (LATE) [51]. For this study, cases with high AD degenerative change were counted as having AD, cases with evidence of Lewy bodies above the brain stem were counted as LBD, cases with stage 2 spread of argyrophilic grains (to beyond the ambient gyrus and immediate vicinity) were counted as having argyrophilic grain disease [52], and cases with the corresponding tauopathy or TDP-43 proteinopathy were counted as FTD-Tau or FTD-TDP.
Cerebrovascular disease burden is assessed by macroscopic and microscopic measurement of atherosclerosis, arteriolosclerosis, and hypertensive changes such as perivascular clearing and hemosiderin-laden macrophages [53]. Amyloid-β protein precursor and amyloid-β assess white matter (WM) ischemic pathology or axonal injury. The degree of cerebral arteriosclerosis is assessed semi-quantitatively in four regions of deep WM and basal ganglia, atherosclerosis in the circle of Willis, and CAA in the middle frontal, inferior parietal, superior temporal, and calcarine cortices. Semi-quantitative scores for arteriosclerosis, atherosclerosis, and CAA range from none (0) to severe (3). A global CAA severity is determined using NIA-AA guidelines; absence of CAA is scored as 0, mild CAA (1) as scattered Aβ-positive vessels; moderate CAA (2) as intense Aβ-positivity, and severe CAA (3) as widespread, intense Aβ-positive vessels in multiple brain regions. Cases were classified as having CVD if they had moderate or severe CAA, moderate to severe arteriosclerosis and/or atherosclerosis, WM rarefaction, infarcts, multiple microinfarcts, hemorrhages, or hematomas.
RESULTS
Pathological findings
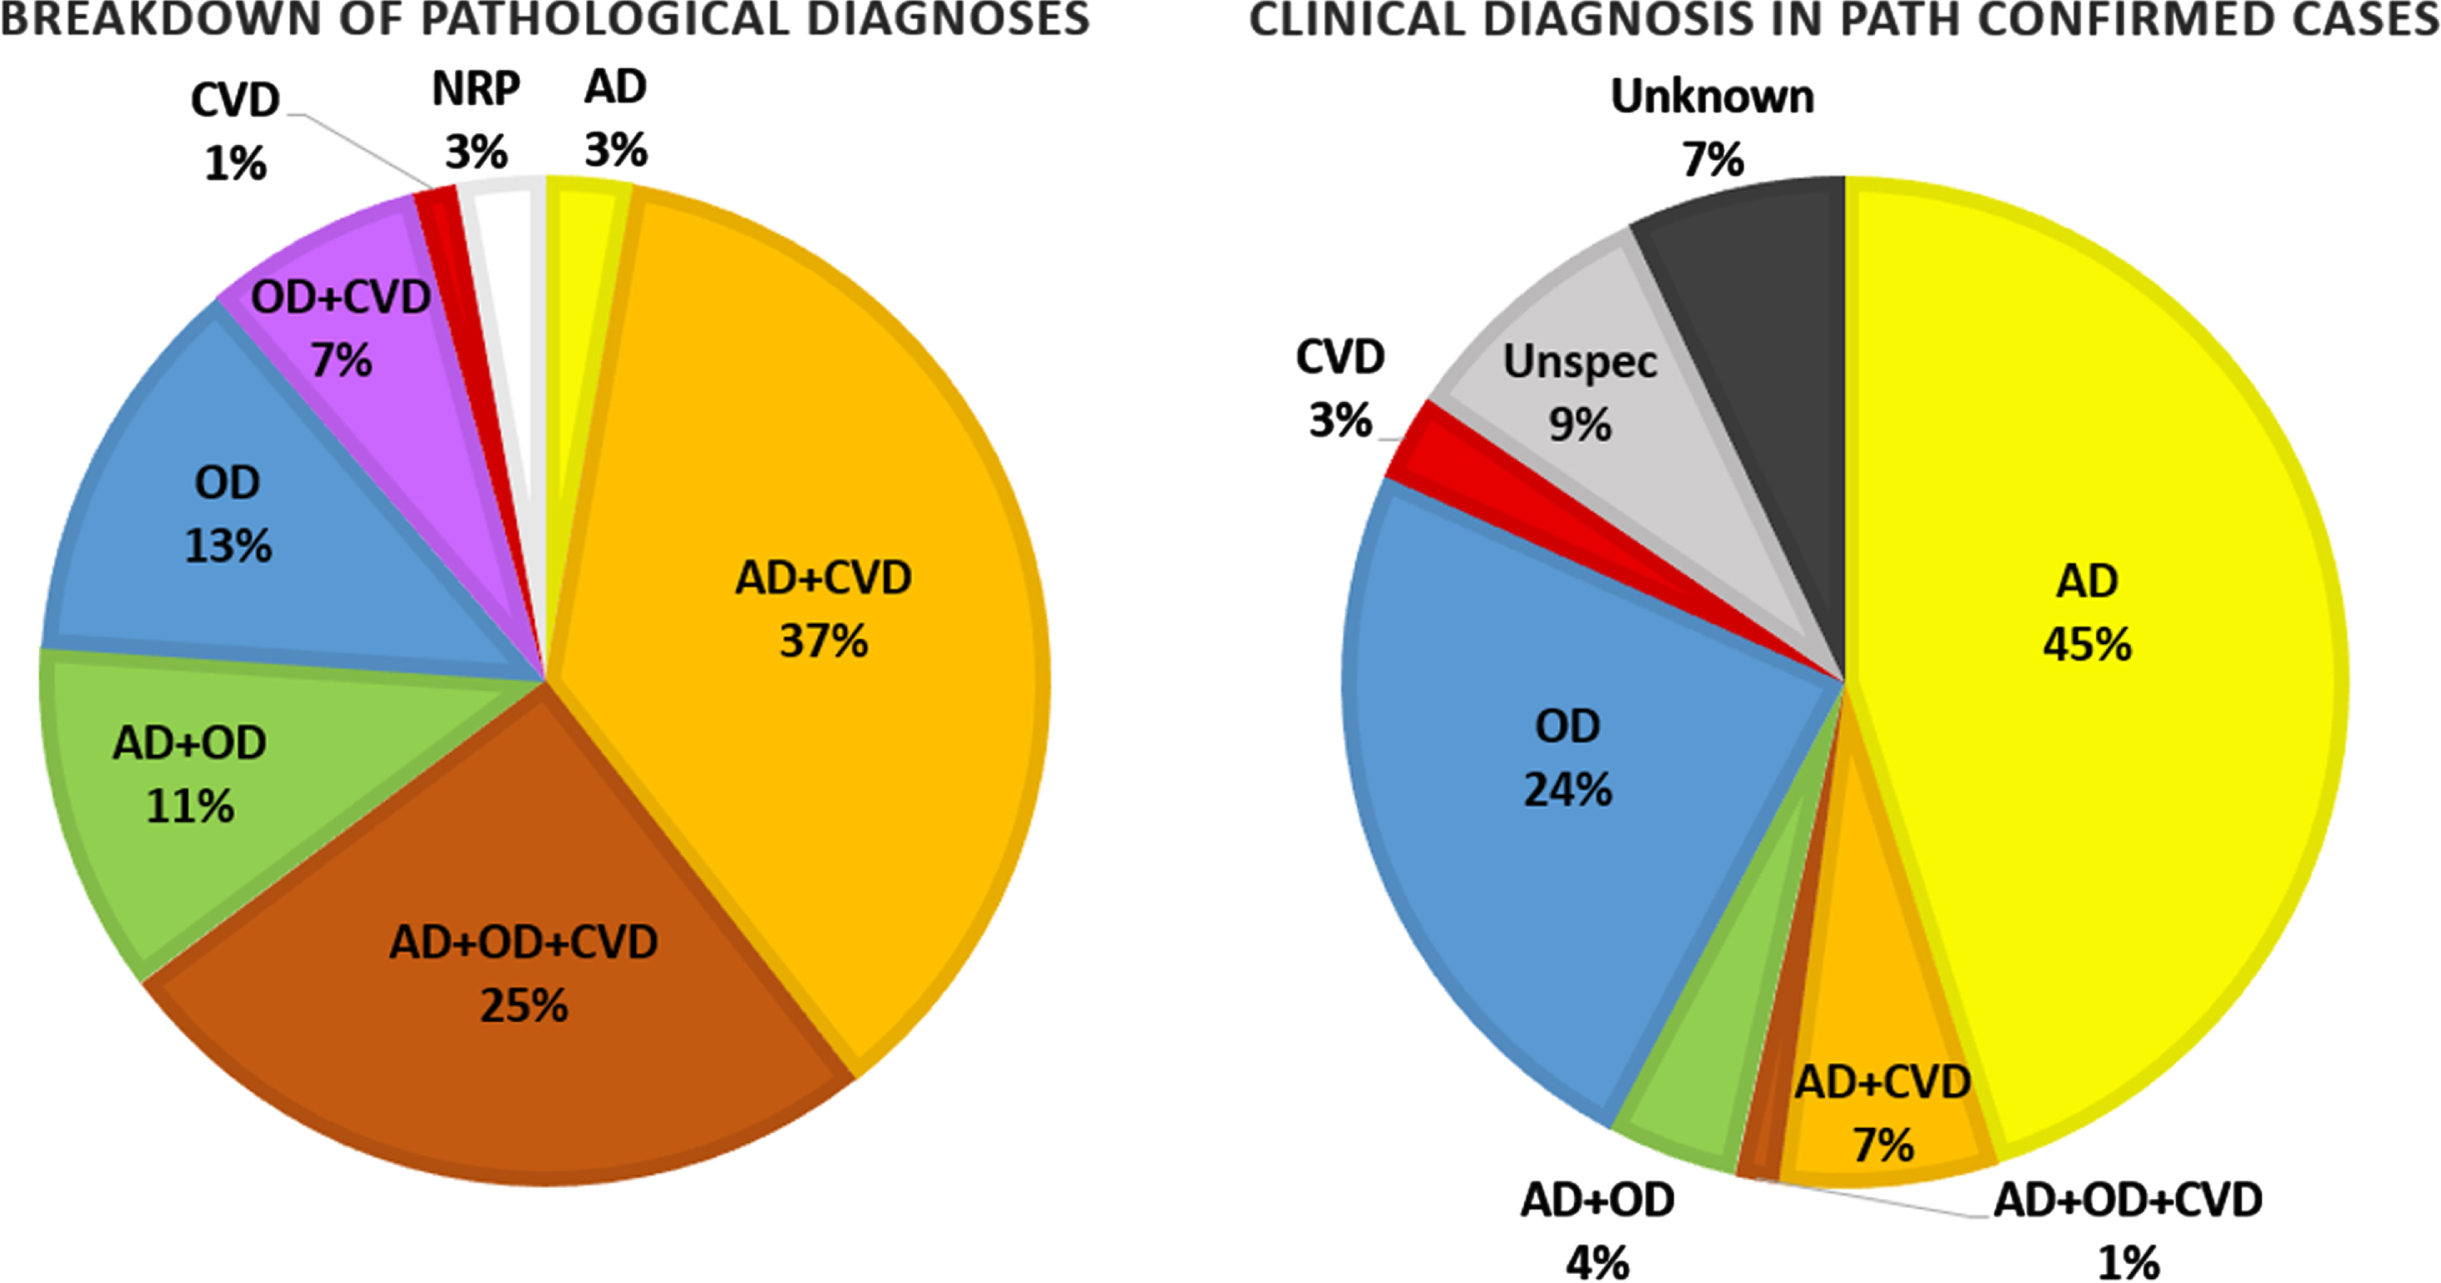
Figure 5 shows the breakdown of pathological findings in 71 cases that have been fully analyzed with the corresponding breakdown of clinical diagnoses for those cases. They are separated into cases demonstrating high AD neuropathological changes, cases with moderate or severe CVD, cases with other neurodegenerative changes (tauopathy, TDP-43 proteinopathy, α-synucleinopathy, etc.), and combinations of the pathologies. There is a high prevalence of multiple pathologies contributing to the neurodegenerative changes observed. Over three fourths of the cases demonstrate high AD neuropathological changes, but only 3% of that 76% only showed AD pathology with no evidence of other neurodegenerative processes. Likewise, in over half of the cases, there was a non-AD and non-CVD related neurodegenerative pathology.
Fig. 5
Breakdown of neurodegenerative pathologies found in 71 fully analyzed cases and the corresponding breakdown of their clinical diagnoses. AD, Alzheimer’s disease; CVD, cerebrovascular disease; OD, other (non-AD/CVD) dementia; NRP, no relevant pathology.
Lesion characteristics in MRI
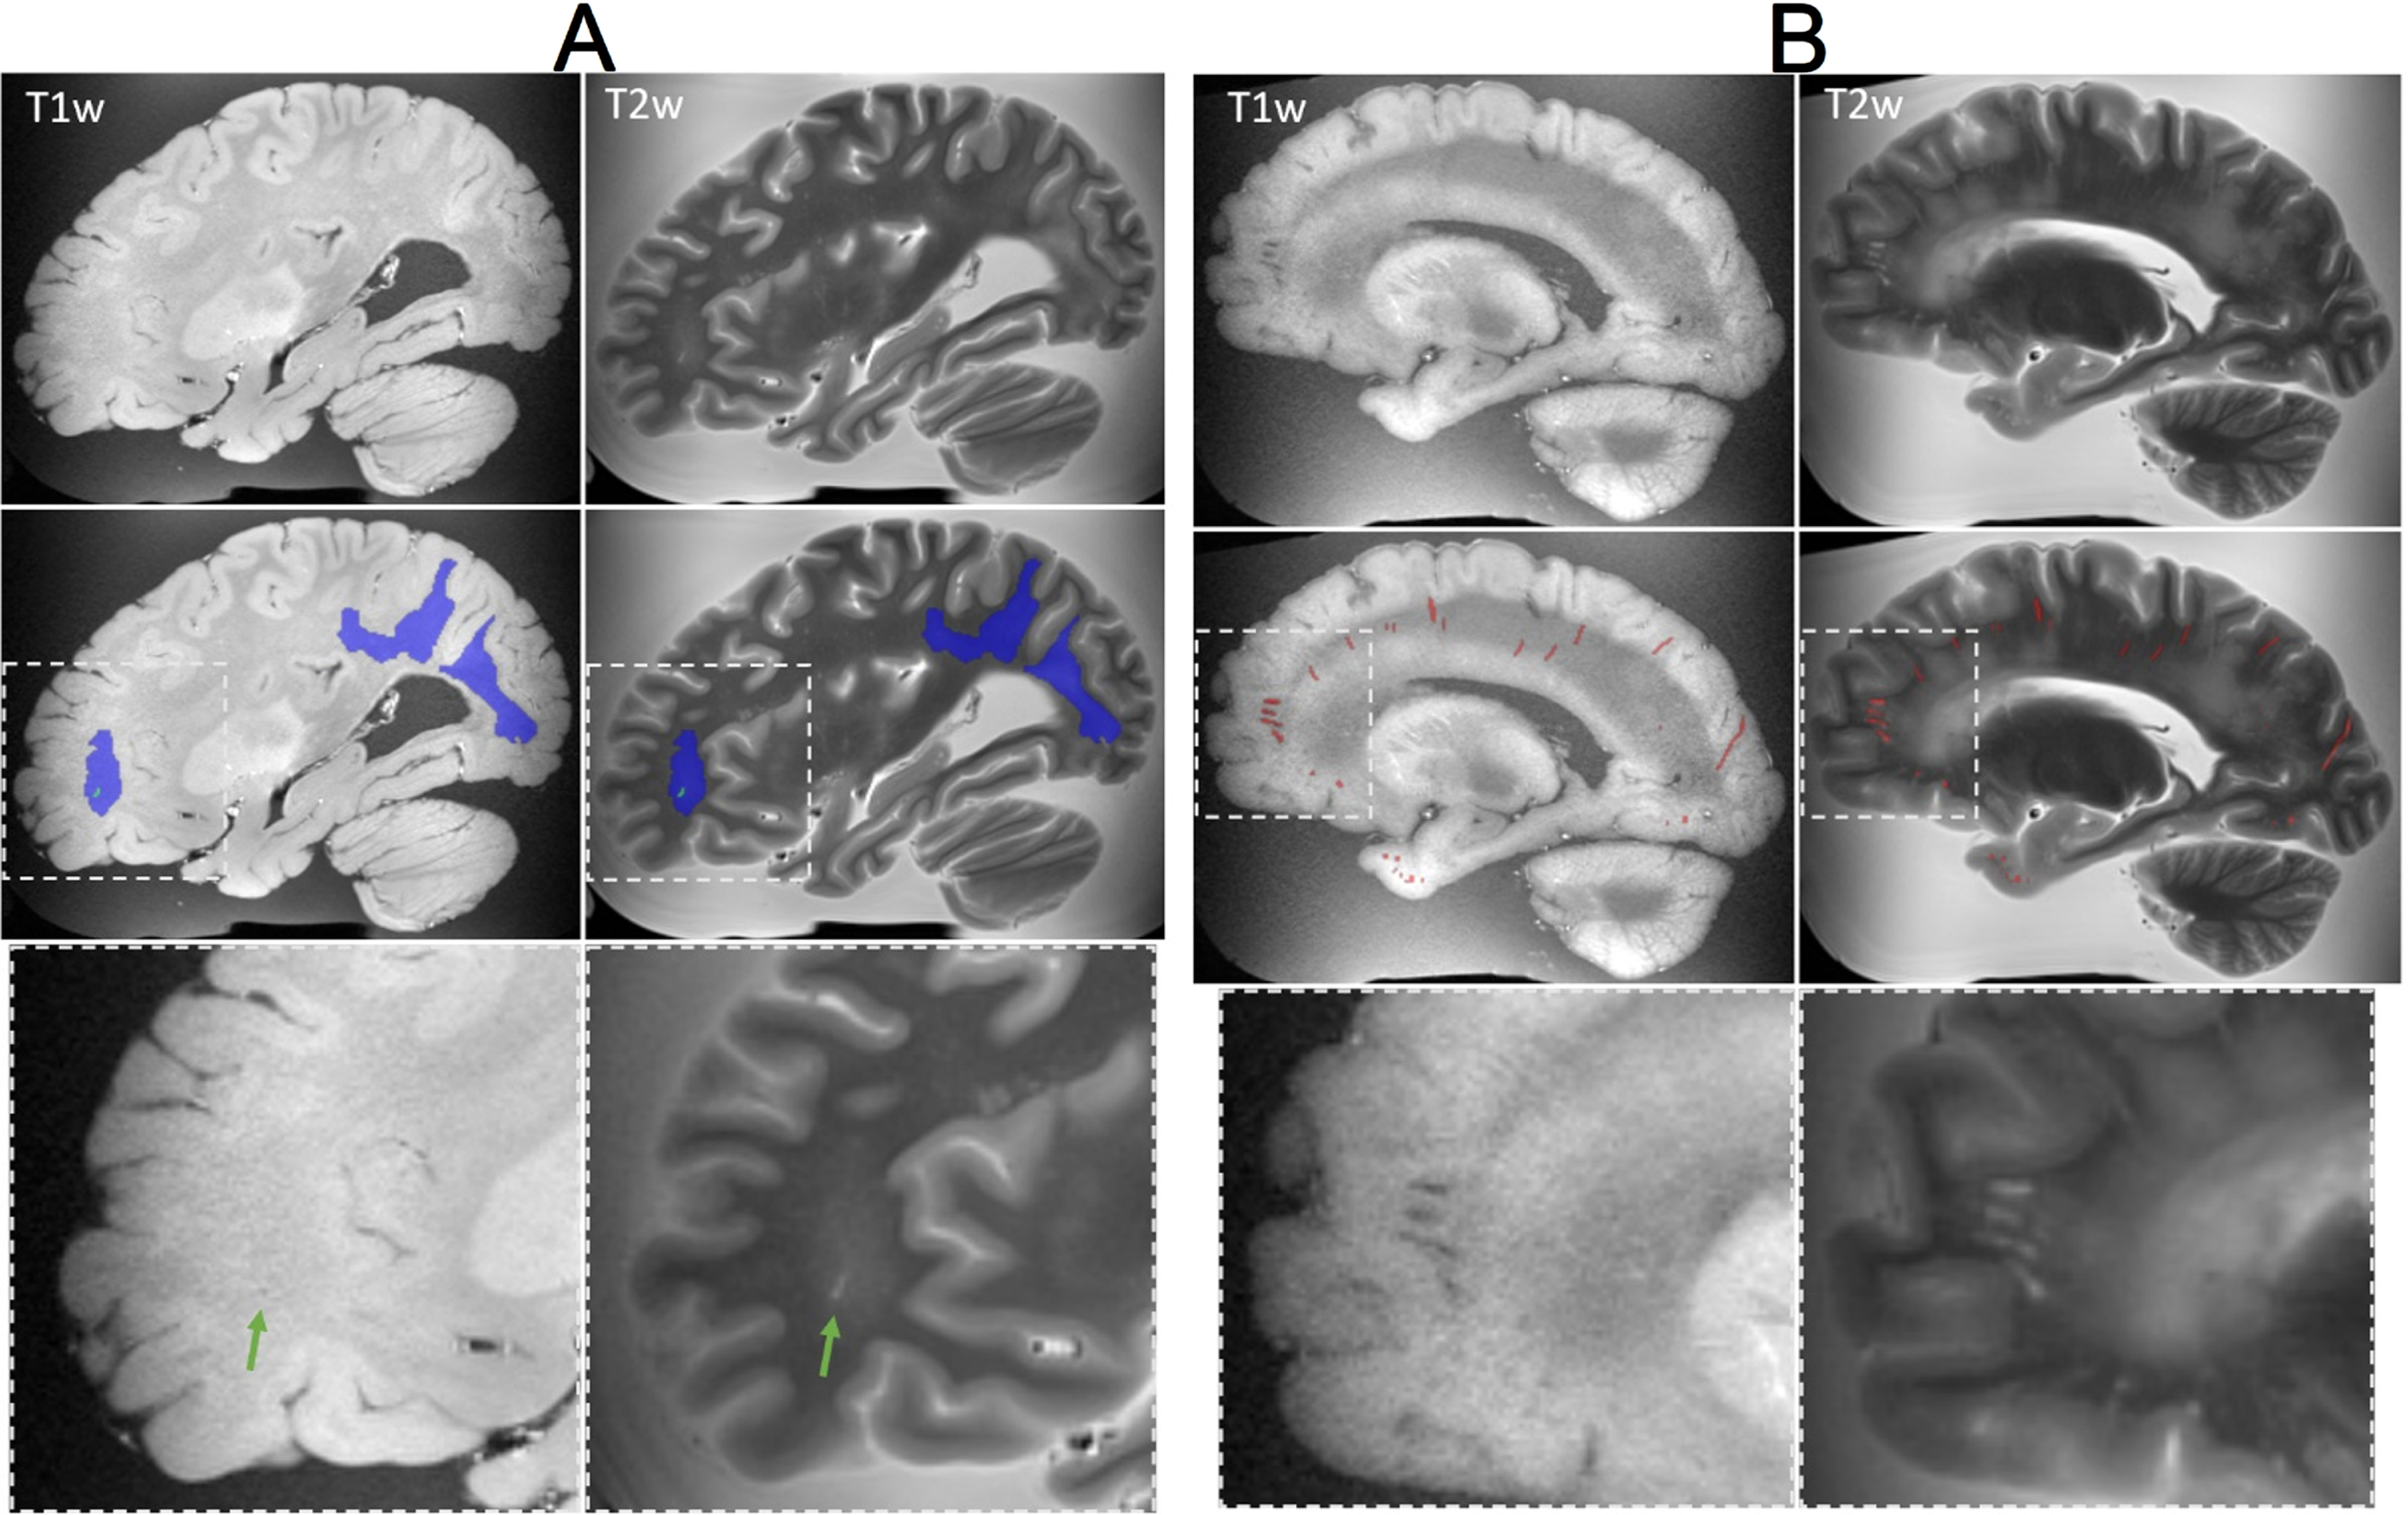
Our imaging protocol has been designed to capture various markers of cerebrovascular disease and related lesions, including tissue volume (Fig. 6), white matter hyperintensities (WMH), enlarged perivascular spaces (EPVS), microbleeds, iron deposit, and infarctions. WMH have a hyperintense appearance on T2 TSE, while they appear isointense or hypointense in T1-weighted images (Fig. 7A). They are typically rounded in shape in isolation or form a rim around the lateral ventricle, and they can fuse into large confluences. With the brains donated to our institution, most have a Fazekas grade of 2 to 3 [54]. EPVS are hypointense on T1 weighted images and hyperintense on T2 TSE. They were observed around the basal ganglia and subcortical WM. EPVS were generally observed to have an ellipsoidal shape when viewed perpendicular to the imaging plane or a curvilinear shape when viewed parallel to the imaging plane, though other more complex shapes were observed depending on blood vessel course. Infarctions were mostly isointense on T1 weighted MRI and hyperintense on T2 TSE. Infarctions have variable shapes due to the complex nature of collateral blood flow and, depending on the etiology and age of the lesion, can variably be of any intensity on imaging.
Fig. 6
T2-weighted MRI registered in the space of the T1-weighted MRI scan, unprocessed T1-weighted MRI scan, and brain tissues segmentation derived from the T2-weighted scan (white matter is colored in green).
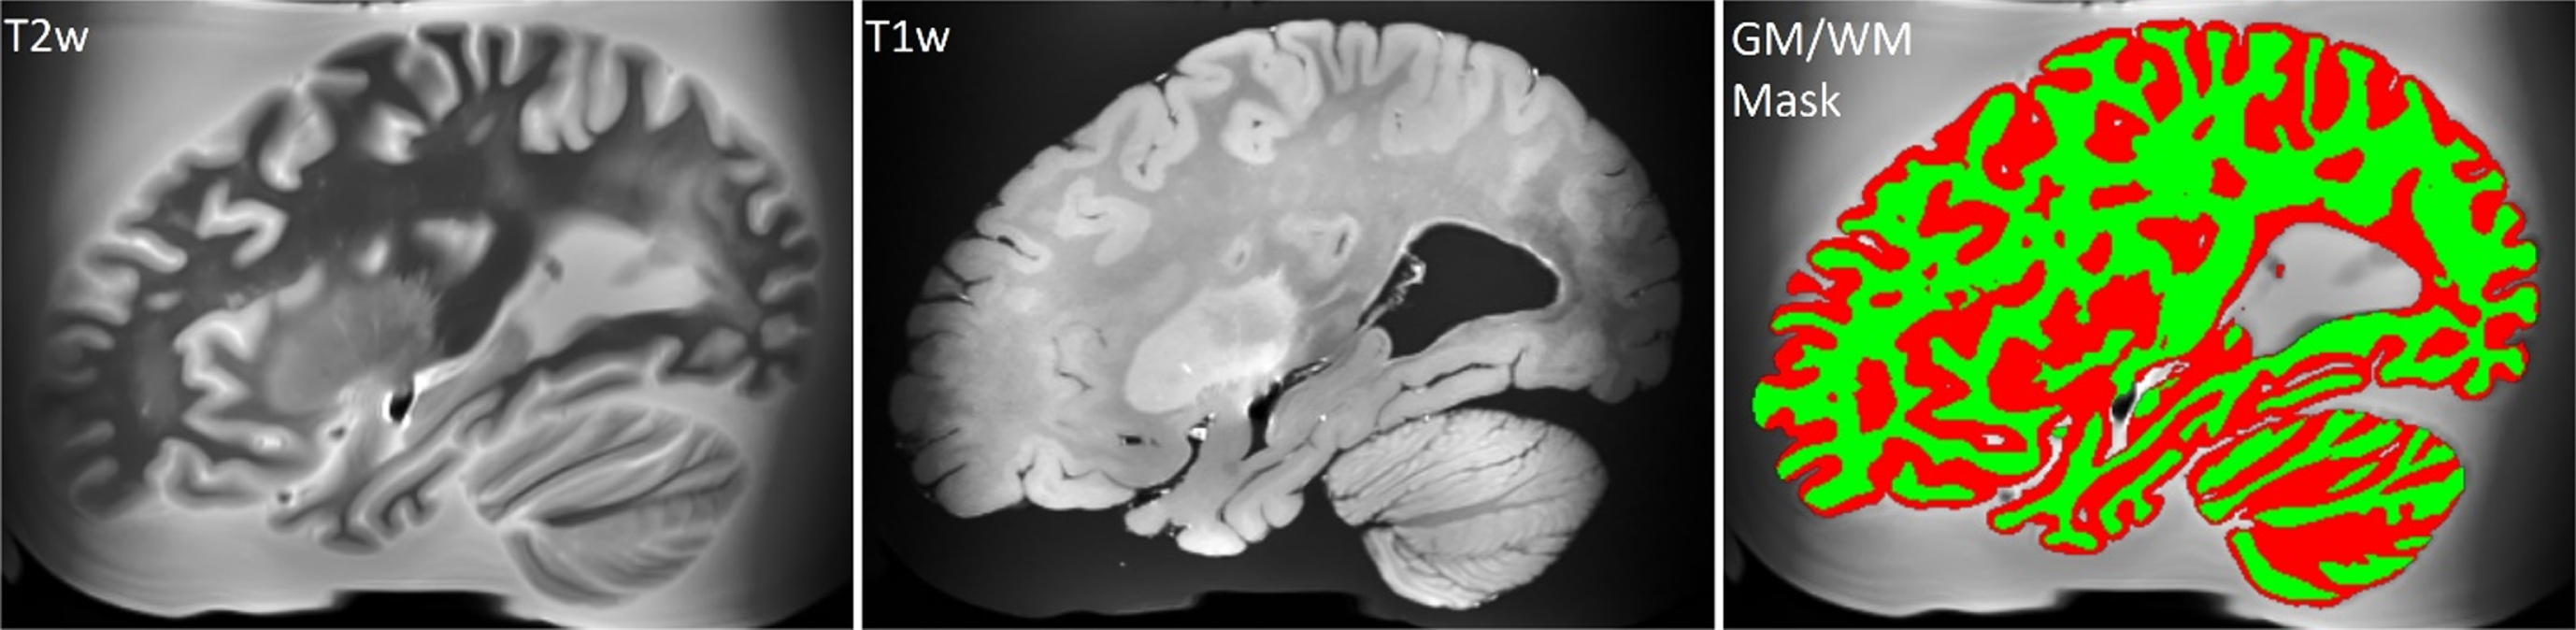
Fig. 7
Examples of lesions captured on ex-vivo T1-weighted and T2-TSE MRI. A) (Top row) MRI showing white matter hyperintensities in the occipital and parietal regions, and a small infarction in the frontal lobe. (Middle row) manual segmentation of the white matter hyperintensities (blue) and infarction (green). (Bottom row) Magnified view of the infarction, indicated by the green arrow. B) (Top row) MRI showing enlarged perivascular spaces (EPVS) throughout the brain. (Middle row) manual segmentation of EPVS (red) by an expert. (Bottom row) Magnified view of EPVS in the frontal lobe.
Lesion quantification
Manual quantification of a rich set of imaging biomarkers, including WMH (Fig. 7A), cerebral microbleeds, iron deposition, mineralization, EPVS (Fig. 7B), hippocampal volume, and hippocampal subfields (Fig. 8) is currently underway. The goal of identifying lesions, is to investigate via histopathology during the dissection, and providing brain masks that will be used to train deep learning models and automate future segmentations. Manually segmented masks are systematically checked by a second expert to ensure quality and consistency.
Fig. 8
Hippocampus segmentation. The hippocampus is segmented into anterior (green), posterior (yellow), dentate gyrus (blue), and middle non-dentate hippocampus (red). The orientation of the hippocampus is such that its longest axis is horizontal to facilitate segmentation of hippocampal head, body, and tail [107, 108].
![Hippocampus segmentation. The hippocampus is segmented into anterior (green), posterior (yellow), dentate gyrus (blue), and middle non-dentate hippocampus (red). The orientation of the hippocampus is such that its longest axis is horizontal to facilitate segmentation of hippocampal head, body, and tail [107, 108].](https://content.iospress.com:443/media/jad/2023/96-3/jad-96-3-jad230389/jad-96-jad230389-g008.jpg)
Postmortem MRI-guided histopathological examination
Additionally, through postmortem MRI scanning, we can investigate the histopathological substrates of age-related lesions, including pathological measures of tissue rarefaction, gliosis, and myelin and axonal density, assessed using a combination of cell counts and stain intensity of light microscopy samples as well as immunofluorescent samples. For earlier specimen that have already been cut, by identifying macroscopic landmarks, target sites on imaging can be localized and sectioned in the preserved specimen (Fig. 9).
CSVD lesions such as EPVS whose size can be just a few millimeters across can be difficult to locate during brain sectioning [55, 56], as the lesion may not be macroscopically visible to ensure accuracy. More recently, our BrainBank has adopted 3D scanning of the hemisphere to be cut in order to print a brain holder with cutting guides, allowing the co-registration of the MRI with the 3D scanned brain for precise identification of micro-lesions in the brain (Fig. 10A). With the MRI registered to be aligned with the coronal cutting plane of the brain, the exact brain slab (corresponding to a traditional y coordinate) and a slab cutting guide can be printed to cut a small block centered around the lesion to guarantee accuracy (Fig. 10C). Figure 10B shows one hyperintense lesion on T2-weighted MRI embedded within a large confluence of WMH, most likely corresponding to a small EPVS. The lesion was chosen such that it would likely to be just barely macroscopically visible for the reader to demonstrate the capacity for locating such small lesions (Fig. 10D). In turn, we seek to use the precision of the MRI guided histopathology to locate small MRI biomarkers such as EPVS and microbleeds that may not be macroscopically visible to aid in better understanding the underlying pathological processes.
Fig. 9
A) Example of image-guided histopathology with a coronal T2 slice of a posterior WMH. B, C) H&E and LFB stains of the same area respectively. Note the relative pallor of the stains in the same areas as the WMH in the MRI as well as the presence of numerous enlarged perivascular spaces on the right side of the image.
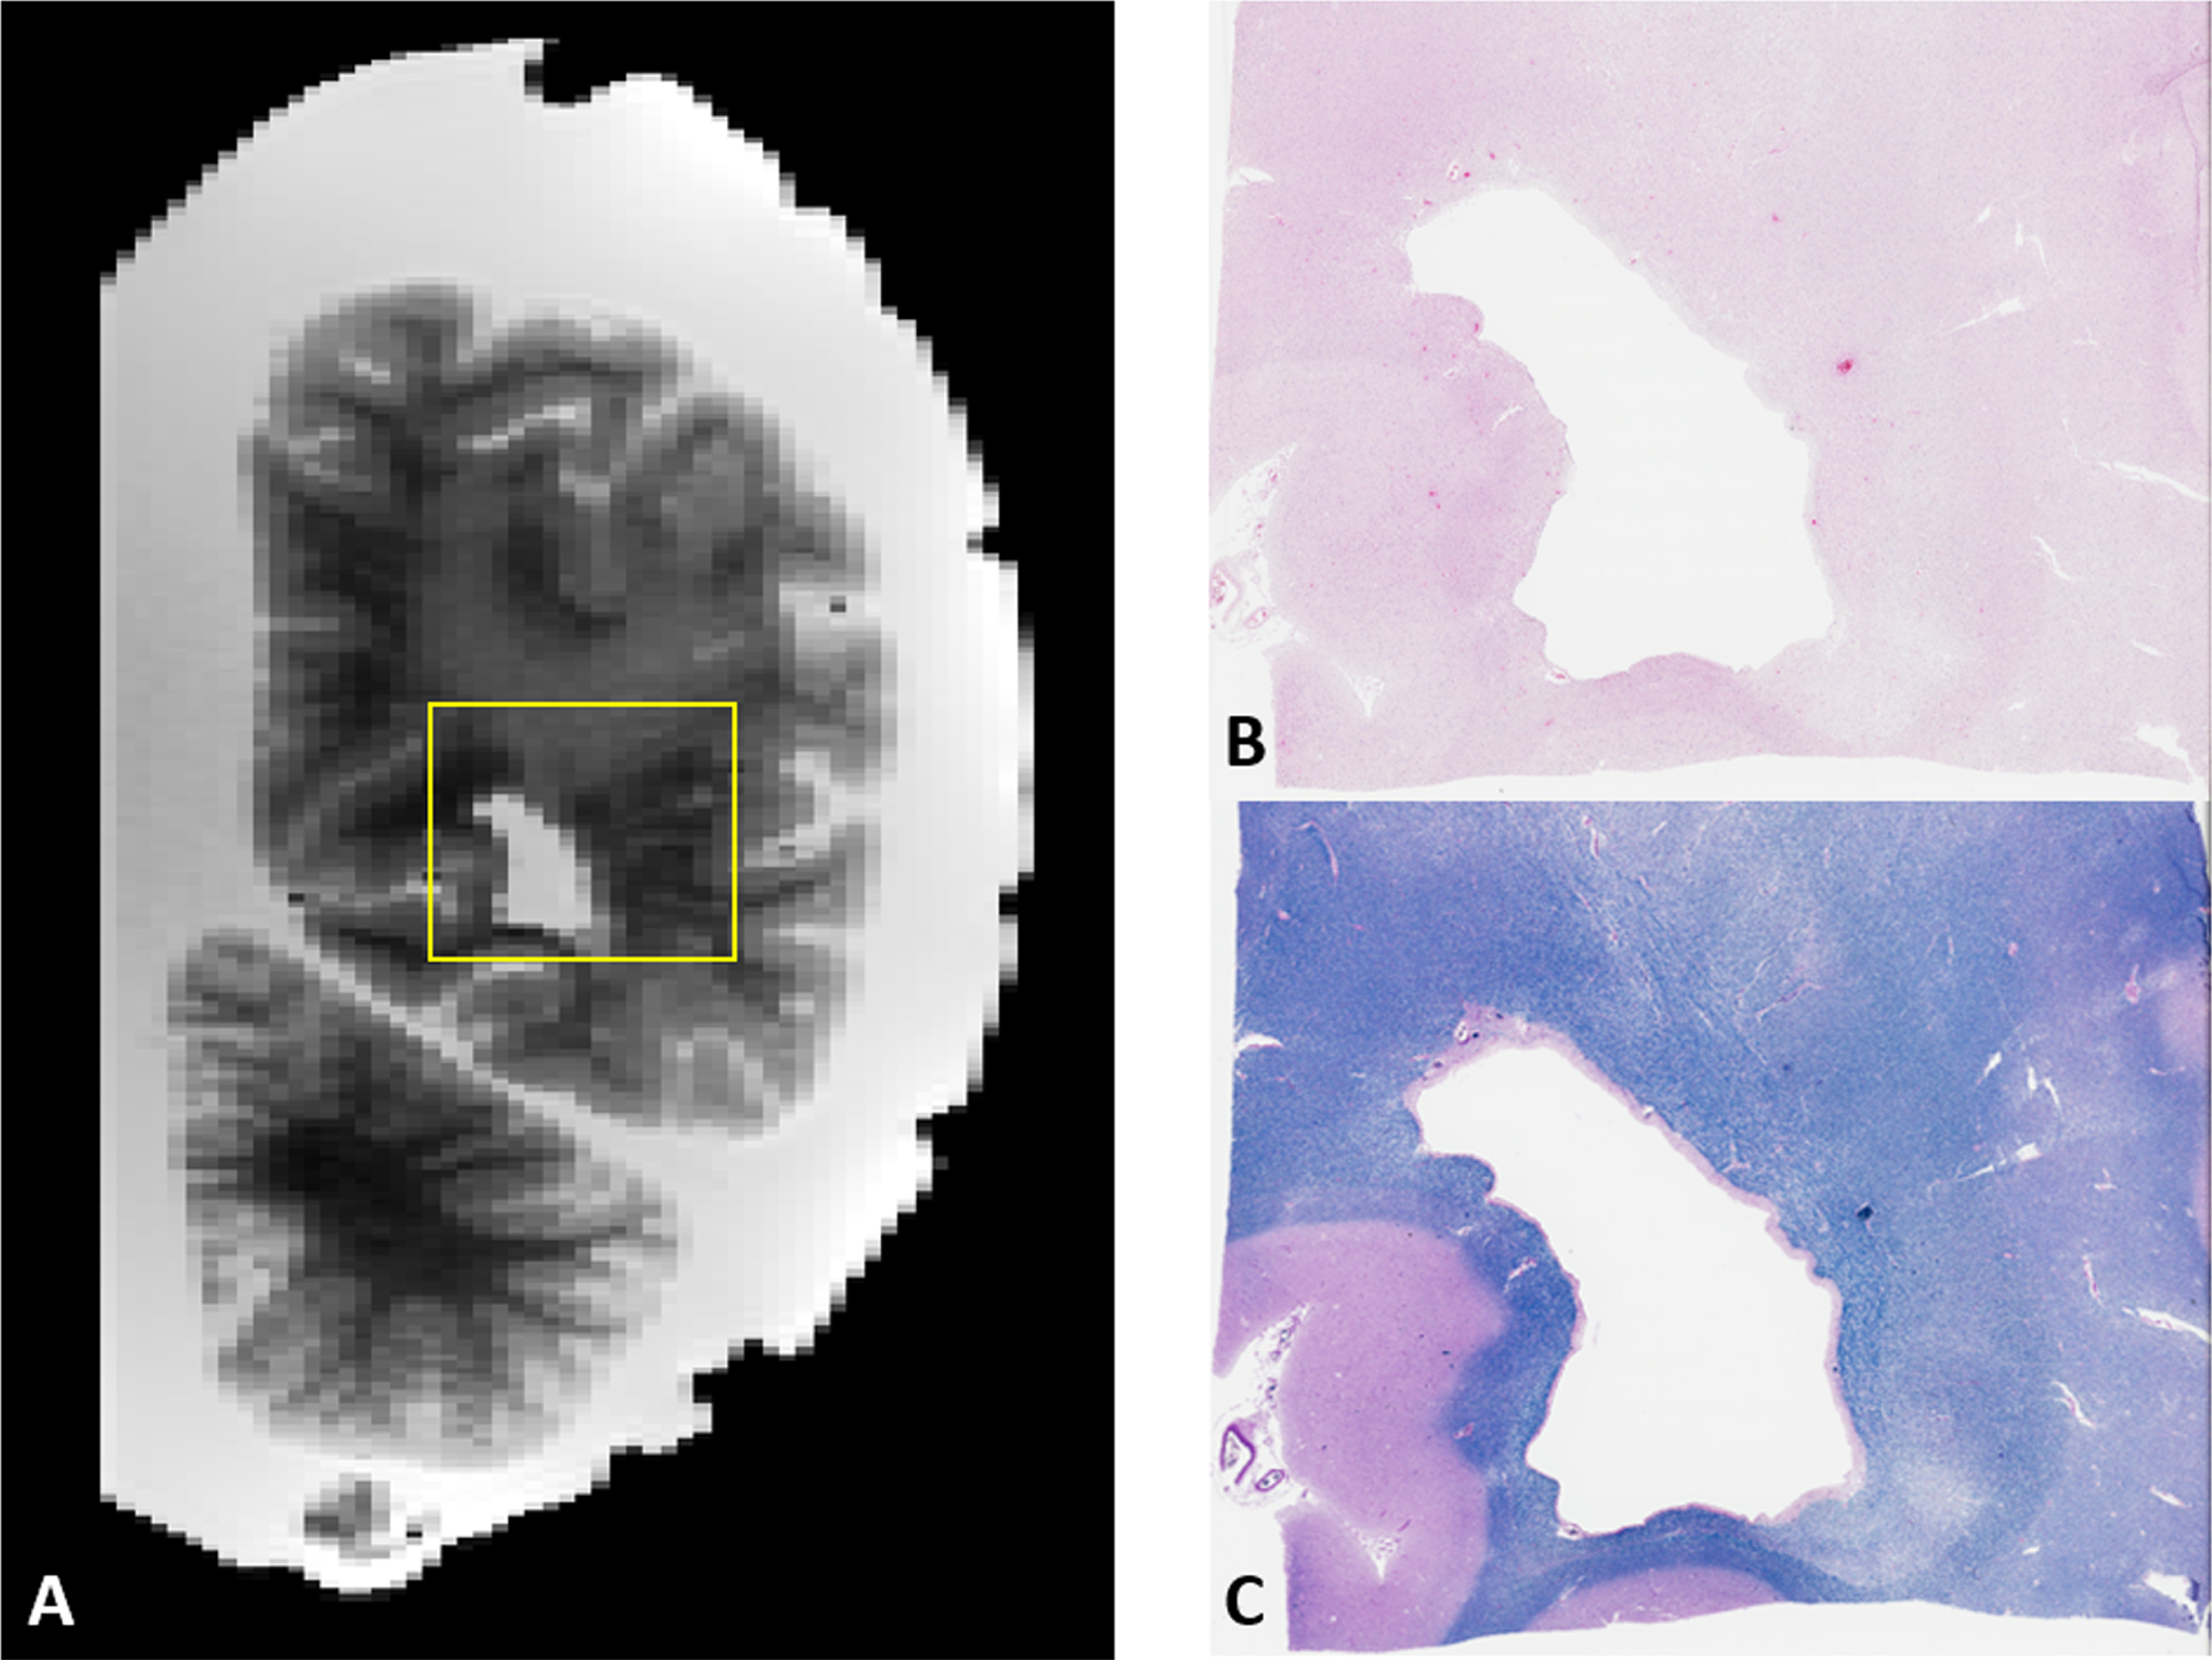
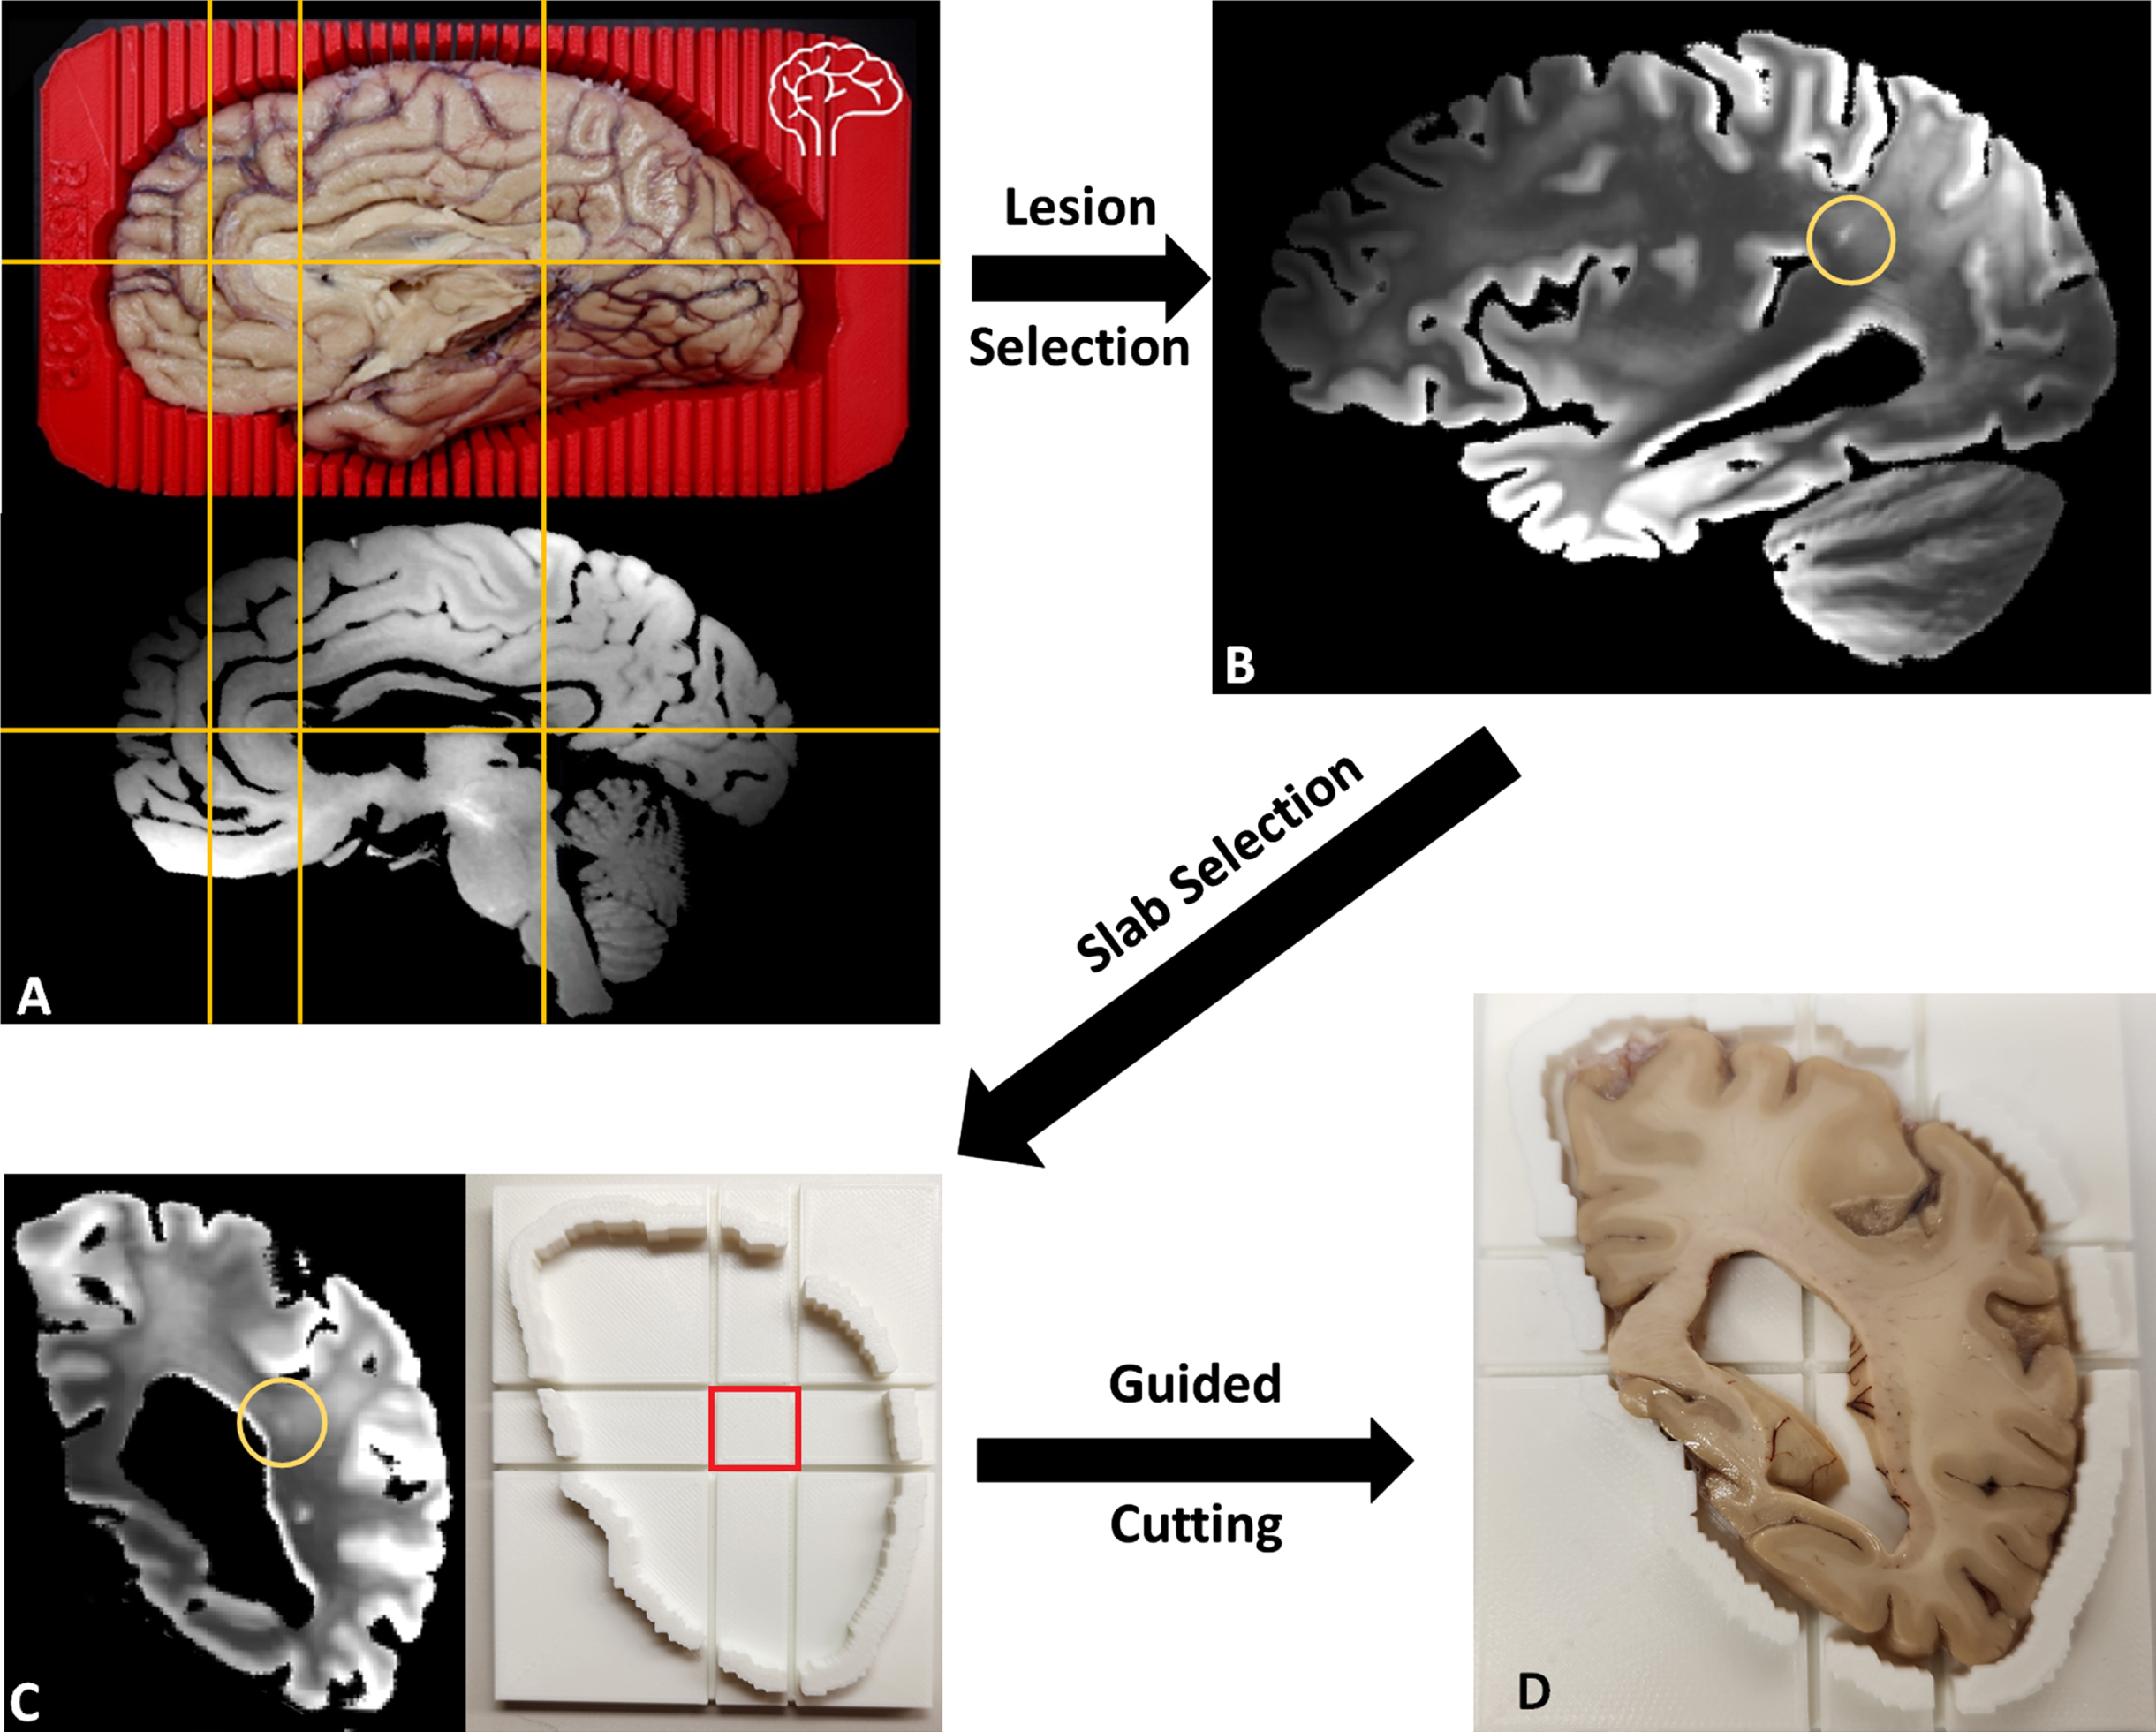
Fig. 10
A) Left cerebral hemisphere prepped for cutting inside of 3D-printed brain cutting guide created using surface scanning along with the corresponding T2 weighted MRI with fluid removed. Yellow lines included to show correspondence of MRI to actual brain. B) A lesion small to be easily missed without MR guidance was selected. C) The corresponding coronal MRI view (cutting plane) of the lesion (circled) with a slab cutting guide corresponding to the slab. D) Slab #22 of the brain fitted within the slab cutting guide with a small lesion near the center of the target block that can be sampled to examine the target lesion microscopically.
DISCUSSION
As neurologists’ understanding of the pathology underlying brain injury keeps improving [57–59] there is a growing need to investigate clinical findings on a comprehensive and representative sample. An increasing number of studies are using imaging biomarkers for the predictive modeling of neurodegenerative diseases, including the prediction of progression from MCI to AD [60, 61] and dementia risk [13, 62]. Postmortem MRI cohorts, where neuroimaging findings can be validated by pathology data will be crucial to generate and test the models. Our study aims to establish an extensive repository covering a wide range of conditions that can be shared for the validation of neuroimaging signals. Using this resource our team and any collaborators can investigate imaging biomarkers developed to reflect pathological burden related to neurodegeneration. Our repository and the processing pipelines under development to automate brain injury and lesion quantification will provide a great platform, enabling the investigation of multimodal neuroimaging and pathology data. To that end, we have been investigating the pathological correlates of a number of lesion types associated with neurodegenerative pathology.
Multi-pathology neurodegeneration
There are many challenges to developing effective biomarkers to identify neurodegenerative processes early to initiate therapies that may slow or halt disease progression. Chief among them is the multifactorial nature of neurodegeneration and the corresponding difficulty of disentangling the various potential underlying pathologies. As can be seen in Fig. 5, over half of the clinical diagnoses specifying a pathology were given as just AD, whereas pathological analysis reveals that rarely are AD neuropathological changes the sole contributor. The ability to identify the presence of concomitant neurodegenerative processes is important to the clinical picture, as multiple pathologies have synergistic effects that lowers the threshold to overt clinical dementia and increases the rate of progression of symptoms [63]. As our understanding of neurodegeneration progresses and new pathological entities such as LATE [51] are recognized, this repository can facilitate analyses incorporating new methodologies or categorizations.
White matter changes
White matter changes have been associated with the development of dementia, both in the form of WMHs and microstructural disruptions. WMH volume is significantly greater in subjects with advanced brain aging [13] and patients with MCI who progress to dementia than those with stable symptoms [64]. Regional WMH in the posterior/dorsal periventricular areas showed association with genetic risk of sporadic AD [65]. WMH in the temporal and parieto-occipital lobes are particularly associated with processing speed [66]. WMH is associated with cerebral microbleeds [67] and amyloid [68], demonstrating a complex relationship between vascular and AD lesions. Diffusion MRI has also revealed increased disruption of WM microstructure as reflected by fractional anisotropy and mean diffusivity in AD [69], FTLD [70], and LBD [71]. There are also reports of differing trajectories of WM changes in LBD compared to AD [72], with changes appearing early in LBD without significant progression while WM degeneration continuously progressed in AD, suggesting different underlying pathophysiology that will only be distinguished by jointly acquiring neuroimaging and pathology. As demonstrated in Fig. 3, the combination of signal from the T2- and T1- weighted images will enable detection of WMHs. Our postmortem protocol provides the opportunity to investigate histopathological substrates of these WM changes in future studies.
Iron deposition
Postmortem pathological analysis has also shown that iron concentration is increased in the substantia nigra of patients with LBD compared to controls or patients with AD [73]. The extent of iron deposition has also been associated with symptoms presentation in both Parkinson’s disease [74] and frontotemporal dementia [75]. Several studies have recently investigated iron deposition as a potential biomarker for neurocognitive disorders using quantitative susceptibility mapping (QSM) to identify regions of abnormal iron concentration [76–78], but these studies were either restricted to small postmortem sample sizes or lacking histopathological confirmation data. In general, QSM is a relatively new methodology that uses the MRI signal phase, a previously underutilized component of MRI, to map the magnetic susceptibility of different tissue [79–81]. As a result, this imaging protocol opening a new avenue for investigating tissue biomarkers without the need for new imaging technologies has never been deployed in large postmortem studies before. This new approach also highlights the value of large imaging and histopathology cohorts to enable retrospective analysis as new innovations appear.
Hippocampal subfields
Hippocampal subfields are another biomarker of interest for dementias. Neuroimaging studies established that hippocampus and hippocampal subfields are significantly impacted in AD and early phases of AD [82–85]. Despite their tight functional interconnection, hippocampal subfields have specialized functions. For instance, CA1 is involved in temporal pattern association and intermediate-term memory, while CA3 is responsible for spatial pattern association, detection of novelty, and short-term memory. The atrophy of the memory-related hippocampal subfields is one of the earliest macroscopic features of AD and has been reported in both autopsies and neuroimaging studies. When recent clinical studies revealed unique patterns of subfield atrophy [86], microstructural integrity [87], and pathology distribution [88] in neurodegenerative diseases, the need for an integrated systems exploiting these patterns to explain how pathology translates to clinical presentation was pointed out. Our multimodal repository will be perfectly suited to examine these questions.
Enlarged perivascular spaces
Perivascular spaces are cerebrospinal fluid-filled spaces that surround brain vessels, following their trajectories from the surface into the brain parenchyma [89]. EPVS are a relatively common neuroimaging finding with increased age [90]. However, high EPVS burden has been associated with the presence of cerebral small vessel disease (CSVD) [91–94]. Previous research has revealed relationships of EPVS with hypertension [91] and other imaging markers of CSVD, such as WMH [92], and lacunar ischemic infarcts [92, 95]. Furthermore, EPVS have been associated with cognitive impairment [96] and dementia risk [97]. It has been suggested that EPVS in different brain regions may have different pathophysiological basis and pathogenic mechanisms [98]. However, due to limitations of the previously-used manual segmentation methods, their study has been mostly limited to specific brain regions such as the basal ganglia, brainstem, and centrum semiovale [99–103]. Therefore, there are some questions regarding their clinical significance and the underlying pathophysiological mechanisms that lead to their appearance that remain unanswered. We anticipate that the combination of our previously described fully-automated algorithm [104], that allows for EPVS segmentation in the whole brain, with the detailed neuropathological data of our repository, will lead to significant insights in the field of EPVS research, and hopefully answer some of those open questions that would otherwise be difficult to explore.
Future directions
Efforts are ongoing to explore new sequences to add to our protocol in order to expand the utility of our repository. Currently, inhomogeneous magnetization transfer, which has shown excellent sensitivity for myelin content validated in mice [105, 106], is being considered as its applications move from animal models towards human imaging. New adaptations are also being tested to improve scan quality, including custom MR-compatible containers for standardization of brain orientation and to facilitate the use of gentle vacuuming to ensure bubble removal. To further bolster MR-guided histopathology, we are also exploring new protocols for more detailed scans of specific slabs to better target specific lesions that may be adjacent to or embedded within other lesions.
Conclusion
In this work, we introduce a new cohort for the study of dementias combining multimodal neuroimaging and neuropathology data: the South Texas Alzheimer’s Disease research center repository. Our brain bank contains 139 samples, and the donations are still ongoing. The significant sample size, the advanced imaging protocols employed, the diversity of MRI sequences acquired, and the tight correspondence between neuroimaging and pathology samples in this repository will provide new insights into a large variety of fundamental topics, such as the characterization of WM changes observed in dementias, the study of iron deposits, and the investigation of the processes underlying hippocampal atrophy. We hope that dedicated image processing pipelines designed to exploit the repository in its full capacity will lead to the discovery of more robust and more specific neuroimaging dementia biomarkers. Our repository will also help disentangle the effects of comorbid disorders to refine diagnosis and prognosis, with the goal of achieving accurate early diagnosis. To facilitate these efforts, we hope to share with collaborators to make full use of this repository to better understand neurodegenerative disorders.
ACKNOWLEDGMENTS
We would like to thank the many generous donors who have gracious donated their brains to our Brain Bank to make this possible. We would also like to thank everyone at the Biggs Institute for helping with collecting all the data necessary to build this repository.
FUNDING
This study was supported by the National Institutes of Health (NIH) [grant numbers: 1R01AG080821, The South Texas Alzheimer’s Disease Research Center: P30AG066546, 1U24AG074857], the San Antonio Medical Foundation (SAMF) [grant number: 1000003860].
CONFLICTS OF INTEREST
The authors have no conflict of interest to report.
DATA AVAILABILITY
The corresponding author can be contacted to discuss data sharing.
REFERENCES
[1] | Chiong W , Tsou AY , Simmons Z , Bonnie RJ , Russell JA ((2021) ) Ethical considerations in dementia diagnosis and care: AAN Position Statement. Neurology 97: , 80–89. |
[2] | Khachaturian ZS ((1985) ) Diagnosis of Alzheimer’s disease. Arch Neurol 42: , 1097–1105. |
[3] | Mirra SS , Heyman A , McKeel D , Sumi SM , Crain BJ , Brownlee LM , Vogel FS , Hughes JP , van Belle G , Berg L ((1991) ) The Consortium to Establish a Registry for Alzheimer’s Disease (CERAD). Part II. Standardization of the neuropathologic assessment of Alzheimer’s disease. Neurology 41: , 479–486. |
[4] | Mirra SS , Hart MN , Terry RD ((1993) ) Making the diagnosis of Alzheimer’s disease. A primer for practicing pathologists. Arch Pathol Lab Med 117: , 132–144. |
[5] | Hyman BT ((1997) ) The neuropathological diagnosis of Alzheimer’s disease: Clinical-pathological studies.S. Neurobiol Aging 18: , 27–32. |
[6] | Bott NT , Radke A , Stephens ML , Kramer JH ((2014) ) Frontotemporal dementia: Diagnosis, deficits and management. Neurodegener Dis Manag 4: , 439–454. |
[7] | Rizzo G , Arcuti S , Copetti M , Alessandria M , Savica R , Fontana A , Liguori R , Logroscino G ((2018) ) Accuracy of clinical diagnosis of dementia with Lewy bodies: A systematic review and meta-analysis. J Neurol Neurosurg Psychiatry 89: , 358–366. |
[8] | Welsh-Bohmer KA ((2008) ) Defining “prodromal” Alzheimer’s disease, frontotemporal dementia, and Lewy body dementia: Are we there yet? Neuropsychol Rev 18: , 70–72. |
[9] | McAleese KE , Colloby SJ , Thomas AJ , Al-Sarraj S , Ansorge O , Neal J , Roncaroli F , Love S , Francis PT , Attems J ((2021) ) Concomitant neurodegenerative pathologies contribute to the transition from mild cognitive impairment to dementia. Alzheimers Dement 17: , 1121–1133. |
[10] | White L , Small BJ , Petrovitch H , Ross GW , Masaki K , Abbott RD , Hardman J , Davis D , Nelson J , Markesbery W ((2005) ) Recent clinical-pathologic research on the causes of dementia in late life: Update from the Honolulu-Asia Aging Study. J Geriatr Psychiatry Neurol 18: , 224–227. |
[11] | Zlokovic BV ((2011) ) Neurovascular pathways to neurodegeneration in Alzheimer’s disease and other disorders. Nat Rev Neurosci 12: , 723–738. |
[12] | Toledo JB , Arnold SE , Raible K , Brettschneider J , Xie SX , Grossman M , Monsell SE , Kukull WA , Trojanowski JQ ((2013) ) Contribution of cerebrovascular disease in autopsy confirmed neurodegenerative disease cases in the National Alzheimer’s Coordinating Centre. Brain 136: , 2697–2706. |
[13] | Habes M , Janowitz D , Erus G , Toledo JB , Resnick SM , Doshi J , Van der Auwera S , Wittfeld K , Hegenscheid K , Hosten N , Biffar R , Homuth G , Völzke H , Grabe HJ , Hoffmann W , Davatzikos C ((2016) ) Advanced brain aging: Relationship with epidemiologic and genetic risk factors, and overlap with Alzheimer disease atrophy patterns.. Transl Psychiatry 6: , e775. |
[14] | Frank B , Ally M , Tripodis Y , Puzo C , Labriola C , Hurley L , Martin B , Palmisano J , Chan L , Steinberg E , Turk K , Budson A , O’Connor M , Au R , Qiu WQ , Goldstein L , Kukull W , Kowall N , Killiany R , Stern R , Stein T , McKee A , Mez J , Alosco M ((2022) ) Trajectories of cognitive decline in brain donors with autopsy-confirmed Alzheimer disease and cerebrovascular disease.. Neurology 98: , e2454–e2464 |
[15] | Kovacs GG , Milenkovic I , Wöhrer A , Höftberger R , Gelpi E , Haberler C , Hönigschnabl S , Reiner-Concin A , Heinzl H , Jungwirth S , Krampla W , Fischer P , Budka H ((2013) ) Non-Alzheimer neurodegenerative pathologies and their combinations are more frequent than commonly believed in the elderly brain: A community-based autopsy series. Acta Neuropathol 126: , 365–384 . |
[16] | Smith-Bindman R , Kwan ML , Marlow EC , Theis MK , Bolch W , Cheng SY , Bowles EJA , Duncan JR , Greenlee RT , Kushi LH , Pole JD , Rahm AK , Stout NK , Weinmann S , Miglioretti DL ((2019) ) Trends in use of medical imaging in US health care systems and in Ontario, Canada, 2000-2016. JAMA 322: , 843–856. |
[17] | Grinberg LT , Ferretti RE de L , Farfel JM , Leite R , Pasqualucci CA , Rosemberg S , Nitrini R , Saldiva PHN , Filho WJ ((2007) ) Brain bank of the Brazilian aging brain study group - a milestone reached and more than 1,600 collected brains. Cell Tissue Bank 8: , 151–162. |
[18] | Bell JE , Alafuzoff I , Al-Sarraj S , Arzberger T , Bogdanovic N , Budka H , Dexter DT , Falkai P , Ferrer I , Gelpi E , Gentleman SM , Giaccone G , Huitinga I , Ironside JW , Klioueva N , Kovacs GG , Meyronet D , Palkovits M , Parchi P , Patsouris E , Reynolds R , Riederer P , Roggendorf W , Seilhean D , Schmitt A , Schmitz P , Streichenberger N , Schwalber A , Kretzschmar H ((2008) ) Management of a twenty-first century brain bank: Experience in the BrainNet Europe consortium. Acta Neuropathol 115: , 497–507. |
[19] | Freund M , Taylor A , Ng C , Little AR ((2018) ) The NIH NeuroBioBank: Creating opportunities for human brain research. Handb Clin Neurol 150: , 41–48. |
[20] | Shepherd CE , Alvendia H , Halliday GM ((2019) ) Brain banking for research into neurodegenerative disorders and ageing. Neurosci Bull 35: , 283–288. |
[21] | Jonkman LE , Graaf YG , Bulk M , Kaaij E , Pouwels PJW , Barkhof F , Rozemuller AJM , van der Weerd L , Geurts JJG , van de Berg WDJ ((2019) ) Normal Aging Brain Collection (NABCA): A comprehensive collection of postmortem high-field imaging, neuropathological and morphometric datasets of non-neurological controls. Neuroimage Clin 22: , 101698–Amsterdam. |
[22] | Tendler BC , Hanayik T , Ansorge O , Bangerter-Christensen S , Berns GS , Bertelsen MF , Bryant KL , Foxley S , van den Heuvel MP , Howard AFD , Huszar IN , Khrapitchev AA , Leonte A , Manger PR , Menke RAL , Mollink J , Mortimer D , Pallebage-Gamarallage M , Roumazeilles L , Sallet J , Scholtens LH , Scott C , Smart A , Turner MR , Wang C , Jbabdi S , Mars RB , Miller KL ((2022) ) The Digital Brain Bank, an open access platform for post-mortem imaging datasets.. Elife 11: , e73153. |
[23] | Pfefferbaum A , Sullivan EV , Adalsteinsson E , Garrick T , Harper C ((2004) ) Postmortem MR imaging of formalin-fixed human brain. Neuroimage 21: , 1585–1595. |
[24] | Magnotta VA , Friedman L ((2006) ) Measurement of signal-to-noise and contrast-to-noise in the fBIRN multicenter imaging study. J Digit Imaging 19: , 140–147. |
[25] | Avants BB , Tustison NJ , Wu J , Cook PA , Gee JC ((2011) ) An open source multivariate framework for n-tissue segmentation with evaluation on public data. Neuroinformatics 9: , 381–400. |
[26] | Tustison NJ , Avants BB , Cook PA , Zheng Y , Egan A , Yushkevich PA , Gee JC ((2010) ) N4ITK: Improved N3 bias correction. IEEE Trans Med Imaging 29: , 1310–1320. |
[27] | Jenkinson M , Beckmann CF , Behrens TEJ , Woolrich MW , Smith SM ((2012) ) FSL. Neuroimage 62: , 782–790. |
[28] | Haacke EM , Xu Y , Cheng Y-CN , Reichenbach JR ((2004) ) Susceptibility weighted imaging (SWI). Magn Reson Med 52: , 612–618. |
[29] | Haacke EM , Mittal S , Wu Z , Neelavalli J , Cheng Y-CN ((2009) ) Susceptibility-weighted imaging: Technical aspects and clinical applications, part 1. AJNR Am J Neuroradiol 30: , 19–30. |
[30] | Noll DC , Nishimura DG , Macovski A ((1991) ) Homodyne detection in magnetic resonance imaging. IEEE Trans Med Imaging 10: , 154–163. |
[31] | Wang Y , Liu T ((2015) ) Quantitative susceptibility mapping (QSM): Decoding MRI data for a tissue magnetic biomarker. Magn Reson Med 73: , 82–101. |
[32] | Liu J , Liu T , de Rochefort L , Ledoux J , Khalidov I , Chen W , Tsiouris AJ , Wisnieff C , Spincemaille P , Prince MR , Wang Y ((2012) ) Morphology enabled dipole inversion for quantitative susceptibility mapping using structural consistency between the magnitude image and the susceptibility map. Neuroimage 59: , 2560–2568. |
[33] | Liu T , Khalidov I , de Rochefort L , Spincemaille P , Liu J , Tsiouris AJ , Wang Y ((2011) ) A novel background field removal method for MRI using projection onto dipole fields (PDF). NMR Biomed 24: , 1129–1136. |
[34] | Liu Z , Spincemaille P , Yao Y , Zhang Y , Wang Y ((2018) ) MEDI+0: Morphology enabled dipole inversion with automatic uniform cerebrospinal fluid zero reference for quantitative susceptibility mapping. Magn Reson Med 79: , 2795–2803. |
[35] | Montine TJ , Phelps CH , Beach TG , Bigio EH , Cairns NJ , Dickson DW , Duyckaerts C , Frosch MP , Masliah E , Mirra SS , Nelson PT , Schneider JA , Thal DR , Trojanowski JQ , Vinters HV , Hyman BT ((2012) ) National Institute on Aging-Alzheimer’s Association guidelines for the neuropathologic assessment of Alzheimer’s disease: A practical approach. Acta Neuropathol 123: , 1–11. |
[36] | Fukutani Y , Cairns NJ , Shiozawa M , Sasaki K , Sudo S , Isaki K , Lantos PL ((2000) ) Neuronal loss and neurofibrillary degeneration in the hippocampal cortex in late-onset sporadic Alzheimer’s disease. Psychiatry Clin Neurosci 54: , 523–529. |
[37] | Sun A , Nguyen XV , Bing G ((2002) ) Comparative analysis of an improved thioflavin-s stain, Gallyas silver stain, and immunohistochemistry for neurofibrillary tangle demonstration on the same sections. J Histochem Cytochem 50: , 463–472. |
[38] | Goedert M , Jakes R , Vanmechelen E ((1995) ) Monoclonal antibody AT8 recognises tau protein phosphorylated at both serine 202 and threonine 205. Neurosci Lett 189: , 167–169. |
[39] | Hatami A , Monjazeb S , Glabe C ((2016) ) The anti-amyloid-β monoclonal antibody 4G8 recognizes a generic sequence-independent epitope associated with α-synuclein and islet amyloid polypeptide amyloid fibrils. J Alzheimers Dis 50: , 517–525. |
[40] | Biffi A , Greenberg SM ((2011) ) Cerebral amyloid angiopathy: A systematic review. J Clin Neurol 7: , 1–9. |
[41] | Kalaria RN , Kenny RA , Ballard CG , Perry R , Ince P , Polvikoski T ((2004) ) Towards defining the neuropathological substrates of vascular dementia. J Neurol Sci 226: , 75–80. |
[42] | McCann H , Stevens CH , Cartwright H , Halliday GM ((2014) ) α-Synucleinopathy phenotypes.S. Parkinsonism Relat Disord 20: (Suppl 1), 62–67. |
[43] | Mackenzie IRA , Baborie A , Pickering-Brown S , Du Plessis D , Jaros E , Perry RH , Neary D , Snowden JS , Mann DMA ((2006) ) Heterogeneity of ubiquitin pathology in frontotemporal lobar degeneration: Classification and relation to clinical phenotype. Acta Neuropathol 112: , 539–549. |
[44] | Mackenzie IRA , Neumann M ((2017) ) Fused in sma neuropathology in neurodegenerative disease.a. Cold Spring Harb Perspect Med 7: , 024299–arco. |
[45] | Didonna A , Opal P ((2019) ) The role of neurofilament aggregation in neurodegeneration: Lessons from rare inherited neurological disorders. Mol Neurodegener 14: , 19. |
[46] | Thal DR , Rüb U , Orantes M , Braak H ((2002) ) Phases of A beta-deposition in the human brain and its relevance for the development of AD. Neurology 58: , 1791–1800. |
[47] | Braak H , Braak E ((1991) ) Neuropathological stageing of Alzheimer-related changes. Acta Neuropathol 82: , 239–259. |
[48] | Adler CH , Beach TG , Zhang N , Shill HA , Driver-Dunckley E , Caviness JN , Mehta SH , Sabbagh MN , Serrano GE , Sue LI , Belden CM , Powell J , Jacobson SA , Zamrini E , Shprecher D , Davis KJ , Dugger BN , Hentz JG ((2019) ) Unified staging system for Lewy body disorders: Clinicopathologic correlations and comparison to Braak staging. J Neuropathol Exp Neurol 78: , 891–899 . |
[49] | Dickson DW , Kouri N , Murray ME , Josephs KA ((2011) ) Neuropathology of frontotemporal lobar degeneration-tau (FTLD-tau). J Mol Neurosci 45: , 384–389. |
[50] | Lee EB , Porta S , Michael Baer G , Xu Y , Suh E , Kwong LK , Elman L , Grossman M , Lee VM-Y , Irwin DJ , Van Deerlin VM , Trojanowski JQ ((2017) ) Expansion of the classification of FTLD-TDP: Distinct pathology associated with rapidly progressive frontotemporal degeneration. Acta Neuropathol 134: , 65–78. |
[51] | Nelson PT , Dickson DW , Trojanowski JQ , Jack CR , Boyle PA , Arfanakis K , Rademakers R , Alafuzoff I , Attems J , Brayne C , Coyle-Gilchrist ITS , Chui HC , Fardo DW , Flanagan ME , Halliday G , Hokkanen SRK , Hunter S , Jicha GA , Katsumata Y , Kawas CH , Keene CD , Kovacs GG , Kukull WA , Levey AI , Makkinejad N , Montine TJ , Murayama S , Murray ME , Nag S , Rissman RA , Seeley WW , Sperling RA , White CL 3rd , Yu L , Schneider JA ((2019) ) Limbic-predominant age-related TDP-43 encephalopathy (LATE): Consensus working group report. Brain 142: , 1503–1527. |
[52] | Saito Y , Ruberu NN , Sawabe M , Arai T , Tanaka N , Kakuta Y , Yamanouchi H , Murayama S ((2004) ) Staging of argyrophilic grains: An age-associated tauopathy. J Neuropathol Exp Neurol 63: , 911–918. |
[53] | Skrobot OA , Attems J , Esiri M , Hortobágyi T , Ironside JW , Kalaria RN , King A , Lammie GA , Mann D , Neal J , Ben-Shlomo Y , Kehoe PG , Love S ((2016) ) Vascular cognitive impairment neuropathology guidelines (VCING): The contribution of cerebrovascular pathology to cognitive impairment. Brain 139: , 2957–2969. |
[54] | Fazekas F , Barkhof F , Wahlund LO , Pantoni L , Erkinjuntti T , Scheltens P , Schmidt R ((2002) ) CT and MRI rating of white matter lesions. Cerebrovasc Dis 13: (Suppl 2), 31–36. |
[55] | Luciano NJ , Sati P , Nair G , Guy JR , Ha SK , Absinta M , Chiang WY , Leibovitch EC , Jacobson S , Silva AC , Reich DS (2016) Utilizing 3D printing technology to merge MRI with histology: A protocol for brain sectioning. J Vis Exp, 54780. |
[56] | Baldi D , Aiello M , Duggento A , Salvatore M , Cavaliere C ((2019) ) MR imaging-histology correlation by tailored 3D-printed slicer in oncological assessment. Contrast Media Mol Imaging 2019: , 1071453. |
[57] | Nabuurs RJA , Natté R , de Ronde FM , Hegeman-Kleinn I , Dijkstra J , van Duinen SG , Webb AG , Rozemuller AJ , van Buchem MA , van der Weerd L ((2013) ) MR microscopy of human amyloid-β deposits: Characterization of parenchymal amyloid, diffuse plaques, and vascular amyloid. J Alzheimers Dis 34: , 1037–1049. |
[58] | Jonkman LE , Klaver R , Fleysher L , Inglese M , Geurts JJ ((2016) ) The substrate of increased cortical FA in MS: A 7T post-mortem MRI and histopathology study. Mult Scler 22: , 1804–1811. |
[59] | Bulk M , Abdelmoula WM , Nabuurs RJA , van der Graaf LM , Mulders CWH , Mulder AA , Jost CR , Koster AJ , van Buchem MA , Natté R , Dijkstra J , van der Weerd L ((2018) ) Postmortem MRI and histology demonstrate differential iron accumulation and cortical myelin organization in early- and late-onset Alzheimer’s disease. Neurobiol Aging 62: , 231–242. |
[60] | Li H , Habes M , Wolk DA , Fan Y ((2019) ) A deep learning model for early prediction of Alzheimer’s disease dementia based on hippocampal magnetic resonance imaging data. Alzheimers Dement 15: , 1059–1070. |
[61] | Mak E , Dounavi M-E , Low A , Carter SF , McKiernan E , Williams GB , Jones PS , Carriere I , Muniz GT , Ritchie K , Ritchie C , Su L , O’Brien JT ((2021) ) Proximity to dementia onset and multi-modal neuroimaging changes: The prevent-dementia study. Neuroimage 229: , 117749. |
[62] | Wang J , Knol MJ , Tiulpin A , Dubost F , de Bruijne M , Vernooij MW , Adams HHH , Ikram MA , Niessen WJ , Roshchupkin GV ((2019) ) Gray matter age prediction as a biomarker for risk of dementia. Proc Natl Acad Sci U S A 116: , 21213–21218. |
[63] | Kapasi A , DeCarli C , Schneider JA ((2017) ) Impact of multiple pathologies on the threshold for clinically overt dementia. Acta Neuropathol 134: , 171–186. |
[64] | Dadar M , Maranzano J , Ducharme S , Collins DL ((2019) ) White matter in different regions evolves differently during progression to dementia. Neurobiol Aging 76: , 71–79. |
[65] | Habes M , Sotiras A , Erus G , Toledo JB , Janowitz D , Wolk DA , Shou H , Bryan NR , Doshi J , Völzke H , Schminke U , Hoffmann W , Resnick SM , Grabe HJ , Davatzikos C ((2018) ) White matter lesions: Spatial heterogeneity, links to risk factors, cognition, genetics, and atrophy.. Neurology 91: , e964–e975. |
[66] | Kaskikallio A , Karrasch M , Koikkalainen J , Lötjönen J , Rinne JO , Tuokkola T , Parkkola R , Grönholm-Nyman P ((2019) ) White matter hyperintensities and cognitive impairment in healthy and pathological aging: A quantified brain MRI study. Dement Geriatr Cogn Disord 48: , 297–307. |
[67] | Balestrieri A , Lucatelli P , Suri HS , Montisci R , Suri JS , Wintermark M , Serra A , Cheng X , Jinliang C , Sanfilippo R , Saba L ((2021) ) Volume of white matter hyperintensities, and cerebral micro-bleeds. J Stroke Cerebrovasc Dis 30: , 105905. |
[68] | Habes M , Pomponio R , Shou H , Doshi J , Mamourian E , Erus G , Nasrallah I , Launer LJ , Rashid T , Bilgel M , Fan Y , Toledo JB , Yaffe K , Sotiras A , Srinivasan D , Espeland M , Masters C , Maruff P , Fripp J , Völzk H , Johnson SC , Morris JC , Albert MS , Miller MI , Bryan RN , Grabe HJ , Resnick SM , Wolk DA , Davatzikos C ((2021) ) The Brain Chart of Aging: Machine-learning analytics reveals links between brain aging, white matter disease, amyloid burden, and cognition in the iSTAGING consortium of 10,216 harmonized MR scans. Alzheimers Dement 17: , 89–102. |
[69] | Harrison JR , Bhatia S , Tan ZX , Mirza-Davies A , Benkert H , Tax CMW , Jones DK ((2020) ) Imaging Alzheimer’s genetic risk using diffusion MRI: A systematic review. Neuroimage Clin 27: , 102359. |
[70] | Mahoney CJ , Simpson IJA , Nicholas JM , Fletcher PD , Downey LE , Golden HL , Clark CN , Schmitz N , Rohrer JD , Schott JM , Zhang H , Ourselin S , Warren JD , Fox NC ((2015) ) Longitudinal diffusion tensor imaging in frontotemporal dementia. Ann Neurol 77: , 33–46. |
[71] | Delli Pizzi S , Franciotti R , Taylor J-P , Esposito R , Tartaro A , Thomas A , Onofrj M , Bonanni L ((2015) ) Structural connectivity is differently altered in dementia with Lewy body and Alzheimer’s disease. Front Aging Neurosci 7: , 208. |
[72] | Firbank MJ , Watson R , Mak E , Aribisala B , Barber R , Colloby SJ , He J , Blamire AM , O’Brien JT ((2016) ) Longitudinal diffusion tensor imaging in dementia with Lewy bodies and Alzheimer’s disease. Parkinsonism Relat Disord 24: , 76–80. |
[73] | Fernández B , Ferrer I , Gil F , Hilfiker S ((2017) ) Biomonitorization of iron accumulation in the substantia nigra from Lewy body disease patients. Toxicol Rep 4: , 188–193. |
[74] | Thomas GEC , Leyland LA , Schrag A-E , Lees AJ , Acosta-Cabronero J , Weil RS ((2020) ) Brain iron deposition is linked with cognitive severity in Parkinson’s disease. J Neurol Neurosurg Psychiatry 91: , 418–425. |
[75] | Sheelakumari R , Kesavadas C , Varghese T , Sreedharan RM , Thomas B , Verghese J , Mathuranath PS ((2017) ) Assessment of iron deposition in the brain in frontotemporal dementia and its correlation with behavioral traits. AJNR Am J Neuroradiol 38: , 1953–1958. |
[76] | Tiepolt S , Schäfer A , Rullmann M , Roggenhofer E , Gertz H-J , Schroeter ML , Patt M , Bazin P-L , Jochimsen TH , Turner R , Sabri O , Barthel H ((2018) ) Quantitative susceptibility mapping of amyloid-β aggregates in Alzheimer’s disease with 7T MR. J Alzheimers Dis 64: , 393–404. |
[77] | Chen Q , Boeve BF , Forghanian-Arani A , Senjem ML , Jack CRJ , Przybelski SA , Lesnick TG , Kremers WK , Fields JA , Schwarz CG , Gunter JL , Trzasko JD , Graff-Radford J , Savica R , Knopman DS , Dickson DW , Ferman TJ , Graff-Radford N , Petersen RC , Kantarci K ((2021) ) MRI quantitative susceptibility mapping of the substantia nigra as an early biomarker for Lewy body disease. J Neuroimaging 31: , 1020–1027. |
[78] | Cogswell PM , Wiste HJ , Senjem ML , Gunter JL , Weigand SD , Schwarz CG , Arani A , Therneau TM , Lowe VJ , Knopman DS , Botha H , Graff-Radford J , Jones DT , Kantarci K , Vemuri P , Boeve BF , Mielke MM , Petersen RC , Jack CRJ ((2021) ) Associations of quantitative susceptibility mapping with Alzheimer’s disease clinical and imaging markers. Neuroimage 224: , 117433. |
[79] | Li L ((2001) ) Magnetic susceptibility quantification for arbitrarily shaped objects in inhomogeneous fields. Magn Reson Med 46: , 907–916. |
[80] | Shmueli K , de Zwart JA , van Gelderen P , Li T-Q , Dodd SJ , Duyn JH ((2009) ) Magnetic susceptibility mapping of brain tissue} using MRI phase data. Magn Reson Med 62: , 1510–1522. |
[81] | Liu C , Li W , Tong KA , Yeom KW , Kuzminski S ((2015) ) Susceptibility-weighted imaging and quantitative susceptibility mapping in the brain. J Magn Reson Imaging 42: , 23–41. |
[82] | Fellgiebel A , Yakushev I ((2011) ) Diffusion tensor imaging of the hippocampus in MCI and early Alzheimer’s disease. J Alzheimers Dis 26: (Suppl 3), 257–262. |
[83] | de Flores R , La Joie R , Chételat G ((2015) ) Structural imaging of hippocampal subfields in healthy aging and Alzheimer’s disease. Neuroscience 309: , 29–50. |
[84] | Sørensen L , Igel C , Liv Hansen N , Osler M , Lauritzen M , Rostrup E , Nielsen M ((2016) ) Early detection of Alzheimer’s disease using MRI hippocampal texture. Hum Brain Mapp 37: , 1148–1161. |
[85] | Zhao W , Wang X , Yin C , He M , Li S , Han Y ((2019) ) Trajectories of the hippocampal subfields atrophy in the Alzheimer’s disease: A structural imaging study. Front Neuroinform 13: , 13. |
[86] | Bocchetta M , Iglesias JE , Scelsi MA , Cash DM , Cardoso MJ , Modat M , Altmann A , Ourselin S , Warren JD , Rohrer JD ((2018) ) Hippocampal subfield volumetry: Differential pattern of atrophy in different forms of genetic frontotemporal dementia. J Alzheimers Dis 64: , 497–504. |
[87] | Shahid SS , Wen Q , Risacher SL , Farlow MR , Unverzagt FW , Apostolova LG , Foroud TM , Zetterberg H , Blennow K , Saykin AJ , Wu YC ((2022) ) Hippocampal-subfield microstructures and their relation to plasma biomarkers in Alzheimer’s disease. Brain 145: , 2149–2160. |
[88] | Coughlin DG , Ittyerah R , Peterson C , Phillips JS , Miller S , Rascovsky K , Weintraub D , Siderowf AD , Duda JE , Hurtig HI , Wolk DA , McMillan CT , Yushkevich PA , Grossman M , Lee EB , Trojanowski JQ , Irwin DJ ((2020) ) Hippocampal subfield pathologic burden in Lewy body diseases vs. Alzheimer’s disease. Neuropathol Appl Neurobiol 46: , 707–721. |
[89] | Wardlaw JM , Smith EE , Biessels GJ , Cordonnier C , Fazekas F , Frayne R , Lindley RI , O’Brien JT , Barkhof F , Benavente OR , Black SE , Brayne C , Breteler M , Chabriat H , Decarli C , de Leeuw F-E , Doubal F , Duering M , Fox NC , Greenberg S , Hachinski V , Kilimann I , Mok V , Oostenbrugge R van , Pantoni L , Speck O , Stephan BCM , Teipel S , Viswanathan A , Werring D , Chen C , Smith C , van Buchem M , Norrving B , Gorelick PB , Dichgans M ((2013) ) Neuroimaging standards for research into small vessel disease and its contribution to ageing and neurodegeneration. Lancet Neurol 12: , 822–838. |
[90] | Laveskog A , Wang R , Bronge L , Wahlund L-O , Qiu C ((2018) ) Perivascular spaces in old age: Assessment, distribution, and correlation with white matter hyperintensities. AJNR Am J Neuroradiol 39: , 70–76. |
[91] | Zhu Y-C , Dufouil C , Mazoyer B , Soumaré A , Ricolfi F , Tzourio C , Chabriat H ((2011) ) Frequency and location of dilated Virchow-Robin spaces in elderly people: A population-based 3D MR imaging study. AJNR Am J Neuroradiol 32: , 709–713. |
[92] | Doubal FN , MacLullich AMJ , Ferguson KJ , Dennis MS , Wardlaw JM ((2010) ) Enlarged perivascular spaces on MRI are a feature of cerebral small vessel disease. Stroke 41: , 450–454. |
[93] | Potter GM , Doubal FN , Jackson CA , Chappell FM , Sudlow CL , Dennis MS , Wardlaw JM ((2015) ) Enlarged perivascular spaces and cerebral small vessel disease. Int J Stroke 10: , 376–381. |
[94] | Francis F , Ballerini L , Wardlaw JM ((2019) ) Perivascular spaces and their associations with risk factors, clinical disorders and neuroimaging features: A systematic review and meta-analysis. Int J Stroke 14: , 359–371. |
[95] | Ohba H , Pearce L , Potter G , Benavente O ((2012) ) Enlarged perivascular spaces in lacunar stroke patients. The Secondary Prevention of Small Subcortical Stroked (SPS3) trial.. Stroke Conf 43: , A151. |
[96] | Jie W , Lin G , Liu Z , Zhou H , Lin L , Liang G , Ou M , Lin M ((2020) ) The relationship between enlarged perivascular spaces and cognitive function: A meta-analysis of observational studies. Front Pharmacol 11: , 715. |
[97] | Paradise M , Crawford JD , Lam BCP , Wen W , Kochan NA , Makkar S , Dawes L , Trollor J , Draper B , Brodaty H , Sachdev PS ((2021) ) Association of dilated perivascular spaces with cognitive decline and incident dementia.. Neurology 96: , e1501–e1511. |
[98] | Yu L , Hu X , Li H , Zhao Y ((2022) ) Perivascular spaces, glymphatic system and MR. Front Neurol 13: , 844938. |
[99] | Burnett MS , Witte RJ , Ahlskog JE ((2014) ) Swiss cheese striatum: Clinical implications. JAMA Neurol 71: , 735–741. |
[100] | Cai K , Tain R , Das S , Damen FC , Sui Y , Valyi-Nagy T , Elliott MA , Zhou XJ ((2015) ) The feasibility of quantitative MRI of perivascular spaces at 7T. J Neurosci Methods 256: , 151–156. |
[101] | Potter GM , Chappell FM , Morris Z , Wardlaw JM ((2015) ) Cerebral perivascular spaces visible on magnetic resonance imaging: Development of a qualitative rating scale and its observer reliability. Cerebrovasc Dis 39: , 224–231. |
[102] | Shams S , Martola J , Charidimou A , Larvie M , Granberg T , Shams M , Kristoffersen-Wiberg M , Wahlund L-O ((2017) ) Topography and determinants of magnetic resonance imaging (MRI)-visible perivascular spaces in a large memory clinic cohort. J Am Heart Assoc 6: , e006279. |
[103] | Banerjee G , Kim HJ , Fox Z , Jäger HR , Wilson D , Charidimou A , Na HK , Na DL , Seo SW , Werring DJ ((2017) ) MRI-visible perivascular space location is associated with Alzheimer’s disease independently of amyloid burden. Brain 140: , 1107–1116. |
[104] | Rashid T , Liu H , Ware JB , Li K , Romero JR , Fadaee E , Nasrallah IM , Hilal S , Bryan RN , Hughes TM , Davatzikos C , Launer L , Seshadri S , Heckbert SR , Habes M ((2023) ) Deep learning based detection of enlarged perivascular spaces on brain MRI. Neuroimage Rep 3: , 100162. |
[105] | Duhamel G , Prevost VH , Cayre M , Hertanu A , Mchinda S , Carvalho VN , Varma G , Durbec P , Alsop DC , Girard OM ((2019) ) Validating the sensitivity of inhomogeneous magnetization transfer (ihMT) MRI to myelin with fluorescence microscopy. Neuroimage 199: , 289–303. |
[106] | Hertanu A , Soustelle L , Buron J , Le Priellec J , Cayre M , Le Troter A , Prevost VH , Ranjeva J-P , Varma G , Alsop DC , Durbec P , Girard OM , Duhamel G ((2023) ) Inhomogeneous Magnetization Transfer (ihMT) imaging in the acute cuprizone mouse model of demyelination/remyelination. Neuroimage 265: , 119785. |
[107] | Bernasconi N , Bernasconi A , Caramanos Z , Antel SB , Andermann F , Arnold DL ((2003) ) Mesial temporal damage in temporal lobe epilepsy: A volumetric MRI study of the hippocampus, amygdala and parahippocampal region. Brain 126: , 462–469. |
[108] | Chen KHM , Chuah LYM , Sim SKY , Chee MWL ((2010) ) Hippocampal region-specific contributions to memory performance in normal elderly. Brain Cogn 72: , 400–407. |


